Article

Atmospheric Methane Consumption and Methanotroph Communities in West Siberian Boreal Upland Forest Ecosystems

by
Aleksandr F. Sabrekov
1,2,
Olga V. Danilova
3,
Irina E. Terentieva
1,2,
Anastasia A. Ivanova
3,
Svetlana E. Belova
3,
Yuri V. Litti
1,3,
Mikhail V. Glagolev
1,2,4 and
Svetlana N. Dedysh
3,*
1
A.N. Severtsov Institute of Ecology and Evolution, Russian Academy of Sciences, 119071 Moscow, Russia
2
UNESCO Department “Environmental Dynamics and Global Climate Changes”, Ugra State University, 628012 Khanty-Mansiysk, Russia
3
Winogradsky Institute of Microbiology, Research Center of Biotechnology of the Russian Academy of Sciences, 119071 Moscow, Russia
4
Faculty of Soil Science, Moscow State University, 119992 Moscow, Russia
*
Author to whom correspondence should be addressed.
Forests 2021, 12(12), 1738; https://doi.org/10.3390/f12121738
Submission received: 13 November 2021 / Revised: 6 December 2021 / Accepted: 7 December 2021 / Published: 9 December 2021
(This article belongs to the Special Issue Microbial Cycling of Trace Greenhouse Gases in Forest Soils)

Abstract

:
Upland forest ecosystems are recognized as net sinks for atmospheric methane (CH4), one of the most impactful greenhouse gases. Biological methane uptake in these ecosystems occurs due to the activity of aerobic methanotrophic bacteria. Russia hosts one-fifth of the global forest area, with the most extensive forest landscapes located in West Siberia. Here, we report seasonal CH4 flux measurements conducted in 2018 in three types of stands in West Siberian middle taiga–Siberian pine, Aspen, and mixed forests. High rates of methane uptake of up to −0.184 mg CH4 m−2 h−1 were measured by a static chamber method, with an estimated total growing season consumption of 4.5 ± 0.5 kg CH4 ha−1. Forest type had little to no effect on methane fluxes within each season. Soil methane oxidation rate ranged from 0 to 8.1 ng CH4 gDW−1 h−1 and was negatively related to water-filled pore space. The microbial soil communities were dominated by the Alpha- and Gammaproteobacteria, Acidobacteriota and Actinobacteriota. The major group of 16S rRNA gene reads from methanotrophs belonged to uncultivated Beijerinckiaceae bacteria. Molecular identification of methanotrophs based on retrieval of the pmoA gene confirmed that Upland Soil Cluster Alpha was the major bacterial group responsible for CH4 oxidation.

Graphical Abstract

1. Introduction

Atmospheric level of methane, the second most important greenhouse gas after CO2, started to rise actively after a period of no growth in 2000–2006 [1,2,3]. The attribution of this trend to particular sources and sinks is still an unresolved issue for the scientific community. The most likely explanation is a combination of processes related to different components of the global methane budget [1]. Consumption in upland soils is one of these components and the only biological methane sink estimated in a range of 20–40 Tg yr−1 [2]. Recent top-down inventories suggested that a decreasing trend in soil methane uptake may partly explain the post-2006 renewed growth of atmospheric CH4 and simultaneous decrease in the ratio of stable carbon isotopes of CH4 (13C/12C) [4]. Thus, reducing uncertainty in soil methane consumption is important for understanding atmospheric global methane trends and future climate prediction.
Forest soils consume methane actively, accounting for 60% of the total sink by upland soils [5,6,7]. However, little research has focused on extensive forest areas of Russia; the country hosts 20% of global forests [8]. We found only a small number of studies providing data on soil consumption in small-leaved forests [9,10], broad-leaved forests [10,11,12], planted mixed forests [13], forest–tundra ecosystem [14], and light [15] and dark coniferous forests [16,17]. Several studies were focused on assessing methane emissions from Russian forests [18,19,20]. Thus, despite accounting for 80% of Russian forests [8], the taiga biome was mostly ignored. Recent global reviews lack data on both methane emission and consumption in Russian boreal forests [21,22].
Deforestation and wildfires drive forest changes in Russian taiga [23]. Forest fires create habitat mosaics of various ages and stages of regeneration and change the species mix, habitat structure, and biodiversity [24]. Small-leaved forests—the second stage of the succession—have formed dense stands a decade after the clear-cut [25]. The oil and gas industries, population growth, and climate change-induced droughts have increased the frequency of wildfires and harvested forest areas in taiga from the middle of the 20th century [24]. Petroleum exploration corridors (seismic lines)—ubiquitous in hydrocarbon-rich regions as West Siberia—disturb forest environments, affecting the biodiversity and habitat structure through edge effects [26]. The combination of natural and anthropogenic processes formed the modern taiga as a mixture of intact mature and over-mature coniferous stands (where fires are rare, e.g., between wetlands and rivers), small-leaved forests at disturbed areas, and mixed stands [24].
Exploring ecosystem-specific environmental controls of soil methane uptake is a crucial step to predict and manage its potential changes under global warming [22]. However, high CH4 flux variability on both different spatial and temporal scales (see, e.g., [5,21]) complicate the identification of the main drivers. The latter vary among different types of forests and include soil moisture, texture, temperature, pH, and nutrients, among others [21,27,28]. In addition, tree species composition regulates soil CH4 sink by changing soils properties or by inhibiting methane oxidation directly [6,29,30].
Atmospheric CH4 uptake in forest soils occurs due to the activity of aerobic methanotrophic bacteria, which utilize methane as a source of energy [31,32,33,34]. Currently described aerobic methanotrophs belong to the classes Alpha- and Gammaproteobacteria as well as to the phylum Verrucomicrobia [35]. A key enzyme of the methanotrophic metabolism is particulate methane monooxygenase (pMMO), which is present in nearly all currently described methanotroph species. Accordingly, the pmoA gene coding for the active-site polypeptide of pMMO is the most frequently used molecular marker in cultivation-independent detection of aerobic methanotrophs [36]. Aerobic methanotrophic bacteria that inhabit upland soils and are able to oxidize atmospheric CH4 are often referred to as “high-affinity” methanotrophs [37,38]. The identity of these bacteria remained obscure for a long time. The first evidence that this as-yet-uncultivated methanotrophic group is involved in atmospheric CH4 oxidation was obtained by analyzing the pool of pmoA gene sequences in soil samples collected from a beech forest in Denmark, a rainforest in Brazil, and a mixed hardwood forest in the United States [39]. The pmoA sequences retrieved from these forest soils belonged to an as-yet-uncultivated methanotroph group, which was later named Upland Soil Cluster Alphaproteobacteria (USCα) [40] and was detected in many acidic and pH-neutral upland soils [14,41,42,43,44,45,46]. Recent insights into the identity, metabolic potential and physiology of USCα methanotrophs via metagenome analysis [47] and cultivation studies [48] characterize these bacteria as metabolically versatile members of the family Beijerinckiaceae, which oxidize CH4 at its atmospheric trace concentrations and also have the potential to utilize CO2, CO, H2 and N2. Besides USCα methanotrophs, upland forest soils may host populations of Methylocystis species and another as-yet-uncultivated clade of methanotrophs, named USCγ group, which is most commonly detected in pH-neutral soils [37,38,40].
Despite the fact that Russia hosts one-fifth of the global forest area, with the most extensive forest landscapes located in Siberia, no data are currently available on atmospheric methane oxidation and composition of methanotroph communities in soils of the West Siberian middle taiga. This study was aimed to fill in the gap in our knowledge of the seasonal CH4 fluxes from three typical middle taiga forest ecosystems of West Siberia, the controls staying behind observed seasonal (not inter-annual) and ecosystem scale methane consumption variability, as well as of the composition of methanotroph communities in taiga soils.

2. Materials and Methods

2.1. Site Description

Field measurements and soil sampling were conducted in 2018 in three typical middle taiga forest ecosystems of West Siberia: Siberian pine, mixed and small-leaved aspen forests. Study plots were situated several kilometers from each other on the second terrace of Ob’ river near the city of Khanty–Mansiysk (Figure 1).
The climate of the region is subarctic Dfc according to Köppen climate classification, with long cold winters (average winter air temperature is −17.5 °C), short warm summers (average summer air temperature is 16.0 °C), and annual average air temperature of −0.4 °C for the 1981–2010 period (www.pogodaiklimat.ru, accessed on 5 November 2021). The annual average precipitation is 549 mm, concentrated in the period from June to October. Snow cover lasts for 187 days on average, from October to May (www.pogodaiklimat.ru, accessed on 5 November 2021). Ground water depth is more than 5 m. According to WRB classification, all plots have the same soil type—Albic Podzol with sandy loam texture. Soil profile consisted of a thin O layer (mean depths are 0–2 cm) of plants litter, a topsoil A horizon (2–7 cm), an eluviated E horizon (7–12 cm), an illuviated B horizon (12–20 cm) and a C horizon (parent material deeper than 20 cm). In Siberian pine forest, an E horizon is the most pronounced, while in mixed and aspen forest, it is intermittent. Soil properties of the sampling plots are given in Table 1.
Siberian pine forest. A mature dense stand (crown cover of 90%–95%) is dominated by Siberian pine (Pinus sibirica Du Tour) interspersed with Siberian fir (Abies sibirica Ledeb.) and Siberian spruce (Picea obovata Ledeb.). The overstory trees have an average diameter of 40 cm at breast height and an average height of 27 m. The grass layer is sparse (projective cover is less than 10%) with Equisetum sylvaticum L. and Oxalis acetosella L. as main components. The moss layer is fragmentary in windthrow gaps and formed by Polytrichum commune and Pleurozium schreberi.
Aspen forest. A dense stand (crown cover of 60%–70%) with dominant aspen (Populus tremula L.) appeared after a uniform clear-cut that was conducted about 30 years ago [25]. Silver birch (Betula pendula Roth) is also common in overstory while Pinus sibirica forms sparse (1%–5%) understory. The overstory trees have an average diameter of 7 cm at breast height and an average height of 12 m. The dominant species in a grass–shrub layer (projective cover of 10%–15%) are Vaccinium vitis-idaea L., Equisetum sylvaticum and Calamagrostis canescens.
Mixed forest. A dense conifer–deciduous mixed stand (crown cover of 70%–80%) is formed by Pinus sibirica, Abies sibirica, Populus tremula. The overstory trees have an average diameter of 30 cm at breast height and an average height of 22 m. The understory is presented by the same species and Sorbus aucuparia L. The grass layer is sparse (projective cover of 10%–15%) and consists solely of Vaccinium myrtillus L. The moss layer (30%–50%) is formed by Hylocomium splendens and Pleurozium schreberi. Grass and moss layers are the most pronounced under deciduous species.

2.2. CH4 Flux Measurements

CH4 fluxes were measured using the static chamber method [49]. Three static chambers were randomly installed in each forest type. Field flux measurements were conducted three times per year in 2018: 25–28 of May (just after melting of seasonal soil frost), 10–15 of July (warmest week of the year), and 9–12 of September (beginning of the abscission). Methane fluxes were measured in three consecutive replicates for each chamber in each forest type between 12 and 4 p.m. with a total of 81 measurements (3 forest types × 3 times per year × 3 chambers × 3 replicates).
The chamber consisted of a permanently installed square stainless steel collar (37 cm × 37 cm, embedded 10–15 cm deep into the soil) and a removable plexiglas box (30 cm height). A groove on the collar rim—a hydro lock against leaks—was filled with water to a depth of 5 cm before the measurement. To minimize changes in ambient temperature, the box was covered with reflecting aluminum fabric. The air inside the chamber was mixed by a battery-operated internal fan. Initial pressure shock during the chamber setting was minimized by a hole (Ø 2 cm) on top of the chamber. Four gas samples were collected 0, 20, 40 and 60 min after closure by flushing gas-tight 20 mL polypropylene syringes (KD-JECT III, KDM, Germany) 10 times with headspace air through a tube in a rubber stopper inserted tightly into the hole on the chamber top. After sampling, the syringes were immediately sealed with rubber stoppers and stored in the dark at +4 °C.
Methane concentration in the samples was analyzed in the laboratory within 48 h after sampling. Flux density in mg CH4 m−2 h−1 was calculated using first order kinetics model as described in [17]. A methane concentration of 1.33 mg CH4 m−3 was used to calculate a flux value as a mean value of initial chamber headspace CH4 concentration for all measurements. Since methane fluxes usually have a non-normal distribution [5], a median of three consecutive flux measurements were used for statistical analysis.

2.3. Determination of the Soil Methane Oxidation Rate

The soil was sampled at each forest plot in each season at four depths (3–5, 10–12, 20–22 and 30–32 cm) in two spatial replicates between installed chambers (total of 3 forest types × 3 times per year × 4 depths × 2 replicates = 72 samples); for sampling, we used Edelman Soil Auger (Eijkelkamp Soil & Water, Netherlands). Samples were taken randomly from the soil core at the given depth, pooled in the 100 mL high-density polyethylene jars and stored in the dark at +4 °C for 2–3 days. Before incubation, the jars with soil were kept in the climate chamber MK-53 (BINDER, Germany) for 1 h to equilibrate to experimental temperatures. Then, 3–5 g of a sieved (mesh size 2 mm) soil was placed from the jars to 200 mL preliminary autoclaved glass bottles sealed with butyl stoppers. Initial methane concentration in bottles was ambient and varied from 0.92 to 1.21 mg CH4 m−3. These bottles were incubated at in situ soil temperature during the field sampling (±0.5 °C) in the same climate chamber. Four gas samples were taken from the bottle headspace by removing 2 mL of air at 3–5 h intervals. Soil CH4 oxidation rate in ng CH4 gDW−1 h−1 was calculated using first order kinetics model as described in [17] for methane concentration of 1.33 mg CH4 m−3. The soil from glass bottles was dried at 70 °C and the results were normalized to dry weight. For soil in each of the jars, incubation was conducted in 2–3 replicates; the average value of replicates was used for further calculations.

2.4. Methane Concentration

The methane concentration in gas samples from both chamber measurements and incubation experiments was determined using a gas chromatograph Kristall-5000 (Khromatek, Yoshkar-Ola, Russia) equipped with a flame ionization detector. Nitrogen served as a carrier gas with a flow rate of 35 mL min−1. A stainless steel column with a length of 1 m and an internal diameter of 1 mm was filled with HayeSep Q (80–100 mesh) and held at 80 °C. Three external standards (2.28, 14.6 and 93 ppm, Ugra-PGS, Russia) were used for calibration each day after analysis. Precision (standard deviation) at 2.28 ppm was ±0.01 ppm for ten replicates. Each gas sample was analyzed twice; an averaged value was used for calculations of methane fluxes and oxidation rates.

2.5. Soil Chemical and Physical Properties

Soil temperature and volumetric moisture were measured in the field by Hydra Probe II (Stevens, CIIIA) in each soil core from 0 to 50 cm at 5 cm step. Total pore space was estimated by measuring volumetric water content in saturated samples. First, intact soil at 0 (surface), 10, 20 and 30 cm depths were sampled into 200 cm3 rings in 2 spatial replicates at each study plot (after all measurements in September). Then, soil rings were submerged in a wide pan with foam rubber on the bottom for water infiltrating from both sides of the ring. The pan was accurately shaken for 10 h using an oscillating agitator to achieve full water saturation. Volumetric water content, measured by Hydra Probe II in saturated samples, was considered as the total pore space. Water-filled pore space was estimated as a ratio of in situ volumetric water content to the total pore space at the given depth.
To determine pH and soluble NH4+ and NO3 content of incubated soil samples, 1:6 slurries of soil and deionized H2O (w/v) were mixed using a vortex shaker for 5–10 s. pH was measured in the supernatant using a pH glass electrode (Mettler Toledo, Switzerland). After 2 h of extraction by the oscillating agitator, slurries were centrifuged for 15 min at 7000× g. Concentrations of NH4+ and NO3 in the supernatant were assessed by the Nessler method using reagent set #2458200 and by cadmium reduction method using reagent set NitraVer® 5, respectively (both sets—Hach-Lange, Düsseldorf, Germany), following the manufacturer guide. Quantification was performed using spectrophotometer DR5000 (Hach-Lange, Germany). The analytical accuracy of the method is ±10%.
Total organic carbon content in soil was measured using cuvette test system LCK 381 and spectrophotometer DR5000 (both Hach-Lange, Germany); it was estimated as a difference between total carbon and total inorganic carbon according to the manufacturer guide. Before measurements, 0.5 g of soil was homogenized with 5 mL of distilled water in a 50 mL propylene flask for 1 min using the oscillating agitator. The obtained mixture was immediately added to the test system in a volume of 50 µL. The analytical accuracy of the method is ±20%.

2.6. Statistical Analysis

We used 3-way ANOVA (function anovan in Matlab) with type III sum of squares [50] to evaluate the factors of depth, season and forest type, affecting the variability of methane flux (without depth as a factor) and soil CH4 oxidation rate. Before the analysis, data were checked for normality by Anderson–Darling test (adtest, p > 0.05) and were Box-Cox transformed when applicable (boxcox). Omega-squared (corrected explained-to-total dispersion ratio) was used as an effect size measure [50]. Reported comparisons between groups were obtained using function multcompare with a significance level of 0.05 corrected by Tukey’s honestly significant difference procedure [50].
We conceptualized the effect of different environmental controls with a help of regression modeling. To address non-linearity in controls (e.g., soil moisture [37]) we tested both linear and non-linear functions to explain soil CH4 oxidation rate variability on a depth-, season- and ecosystem-specific basis. Linear, log-normal, power, exponential and 2nd order polynomial functions were fitted using function fitnlm. Reported models were checked for statistical significance (p < 0.05), parameters significance (p < 0.05), parameters non-zero condition (coefTest, p < 0.05) and normal distribution of residuals, estimated by Anderson–Darling test (adtest, p > 0.05). Both adjusted Pearson’s correlation coefficient (Radj2) and squared Spearman’s rank correlation coefficient (Spearman ρ2) were used to estimate model performance (function corr).
Seasonal and ecosystem effects on models linking water-filled pore space and soil CH4 oxidation rate were examined by non-linear mixed effect model; three seasons (May, July, September) and three forest types (Aspen, Siberian pine and mixed) were treated as random effect variables. Water-filled pore space was used as a predictor; it explained more variance in soil CH4 oxidation rate than other tested controls. The calculation was made by means of function nlmefit. Obtained models were compared using the Akaike information criterion (AIC) and the likelihood ratio test (lratiotest).
Significant differences between groups were checked with a Mann–Whitney test (ranksum). All calculations were made in Matlab R2016b (The MathWorks, Natick, MA, USA). Soil methane consumption was assigned to negative flux values and positive values of oxidation rate.

2.7. Soil DNA Extraction

Extracts of total DNA used for molecular diversity studies were obtained from the samples collected from topsoil A horizon layers (3–5 cm depth). Four individual soil samples (of 0.5 g wet weight) were taken for the analysis from each of the studied forest sites and processed separately. Total DNA from samples was extracted using FastDNA SpinKit (MPBio, Santa Ana, CA, USA) according to the manufacturer’s instructions.

2.8. Illumina Sequencing and Analysis of 16S rRNA Gene Fragments

To assess the microbial community composition in the forest soils including methanotrophic bacteria, fragments of 16S rRNA genes corresponding to the V4 region of were amplified from total DNA extracts. Libraries of the 16S rRNA gene fragments for high-throughput sequencing were prepared according to the earlier published protocol [51] and were sequenced on Illumina MiSeq platform (Illumina, San Diego, CA, USA) at Biospark (Moscow, Russia).
The pool of obtained 16S rRNA gene sequences was analyzed with QIIME 2 v.2020.8 (https://qiime2.org, accessed on 7 September 2021) [52]. DADA2 plugin was used for sequence quality control, denoising and chimera filtering [53]. Operational Taxonomic Units (OTUs) were clustered applying VSEARCH plugin [54] with open-reference function using Silva v. 138 database [55] with 97% identity. Taxonomy assignment was performed using BLAST against Silva v. 138 database. The alpha- and beta-diversity indices were calculated using the core–metrics–phylogenetic method implemented in QIIME with subsequent Permanova tests [56].

2.9. Illumina Sequencing and Analysis of pmoA Gene Fragments

Two different PCR assays were used to assess methanotroph diversity in the forest soils based on the retrieval of the pmoA gene fragments. The primer set A189/A682r [57] offers a broader coverage which covers USCα methanotrophs, but also targets amoA genes of ammonia-oxidizing bacteria. The primer set A189f/A650 was designed to target USCα methanotrophs [58]. The combination of these primer sets allowed in depth evaluation of methanotroph community composition in the forest soils. The obtained mixtures of amplicons were purified by agarose gel electrophoresis using Cleanup Standard Kit and sequenced on Illumina MiSeq platform (Illumina, San Diego, CA, USA) at Evrogen (Moscow, Russia). Demultiplexing and further processing of the resulting data set was carried out using QIIME 2 v.2020.8 package. DADA2 plugin was used for sequence quality control, merging of paired-end reads and chimera filtering. DADA2 outputs were translated to proteins using Framebot (http://fungene.cme.msu.edu/FunGenePipeline/framebot/form.spr, accessed on 4 October 2021) to detect and correct frameshifts in the reads. After correction step, the sequences were analyzed with QIIME 2 v.2020.8 Operational taxonomic units (OTUs) were clustered applying VSEARCH with dedicated reference database of 7809 unaligned pmoA nucleotide sequences with 86% identity [59,60].

3. Results and Discussion

3.1. Methane Fluxes

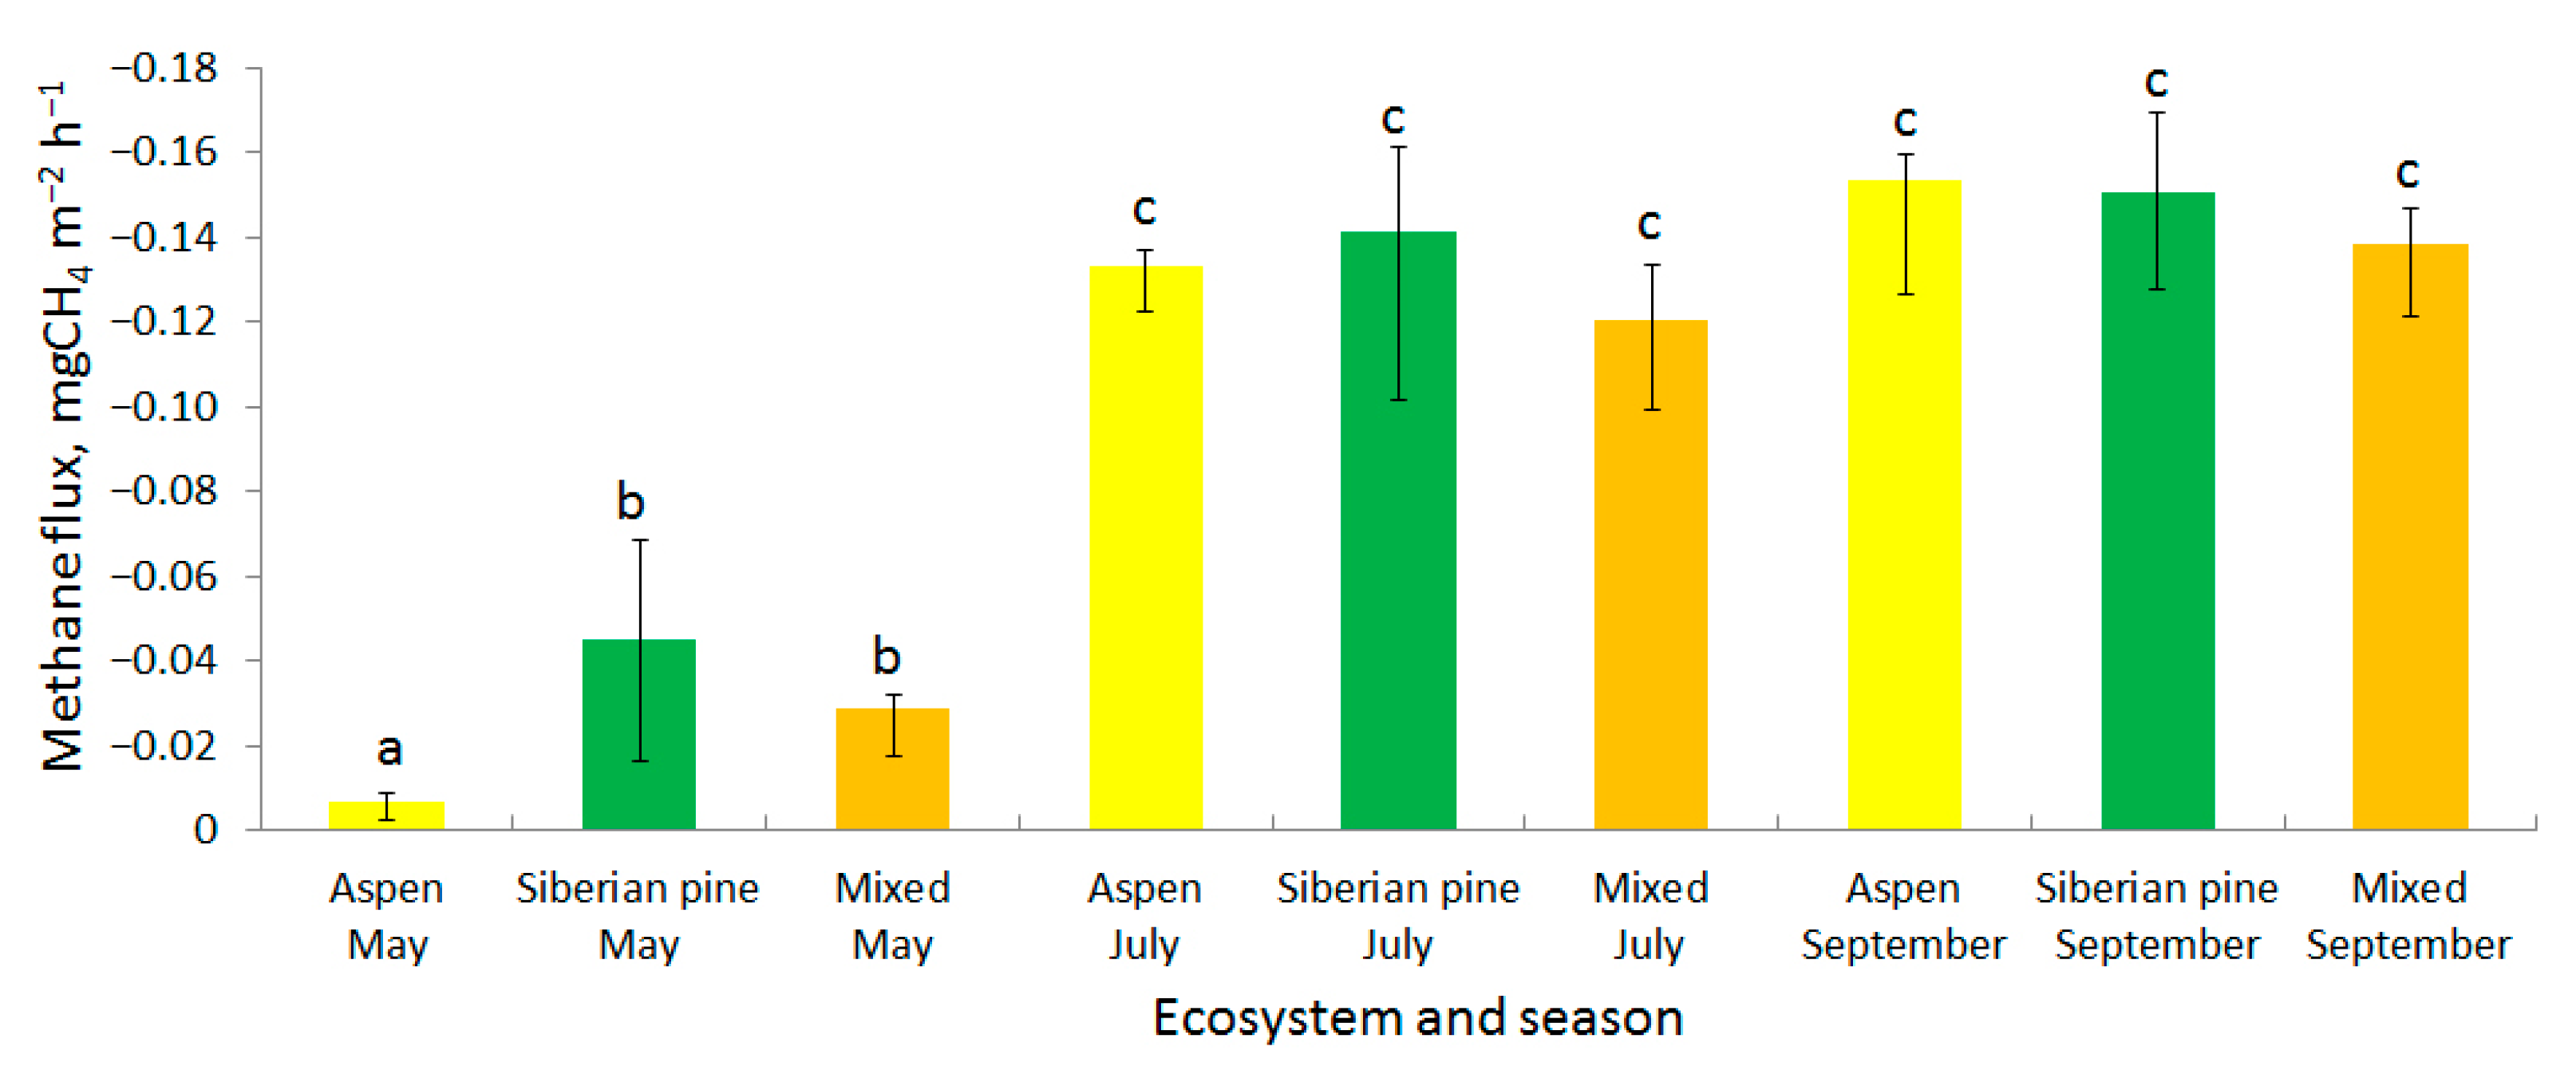
Soil CH4 flux ranged from 0 to −0.184 mg CH4 m−2 h−1; the season contributed most to the observed variability (Figure 2, Table 2). Median flux was −0.121 mg CH4 m−2 h−1 for all data. Measured emissions were lower, i.e., consumption was higher, compared to soils in Russian temperate deciduous and small-leaved forests [10,11,12] and forest–tundra ecosystems [14]. Similar values were measured in Russian boreal forests [9,16,17].
Soil temperatures and moisture in May, July and September are similar to those in October, June and August, respectively, for studied plots [25]. Thus, we assumed the total methane sink in May, July and September to match the one in October, June and August, respectively. Thus, we estimated CH4 consumption by studied soils at 4.5 ± 0.5 kg CH4 ha−1 for the whole growing season. It is higher than 86% of estimates for boreal forest soils and 75% of estimates for all forest soils according to the database from [22]. Therefore, the taiga forest might be a strong methane sink at high latitudes.
Forest type affected CH4 flux mostly in May, after the soil frost melt: consumption in Aspen forest was lower than in Siberian pine (p = 0.002) and mixed (p = 0.010) forests (Figure 2). In July and September, soil sink showed no significant variability. Prior studies found the same seasonal emission patterns in temperate [62,63,64] and boreal [65,66] forest soils; forest type was reported both as significant [6,65,67] and non-significant [64,66,68] driver of methane consumption. Interaction of soil physical, chemical and biological factors trigger contrasting emission patterns. In studied soils, most variability in flux drivers was attributed to seasonal and depth scales; hence, forest type explained only a minor part of the total flux variance (Table 2). Among ecosystem-scale controls, litter thickness tends to decrease soil methane consumption among different forest types [30,65], but it varied only slightly among study plots (Table 1). Soil pH and nitrogen content negatively correlated with methanotroph abundance in upland soil [69]. Both of these parameters were significantly lower in Siberian pine compared to Aspen forests (p = 0.048 and p = 0.009, respectively), but not to mixed forest (p = 0.161 and p = 0.156, respectively). It could potentially explain differences in consumption rates at studied forests in May.

3.2. Soil Methane Oxidation Rates

Soil methane oxidation rate ranged from 0 to 8.1 ng CH4 gDW−1 h−1. It varied significantly on both seasonal and depth scales, but not on the ecosystem one (Table 2). Similar methane oxidation rates were earlier reported for temperate [6,62,67] and boreal [13,68,70] forests. It significantly differed between each of depths decreasing from 3–5 cm (mean ± standard error of the mean 3.21 ± 0.64 ng CH4 gDW−1 h−1) through 10–12 cm (1.37 ± 0.35) and 20–22 cm (0.53 ± 0.23) to 30–32 cm (0.15 ± 0.04). The seasonal trend was also pronounced: July (2.23 ± 0.51 ng CH4 gDW−1 h−1) > September (1.39 ± 0.40) > May (0.32 ± 0.10). Soil methane concentration decreased from the depth of 3–5 cm (1.12 ± 0.04 mg CH4 m−3) through 10–12 cm (0.81 ± 0.06) and 20–22 cm (0.51 ± 0.09) to 30–32 cm (0.40 ± 0.10) with significantly different values except for the last two depths (p = 0.064). The observed pattern is common for temperate and boreal forest soils [62,63,70].
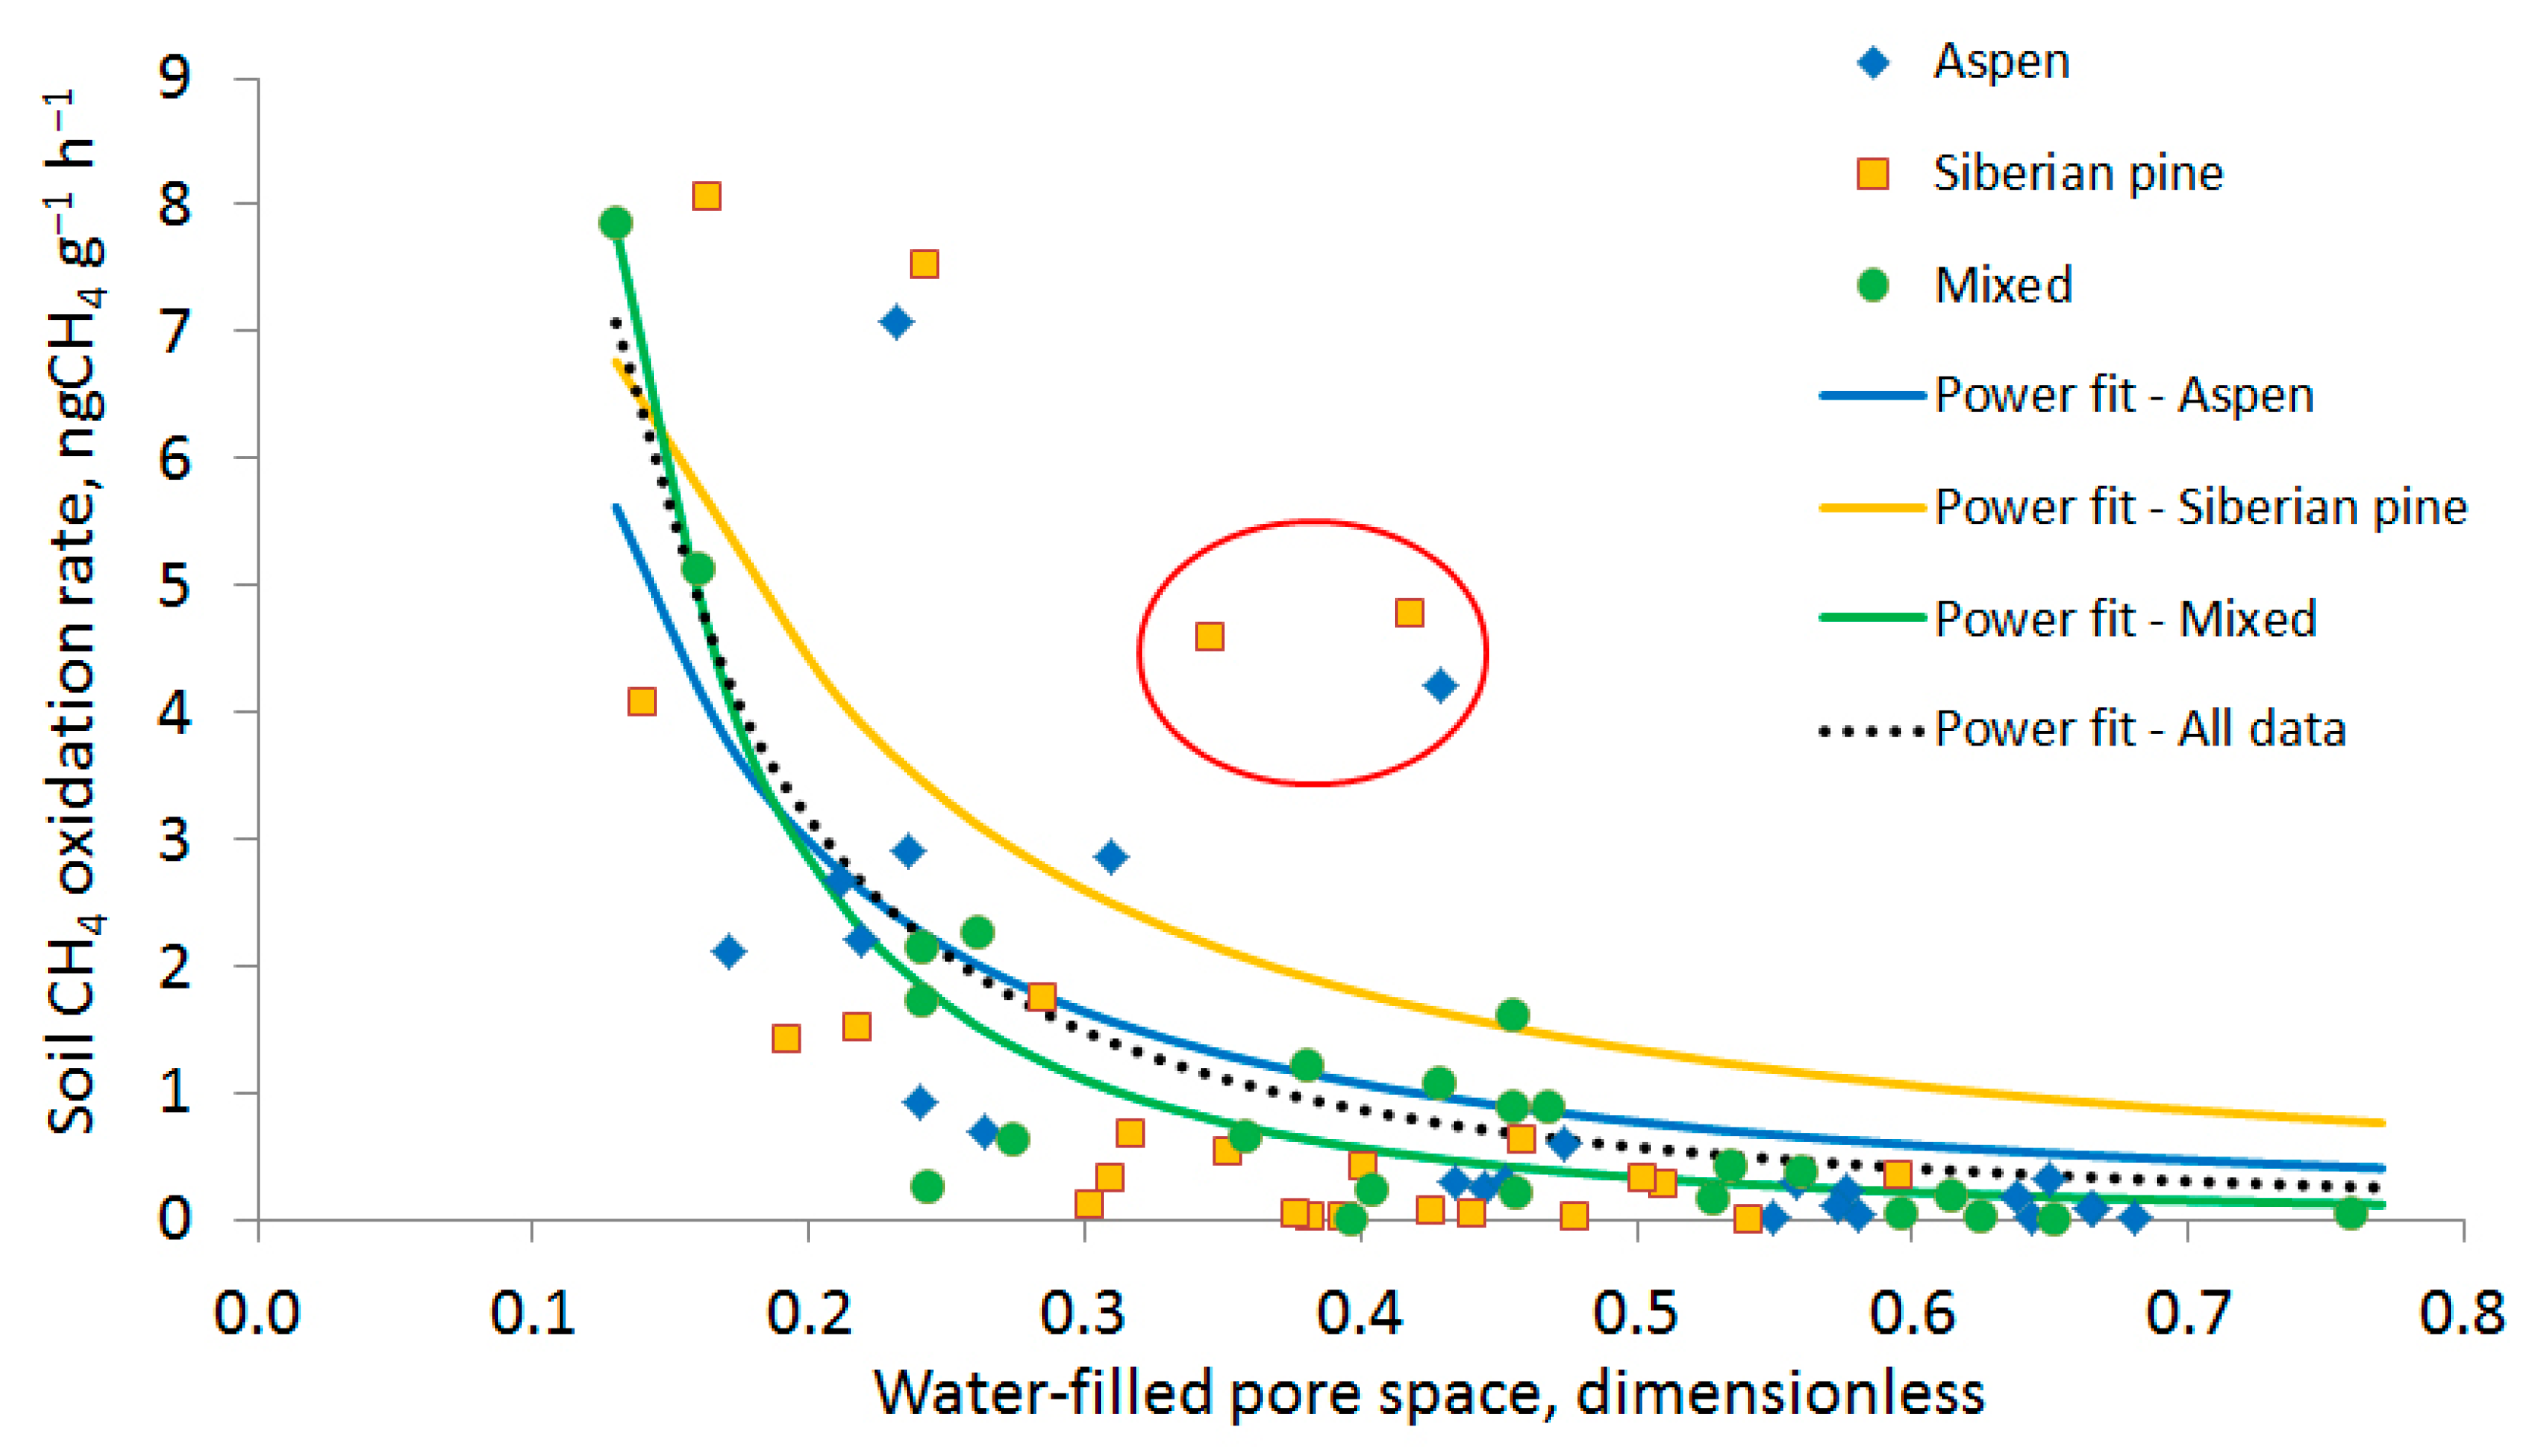
Water-filled pore space was the most powerful predictor for soil methane oxidation rate (dotted line in Figure 3, Table S1) with the power law as the best fit model. It substantiates the belief that soil methane consumption is diffusion limited during the growing season [37,62]. A power function of air-filled porosity is a commonly accepted approach to model soil gas diffusion [71,72]. Since air-filled porosity is a simple difference between total porosity and water-filled pore space, the latter works as a proxy for soil gas diffusion rate. Soil temperature and methanotroph abundance are significant predictors of the soil CH4 oxidation rate as well, but they explain less variance (Table S1).
Potential cross-correlation of controls mask their individual effect on soil CH4 sink; its sensitivity to controls can also be ecosystem-specific [21,66]. To assess the effect, a non-linear mixed effect model with a water-filled pore space as a fixed factor was compared with the power model (Table S2): all models performed similarly (for both, p = 0.36, df = 2 under likelihood ratio test), but the simple power model had lower (i.e., better) value of AIC. Thus, models had similar predictive power regardless of the data used: for each forest type (Figure 3), for each season (Figure S1), for the whole dataset. Thus, the most important soil oxidation driver was the water-filled pore space; significant variations in temperatures and soil chemistry, throughout the season and among forest types, did not affect the soil CH4 oxidation rate and its sensitivity to soil moisture.
Being a biological process, methane consumption is controlled by temperature [37], but in forest soils, its temperature sensitivity could be negligible. Crill [62] reported growing season Q10 ranged from 0.9 to 1.4 with a mean value of 1.2 both for CH4 flux and oxidation rate. Lind et al. [73] found no CH4 flux dependence on soil and air temperatures at the seasonal scale in forests. Mean annual air temperature also did not correlate with CH4 sink [22] or even correlated negatively [28] in boreal and temperate forest soils. We demonstrated that the gas diffusion controls methane consumption during the growing season; even in the early spring, when evapotranspiration is negligible and the soil retains snowmelt water, the effect is evident. Found correlation between temperature and soil CH4 oxidation rate could be explained by high cross-correlation between temperature and water-filled pore space (Spearman ρ2 = 0.53).
Residuals for power fit model were not distributed normally (p = 0.008, N = 70 and p = 0.002, N = 22, respectively) across Siberian pine forest and all data. Outliers within medium water-filled pore spaces (denoted by red ellipse on Figure 3) could indicate the effect of other controls. We assessed them on a depth-specific basis as the depth explained most of the variance in the soil methane oxidation rate (Table 2). Further regression modeling revealed its key drivers at a certain depth (Figure 4, Table S3).
Water-filled pore space was the only significant predictor in topsoil (3–5 cm) samples but had no effect at other depths (Figure 4A). Methanotroph abundance strongly correlated with the soil methane oxidation rate in subsoil samples (20–22 and 30–32 cm) but had no effect in upper soil horizons (Figure 4B). Methane concentration affected CH4 oxidation rate only in samples from 10–12 cm (Figure 4C); soluble NH4+ and NO3 had no effect at any depth (Figure 4D). Methane concentration and methanotroph abundance explained observed outliers (denoted by red ellipse on Figure 3). Another outlier caused strong correlation (Radj2 = 0.82, Table S3) presented in Figure 4B, but Spearman ρ2 that is non-sensitive to them was also high (0.40) for this model.
Divergent processes drive methane consumption within the soil profile. In the topsoil, methane concentration is high throughout the growing season because of the developed macropore system and close surface. Due to substrate availability, a population of methanotrophs reaches maximal abundance occupying a broad range of niches with different growth favorability [48,74]. Diversity of niches may result in high variability of methanotrophs abundance in the topsoil (Figure 4B). High-affinity methanotrophs can also utilize other substrates [48,75] derived from root exudates. Thus, methane oxidation is limited by gas diffusion through the free pore space in soil aggregates.
In the subsoil (samples from 20–22 and 30–32 cm), methane concentration is low; it is close to the threshold for high-affinity methanotrophs [48,74]. Other substrates are less abundant than in the topsoil as well. Hence, their growth is limited for most of the season except periods of high methane availability, e.g., (i) temperature-induced lowered consumption in upper layers in early spring and late fall [62] and (ii) active methane production after heavy rain events [37]. Total methane consumption in the subsoil is limited by methanotroph abundance, which is significantly lower compared to 3 and 10 cm depths (p < 0.001), while water-filled pore space has medium values (Figure 4A).
Methane consumption at the 10 cm depth occurs under intermediate conditions. Methane concentration is significantly less than in the topsoil (p < 0.001), but still higher than the threshold for high-affinity methanotrophs [48,74]. Methanotroph abundance drops comparing to the 3 cm depth (p < 0.001), but still exceeds the subsoil (p < 0.001). Soil methane oxidation rate negatively correlates with the methane concentration at this depth. If the oxidation were limited by the methanotrophic community, the correlation would be positive: higher CH4 mixing ratios promote an extensive growth of methanotrophs. The observed negative correlation could be explained by preferential paths of gas transport through roots and macropores in the eluvial horizon (10 cm depth). Cm-scale heterogeneity of eluvial horizon in podzols is caused by the vertical migration of both organic and mineral substances from the topsoil [76]. Roots and macropores induce gas and water transport at the 10 cm depth, where a pore network is less developed compared to the topsoil [77]. Such preferential paths produce hot spots of microbial activity in soils [78]. In our study, macropores and hot spots might have been overlooked by measuring soil moisture and methanotroph abundance in small patches. In contrast, CH4 concentrations integrate methane oxidation and production over the larger soil volume. We suggest that their small values correspond to active spots of microbial activity or preferential paths in the soil layer of 10 cm depth, where active methane oxidation takes place.

3.3. Prokaryote Diversity Patterns in Forest Soils

A total of 105 820 partial 16S rRNA gene sequences (mean amplicon length 250 bp) were retrieved from the examined forest soils. Of these, 89,533 reads were retained after quality filtering, denoising and removing chimeras. According to the alpha-rarefaction analysis, the richness of the examined samples has been fully sequenced and observed. The microbial diversity was highest in the mixed forest soil (average Shannon index 6.85 and Pielou evenness 0.90), followed by the aspen forest soil (average Shannon index 6.40 and Pielou evenness 0.89) and Siberian pine forest soil (average Shannon index 6.24 and Pielou evenness 0.89). As revealed by the UniFrac analysis and a further Permanova test, the microbial assemblages within the particular forest type were highly similar to each other but were significantly (p ≤ 0.05) different between the various forest types.
The pools of reads obtained from the examined forest soils were dominated by 16S rRNA gene sequences of bacterial origin. The relative abundance of archaeal 16S rRNA gene reads ranged from 0.086% to 0.12% of all sequences. Archaeal populations were represented by members of the Crenarchaeota (uncultured representatives of the class Nitrososphaeria).
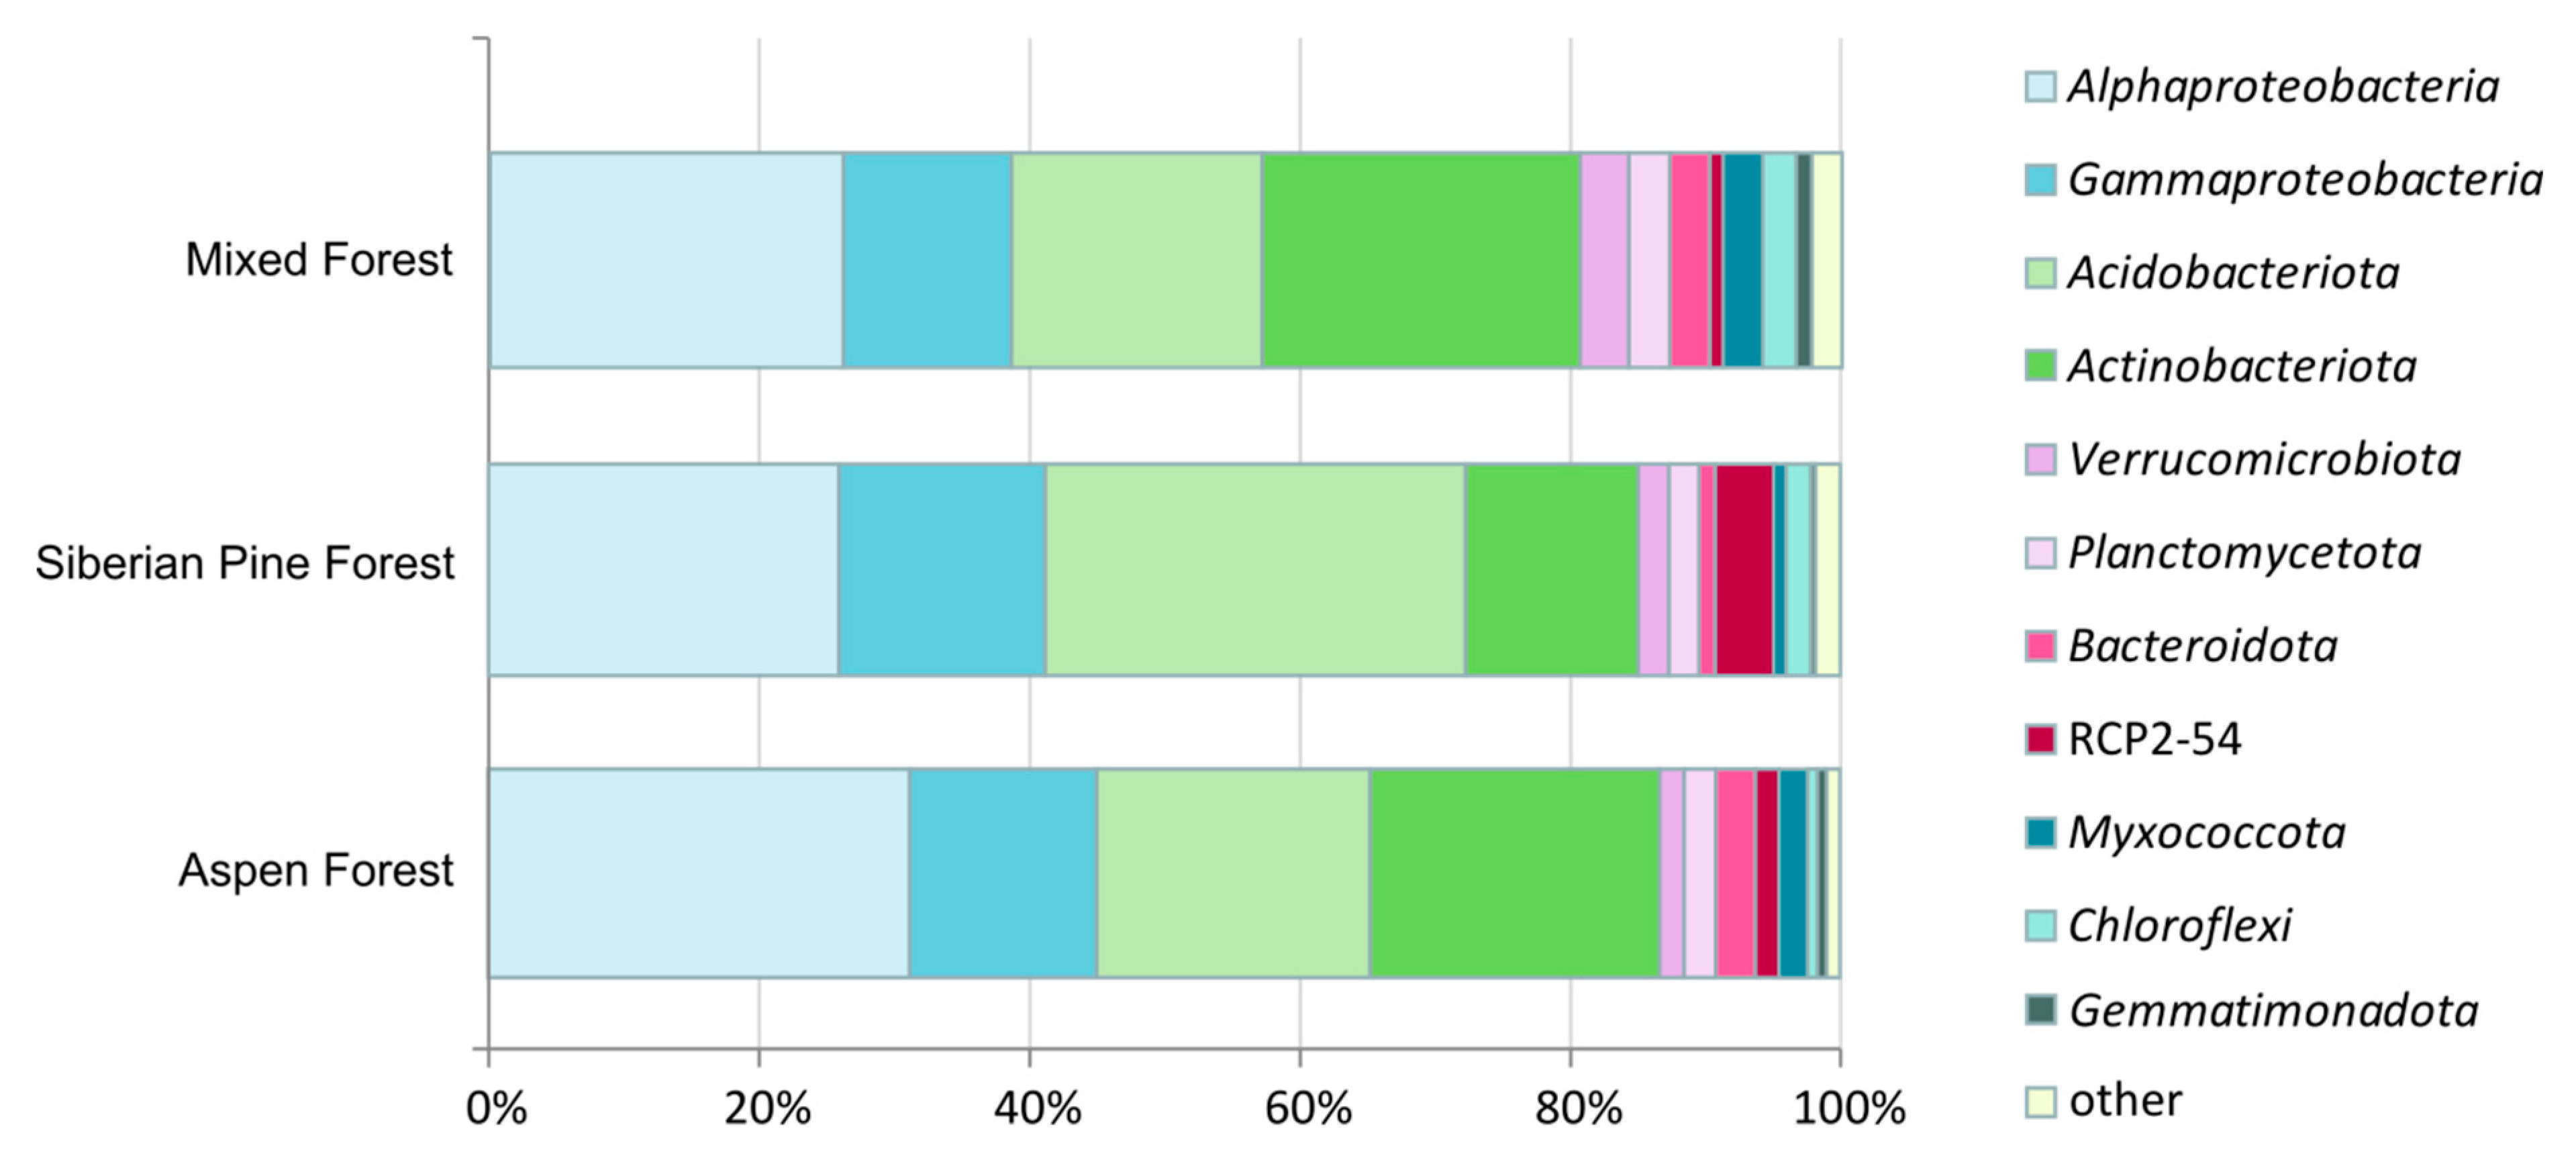
The bacterial communities in the three forest sites were dominated by members of the Alphaproteobacteria (22%–35% of the total number of 16S rRNA gene fragments), Acidobacteriota (15%–35%), Actinobacteriota (12%–28%), and Gammaproteobacteria (10%–21%). These four major bacterial groups comprised 76%–88% of the total prokaryote diversity revealed in these soils (Figure 5). This pattern of bacterial diversity is characteristic for acidic forest soils [79]. Minor bacterial groups included Verrucomicrobiota (1.5%–4.2%), Planctomycetota (1.5%–3.6%), Bacteroidota (1.2%–4.6%), Myxococcota (0.2%–3.4%), Chloroflexi (0.4%–4.8%), Gemmatimonadota (0.2%–1.7%) and others. The spectrum of minor bacterial groups also included the Candidate group RCP2–54, which was especially well represented (5% of the total number of 16S rRNA gene fragments) in the soil of Siberian pine forest. This as-yet-uncultivated group of bacteria was named after the environmental 16S rRNA gene sequence (GenBank accession number AF523886), which was retrieved in 2002 from a forested wetland [80].
The number of species-level OTUs determined at 97% sequence identity ranged between 295 in the Siberian pine forest soil and 488 in the mixed forest soil. The most abundant OTUs identified in each of the forest sites are listed in Table 3. Notably, one particular OTU that exhibited 100% sequence similarity to Bradyrhizobium sp. 175LB2PYPT obtained from the root nodules of Acacia pycnantha (GenBank accession number HQ698291), was identified in all forest sites in high relative abundances (5.7%, 6.2% and 9.1% of the total number of 16S rRNA gene fragments retrieved from Siberian pine, mixed and aspen forest soils, respectively). Members of the genus Bradyrhizobium are dinitrogen-fixing soil bacteria, which commonly occur in association with various plants. Several other major OTUs affiliated with the Acidobacteriia (Subdivisions 1 and 2), which are characteristic inhabitants of soils rich in plant-derived organic matter [81]. All major gammaproteobacterial OTUs belonged to the order-level group WD260, which does not contain cultivated representatives. This group was named after the environmental clone sequence WD260 (GenBank accession number AJ292673) retrieved two decades ago from an acidic polychlorinated biphenyl-polluted soil near Wittenberg, Germany [82]. Members of WD260 group are common inhabitants of soils and peatlands. Despite the recent success in culturing various groups of elusive soil bacteria, members of WD260 soil group resist cultivation efforts till now. No information is available about the physiology of these bacteria. Acid-tolerant actinobacteria of the genus Mycobacterium and uncultured members of the family Solirubrobacteraceae were also among the most abundant OTUs identified in all three forest types. Thus, with exception of Bradyrhizobium and Mycobacterium species, all most abundant OTUs in studied forest soils represented as-yet-uncultivated groups of bacteria.

3.4. Identification of Methanotrophs Based on 16S rRNA Gene Analysis

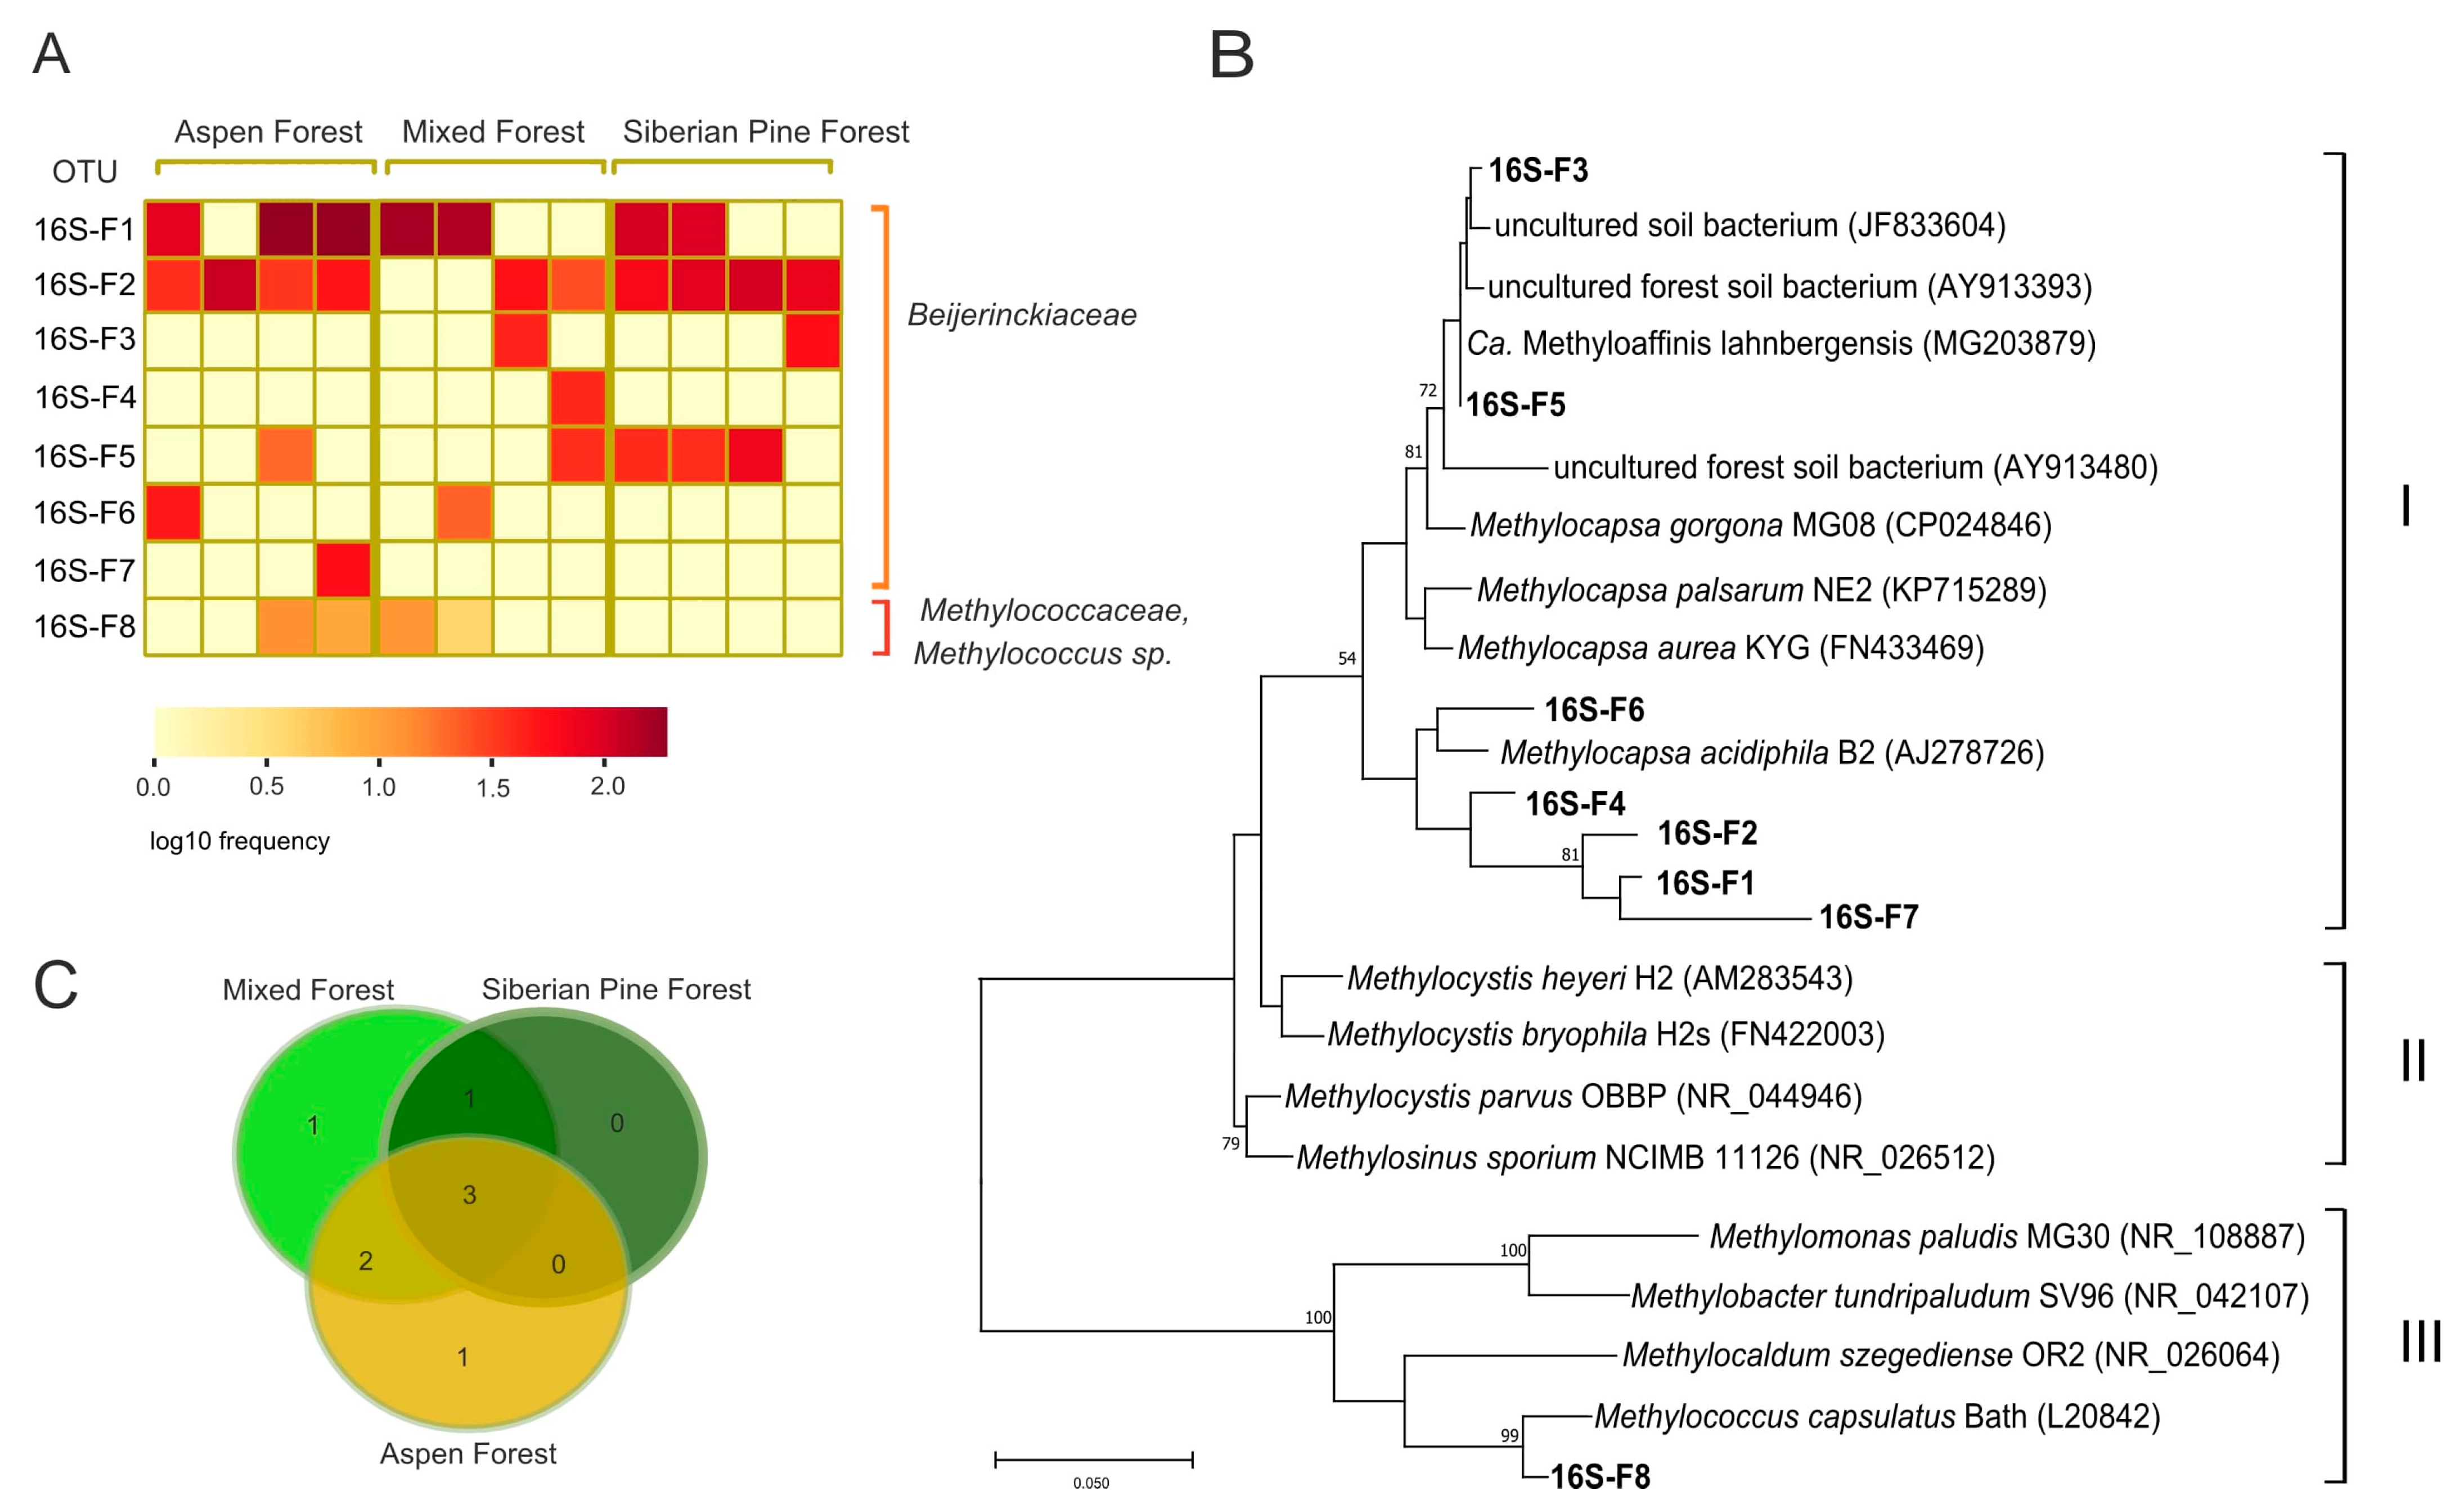
The search for OTUs that represent well-studied methanotrophic bacteria revealed a single OTU, which was affiliated with the order Methylococcales. This OTU was detected in a low relative abundance in soils of mixed and aspen forests and was absent from Siberian pine forest soil (Figure 6A,B). The only relatively abundant group of reads (~2.4% of all bacterial 16S rRNA gene fragments) that could potentially belong to methanotrophs was classified as uncultivated Beijerinckiaceae bacteria (Figure 6A,B). The latter were represented by seven species-level operational taxonomic units (OTUs), with three OTUs shared between the three forest types (Figure 6C). These Beijerinckiaceae-affiliated phylotypes displayed 93.2% and 100% sequence similarity to 16S rRNA gene sequence of Candidatus Methyloaffinis lahnbergensis [47] and 93.2% and 98.2% sequence similarity to 16S rRNA gene sequence of ‘Methylocapsa gorgona’ MG08 [48], respectively.

3.5. PmoA-Based Identification of Methanotrophic Bacteria

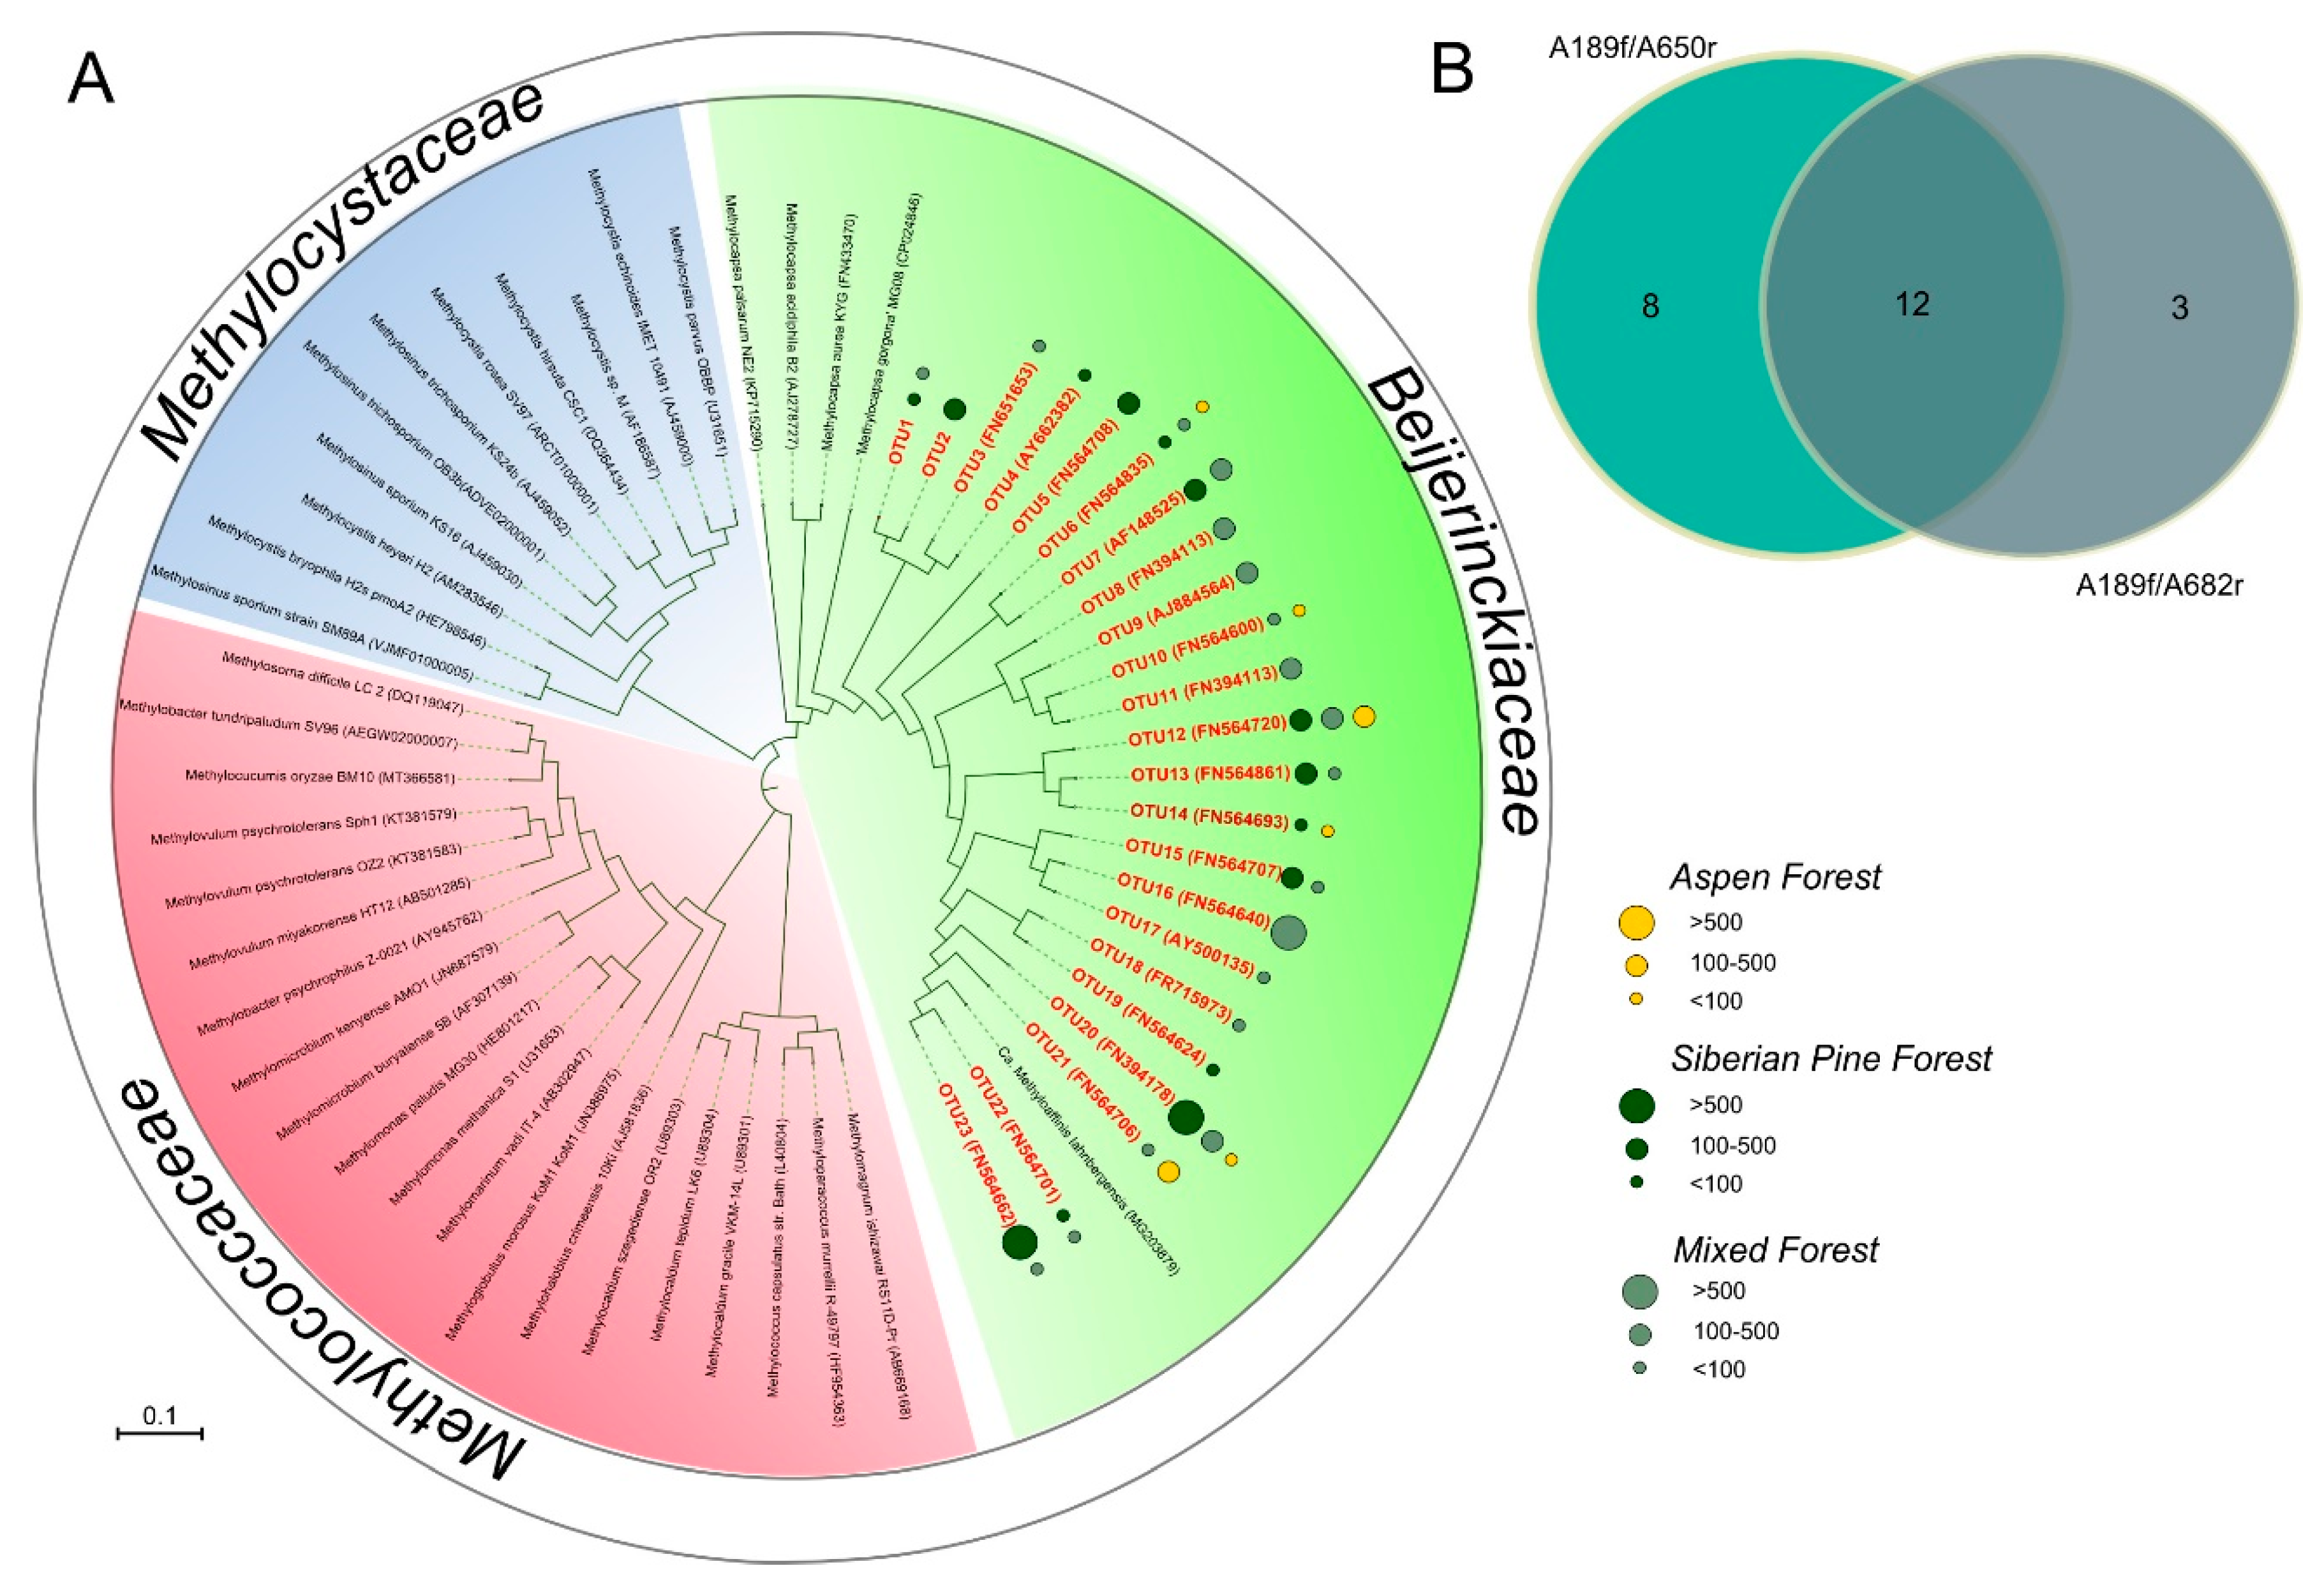
A total of 212,869 and 44,964 partial pmoA gene sequences (mean amplicon length 300 bp) were retrieved from the examined forest soils using A189/A682r and A189f/A650 primer sets, respectively. Of these, 3170 and 4379 pmoA gene sequences (mean amplicon length 530 bp) were retained after quality filtering, denoising, merging paired-end sequences, removing chimeras, removing amoA gene sequences and frameshift corrections via Framebot. All reads were clustered at 86% nucleotide similarity [59,60]. The obtained pool of pmoA fragments was represented by 23 species-level OTUs, three of which were common for all forest types (Figure 7A). The highest number of the pmoA-based OTUs was detected in the mixed forest soil, followed by the Siberian pine forest soil and aspen forest soil. All of these fragments belonged to the alphaproteobacterial methanotrophs of the family Beijerinckiaceae and displayed 86.7%–99.4% sequence identity to the pmoA of Candidatus Methyloaffinis lahnbergensis, which was identified in a deciduous forest soil in Germany [47]. Notably, OTUs 22 and 23, which displayed highest similarity to the pmoA of Candidatus Methyloaffinis lahnbergensis, were detected only in the soils of Siberian pine and mixed forests. Of the 23 OTUs identified in the total pool of pmoA sequences, 20 OTUs were obtained using the primer set A189f/A650r, while application of the primer set A189f/A682r allowed retrieval of 15 OTUs only (Figure 7B).
As revealed by molecular analysis, microbial communities in the studied Siberian boreal forest soils have a large proportion of bacteria belonging to as-yet-uncultivated groups, such as the Candidate phylum RCP2-54 or the order-level group WD260 of the Gammaproteobacteria. No information is currently available regarding the biology and environmental functions of these bacteria; the latter are attractive objects for further cultivation efforts or metagenome analyses. Methanotroph populations in these soils are represented by uncultivated Beijerinckiaceae bacteria of the USCα clade. These types of methanotroph communities, which are composed exclusively of high-affinity USCα methanotrophs, were earlier reported for soils of a beech forest in Denmark, a rainforest in Brazil, a mixed hardwood forest in the United States [39], a sub-boreal pine forest in Canada [83], temperate forests with European beech and Norway spruce in Germany [44], a lichen-dominated pine forest of Russian tundra [14] and a wide range of forest soils in China [46]. Given the large areas occupied by the upland forests in the world, USCα methanotrophs appear to represent one of the most environmentally relevant methanotroph populations in terrestrial ecosystems.
Overall, our study characterized West Siberian boreal upland forest ecosystems as a strong, earlier underestimated sink for atmospheric methane, which is oxidized by USCα methanotrophs.

Supplementary Materials

The following are available online at https://www.mdpi.com/article/10.3390/f12121738/s1, Figure S1: Power models fitted for soil CH4 oxidation rate versus water-filled pore space for all data and for each season separately, Table S1: Regression models for soil CH4 oxidation rate (N = 72), Table S2: Comparison of simple regression model and mixed effect models with season and forest type as tested random variables, Table S3: Regression models at the specified depth, depicted on a Figure 4.

Author Contributions

Conceptualization, A.F.S. and S.N.D.; investigation, A.F.S., Y.V.L. and O.V.D.; data curation, A.F.S., O.V.D., S.E.B. and A.A.I.; writing—original draft preparation, A.F.S., I.E.T., O.V.D. and S.N.D.; writing—review and editing, A.F.S., I.E.T., M.V.G. and S.N.D.; funding acquisition, I.E.T. and S.N.D. All authors have read and agreed to the published version of the manuscript.

Funding

This study was supported by the Russian Science Foundation (RSF), with field studies and laboratory analyses of methane oxidation rates supported by the RSF project no. 19-77-10074, and bioinformatic analyses of microbial and methanotroph diversity supported by the RSF project no. 21-14-00034.

Institutional Review Board Statement

Not applicable.

Informed Consent Statement

Not applicable.

Data Availability Statement

The 16S rRNA and pmoA gene reads retrieved using Illumina sequencing from the studied forests soil have been deposited under the Bioproject number PRJNA779228 in the NCBI Sequence Read Archive, with the accession numbers SAMN23019536, SAMN23019537, SAMN23019538 for rRNA dataset and SAMN23019615, SAMN23019616, SAMN23019617 for pmoA dataset.

Acknowledgments

The authors are grateful to Mikhail Semenov (Department of Soil Biology and Biochemistry, Dokuchaev Soil Science Institute, Moscow) for useful discussion of methods.

Conflicts of Interest

The authors declare no conflict of interest.

References

  1. Fletcher, S.E.M.; Schaefer, H. Rising methane: A new climate challenge. Science 2019, 364, 932–933. [Google Scholar] [CrossRef] [PubMed]
  2. Saunois, M.; Stavert, A.R.; Poulter, B.; Bousquet, P.; Canadell, J.G.; Jackson, R.B.; Raymond, P.A.; Dlugokencky, E.J.; Houweling, S.; Patra, P.K.; et al. The global methane budget 2000–2017. Earth Syst. Sci. Data 2020, 12, 1561–1623. [Google Scholar] [CrossRef]
  3. Rosentreter, J.A.; Borges, A.V.; Deemer, B.R.; Holgerson, M.A.; Liu, S.; Song, C.; Melack, J.; Raymond, P.A.; Duarte, C.M.; Allen, G.H.; et al. Half of global methane emissions come from highly variable aquatic ecosystem sources. Nat. Geosci. 2021, 14, 225–230. [Google Scholar] [CrossRef]
  4. Lan, X.; Basu, S.; Schwietzke, S.; Bruhwiler, L.M.P.; Dlugokencky, E.J.; Michel, S.E.; Sherwood, O.A.; Tans, P.P.; Thoning, K.; Etiope, G.; et al. Improved constraints on global methane emissions and sinks using δ 13C-CH4. Glob. Biogeochem. Cycles 2021, 35, e2021GB007000. [Google Scholar] [CrossRef] [PubMed]
  5. Dutaur, L.; Verchot, L.V. A global inventory of the soil CH4 sink. Glob. Biogeochem. Cycles 2007, 21, 4013. [Google Scholar] [CrossRef]
  6. Degelmann, D.M.; Borken, W.; Kolb, S. Methane oxidation kinetics differ in European beech and Norway spruce soils. Eur. J. Soil Sci. 2009, 60, 499–506. [Google Scholar] [CrossRef]
  7. Yu, L.; Huang, Y.; Zhang, W.; Li, T.; Sun, W. Methane uptake in global forest and grassland soils from 1981 to 2010. Sci. Total Environ. 2017, 607, 1163–1172. [Google Scholar] [CrossRef] [PubMed]
  8. Global Forest Resources Assessment 2020; Food and Agriculture Organization of the United Nations: Italy, Rome, 2020.
  9. Nakano, T.; Inoue, G.; Fukuda, M. Methane consumption and soil respiration by a birch forest soil in West Siberia. Tellus B Chem. Phys. Meteorol. 2004, 56, 223–229. [Google Scholar] [CrossRef]
  10. Kizilova, A.; Yurkov, A.; Kravchenko, I. Aerobic methanotrophs in natural and agricultural soils of European Russia. Diversity 2013, 5, 541–556. [Google Scholar] [CrossRef]
  11. Semenov, V.M.; Kravchenko, I.K.; Kuznetsova, T.V.; Semenova, N.A.; Bykova, S.A.; Dulov, L.E.; Gal’chenko, V.F.; Pardini, G.; Gispert, M.; Boeckx, P.; et al. Seasonal dynamics of atmospheric methane oxidation in gray forest soils. Microbiology 2004, 73, 356–362. [Google Scholar] [CrossRef]
  12. Kravchenko, I.; Sukhacheva, M. Methane oxidation and diversity of aerobic methanotrophs in forest and agricultural soddy–podzolic soils. Appl. Soil Ecol. 2017, 119, 267–274. [Google Scholar] [CrossRef]
  13. Menyailo, O.V.; Hungate, B.A.; Abraham, W.R.; Conrad, R. Changing land use reduces soil CH4 uptake by altering biomass and activity but not composition of high-affinity methanotrophs. Glob. Chang. Biol. 2008, 14, 2405–2419. [Google Scholar] [CrossRef]
  14. Belova, S.E.; Danilova, O.V.; Ivanova, A.A.; Merkel, A.Y.; Dedysh, S.N. Methane-oxidizing communities in lichen-dominated forested tundra are composed exclusively of high-affinity USCα methanotrophs. Microorganisms 2020, 8, 2047. [Google Scholar] [CrossRef]
  15. Takakai, F.; Desyatkin, A.R.; Lopez, C.M.L.; Fedorov, A.N.; Desyatkin, R.V.; Hatano, R. CH4 and N2O emissions from a forest-alas ecosystem in the permafrost taiga forest region, eastern Siberia, Russia. J. Geophys. Res. Biogeosci. 2008, 113, 2002. [Google Scholar] [CrossRef]
  16. Sabrekov, A.F.; Glagolev, M.V.; Fastovets, I.A.; Smolentsev, B.A.; Il’yasov, D.V.; Maksyutov, S.S. Relationship of methane consumption with the respiration of soil and grass-moss layers in forest ecosystems of the southern taiga in Western Siberia. Eurasian Soil Sci. 2015, 48, 841–851. [Google Scholar] [CrossRef]
  17. Sabrekov, A.F.; Glagolev, M.V.; Alekseychik, P.K.; Smolentsev, B.A.; Terentieva, I.E.; Krivenok, L.A.; Maksyutov, S.S. A process-based model of methane consumption by upland soils. Environ. Res. Lett. 2016, 11, 075001. [Google Scholar] [CrossRef]
  18. Yu Mochenov, S.; Churkina, A.I.; Sabrekov, S.F.; Glagolev, M.V.; Il’Yasov, D.V.; Terentieva, I.E.; Maksyutov, S.S. Soils in seasonally flooded forests as methane sources: A case study of West Siberian South taiga. IOP Conf. Ser. Earth Environ. Sci. 2018, 138, 012012. [Google Scholar] [CrossRef]
  19. Schneider, J.; Ťupek, B.; Lukasheva, M.; Gudyrev, V.; Miglovets, M.; Jungkunst, H.F. Methane emissions from paludified boreal soils in European Russia as measured and modelled. Ecosystems 2017, 21, 827–838. [Google Scholar] [CrossRef]
  20. Masyagina, O.V.; Menyailo, O.V. The impact of permafrost on carbon dioxide and methane fluxes in Siberia: A meta-analysis. Environ. Res. 2020, 182, 109096. [Google Scholar] [CrossRef]
  21. Feng, H.; Guo, J.; Han, M.; Wang, W.; Peng, C.; Jin, J.; Song, X.; Yu, S. A review of the mechanisms and controlling factors of methane dynamics in forest ecosystems. For. Ecol. Manag. 2020, 455, 117702. [Google Scholar] [CrossRef]
  22. Gatica, G.; Fernández, M.E.; Juliarena, M.P.; Gyenge, J. Environmental and anthropogenic drivers of soil methane fluxes in forests: Global patterns and among-biomes differences. Glob. Chang. Biol. 2020, 26, 6604–6615. [Google Scholar] [CrossRef]
  23. Kirpotin, S.N.; Callaghan, T.V.; Peregon, A.M.; Babenko, A.S.; Berman, D.I.; Bulakhova, N.A.; Byzaakay, A.A.; Chernykh, T.M.; Chursin, V.; Interesova, E.A.; et al. Impacts of environmental change on biodiversity and vegetation dynamics in Siberia. Ambio 2021, 50, 1926–1952. [Google Scholar] [CrossRef] [PubMed]
  24. Kharuk, V.I.; Ponomarev, E.I.; Ivanova, G.A.; Dvinskaya, M.L.; Coogan, S.C.P.; Flannigan, M.D. Wildfires in the Siberian taiga. Ambio 2021, 50, 1953–1974. [Google Scholar] [CrossRef] [PubMed]
  25. Filippova, N.V.; Bulyonkova, T.M. The diversity of larger fungi in the vicinities of Khanty-Mansiysk (middle taiga of West Siberia). Environ. Dyn. Glob. Clim. Chang. 2017, 8, P13–P24. [Google Scholar] [CrossRef]
  26. Dabros, A.; Pyper, M.; Castilla, G. Seismic lines in the boreal and arctic ecosystems of North America: Environmental impacts, challenges, and opportunities. Environ. Rev. 2018, 26, 214–229. [Google Scholar] [CrossRef] [Green Version]
  27. Fang, H.J.; Yu, G.R.; Cheng, S.L.; Zhu, T.H.; Wang, Y.S.; Yan, J.H.; Wang, M.; Cao, M.; Zhou, M. Effects of multiple environmental factors on CO2 emission and CH4 uptake from old-growth forest soils. Biogeosciences 2010, 7, 395–407. [Google Scholar] [CrossRef] [Green Version]
  28. Liu, L.; Estiarte, M.; Peñuelas, J. Soil moisture as the key factor of atmospheric CH4 uptake in forest soils under environmental change. Geoderma 2019, 355, 113920. [Google Scholar] [CrossRef]
  29. Meier, I.C.; Leuschner, C.; Marini, E.; Fender, A.C. Species-specific effects of temperate trees on greenhouse gas exchange of forest soil are diminished by drought. Soil Biol. Biochem. 2016, 95, 122–134. [Google Scholar] [CrossRef]
  30. Walkiewicz, A.; Rafalska, A.; Bulak, P.; Bieganowski, A.; Osborne, B. How can litter modify the fluxes of CO2 and CH4 from forest soils? A mini-review. Forests 2021, 12, 1276. [Google Scholar] [CrossRef]
  31. Hanson, R.S.; Hanson, T.E. Methanotrophic bacteria. Microbiol. Rev. 1996, 60, 439–471. [Google Scholar] [CrossRef]
  32. Trotsenko, Y.A.; Murrell, J.C. Metabolic aspects of aerobic obligate methanotrophy. Adv. Appl. Microbiol. 2008, 63, 183–229. [Google Scholar] [PubMed]
  33. Chistoserdova, L.; Lidstrom, M.E. Aerobic Methylotrophic Prokaryotes. In The Prokaryotes: Prokaryotic Physiology and Biochemistry; Springer: Berlin/Heidelberg, Germany, 2013; pp. 267–285. ISBN 9783642301414. [Google Scholar]
  34. Khmelenina, V.N.; Colin Murrell, J.; Smith, T.J.; Trotsenko, Y.A. Physiology and Biochemistry of the Aerobic Methanotrophs. In Aerobic Utilization of Hydrocarbons, Oils, and Lipids; Springer: Cham, Switzerland, 2019; pp. 1–25. [Google Scholar]
  35. Dedysh, S.N.; Knief, C. Diversity and Phylogeny of Described Aerobic Methanotrophs. In Methane Biocatalysis: Paving the Way to Sustainability; Springer: Cham, Switzerland, 2018; pp. 17–42. [Google Scholar]
  36. Knief, C. Diversity and habitat preferences of cultivated and uncultivated aerobic methanotrophic bacteria evaluated based on pmoA as molecular marker. Front. Microbiol. 2015, 6, 1346. [Google Scholar] [CrossRef] [PubMed] [Green Version]
  37. Dunfield, P.F. The Soil Methane Sink. In Greenhouse Gas Sinks; eBook: Athenaeum Press Ltd.: Gateshead, UK, 2007; pp. 152–170. [Google Scholar]
  38. Kolb, S. The quest for atmospheric methane oxidizers in forest soils. Environ. Microbiol. Rep. 2009, 1, 336–346. [Google Scholar] [CrossRef]
  39. Holmes, A.J.; Roslev, P.; McDonald, I.R.; Iversen, N.; Henriksen, K.; Murrell, J.C. Characterization of methanotrophic bacterial populations in soils showing atmospheric methane uptake. Appl. Environ. Microbiol. 1999, 65, 3312–3318. [Google Scholar] [CrossRef] [Green Version]
  40. Knief, C.; Lipski, A.; Dunfield, P.F. Diversity and activity of methanotrophic bacteria in different upland soils. Appl. Environ. Microbiol. 2003, 69, 6703–6714. [Google Scholar] [CrossRef] [Green Version]
  41. Henckel, T.; Jäckel, U.; Schnell, S.; Conrad, R. Molecular analyses of novel methanotrophic communities in forest soil that oxidize atmospheric methane. Appl. Environ. Microbiol. 2000, 66, 1801–1808. [Google Scholar] [CrossRef] [PubMed] [Green Version]
  42. Jensen, S.; Holmes, A.J.; Olsen, R.A.; Murrell, J.C. Detection of methane oxidizing bacteria in forest soil by monooxygenase PCR amplification. Microb. Ecol. 2000, 39, 282–289. [Google Scholar]
  43. Kolb, S.; Knief, C.; Dunfield, P.F.; Conrad, R. Abundance and activity of uncultured methanotrophic bacteria involved in the consumption of atmospheric methane in two forest soils. Environ. Microbiol. 2005, 7, 1150–1161. [Google Scholar] [CrossRef] [PubMed]
  44. Degelmann, D.M.; Borken, W.; Drake, H.L.; Kolb, S. Different atmospheric methane-oxidizing communities in european beech and norway spruce soils. Appl. Environ. Microbiol. 2010, 10, 3228–3235. [Google Scholar] [CrossRef] [Green Version]
  45. Dörr, N.; Glaser, B.; Kolb, S. Methanotrophic communities in brazilian ferralsols from naturally forested, afforested, and agricultural Sites. Appl. Environ. Microbiol. 2010, 76, 1307–1310. [Google Scholar] [CrossRef] [Green Version]
  46. Cai, Y.; Zhou, X.; Shi, L.; Jia, Z. Atmospheric methane oxidizers are dominated by Upland Soil Cluster Alpha in 20 forest soils of China. Microb. Ecol. 2020, 80, 859–871. [Google Scholar] [CrossRef] [PubMed]
  47. Pratscher, J.; Vollmers, J.; Wiegand, S.; Dumont, M.G.; Kaster, A.K. Unravelling the identity, metabolic potential and global biogeography of the atmospheric methane-oxidizing upland soil cluster α. Environ. Microbiol. 2018, 20, 1016–1029. [Google Scholar] [CrossRef] [PubMed] [Green Version]
  48. Tveit, A.T.; Hestnes, A.G.; Robinson, S.L.; Schintlmeister, A.; Dedysh, S.N.; Jehmlich, N.; von Bergen, M.; Herbold, C.; Wagner, M.; Richter, A.; et al. Widespread soil bacterium that oxidizes atmospheric methane. Proc. Natl. Acad. Sci. USA 2019, 10, 589. [Google Scholar] [CrossRef] [Green Version]
  49. Hutchinson, G.L.; Mosier, A.R. Improved soil cover method for field measurement of nitrous oxide fluxes. Soil Sci. Soc. Am. J. 1981, 45, 311–316. [Google Scholar] [CrossRef]
  50. Milliken, G.; Johnson, D. Analysis of Messy Data-Volume 1: Designed Experiments; CRC Press: Boca Raton, FL, USA, 1992. [Google Scholar]
  51. Gohl, D.; Gohl, D.M.; MacLean, A.; Hauge, A.; Becker, A.; Walek, D.; Beckman, K.B. An optimized protocol for high-throughput amplicon-based microbiome profiling. Protoc. Exch. 2016. [Google Scholar] [CrossRef]
  52. Caporaso, J.; Kuczynski, J.; Stombaugh, J. QIIME allows analysis of high-throughput community sequencing data. Nat. Methods 2010, 7, 335–336. [Google Scholar] [CrossRef] [PubMed] [Green Version]
  53. Callahan, B.J.; McMurdie, P.J.; Rosen, M.J.; Han, A.W.; Johnson, A.J.A.; Holmes, S.P. DADA2: High-resolution sample inference from Illumina amplicon data. Nat. Methods 2016, 13, 581–583. [Google Scholar] [CrossRef] [Green Version]
  54. Rognes, T.; Flouri, T.; Nichols, B.; Quince, C.; Mahé, F. VSEARCH: A versatile open source tool for metagenomics. PeerJ 2016, 4, e2584. [Google Scholar] [CrossRef]
  55. Quast, C.; Pruesse, E.; Yilmaz, P.; Gerken, J.; Schweer, T.; Yarza, P.; Peplies, J.; Glöckner, F.O. The SILVA ribosomal RNA gene database project: Improved data processing and web-based tools. Nucleic Acids Res. 2013, 41, D590–D596. [Google Scholar] [CrossRef]
  56. Anderson, M.J. A new method for non-parametric multivariate analysis of variance. Austral Ecol. 2001, 26, 32–46. [Google Scholar]
  57. Holmes, A.J.; Costello, A.; Lidstrom, M.E.; Murrell, J.C. Evidence that participate methane monooxygenase and ammonia monooxygenase may be evolutionarily related. FEMS Microbiol. Lett. 1995, 132, 203–208. [Google Scholar] [CrossRef] [PubMed]
  58. Bourne, D.G.; McDonald, I.R.; Murrell, J.C. Comparison of pmoA PCR primer sets as tools for investigating methanotroph diversity in three Danish soils. Appl. Environ. Microbiol. 2001, 67, 3802–3809. [Google Scholar] [CrossRef] [Green Version]
  59. Dumont, M.G.; Lüke, C.; Deng, Y.; Frenzel, P. Classification of pmoA amplicon pyrosequences using BLAST and the lowest common ancestor method in MEGAN. Front. Microbiol. 2014, 5, 34. [Google Scholar] [CrossRef]
  60. Wen, X.; Yang, S.; Liebner, S. Evaluation and update of cutoff values for methanotrophic pmoA gene sequences. Arch. Microbiol. 2016, 198, 629–636. [Google Scholar] [CrossRef] [Green Version]
  61. Sabrekov, A.F.; Semenov, M.V.; Terent’eva, I.E.; Litti, Y.V.; Il’yasov, D.V.; Glagolev, M.V. The link between soil methane oxidation rate and abundance of methanotrophs estimated by quantitative PCR. Microbiology 2020, 89, 182–191. [Google Scholar] [CrossRef]
  62. Crill, P. Seasonal patterns of methane uptake and carbon dioxide release by a temperate woodland soil. Glob. Biogeochem. Cycles 1991, 5, 319–334. [Google Scholar] [CrossRef]
  63. Ullah, S.; Moore, T.R. Biogeochemical controls on methane, nitrous oxide, and carbon dioxide fluxes from deciduous forest soils in eastern Canada. J. Geophys. Res. Biogeosci. 2011, 116, 3010. [Google Scholar] [CrossRef] [Green Version]
  64. Liu, X.P.; Zhang, W.J.; Hu, C.S.; Tang, X.G. Soil greenhouse gas fluxes from different tree species on Taihang Mountain, North China. Biogeosciences 2014, 11, 1649–1666. [Google Scholar] [CrossRef] [Green Version]
  65. Borken, W.; Beese, F. Methane and nitrous oxide fluxes of soils in pure and mixed stands of European beech and Norway spruce. Eur. J. Soil Sci. 2006, 57, 617–625. [Google Scholar] [CrossRef]
  66. Christiansen, J.R.; Gundersen, P. Stand age and tree species affect N2O and CH4 exchange from afforested soils. Biogeosciences 2011, 8, 2535–2546. [Google Scholar] [CrossRef] [Green Version]
  67. Reay, D.S.; Radajewski, S.; Murrell, J.C.; McNamara, N.; Nedwell, D.B. Effects of land-use on the activity and diversity of methane oxidizing bacteria in forest soils. Soil Biol. Biochem. 2001, 33, 1613–1623. [Google Scholar] [CrossRef]
  68. Christiansen, J.R.; Gundersen, P.; Frederiksen, P.; Vesterdal, L. Influence of hydromorphic soil conditions on greenhouse gas emissions and soil carbon stocks in a Danish temperate forest. For. Ecol. Manag. 2012, 284, 185–195. [Google Scholar] [CrossRef]
  69. Täumer, J.; Kolb, S.; Boeddinghaus, R.S.; Wang, H.; Schöning, I.; Schrumpf, M.; Urich, T.; Marhan, S. Divergent drivers of the microbial methane sink in temperate forest and grassland soils. Glob. Chang. Biol. 2021, 27, 929–940. [Google Scholar] [CrossRef] [PubMed]
  70. Whalen, S.C.; Reeburgh, W.S.; Barber, V.A. Oxidation of methane in boreal forest soils: A comparison of seven measures. Biogeochemistry 1992, 16, 181–211. [Google Scholar] [CrossRef] [Green Version]
  71. Kawamoto, K.; Moldrup, P.; Schjønning, P.; Iversen, B.V.; Komatsu, T.; Rolston, D.E. Gas transport parameters in the vadose zone: Development and tests of power-law models for air permeability. Vadose Zone J. 2006, 5, 1205–1215. [Google Scholar] [CrossRef]
  72. Moldrup, P.; Deepagoda, T.K.K.C.; Hamamoto, S.; Komatsu, T.; Kawamoto, K.; Rolston, D.E.; Jonge, L.W. de Structure-dependent water-induced linear reduction model for predicting gas diffusivity and tortuosity in repacked and intact soil. Vadose Zone J. 2013, 12, vzj2013-01. [Google Scholar]
  73. Lind, S.E.; Virkajärvi, P.; Hyvönen, N.P.; Maljanen, M.; Kivimäenpää, M.; Jokinen, S.; Antikainen, S.; Latva, M.; Räty, M.; Martikainen, P.J.; et al. Carbon dioxide and methane exchange of a perennial grassland on a boreal mineral soil. Boreal Environ. Res. 2020, 25, 1–17. [Google Scholar]
  74. Bender, M.; Conrad, R. Kinetics of CH4 oxidation in oxic soils exposed to ambient air or high CH4 mixing ratios. FEMS Microbiol. Ecol. 1992, 10, 261–269. [Google Scholar] [CrossRef]
  75. Pratscher, J.; Dumont, M.G.; Conrad, R. Assimilation of acetate by the putative atmospheric methane oxidizers belonging to the USCα clade. Environ. Microbiol. 2011, 13, 2692–2701. [Google Scholar] [CrossRef]
  76. Göttlein, A.; Matzner, E. Microscale heterogeneity of acidity related stress-parameters in the soil solution of a forested cambic podzol. Plant Soil 1997, 192, 95–105. [Google Scholar] [CrossRef]
  77. Lange, B.; Lüescher, P.; Germann, P.F. Significance of tree roots for preferential infiltration in stagnic soils. Hydrol. Earth Syst. Sci. 2009, 13, 1809–1821. [Google Scholar] [CrossRef] [Green Version]
  78. Bundt, M.; Widmer, F.; Pesaro, M.; Zeyer, J.; Blaser, P. Preferential flow paths: Biological “hot spots” in soils. Soil Biol. Biochem. 2001, 33, 729–738. [Google Scholar] [CrossRef]
  79. Llado, S.; Lopez-Mondejar, R.; Baldrian, P. Forest soil bacteria: Diversity, involvement in ecosystem processes, and response to global change. Microbiol. Mol. Biol. Rev. 2017, 81, e00063-16. [Google Scholar] [CrossRef] [Green Version]
  80. Brofft, J.E.; McArthur, J.V.; Shimkets, L.J. Recovery of novel bacterial diversity from a forested wetland impacted by reject coal. Environ. Microbiol. 2002, 4, 764–769. [Google Scholar] [CrossRef] [PubMed]
  81. Ivanova, A.A.; Zhelezova, A.D.; Chernov, T.I.; Dedysh, S.N. Linking ecology and systematics of acidobacteria: Distinct habitat preferences of the Acidobacteriia and Blastocatellia in tundra soils. PLoS ONE 2020, 15, e0230157. [Google Scholar] [CrossRef] [PubMed] [Green Version]
  82. Nogales, B.; Moore, E.R.; Llobet-Brossa, E.; Rossello-Mora, R.; Amann, R.; Timmis, K.N. Combined use of 16S ribosomal DNA and 16S rRNA to study the bacterial community of polychlorinated biphenyl-polluted soil. Appl. Environ. Microbiol. 2001, 67, 1874–1884. [Google Scholar] [CrossRef] [PubMed] [Green Version]
  83. Bengtson, P.; Basiliko, N.; Dumont, M.G.; Hills, M.; Murrell, J.C.; Roy, R.; Grayston, S.J. Links between methanotroph community composition and CH4 oxidation in a pine forest soil. FEMS Microbiol. Ecol. 2009, 70, 356–366. [Google Scholar] [CrossRef] [PubMed] [Green Version]
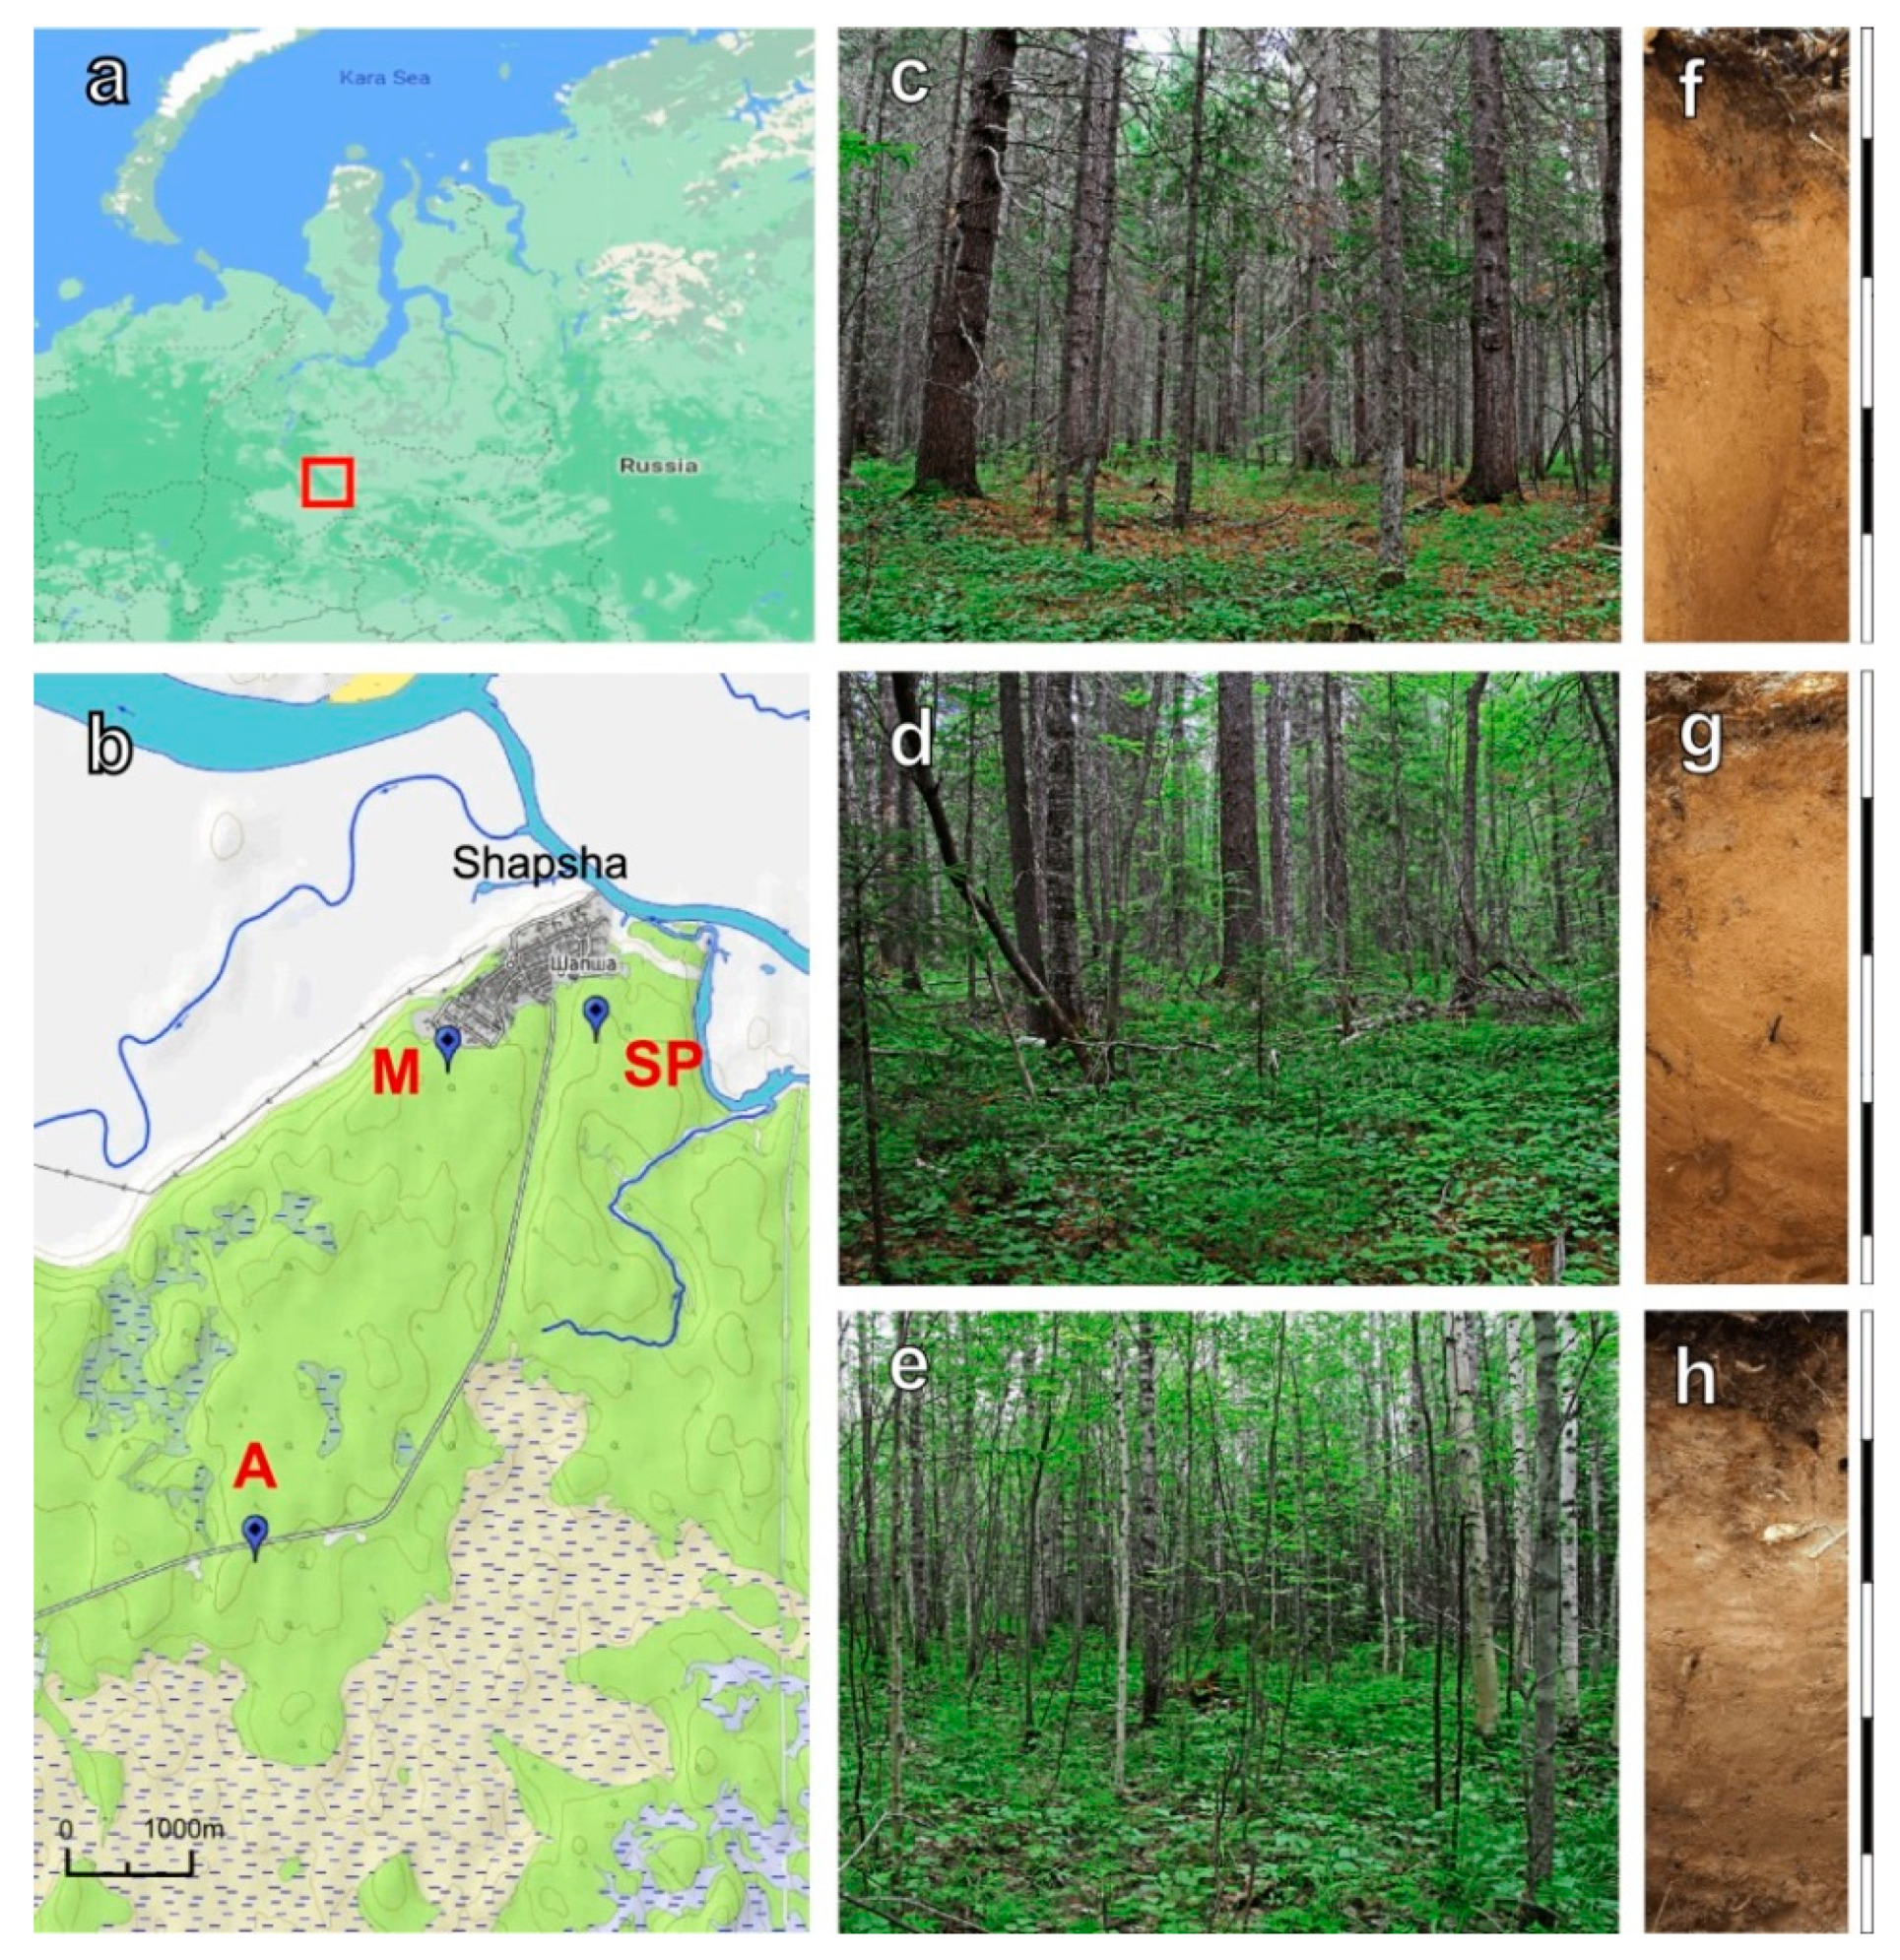
Figure 1. Location of the study sites (a,b). SP, Siberian pine forest; M, mixed forest; A, Aspen forest. Images of the studied forest ecosystems: (c) Siberian pine forest, (d) mixed forest, (e) Aspen forest, and the corresponding soil profiles (fh). Scale (in (fh)), 10 cm.
Forests 12 01738 g001
Figure 2. Methane flux variability on seasonal and local spatial (ecosystem) scales. Whiskers denote the 1st (lower) and the 3rd (upper) quartile. Significant differences between the groups (p < 0.05) are indicated by letters.
Forests 12 01738 g002
Figure 3. Power models fitted for soil CH4 oxidation rate versus water-filled pore space for all data and for each forest type separately. Outliers are denoted by red ellipse.
Forests 12 01738 g003
Figure 4. Depth-specific relationships between soil methane oxidation rate and (A) water-filled pore space, (B) methanotroph abundance, (C) soil methane concentration and (D) soluble NH4+ and NO3 content. Performance of models is presented in Table S3. Note the logarithmic scale of the X-axis (B,D).
Forests 12 01738 g004
Figure 5. Bacteria community composition in soils of the three forest sites according to the results of Illumina-based sequencing of 16S rRNA genes. The composition is displayed at the phylum level with the only exception of the Proteobacteria, which are displayed at the level of classes. The relative abundance values represent averages of four replicate data sets.
Forests 12 01738 g005
Figure 6. (A) Heatmap of the relative abundance of methanotrophic bacteria displayed according to the proportion of the corresponding 16S rRNA gene fragments retrieved from each forest sample. (C) 16S rRNA gene-based tree showing the phylogenetic position of OTUs identified in this study; I, Beijerinckiaceae; II, Methylocystaceae; III, Methylococcaceae. (B) The Venn diagram showing distribution of 16S rRNA gene-based OTUs of methanotrophs between different forest types.
Forests 12 01738 g006
Figure 7. (A) pmoA-based maximum-likelihood tree showing the phylogenetic position of sequences retrieved from three different forest soils to pmoA fragments from Candidatus Methyloaffinis lahnbergensis, “Methylocapsa gorgona” MG08 and some representatives of the family Beijerinckiaceae (shown in green), Methylocystaceae (blue) and Methylococcaceae (red). Circles of different sizes reflect the number of reads corresponding to particular OTUs. The scale bar corresponds to 0.1 substitutions per nucleotide position. (B) The Venn diagram comparing the number of pmoA-based OTUs identified by using two different primer sets.
Forests 12 01738 g007
Table 1. Soil properties of sampling plots (for the A horizon, 3–5 cm from the surface, values represent means ± SEM for 2 spatial replicates across all seasons).
Forest EcosystemCoordinatesBulk Density,
g cm−3
Litter Thickness, cmpHCorg, %NH4+,
µgN gDW−1
NO3,
µgN gDW−1
Aspen61.05623° N 69.42942° E0.84 ± 0.082 ± 15.8 ± 0.22.5 ± 0.47.1 ± 1.4121.0 ± 9.8
Siberian pine61.08571° N 69.46918° E0.99 ± 0.051 ± 15.1 ± 0.21.4 ± 0.412.9 ± 6.193.2 ± 23.6
Mixed61.08301° N 69.45383° E1.05 ± 0.061 ± 15.4 ± 0.21.8 ± 0.39.8 ± 3.9151.4 ± 68.9
Table 2. Variance (omega-squared) in methane flux, soil oxidation rate and their environmental controls explained by season, ecosystem and depth in 3-way ANOVA and significance of differences found.
ParameterSeasonEcosystemDepth
Flux0.72 ***0.03 **NM
CH4 oxidation rate0.29 ***NS0.48 ***
Soil moisture (by volume)0.46 ***0.05 ***0.08 ***
Water-filled pore space0.27 ***0.03 **0.39 ***
CH4 concentration0.25 ***0.02 **0.45 ***
Soil Temperature0.90 ***0.01 ***0.05 ***
pHNS0.17 **NS
NH4+0.24 **NS0.16 **
NO30.40 ***0.12 **NS
Methanotrophs abundance a0.04 *NS0.53 ***
* p < 0.05, ** p < 0.01, *** p < 0.001, NS, not significant; NM, not measured. a Data on methanotroph abundance are taken from the earlier published study [61].
Table 3. Major operational taxonomic units (OTUs) of 16S rRNA gene sequences revealed in the three forest ecosystems.
OTU IDRelative
Abundance (%)
TaxonomyClosest Silva MatchHabitat
Siberian Pine ForestSF-16S-15.71Bradyrhizobium sp. 175LB2PYPTHQ698291Root nodules of Acacia pycnantha
SF-16S-23.92Uncultured WD260 group of GammaproteobacteriaEU150272Boreal pine forest soil
SF-16S-33.02Uncultured RCP2-54 bacteriumDQ451494Forest soil
SF-16S-42.75Uncultured WD260 group of GammaproteobacteriaEU150268Soil from Niwot Ridge LTER
SF-16S-52.73Mycobacterium celatum MB72AJ416914AIDS patients
SF-16S-62.58Acidobacteriales (Sd 1) unculturedHQ598256Woodland soil
SF-16S-72.43Acidobacteriales (Sd 1) unculturedFJ624925Boreal pine forest soil
SF-16S-82.29Acidobacteriales (Sd 1) unculturedAY963436Soil of evergreen broad-leaved forest
SF-16S-92.13Bradyrhizobium sp.JX644393Earthworm nephridia
SF-16S-102.13Acidobacteriae (Sd 2) unculturedFJ466148Acidic fen soil
Mixed ForestMF-16S-16.22Bradyrhizobium sp. 175LB2PYPTHQ698291Root nodules of Acacia pycnantha
MF-16S-25.43Solirubrobacteraceae unculturedHM270154Tobacco rhizosphere
MF-16S-32.54Uncultured WD260 group of GammaproteobacteriaEU150268Soil from Niwot Ridge LTER
MF-16S-42.02Mycobacterium sp. MPLK-65KX689762Subterranean mine
MF-16S-51.80Uncultured WD260 group of GammaproteobacteriaAB991083Temperate highland grassland
MF-16S-61.79Mycobacterium celatum MB72AJ416914AIDS patients
MF-16S-71.27Conexibacter sp. unculturedHM263196Grassland soil
MF-16S-81.09Xanthobacteraceae unculturedAY963361Poplar tree rhizosphere
MF-16S-91.01Roseiarcus sp.AY425766Tobacco rhizosphere
MF-16S-100.99Uncultured WD260 group of GammaproteobacteriaEU150272Boreal pine forest soil
Aspen ForestAF-16S-19.10Bradyrhizobium sp. 175LB2PYPTHQ698291Root nodules of Acacia pycnantha
AF-16S-23.86Mycobacterium sp. MPLK-65KX689762Subterranean mine
AF-16S-33.15Uncultured WD260 group of GammaproteobacteriaAB991083Temperate highland grassland
AF-16S-42.91Mycobacterium celatum MB72AJ416914AIDS patients
AF-16S-52.32Uncultured WD260 group of GammaproteobacteriaEU150268Soil from Niwot Ridge LTER
AF-16S-61.67Acidobacteriae (Sd 2) unculturedAY963303Soil of evergreen broad-leaved forest
AF-16S-71.58Roseiarcus sp.AY425766Tobacco rhizosphere
AF-16S-81.39Mycobacterium conspicuum JCM14738X88922Patients with disseminated infections
AF-16S-91.35Granulicella sp.JN023575Temperate highland grassland
AF-16S-101.32Solirubrobacteraceae unculturedKM200386Tobacco rhizosphere
Publisher’s Note: MDPI stays neutral with regard to jurisdictional claims in published maps and institutional affiliations.