
Recent Warming-Induced Tree Growth Enhancement at the Tibetan Treeline and the Link to Improved Water-Use Efficiency


1
State Key Laboratory of Vegetation and Environmental Change, Institute of Botany, Chinese Academy of Sciences, Beijing 100093, China
2
College of Resources and Environment, University of Chinese Academy of Sciences, Beijing 100190, China
3
Key Laboratory of Sustainable Forest Ecosystem Management, School of Forestry, Northeast Forestry University, Ministry of Education, Harbin 150040, China
*
Author to whom correspondence should be addressed.
Forests 2021, 12(12), 1702; https://doi.org/10.3390/f12121702
Submission received: 8 November 2021
/
Revised: 1 December 2021
/
Accepted: 2 December 2021
/
Published: 4 December 2021
(This article belongs to the Special Issue Carbon-Water Relationships of the Forest Ecosystem under a Changing Climate)
Abstract
:Tree growth in high-elevation forests may increase as a result of increasing temperatures and CO2 concentrations in the atmosphere (Ca). However, the pattern and the physiological mechanism on how these two factors interact to affect tree growth are still poorly understood. Here, we analyzed the temporal changes in radial growth and tree-ring δ13C for Picea and Abies trees growing in both treeline and lower-elevation forests on the Tibetan Plateau. We found that the tree growth at the treeline has significantly accelerated during the past several decades but has remained largely stable or slightly declined at lower elevations. Further results based on tree-ring δ13C suggest that intrinsic water-use efficiency (iWUE) was generally higher at the treeline than in lower-elevation forests, although increasing trends of iWUE existed for all sites. This study demonstrated that the synergetic effects of elevated Ca and increasing temperatures have increased tree growth at the treeline but may not lead to enhanced tree growth in lower-elevation forests due to drought stress. These results demonstrate the elevational dependence of tree growth responses to climatic changes in high-elevation forests from a physiologically meaningful perspective.
1. Introduction
Increases in carbon dioxide (CO2) concentrations in the atmosphere (Ca) and increasing temperatures have significantly affected tree physiology, growth, and forest productivity [1,2,3]. However, predictions on how these changes will affect forest dynamics are not easy. Many other confounding factors, such as drought and elevation, also play a role in determining the processes and patterns of the response of forests to these climatic changes. In particular, elevation gradients, along with which both temperature and precipitation tend to change [4], provide a natural laboratory in which the effects of tree growth and the underlying physiological basis can be explored in a broad climate domain [5,6,7].
Along an elevation gradient, the variability of tree growth and intrinsic water-use efficiency (iWUE) in response to increasing Ca has been explored and shows complex patterns [7,8,9]. On the one hand, a drought-induced decline of tree growth at lower elevations was reported in many other regions, although an increasing trend of iWUE also occurred [10,11,12]. On the other hand, tree growth has accelerated because of warming and Ca increases in many other high-elevation forests [13,14,15]. Therefore, more altitudinal surveys of radial growth variation and tree physiological responses to increased Ca and climatic warming are needed to better understand the mechanisms that regulate tree growth.
Tree rings offer valuable information on physiological and growth changes over time [16,17]. Changes in δ13C can be used to reflect the variability in stomatal conductance (gs), photosynthetic rate (A) and iWUE [16,18]. The basal area increment (BAI) can be used as a reliable indicator to assess the trend of tree growth [19].
Here, we measured the BAI and cellulose δ13C for tree rings from Picea and Abies trees growing at the treeline and in the lower-elevation forests on the Tibetan Plateau. Our research purposes were to infer any growth trends of trees around 1970 and reveal how increasing temperatures and Ca interact to affect tree growth at the treeline as well as lower elevation. Based on the fact that trees growing at the high-elevation cold and humid treelines are more sensitive to increasing temperature, whereas trees growing on relatively dry and lower elevation are limited by moisture availability [14,20], we hypothesize that (i) tree growth is significantly enhanced at the treeline but remains stable or decreases in lower-elevation forests experiencing warming-related drought stress; and (ii) iWUE will be higher in lower-elevation forests than at the treeline because of higher drought stress.
2. Materials and Methods
2.1. Site Conditions and Field Sampling
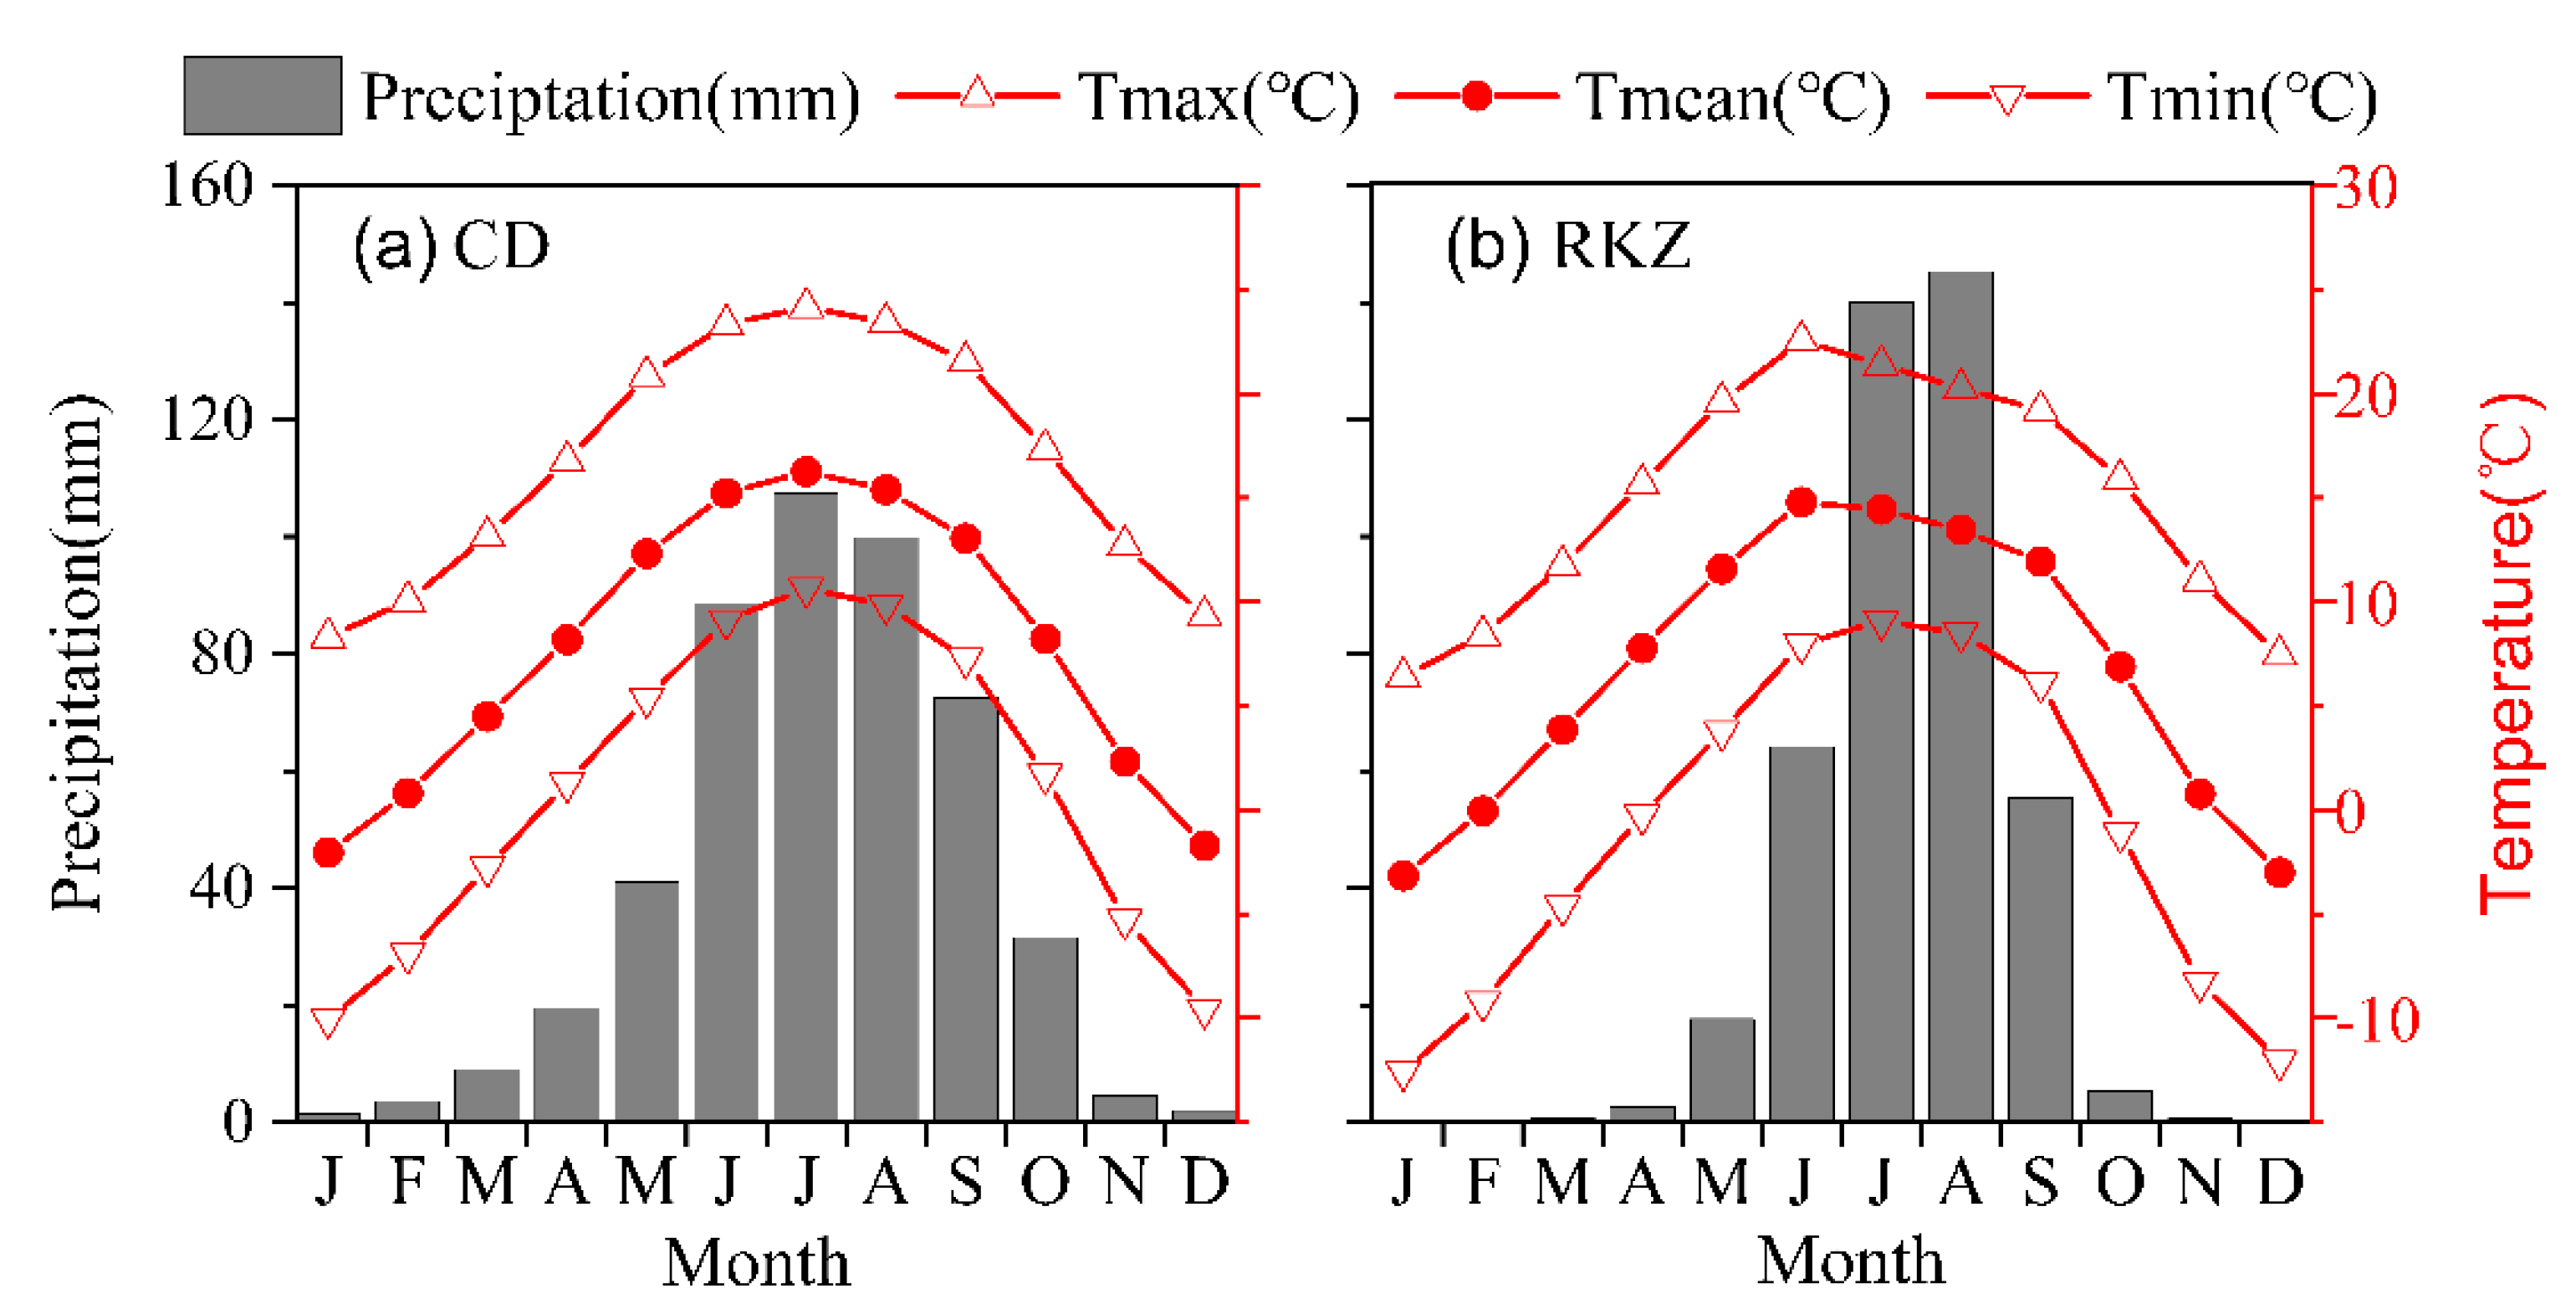
The two sites at the treeline as well as the lower-elevation forests, i.e., the Gubailin (GBL, 4450~4530 m) and the Dingjie (DJ, 3380~3920 m) are located in Changdu and Dingjie Counties, respectively, on the Tibetan Plateau (Figure 1), where the climate is mainly affected by the Indian summer monsoon during the summer and by westerlies during the winter. According to the instrumental records over the period 1955–2014 from the nearest meteorological stations, the monthly mean temperature ranges from −1 °C in January to 17 °C in July, the total annual precipitation was 432–481 mm with most falling in the summer, and the annual mean relative humidity was 42–50% (Figure 2).
The investigated tree species included Picea likiangensis var. rubescens Rehder & E.H.Wilson and Abies spectabibis (D. Don) Mirb. for GBL and DJ, respectively. At GBL, P. likiangensis var. rubescens forms pure forest stands on shady or semi-shady slopes, while at DJ A. spectabibis is the dominant tree species mixed with other broad-leaf tree species at their lower elevations, and they exist as a pure forest at the treeline.
A horizontal plot, with a width of 30 m and a length of 60 m along the contour of the slope, was set up for each treeline as well as the lower-elevation forest. Within each plot, all the big trees with diameters no less than 10 cm at breast height were cored, one core per tree at breast height. At GBL, we sampled a total of 62 spruce trees, including 29 trees from the treeline (GBLU) and 33 from the lower-elevation forest (GBLD). At DJ, we cored 32 fir trees, including 19 trees at the treeline (DJU) and 13 trees from the lower-elevation forest (DJD) (Table 1). A total of 94 tree cores were sampled from two treelines and lower-elevation forests (Table 1).
2.2. Tree-Ring Width Methods
The tree-ring cores were air-dried indoors, mounted on wooden slots, and polished until the tree-ring boundaries became clearly visible. Subsequently, tree rings of each sample were cross-dated by comparing the ring patterns among samples. The cross-dated tree-ring widths were then measured using a LINTAB 6 system at a resolution of 0.001 mm. COFECHA software was used to quality control the cross-dating [21]. To resolve the problem of biological decline with tree age or tree diameter and to detect tree growth changes, tree-ring width was converted into the basal area increase (BAI, cm2 per year) parameter, as proposed by Phipps and Whiton (1988).
where n is the year of tree-ring formation and R is the radius of the tree at year n. The calculation of BAI was performed using the R package dplR [22].
BAI = π × (R2n − R2n − 1)
2.3. Tree-Ring δ13C Methods
Five cores that had clear ring boundaries and an absence of missing rings were selected from different trees in each forest stand. The annual rings from the five samples were then pooled by year to produce a single composite isotope series for each forest stand. To avoid the effect of juvenile wood on the carbon isotope ratios, tree rings with a cambial age of less than 50 years were excluded from the isotopic analysis [23]. The wood materials were then ground with a centrifugal mill to ensure homogeneity and efficiency of α-cellulose extraction. We extracted the wood cellulose of the annual tree rings following regular methods [24]. To maximize the homogeneity of the α-cellulose, we used an ultrasound unit in a hot water bath (JY92-2D, Scientz Industry, Ningbo, China) to disrupt the cellulose at 30 °C [25]. The α-cellulose was then freeze-dried for 72 h using a vacuum freeze dryer (Labconco Corporation, Kansas City, MO, USA) prior to isotope analysis. The δ13C values were determined by an element analyzer (Flash EA 1112; Bremen, Germany) coupled with an isotope-ratio mass spectrometer (Delta-plus, Thermo Electron Corporation, Bremen, Germany) at the State Key Laboratory of Vegetation and Environmental Change, Institute of Botany Chinese Academy of Sciences. The analytical errors (SD) of the isotope measurements were less than 0.05‰ for δ13C. Calibration was performed by measuring the International Atomic Energy Agency (IAEA) USGS-24 (graphite) and by measuring IAEA-CH3 (cellulose). All δ13C values were expressed relative to their respective standard (Vienna Pee Dee Belemnite for carbon isotopes) and calculated as follows:
where R = 13C/12C, and Rsample and Rstandard are the R values of the samples and the standard, respectively.
δ13C = [(Rsample/Rstandard) − 1] × 1000‰
The ring carbon isotope fractionation sequence was then calculated using the following equations [18]:
where 13Cp and 13Ca are the 13C value of δ13C and the CO2 value of plant photosynthetic products, respectively. The concentrations of CO2 in the leaves and CO2 in the atmosphere were Ci and Ca, respectively. a and b represent the CO2 in isotope fractionation during stomatal (4.4‰) carbon isotope fractionation and the RuBP enzyme carboxylation process (27‰), respectively. δ13Ca and Ca were taken from McCarroll and Loader (2004) merged with measurements (http://cdiac.ornl.gov/trends/co2/sio-mlo.html, accessed on 20 May 2020).
∆13C = (13Ca − 13Cp)/(1 + 13Cp/1000)
Ci/Ca = (∆13C − a)/(b − a)
Then, iWUE could be estimated using Ci and Ca according to Ehleringer (1993):
where 1.6 is the ratio of diffusivities of water and CO2 in air, which is considered to be feasible to a wide range of plant species and across a great environmental range.
iWUE = A/gs = (Ca − Ci)/1.6
2.4. Climate Variables
In addition to the climate records obtained from the nearest stations, we calculated or retrieved some other climate variables in this study. Vapor pressure deficit (VPD), i.e., the difference between the saturation vapor pressure (es) and the actual vapor pressure (ea), is a major driver of stomatal activity [26]. We calculated the VPD according to the following equation:
where es = 0.611 × 10 [17.27 × T/(237.3 + T)] and ea = (RH/100) × es. T is the monthly mean air temperature, and RH is the monthly mean relative humidity.
VPD = es − ea
Additionally, we obtained the standardized precipitation–evapotranspiration index (SPEI) data from the CRU (Climate Research Unit, University of East Anglia) TS Version 4.01 (http://climexp.knmi.nl, accessed on 1 May 2020) to represent the water conditions of the studied forests.
Furthermore, the temporal trends of the monthly climate variables were tested using linear regression models. In recent decades, the annual mean temperature has shown an increasing trend in the study area, while precipitation has shown a minor decreasing trend or no obvious trend (Supplementary Figure S1).
2.5. Growth–Climate Relationships
To assess the climate–growth relationships, Pearson’s correlation coefficients were calculated between BAI and tree-ring isotopes and monthly climate variables from September of the previous year to October of the current year for the recent decades. A piecewise structural equation meta-model (pSEM) was used to test the regulators of tree growth change at the treeline and in the lower-elevation forests by using the piecewiseSEM package [27] in R 4.0.4.
3. Results
3.1. Long-Term Trend of Tree Growth
In general, the BAI was lower at the treeline than at the lower elevations over the study period, but the GBL has been lower in recent decades (Figure 3a,b). After 1970, the BAI of GBLU and DJU increased significantly, at rates of 0.06 and 0.08 cm2 per year, respectively, but the BAI values generally showed a slight increasing trend, at a rate of 0.03 per decade in GBLD. From 1970 to 2006, the BAI decreased significantly (Figure 3a,b).
3.2. Cellulose Stable Isotopes
In general, tree-ring Δ13C was lower at the treeline than at the lower elevations during the study period (Figure 3c,d). However, the iWUE increased dramatically over the study period in both treeline and lower-elevation forests (Figure 3e,f). In addition, the absolute values of iWUE were higher at the treeline than in lower-elevation forests (Figure 3e,f).
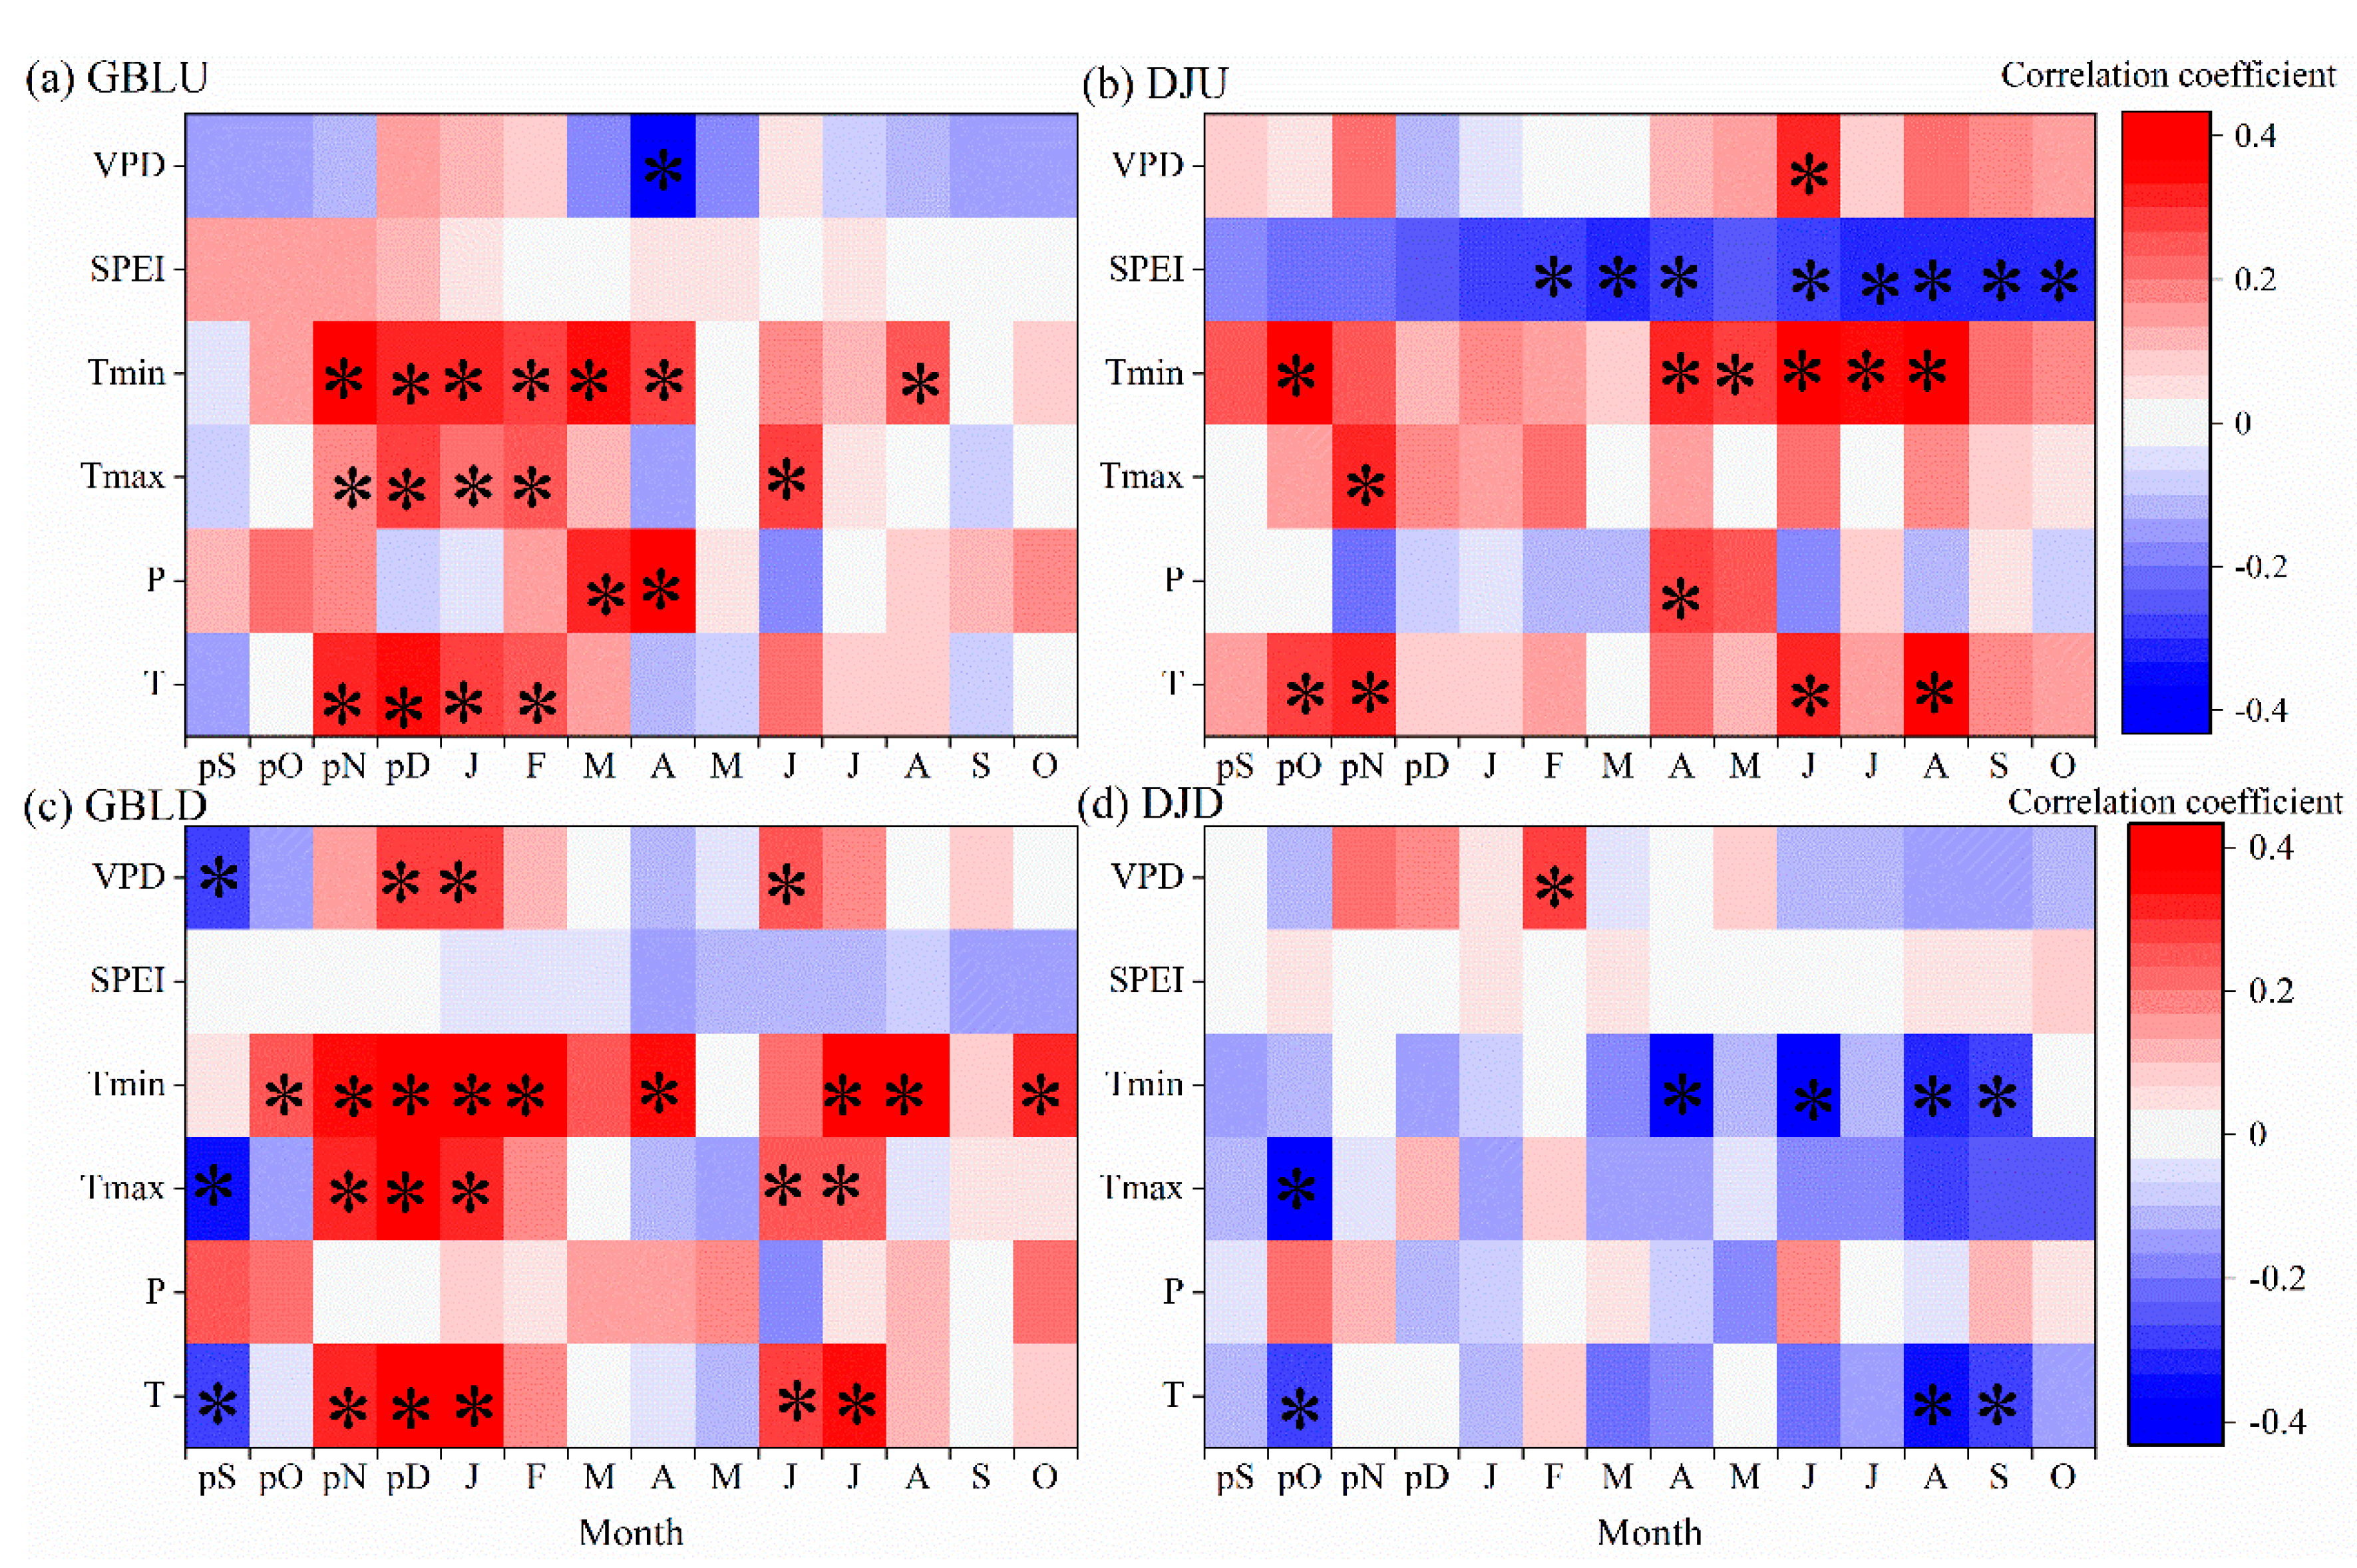
3.3. Tree Growth–Climate Relationships
Similar growth–climate relationships were observed between the treeline and the lower-elevation forest at GBL. The temperatures of the previous winter to the current spring were found to be positively correlated with tree growth at GBLU, while the previous winter temperature and current summer temperature were positively correlated with tree growth in lower-elevation forests (GBLD); however, the previous September temperature was significantly and negatively correlated with tree growth (Figure 4).
At DJ, contrasting growth–climate relationships existed. April–August minimum temperature was most strongly correlated with tree growth at the treeline (DJU). However, the temperature showed opposing correlations with BAI during the spring and summer of tree-ring formation. Similarly, the positive effects of VPD at the treeline turned into negative effects in the lower-elevation forest at DJ (Figure 4).
3.4. Tree-Ring ∆ 13C Responses to Climate
The July–August temperature showed positive correlations with tree-ring isotopes at GBLD but not at the treeline (GBLU), where only negative but relatively weak correlations were found in April (Supplementary Figure S2). Temperature was generally negatively correlated with tree-ring ∆13C isotopes but reached a significant level only in June and April for minimum temperature at DJU. The positive correlations with VPD during the previous November suggest a negative correlation between tree-ring isotopes and drought at that time. Similar patterns were found between climate and tree-ring ∆13C at DJD but with clear seasonal differences (Supplementary Figure S2).
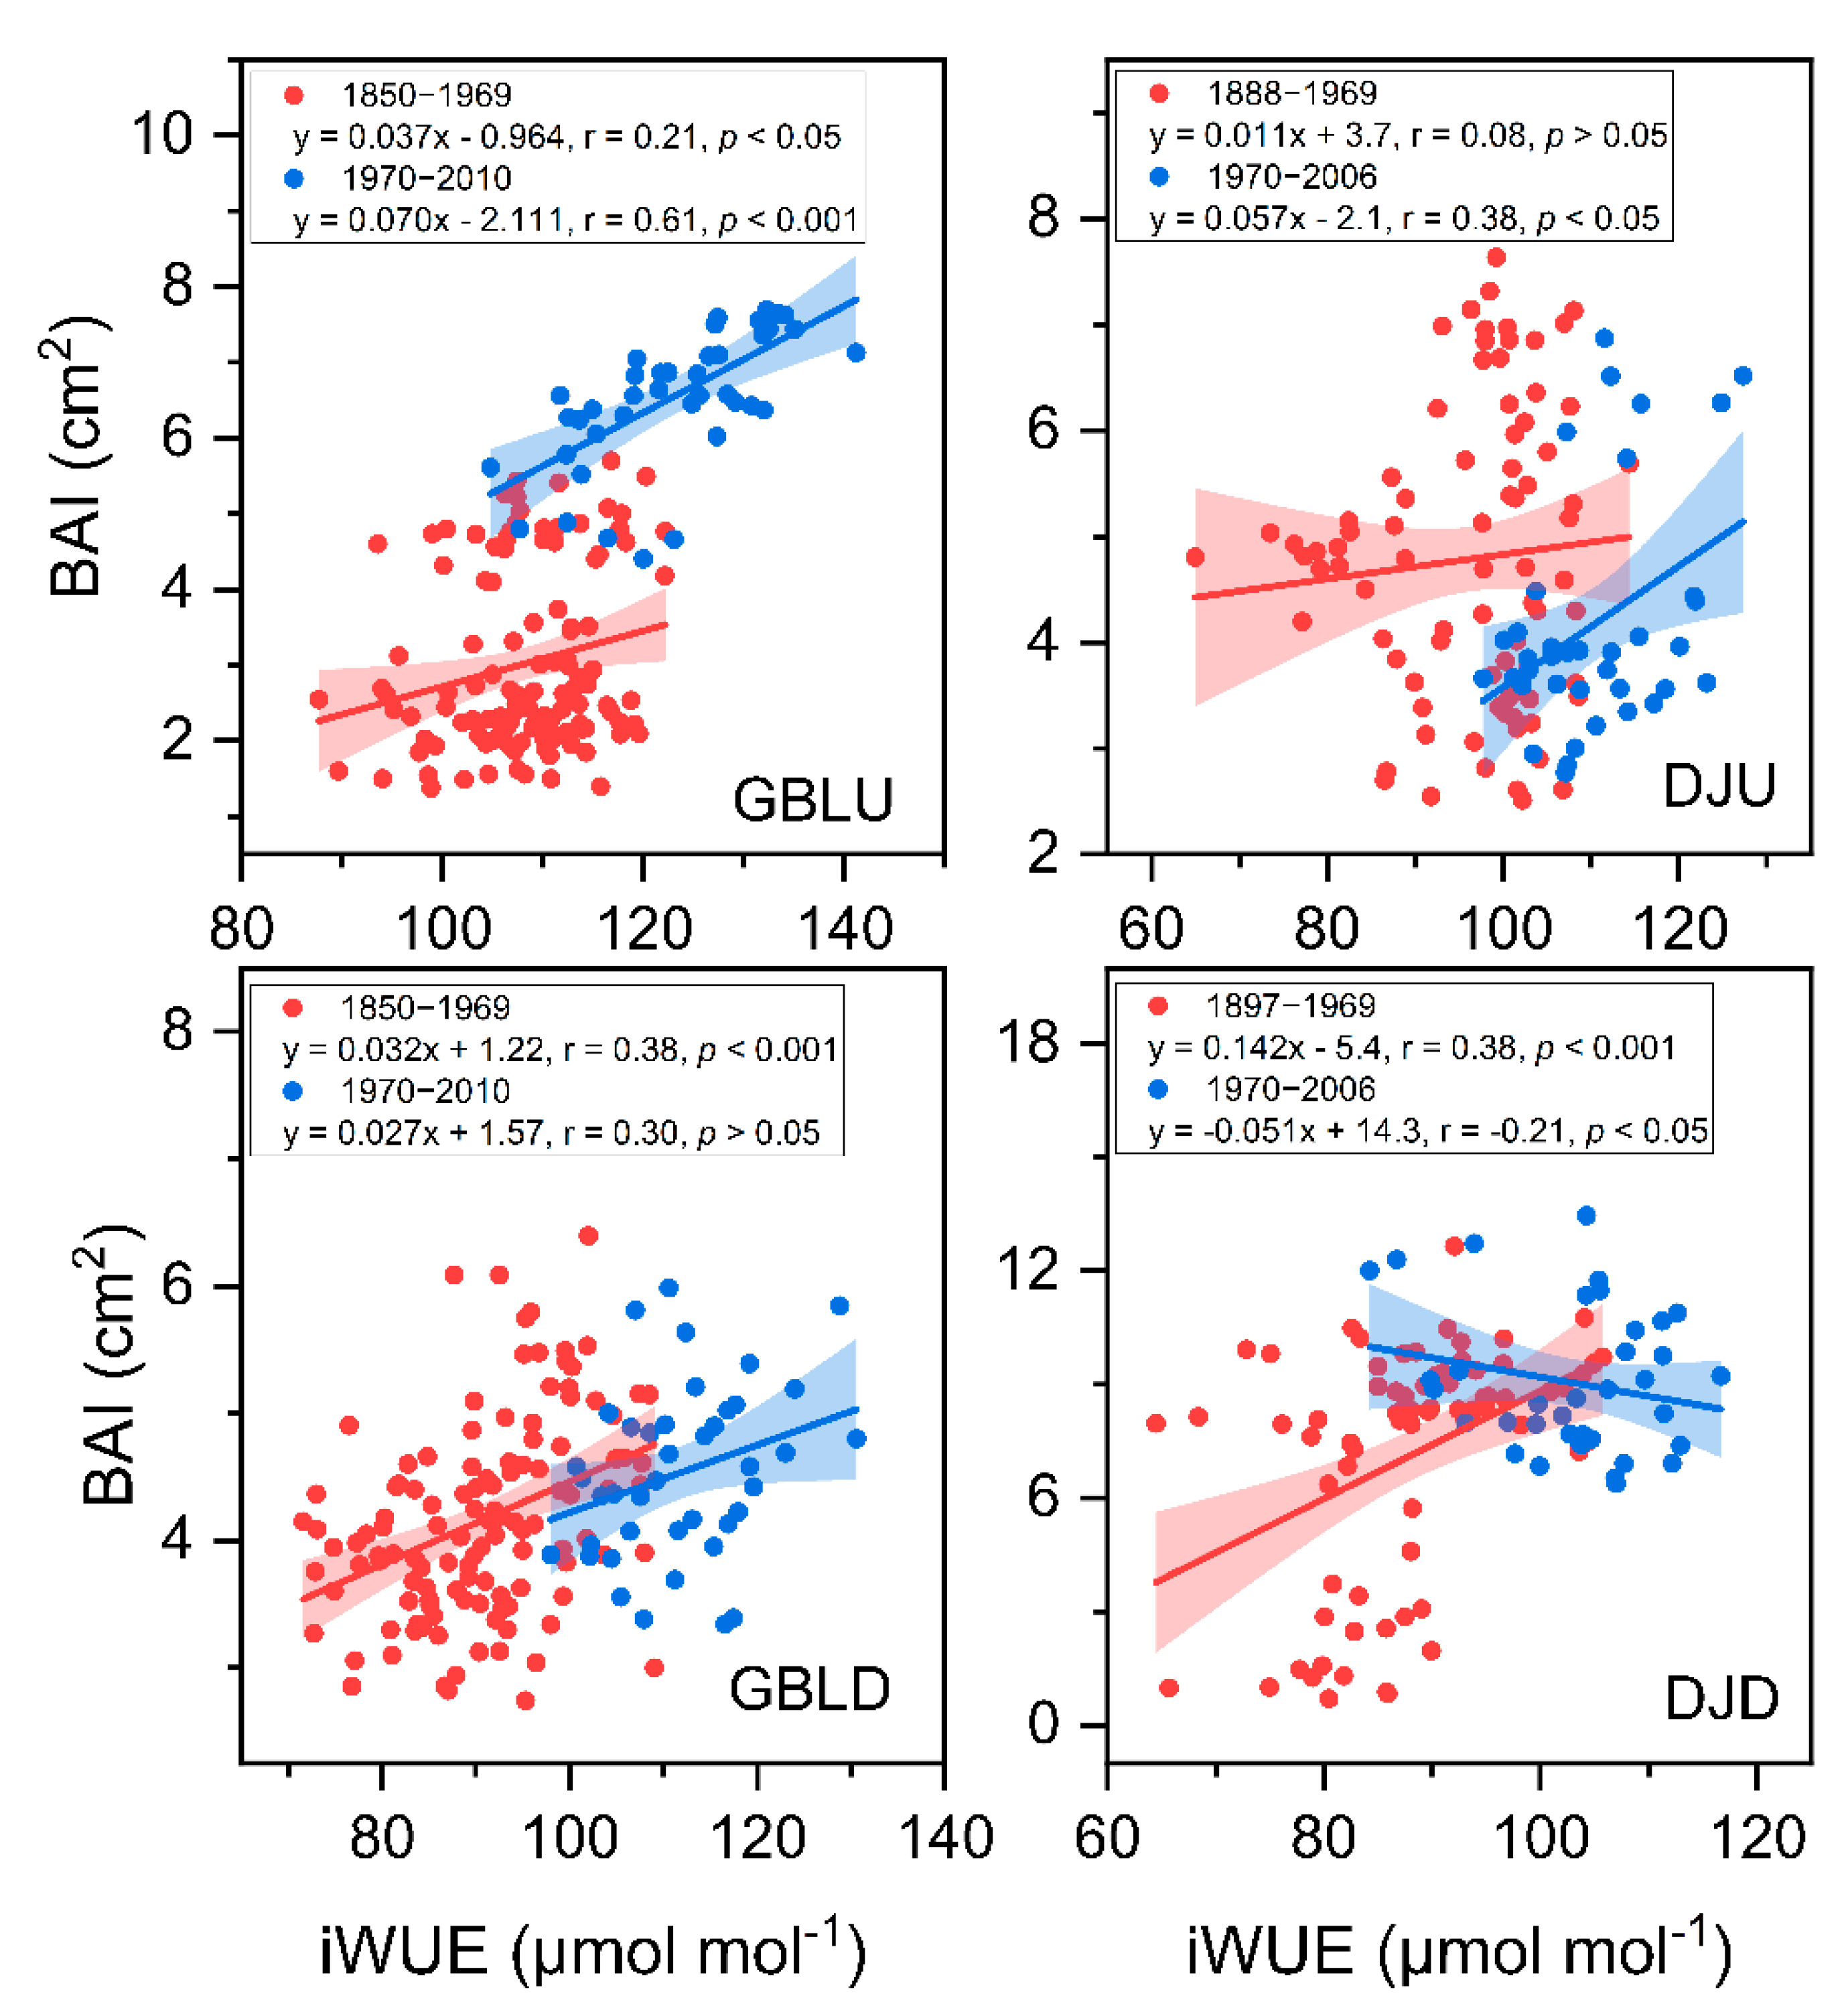
3.5. Factors Regulating the Variation in BAI and iWUE
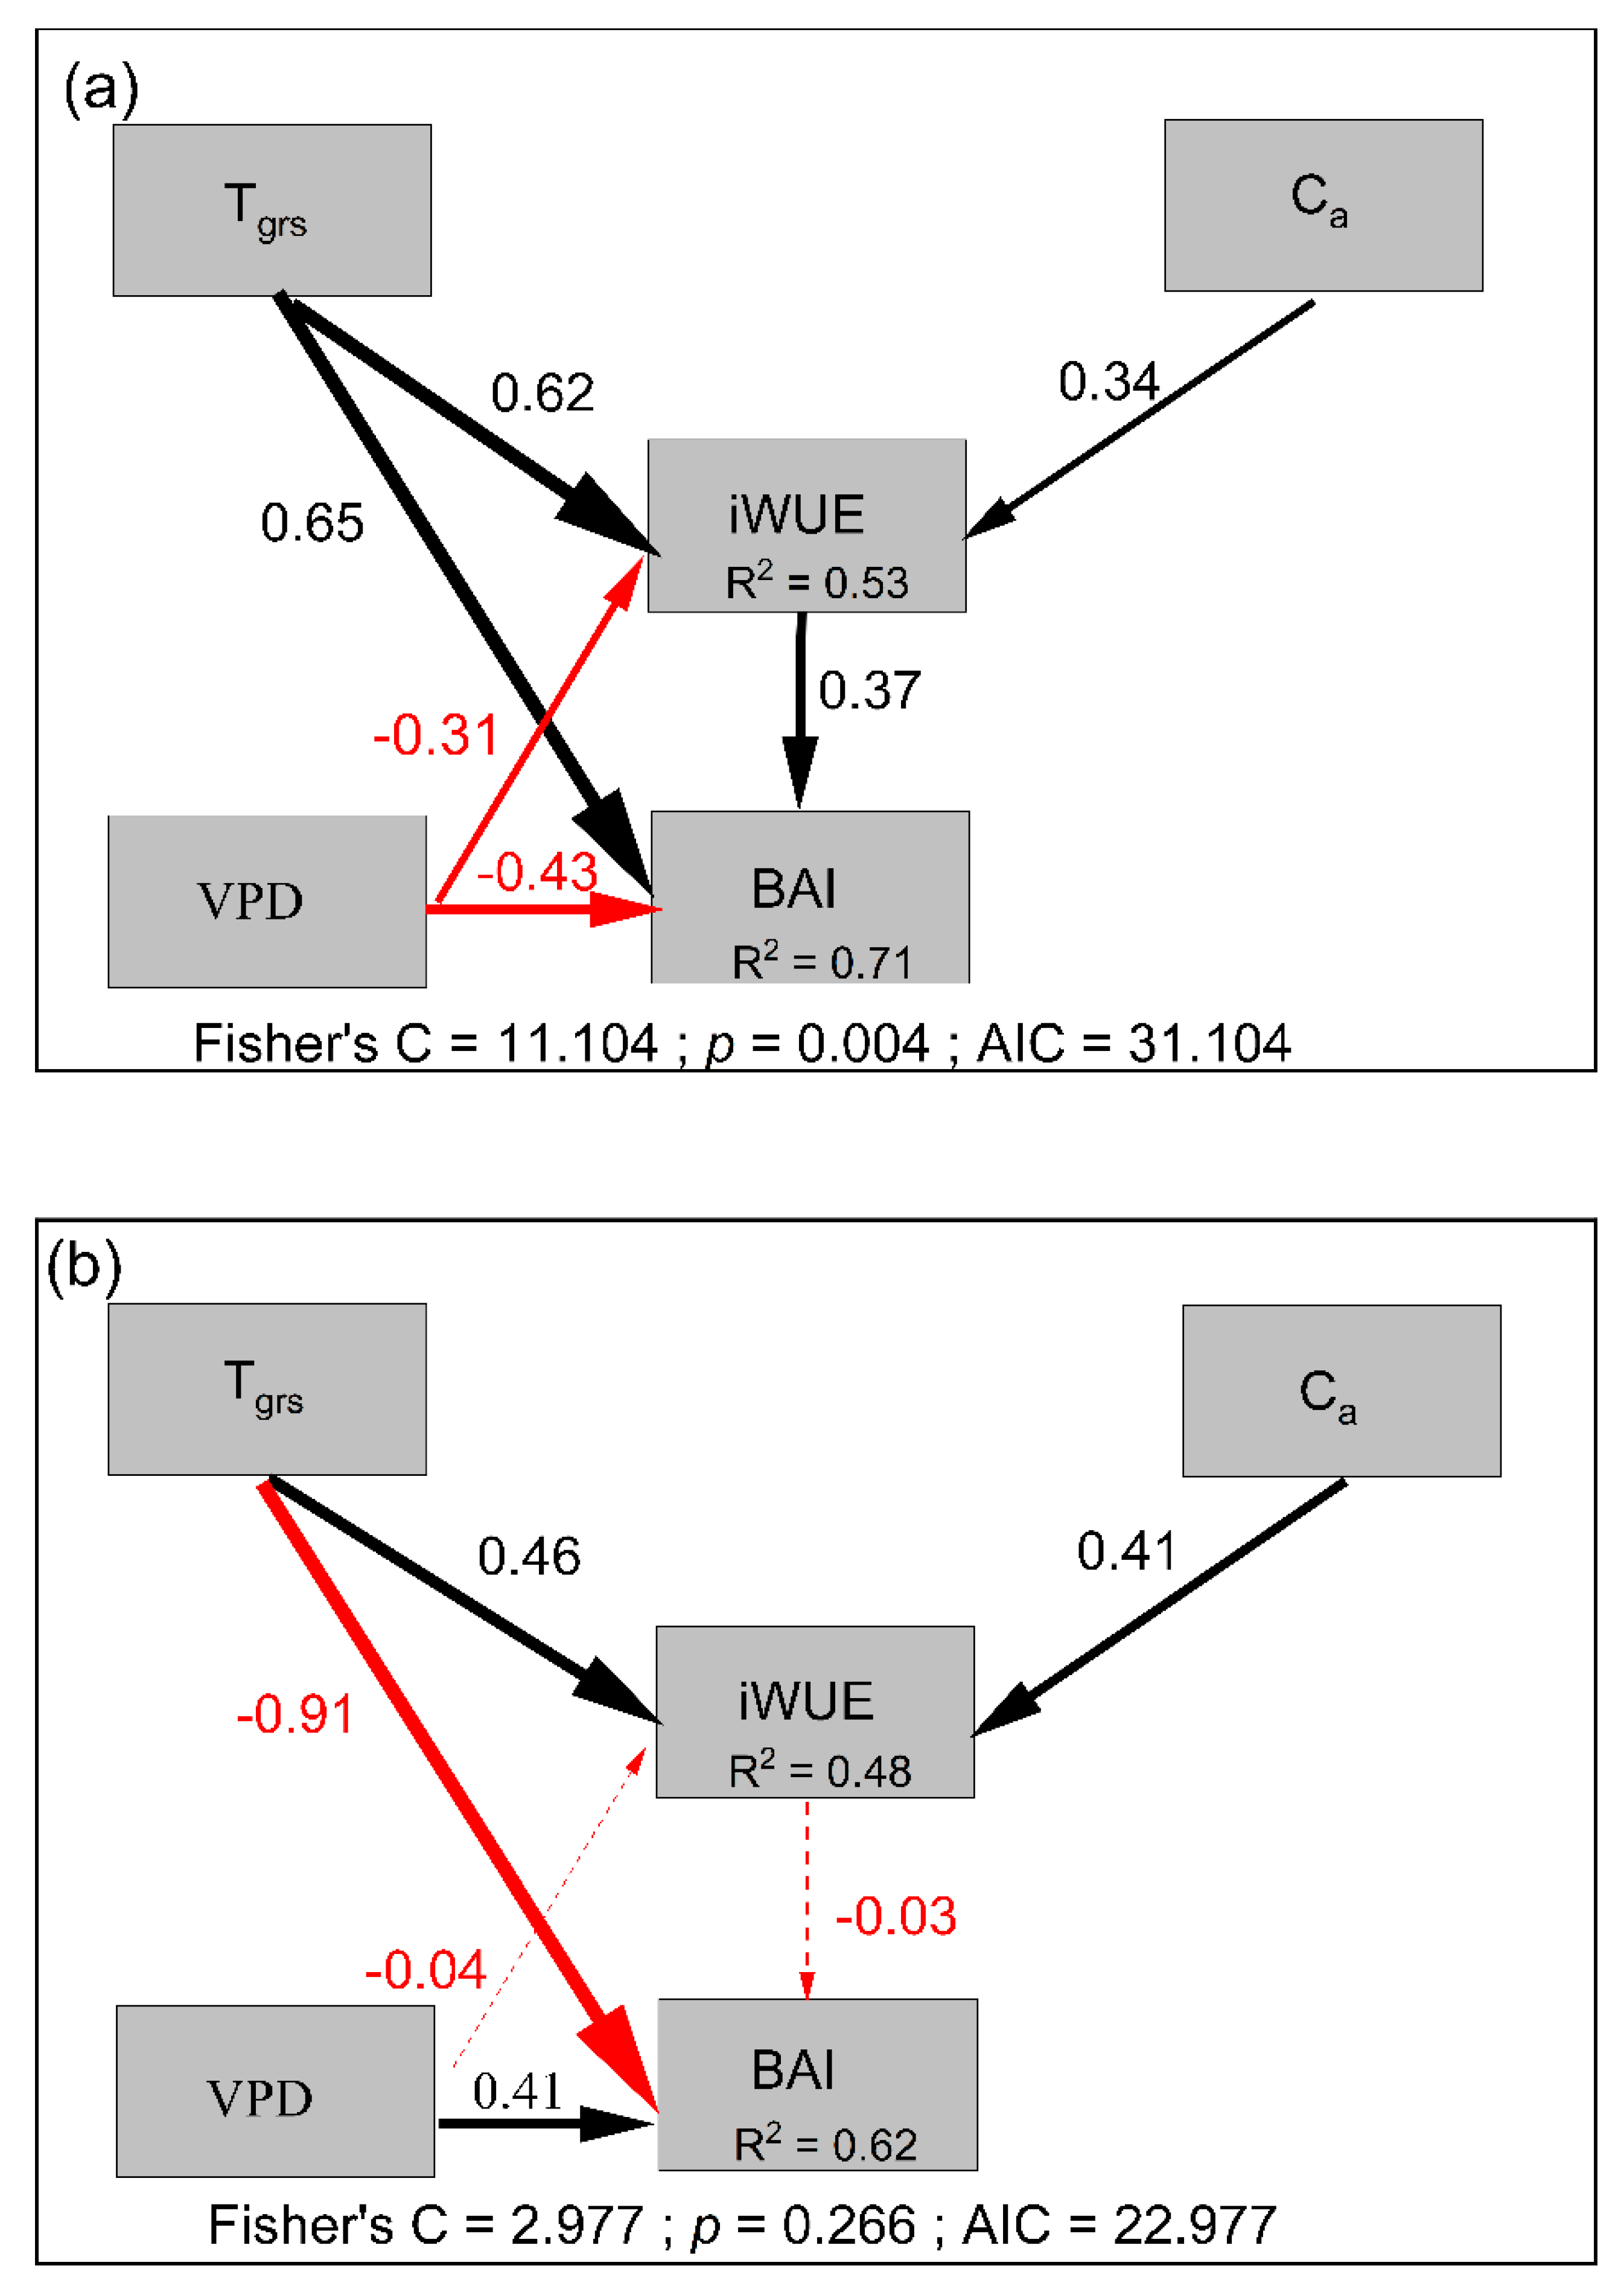
We assessed the relationship between the iWUE and BAI. The BAI decreased significantly or remained stable despite the iWUE significantly increasing at the lower-elevation sites (Figure 5). In contrast, the BAI at the treeline significantly increased as the iWUE increased (Figure 5). Considering the effects of factors on the BAI and iWUE (Table 2, Figure 6), the pSEM showed that Tgrs, VPD, Ca and iWUE had a good fit to tree radial growth, explaining 71% and 62% of the variation in the BAI in the treeline and the lower-elevation forests, respectively (Figure 6). iWUE was the dominant factor of tree radial growth and had a significantly positive effect on BAI at the treeline, and Ca (positively, +) and Tgrs (+) drove the patterns of iWUE (Figure 6a and Table 2). At the lower-elevation sites, although changes in iWUE were attributed to Tgrs and Ca (+), which had no positive effects on BAI, and changes in BAI were significantly and negatively correlated with Tgrs (Figure 6b and Table 2).
4. Discussion
4.1. Climate Effects on the BAI and the Tree-Ring Isotopes
In general, low temperature limitation on tree growth occurred for trees on both treelines. Nevertheless, high temperatures and water limitations were observed in the two lower-elevation forests (Figure 2). High temperatures increase evaporation and thus decrease soil water content and increase evaporation, hence reducing stomatal conductance, photosynthesis, and tree growth [28]. We found strong moisture limitation on tree growth at lower elevations, possibly due to the higher temperatures [29]. The weather conditions during the growing season played a dominant role in determining the variation in tree-ring δ13C. The stronger moisture signal reflected in Δ13C (Supplementary Figure S2) at the lower-elevation site than that at the treeline sites further indicated that trees suffered from more severe drought stress. In addition to soil moisture conditions, air dryness (as indicated by the VPD) directly controls the leaf intercellular CO2 concentration (Ci) and thereby governs Δ13C [30]. Drought stress because of a limited soil water availability and high atmospheric demand (VPD), which may inhibit xylogenesis directly by offsetting cellular metabolic activity and cell turgor [31,32] and indirectly as drought-induced stomatal closure limits photosynthesis and constrains the supply of carbohydrates [33,34]. Wood formation is expected to be more sink-limited under drier and colder environmental conditions than carbon assimilation [35]. A recent study found that the drivers of stem growth depend on a threshold turgor pressure [36].
Our results suggested a clear increasing trend of iWUE for all the forest stands (Figure 3). The piecewise structural equation meta-model (pSEM) further revealed that both CO2 concentration (Ca) and the growing season temperature (Tgrs) had a significant and positive effect on the increase in iWUE (Figure 6). The strong relationship between Ca and iWUE could be due to either the enhanced photosynthetic rate of trees [37,38,39] or decreased stomatal conductance, in the arid environment in particular, which could result in an increase in iWUE [40,41,42,43]. Moreover, growing season temperature showed higher influence on iWUE at the treeline than in lower-elevation forests (0.62 vs. 0.46), possibly due to the alleviation of low-temperature limitation at the treeline. Furthermore, the warming-related drought stress could be related to decreased stomatal conductance and thus increased iWUE [13,44,45,46]. However, VPD showed a negative effect on iWUE in this study, possibly due to the low-temperature limitation on tree growth at the treeline.
4.2. Enhanced Tree Growth Occurred in Treelines but Not in Lower-Elevation Forests
Our results showed significant growth enhancement of trees in treelines but not in lower-elevation forests (Figure 5), which is consistent with the expectation that treeline trees tend to increase at cold temperature limits in forests due to climatic warming [13,14,46,47]. In this study, increasing iWUE was also observed in lower-elevation forests, where tree growth showed a stable or decreasing trend. Among many potential reasons, a more severe moisture deficiency induced by increasing temperatures and evaporative demand in lower-altitude forests may limit tree growth the most [9,48]. Particularly in semiarid regions, intensified drought limitation may offset any benefit of higher iWUE for growth, which could be the reason for the negative relationship between BAI and iWUE [10,11].
Another interesting finding of this study is that the iWUE is generally higher for trees at treelines than for trees in lower-elevation forests (Figure 3). The iWUE significantly increased in all forest stands, and the lower-elevation site had consistently higher Δ13C and lower iWUE than the treelines during the study period. Therefore, the comparison between Δ13C and BAI further revealed that a higher iWUE was likely to be a result of the increased C assimilation rate rather than a decrease in stomatal conductance [49], suggesting that both the increasing temperature and CO2 fertilization may have favored recent forest growth at the treeline. High iWUE in relation to low Ci/Ca at high elevation is well known and likely related to complex adaptation of photosynthetic biochemistry, and CO2 assimilation rates become higher with increasing altitude from actual measures [50,51,52,53]. Conversely, recently changed iWUE and growth indicate that low-elevation trees could be passing into an isohydric trap in which water limitation begins to occur due to high water potentials under a long-term high evaporation demand [54]. These results indicate that treeline trees have a greater ability to cope with drought stress than do lower-elevation forests [55]. The underlying mechanism for this pattern has yet to be identified.
5. Conclusions
This study provides new evidence that tree growth at treelines increases with increasing temperatures and atmospheric CO2 concentrations. We also found that warming-induced drought limitation might cause reduced tree growth despite increasing iWUE at the lower-elevation sites. The combination of iWUE and BAI analysis further revealed a better ability of trees at treelines to benefit from climatic warming and increasing atmospheric CO2 concentrations compared to trees in lower-elevation forests. Our study provides new physiological evidence that treeline trees are likely to play an increasingly important role in CO2 uptake in the future. This study also demonstrates the potential of tree-ring isotopes in uncovering the mechanism underlying the differential response of tree growth across environmental gradients.
Supplementary Materials
The following are available online at https://www.mdpi.com/article/10.3390/f12121702/s1, Figure S1. Temporal variations in mean temperature (a), mean maximum temperature (b), mean minimum temperature (c), total precipitation (d), SPEI (e) and VPD (f). The regression trends and functions of each climatic variable in 1955–2013 were also provided. Figure S2. Pearson correlation coefficients between the Δ13C chronology and the climatic variables from September to October. * Significance level: p < 0.05. Figure S3. The piecewise structural equation meta-model (pSEM) proposed to test the influences of climatic factors on tree basal area increment (BAI) and water-use efficiency (iWUE) between the GBL (a) and DJ (b) plots for the two treelines as well as the lower-elevation forest in GBL and DJ after 1970. The numbers next to each arrow show the standardized regression coefficient (β) of each path (see Table 2 for detailed statistics). The thickness of arrows represents the strength of the effect, whereas the color represents the direction of the effect (red for negative and black for positive). Solid arrows represent a significant effect (p < 0.001), whereas dashed arrows represent a nonsignificant effect (p > 0.05). Abbreviations: Tgrs = growing season (from the current April to the current September) mean temperature; Ca = atmospheric CO2; VPD = growing season (from the current April to the current September) vapor pressure deficit.
Author Contributions
Conceptualization, X.P. and L.L.; data curation, X.P. and L.L.; methodology, X.P.; supervision, L.L.; writing—original draft, X.P. and L.L.; writing—review and editing, X.P., L.L. and X.W. All authors have read and agreed to the published version of the manuscript.
Funding
This research was funded by the Natural Science Foundation of China (grant numbers 41771060 and 31870460), the Open Grant for Key Laboratory of Sustainable Forest Ecosystem Management (Northeast Forestry University), the Ministry of Education (grant number KFJJ2019YB01) and the Second Tibetan Plateau Scientific Expedition and Research Program (grant number 2019QZKK0301).
Institutional Review Board Statement
Not applicable.
Informed Consent Statement
Not applicable.
Data Availability Statement
The data presented in this study are available on request from the corresponding author.
Acknowledgments
We are grateful to Qi-Bin Zhang for the insightful comments on the manuscript and his supervision on the research. We also want to thank Hongyan Qiu for her kind assistance on the crossdating of the tree-ring samples and Qi Zhang for assistance on preparing the tree-ring cellulose samples.
Conflicts of Interest
The authors declare no conflict of interest.
References
- Adams, M.A.; Buckley, T.N.; Turnbull, T.L. Diminishing CO2-driven gains in water-use efficiency of global forests. Nat. Clim. Change 2020, 10, 466–471. [Google Scholar] [CrossRef]
- Fernández-Martínez, M.; Sardans, J.; Chevallier, F.; Ciais, P.; Obersteiner, M.; Vicca, S.; Canadell, J.G.; Bastos, A.; Friedlingstein, P.; Sitch, S.; et al. Global trends in carbon sinks and their relationships with CO2 and temperature. Nat. Clim. Change 2019, 9, 73–79. [Google Scholar] [CrossRef] [Green Version]
- Peters, W.; van der Velde, I.R.; van Schaik, E.; Miller, J.B.; Ciais, P.; Duarte, H.F.; van der Laan-Luijkx, I.T.; van der Molen, M.K.; Scholze, M.; Schaefer, K.; et al. Increased water-use efficiency and reduced CO2 uptake by plants during droughts at a continental scale. Nat. Geosci. 2018, 11, 744–748. [Google Scholar] [CrossRef] [PubMed]
- Körner, C. The use of ‘altitude’ in ecological research. Trends Ecol. Evol. 2007, 22, 569–574. [Google Scholar] [CrossRef] [PubMed]
- McDowell, N.G.; Allen, C.D.; Marshall, L. Growth, carbon-isotope discrimination, and drought-associated mortality across a Pinus ponderosa elevational transect. Glob. Chang. Biol. 2010, 16, 399–415. [Google Scholar] [CrossRef]
- Panthi, S.; Fan, Z.-X.; van der Sleen, P.; Zuidema, P.A. Long-term physiological and growth responses of Himalayan fir to environmental change are mediated by mean climate. Glob. Chang. Biol. 2020, 26, 1778–1794. [Google Scholar] [CrossRef] [PubMed]
- Reed, C.C.; Ballantyne, A.P.; Cooper, L.A.; Sala, A. Limited evidence for CO2 -related growth enhancement in northern Rocky Mountain lodgepole pine populations across climate gradients. Glob. Chang. Biol. 2018, 24, 3922–3937. [Google Scholar] [CrossRef]
- Penuelas, J.; Hunt, J.M.; Ogaya, R.; Jump, A.S. Twentieth century changes of tree-ring delta C-13 at the southern range-edge of Fagus sylvatica: Increasing water-use efficiency does not avoid the growth decline induced by warming at low altitudes. Glob. Chang. Biol. 2008, 14, 1076–1088. [Google Scholar] [CrossRef] [Green Version]
- Quadri, P.; Silva, L.C.R.; Zavaleta, E.S. Climate-induced reversal of tree growth patterns at a tropical treeline. Sci. Adv. 2021, 7, eabb7572. [Google Scholar] [CrossRef]
- Andreu-Hayles, L.; Planells, O.; Gutierrez, E.; Muntan, E.; Helle, G.; Anchukaitis, K.J.; Schleser, G.H. Long tree-ring chronologies reveal 20th century increases in water-use efficiency but no enhancement of tree growth at five Iberian pine forests. Glob. Chang. Biol. 2011, 17, 2095–2112. [Google Scholar] [CrossRef]
- Gómez-Guerrero, A.; Silva, L.C.R.; Barrera-Reyes, M.; Kishchuk, B.; Velazquez-Martinez, A.; Martinez-Trinidad, T.; Plascencia-Escalante, F.O.; Horwath, W.R. Growth decline and divergent tree ring isotopic composition (13C and 18O) contradict predictions of CO2 stimulation in high altitudinal forests. Glob. Chang. Biol. 2013, 19, 1748–1758. [Google Scholar] [CrossRef]
- Wu, G.J.; Liu, X.H.; Chen, T.; Xu, G.B.; Wang, W.Z.; Zeng, X.M.; Zhang, X.W. Elevation-dependent variations of tree growth and intrinsic water-use efficiency in Schrenk spruce (Picea schrenkiana) in the western Tianshan Mountains, China. Front. Plant Sci. 2015, 6, 12. [Google Scholar] [CrossRef] [Green Version]
- Huang, R.; Zhu, H.F.; Liu, X.H.; Liang, E.Y.; Griessinger, J.; Wu, G.J.; Li, X.X.; Brauning, A. Does increasing intrinsic water use efficiency (iWUE) stimulate tree growth at natural alpine timberline on the southeastern Tibetan Plateau? Glob. Planet Chang. 2017, 148, 217–226. [Google Scholar] [CrossRef]
- Silva, L.C.R.; Sun, G.; Zhu-Barker, X.; Liang, Q.L.; Wu, N.; Horwath, W.R. Tree growth acceleration and expansion of alpine forests: The synergistic effect of atmospheric and edaphic change. Sci. Adv. 2016, 2, e1501302. [Google Scholar] [CrossRef] [PubMed] [Green Version]
- Qi, Z.H.; Liu, H.Y.; Wu, X.C.; Hao, Q. Climate-driven speedup of alpine treeline forest growth in the Tianshan Mountains, Northwestern China. Glob. Chang. Biol. 2015, 21, 816–826. [Google Scholar] [CrossRef]
- McCarroll, D.; Loader, N.J. Stable isotopes in tree rings. Quat. Sci. Rev. 2004, 23, 771–801. [Google Scholar] [CrossRef]
- Brienen, R.J.W.; Gloor, M.; Ziv, G. Tree demography dominates long-term growth trends inferred from tree rings. Glob. Chang. Biol. 2017, 23, 474–484. [Google Scholar] [CrossRef] [PubMed]
- Farquhar, G.D.; Ehleringer, J.R.; Hubick, K.T. Carbon Isotope Discrimination and Photosynthesis. Annu Rev. Plant. Phys. 1989, 40, 503–537. [Google Scholar] [CrossRef]
- Linares, J.C.; Camarero, J.J. From pattern to process: Linking intrinsic water-use efficiency to drought-induced forest decline. Glob. Chang. Biol. 2012, 18, 1000–1015. [Google Scholar] [CrossRef]
- Sigdel, S.R.; Wang, Y.F.; Camarero, J.J.; Zhu, H.F.; Liang, E.Y.; Penuelas, J. Moisture-mediated responsiveness of treeline shifts to global warming in the Himalayas. Glob. Chang. Biol. 2018, 24, 5549–5559. [Google Scholar] [CrossRef] [PubMed] [Green Version]
- Holmes, R.L.; Kozinn, W.P. Pneumonia and Bacteremia Associated with Hemophilus-Influenzae Serotype-D. J. Clin. Microbiol. 1983, 18, 730–732. [Google Scholar] [CrossRef] [PubMed] [Green Version]
- Bunn, A.G. A dendrochronology program library in R (dplR). Dendrochronologia 2008, 26, 115–124. [Google Scholar] [CrossRef]
- Leavitt, S.W. Tree-ring C-H-O isotope variability and sampling. Sci. Total Environ. 2010, 408, 5244–5253. [Google Scholar] [CrossRef]
- Loader, N.J.; Robertson, I.; Barker, A.C.; Switsur, V.R.; Waterhouse, J.S. An improved technique for the batch processing of small wholewood samples to alpha-cellulose. Chem Geol. 1997, 136, 313–317. [Google Scholar] [CrossRef]
- Laumer, W.; Andreu, L.; Helle, G.; Schleser, G.H.; Wieloch, T.; Wissel, H. A novel approach for the homogenization of cellulose to use micro-amounts for stable isotope analyses. Rapid Commun. Mass Spectrom. 2009, 23, 1934–1940. [Google Scholar] [CrossRef]
- Berninger, F.; Sonninen, E.; Aalto, T.; Lloyd, J. Modeling C-13 discrimination in tree rings. Glob. Biogeochem. Cycles 2000, 14, 213–223. [Google Scholar] [CrossRef]
- Lefcheck, J.S. PIECEWISESEM: Piecewise structural equation modelling in R for ecology, evolution, and systematics. Methods Ecol. Evol. 2016, 7, 573–579. [Google Scholar] [CrossRef]
- Brownlee, A.H.; Sullivan, P.F.; Csank, A.Z.; Sveinbjornsson, B.; Ellison, S.B.Z. Drought-induced stomatal closure probably cannot explain divergent white spruce growth in the Brooks Range, Alaska, USA. Ecology 2016, 97, 145–159. [Google Scholar] [CrossRef] [PubMed]
- Körner, C. Paradigm shift in plant growth control. Curr. Opin. Plant. Biol. 2015, 25, 107–114. [Google Scholar] [CrossRef]
- Farquhar, G.D.; Oleary, M.H.; Berry, J.A. On the Relationship between Carbon Isotope Discrimination and the Inter-Cellular Carbon-Dioxide Concentration in Leaves. Aust J. Plant Physiol 1982, 9, 121–137. [Google Scholar]
- Lautner, S. Wood Formation Under Drought Stress and Salinity; Springer: Berlin/Heidelberg, Germany, 2013; Volume 20, pp. 187–202. [Google Scholar]
- Adams, H.D.; Zeppel, M.J.B.; Anderegg, W.R.L.; Hartmann, H.; Landhausser, S.M.; Tissue, D.T.; Huxman, T.E.; Hudson, P.J.; Franz, T.E.; Allen, C.D.; et al. A multi-species synthesis of physiological mechanisms in drought-induced tree mortality. Nat. Ecol. Evol. 2017, 1, 1285–1291. [Google Scholar] [CrossRef] [PubMed]
- Choat, B.; Brodribb, T.J.; Brodersen, C.R.; Duursma, R.A.; Lopez, R.; Medlyn, B.E. Triggers of tree mortality under drought. Nature 2018, 558, 531–539. [Google Scholar] [CrossRef] [PubMed]
- Anderegg, W.R.L.; Wolf, A.; Arango-Velez, A.; Choat, B.; Chmura, D.J.; Jansen, S.; Kolb, T.; Li, S.; Meinzer, F.C.; Pita, P.; et al. Woody plants optimise stomatal behaviour relative to hydraulic risk. Ecol. Lett. 2018, 21, 968–977. [Google Scholar] [CrossRef] [PubMed] [Green Version]
- Cabon, A.; Fernandez-de-Una, L.; Gea-Izquierdo, G.; Meinzer, F.C.; Woodruff, D.R.; Martinez-Vilalta, J.; De Caceres, M. Water potential control of turgor-driven tracheid enlargement in Scots pine at its xeric distribution edge. New Phytol. 2020, 225, 209–221. [Google Scholar] [CrossRef]
- Peters, R.L.; Steppe, K.; Cuny, H.E.; De Pauw, D.J.W.; Frank, D.C.; Schaub, M.; Rathgeber, C.B.K.; Cabon, A.; Fonti, P. Turgor-a limiting factor for radial growth in mature conifers along an elevational gradient. New Phytol. 2021, 229, 213–229. [Google Scholar] [CrossRef] [PubMed]
- Guerrieri, R.; Belmecheri, S.; Ollinger, S.V.; Asbjornsen, H.; Jennings, K.; Xiao, J.; Stocker, B.D.; Martin, M.; Hollinger, D.Y.; Bracho-Garrillo, R.; et al. Disentangling the role of photosynthesis and stomatal conductance on rising forest water-use efficiency. Proc. Natl. Acad. Sci. USA 2019, 116, 16909–16914. [Google Scholar] [CrossRef] [Green Version]
- Liu, X.; Wang, W.; Xu, G.; Zeng, X.; Wu, G.; Zhang, X.; Qin, D. Tree growth and intrinsic water-use efficiency of inland riparian forests in northwestern China: Evaluation via delta C-13 and delta O-18 analysis of tree rings. Tree Physiol. 2014, 34, 966–980. [Google Scholar] [CrossRef] [Green Version]
- Mathias, J.M.; Thomas, R.B. Global tree intrinsic water use efficiency is enhanced by increased atmospheric CO(2) and modulated by climate and plant functional types. Proc. Natl. Acad. Sci. USA 2021, 118, e2014286118. [Google Scholar] [CrossRef] [PubMed]
- Liu, X.; Zhao, L.; Voelker, S.; Xu, G.; Zeng, X.; Zhang, X.; Zhang, L.; Sun, W.; Zhang, Q.; Wu, G.; et al. Warming and CO2 enrichment modified the ecophysiological responses of Dahurian larch and Mongolia pine during the past century in the permafrost of northeastern China. Tree Physiol. 2019, 39, 88–103. [Google Scholar] [CrossRef]
- Timofeeva, G.; Treydte, K.; Bugmann, H.; Rigling, A.; Schaub, M.; Siegwolf, R.; Saurer, M. Long-term effects of drought on tree-ring growth and carbon isotope variability in Scots pine in a dry environment. Tree Physiol. 2017, 37, 1028–1041. [Google Scholar] [CrossRef] [PubMed]
- Wang, W.Z.; McDowell, N.G.; Liu, X.H.; Xu, G.B.; Wu, G.J.; Zeng, X.M.; Wang, G.X. Contrasting growth responses of Qilian juniper (Sabina przewalskii) and Qinghai spruce (Picea crassifolia) to CO2 fertilization despite common water-use efficiency increases at the northeastern Qinghai-Tibetan plateau. Tree Physiol. 2021, 41, 992–1003. [Google Scholar] [CrossRef] [PubMed]
- Yang, T.; Yang, B.; Boucher, E.; Rossi, S. How did climate and CO2 concentration affect intrinsic water-use efficiency and tree growth in a semi-arid region of China? Trees 2021, 35, 769–781. [Google Scholar] [CrossRef]
- Hartl-Meier, C.; Zang, C.; Dittmar, C.; Esper, J.; Gottlein, A.; Rothe, A. Vulnerability of Norway spruce to climate change in mountain forests of the European Alps. Clim Res. 2014, 60, 119–132. [Google Scholar] [CrossRef]
- Lindner, M.; Maroschek, M.; Netherer, S.; Kremer, A.; Barbati, A.; Garcia-Gonzalo, J.; Seidl, R.; Delzon, S.; Corona, P.; Kolstrom, M.; et al. Climate change impacts, adaptive capacity, and vulnerability of European forest ecosystems. For. Ecol. Manag. 2010, 259, 698–709. [Google Scholar] [CrossRef]
- Salzer, M.W.; Hughes, M.K.; Bunn, A.G.; Kipfmueller, K.F. Recent unprecedented tree-ring growth in bristlecone pine at the highest elevations and possible causes. Proc. Natl. Acad. Sci. USA 2009, 106, 20348–20353. [Google Scholar] [CrossRef] [Green Version]
- Giammarchi, F.; Vacchiano, G.; Bertagnolli, A.; Ventura, M.; Panzacchi, P.; Cherubini, P.; Tonon, G. Effects of the lack of forest management on spatiotemporal dynamics of a subalpine Pinus cembra forest. Scand. J. For. Res. 2017, 32, 142–153. [Google Scholar] [CrossRef]
- McLane, S.C.; Daniels, L.D.; Aitken, S.N. Climate impacts on lodgepole pine (Pinus contorta) radial growth in a provenance experiment. For. Ecol. Manag. 2011, 262, 115–123. [Google Scholar] [CrossRef]
- Pu, X.; Wang, X.; Lyu, L. Tree-Ring Isotopes Provide Clues for Sink Limitation on Treeline Formation on the Tibetan Plateau. Atmosphere 2021, 12, 540. [Google Scholar] [CrossRef]
- Lavergne, A.; Voelker, S.; Csank, A.; Graven, H.; de Boer, H.J.; Daux, V.; Robertson, I.; Dorado-Linan, I.; Martinez-Sancho, E.; Battipaglia, G.; et al. Historical changes in the stomatal limitation of photosynthesis: Empirical support for an optimality principle. New Phytol. 2020, 225, 2484–2497. [Google Scholar] [CrossRef] [PubMed]
- Wang, H.; Prentice, I.C.; Davis, T.W.; Keenan, T.F.; Wright, I.J.; Peng, C. Photosynthetic responses to altitude: An explanation based on optimality principles. New Phytol. 2017, 213, 976–982. [Google Scholar] [CrossRef] [Green Version]
- Bresson, C.C.; Kowalski, A.S.; Kremer, A.; Delzon, S. Evidence of altitudinal increase in photosynthetic capacity: Gas exchange measurements at ambient and constant CO2 partial pressures. Ann. For. Sci. 2009, 66, 8. [Google Scholar] [CrossRef] [Green Version]
- Zhu, Y.; Siegwolf, R.T.; Durka, W.; Korner, C. Phylogenetically balanced evidence for structural and carbon isotope responses in plants along elevational gradients. Oecologia 2010, 162, 853–863. [Google Scholar] [CrossRef] [PubMed]
- Salazar-Tortosa, D.; Castro, J.; Villar-Salvador, P.; Vinegla, B.; Matias, L.; Michelsen, A.; de Casas, R.R.; Querejeta, J.I. The “isohydric trap”: A proposed feedback between water shortage, stomatal regulation, and nutrient acquisition drives differential growth and survival of European pines under climatic dryness. Glob. Chang. Biol. 2018, 24, 4069–4083. [Google Scholar] [CrossRef] [PubMed]
- Lu, X.M.; Liang, E.R.; Wang, Y.F.; Babst, F.; Camarero, J.J. Mountain treelines climb slowly despite rapid climate warming. Glob. Ecol. Biogeogr. 2021, 30, 305–315. [Google Scholar] [CrossRef]
Figure 1.
Location map of the treeline as well as the lower-elevation forests and the nearest weather stations (asterisks on the map) on the Tibetan Plateau.
Figure 1.
Location map of the treeline as well as the lower-elevation forests and the nearest weather stations (asterisks on the map) on the Tibetan Plateau.
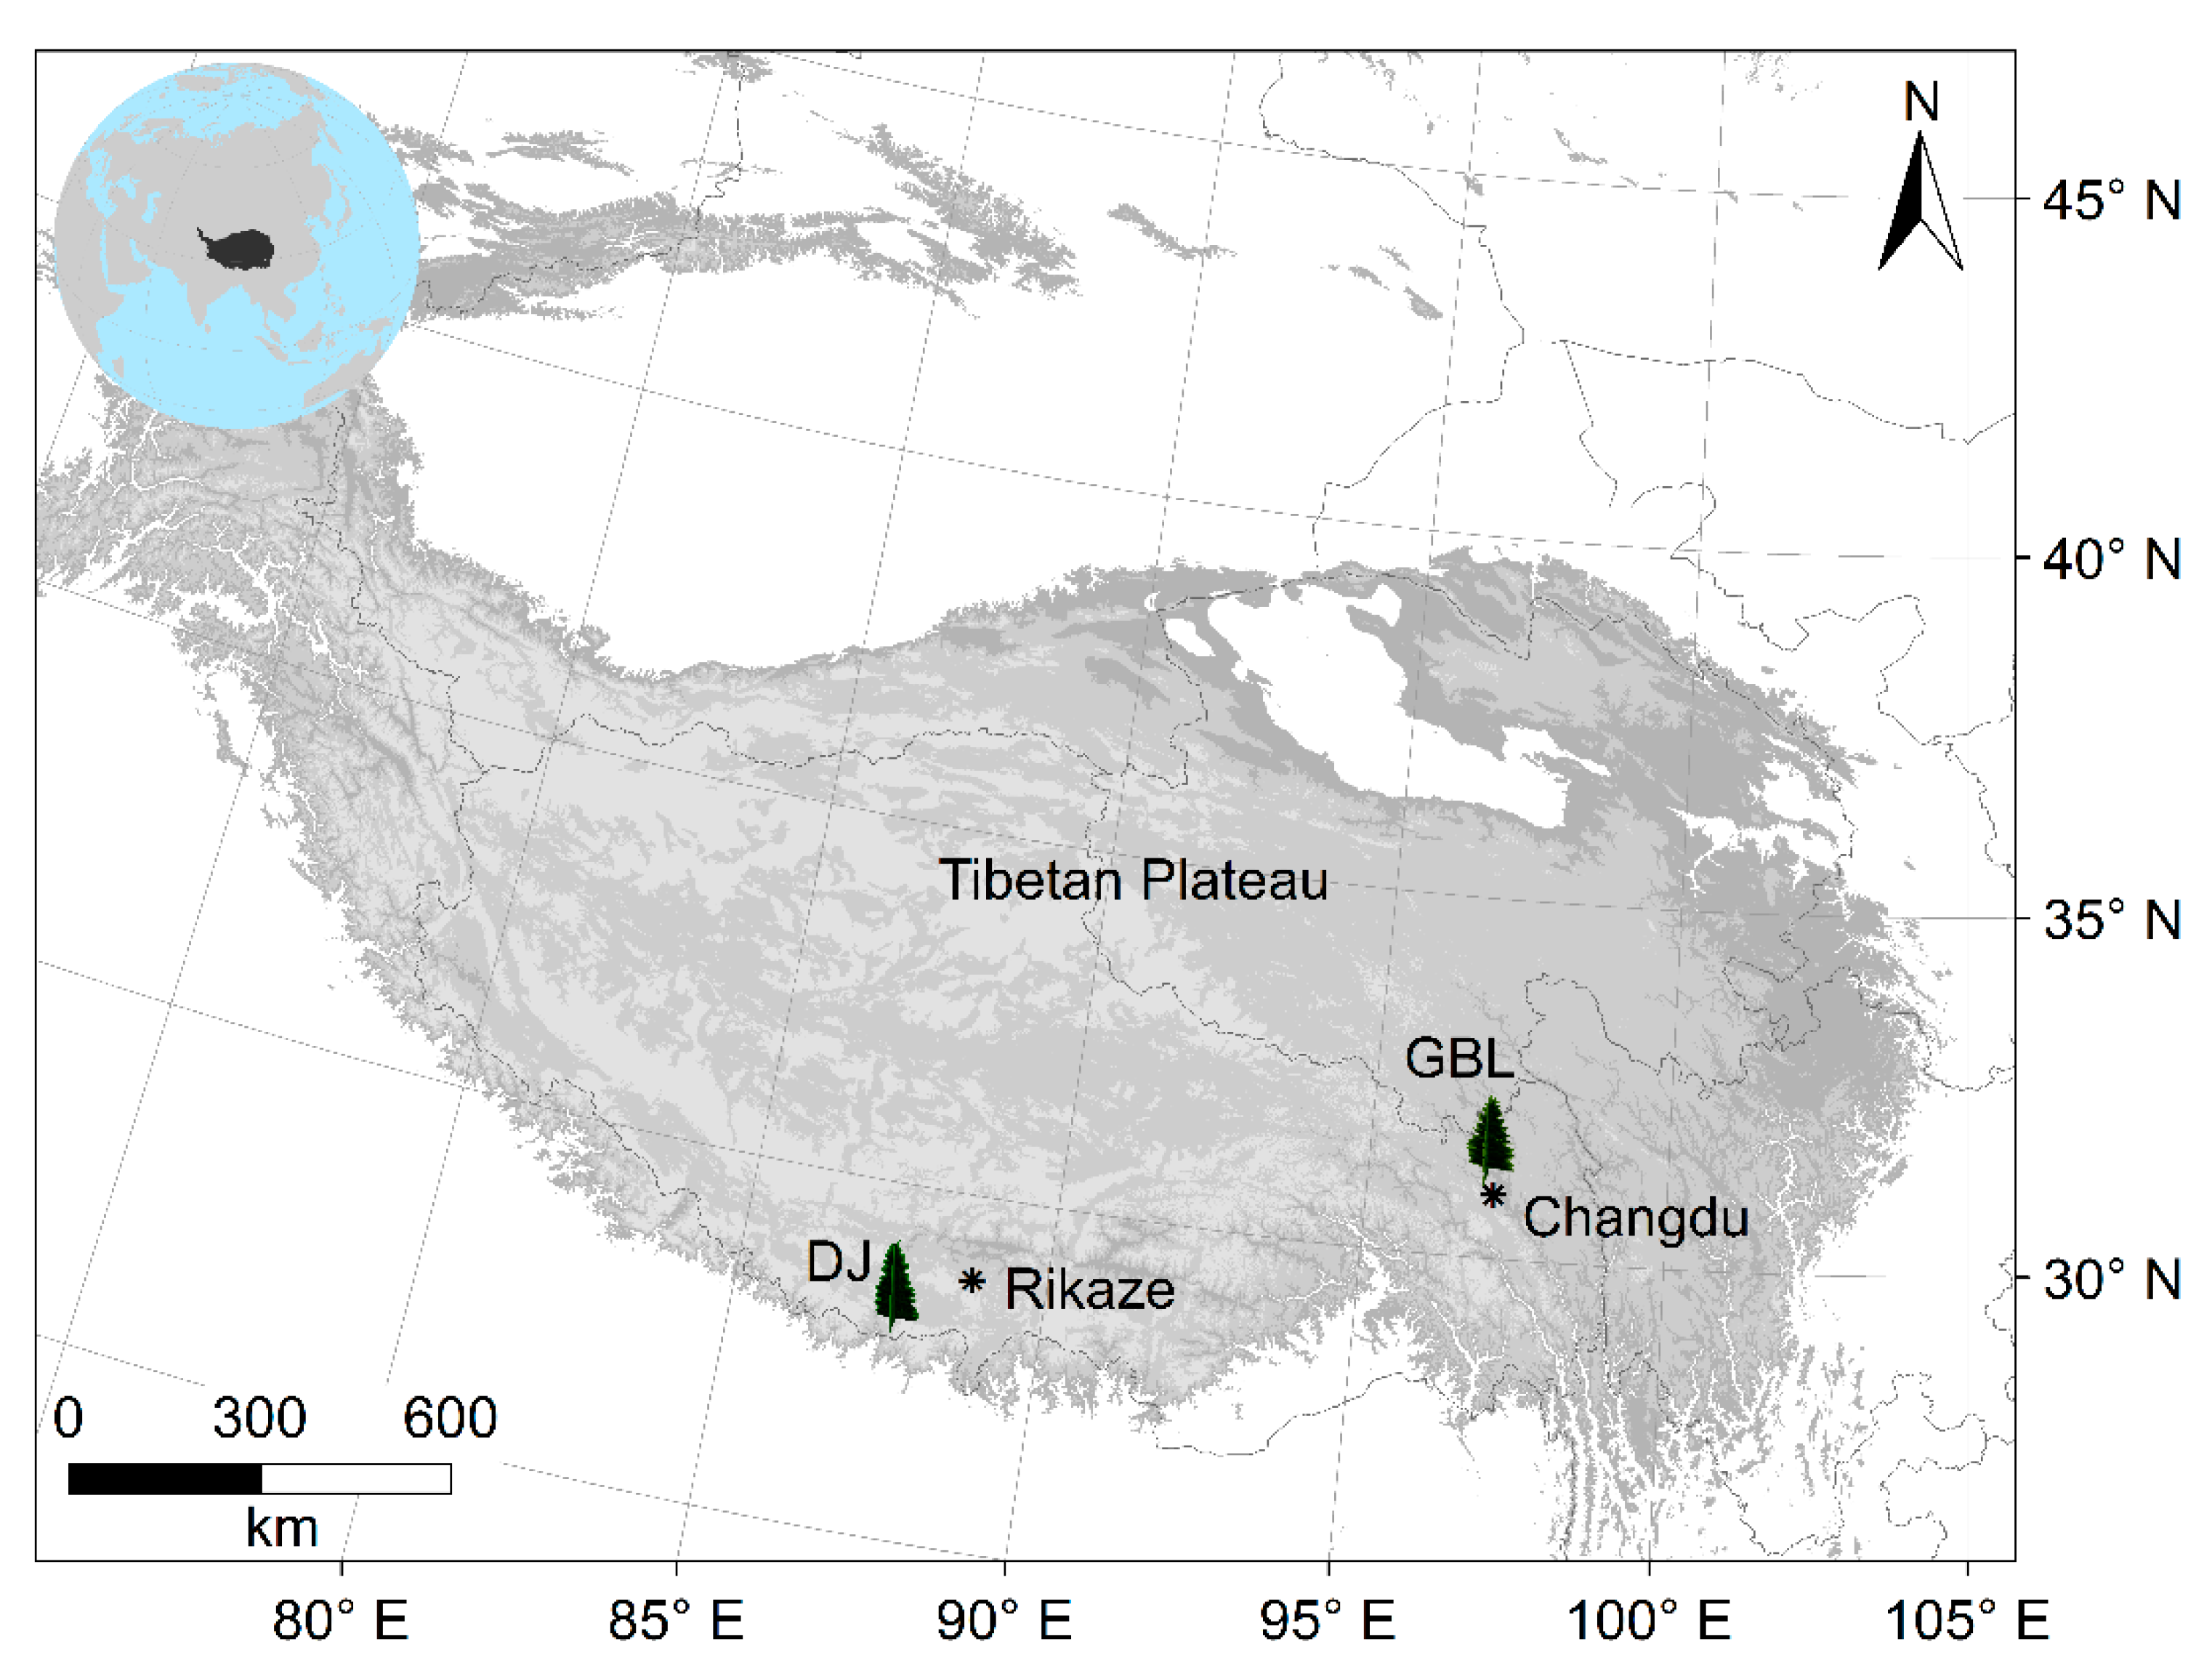
Figure 2.
Climate diagrams based on the climate records from the weather stations Changdu (a) and Rikaze (b) for the period 1955−2014. Tmean is the monthly mean temperature, Tmax is the monthly mean maximum temperature, and Tmin is the monthly mean minimum temperature.
Figure 2.
Climate diagrams based on the climate records from the weather stations Changdu (a) and Rikaze (b) for the period 1955−2014. Tmean is the monthly mean temperature, Tmax is the monthly mean maximum temperature, and Tmin is the monthly mean minimum temperature.

Figure 3.
The basal area increment (BAI) series (a,b), the temporal trends of the Δ13C chronology (c,d) and the temporal changes in intrinsic water-use efficiency (iWUE) (e,f) for each forest stand of the two treelines as well as the lower-elevation forests GBL and DJ. The black line and gray line show the treeline and lower-elevation forest, respectively. The inserts are the box plots for each series. Different letters demonstrate significant differences (p < 0.05) between treelines and lower-elevation forests.
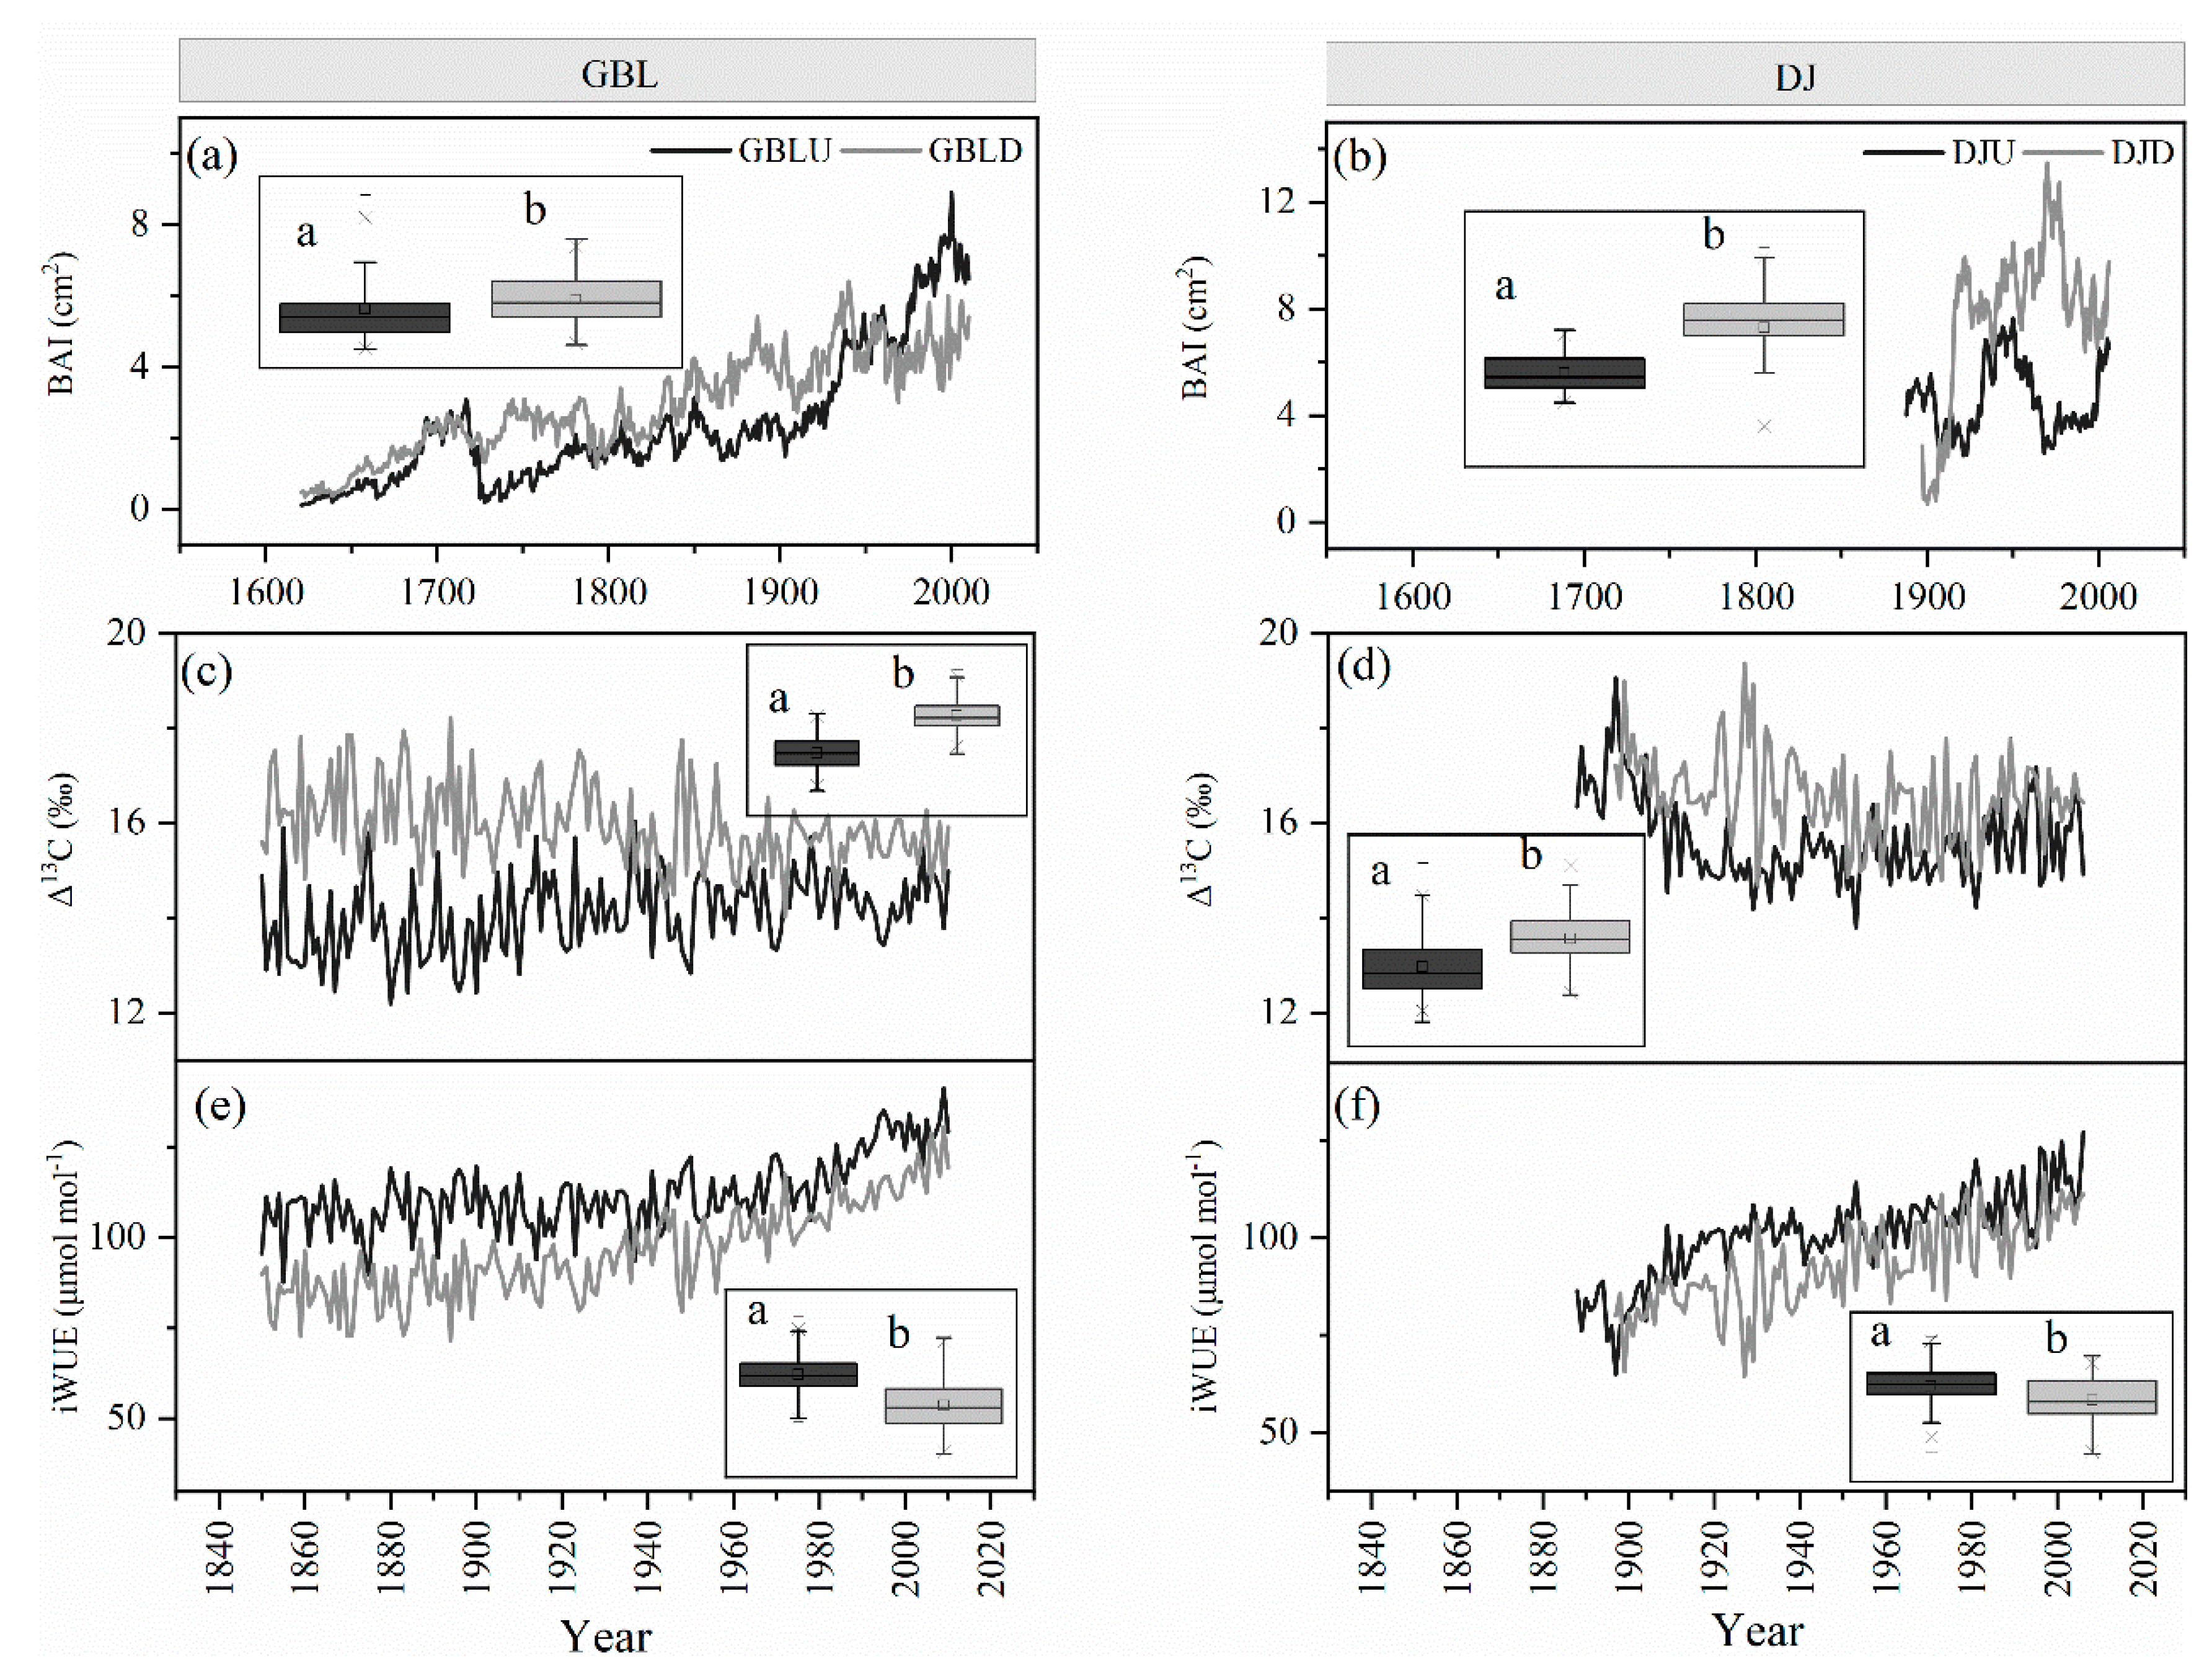
Figure 4.
Pearson correlation coefficients between the BAI and the climate variables from the previous September to the current October for the periods 1955–2010 and 1956–2006 for GBL and DJ, respectively. T, monthly mean temperature; Tmin, monthly minimum temperature; Tmax, monthly maximum temperature; P, monthly total precipitation; SPEI, standardized precipitation–evapotranspiration index; VPD, vapor pressure deficit. The asterisk * denotes significance at p < 0.05.

Figure 5.
Pearson correlation coefficients between basal area increment (BAI) and intrinsic water use efficiency (iWUE).
Figure 5.
Pearson correlation coefficients between basal area increment (BAI) and intrinsic water use efficiency (iWUE).

Figure 6.
The piecewise structural equation meta-model (pSEM) proposed to test the influences of climatic factors on tree basal area increment (BAI) and water-use efficiency (iWUE) between the treeline (a) and lower-elevation (b) plots for the two treelines as well as the lower-elevation forests in GBL and DJ after 1970. Numbers next to each arrow show the standardized regression coefficient (β) of each path. The thickness of arrows represents the strength of the effect, whereas the color represents the direction of the effect (red for negative and black for positive). Solid arrows represent a significant effect (p < 0.001), whereas dashed arrows represent a nonsignificant effect (p > 0.05). Abbreviations: Tgrs = growing season (from April to September) mean temperature; Ca = atmospheric CO2; VPD = growing season mean vapor pressure deficit.

Table 1.
Characteristics of sampling sites.
| Site | Species | Latitude (°N) | Longitude (°E) | Altitude (m) | Cores/Trees | TRW Time Span | Isotope Data Time Span |
|---|---|---|---|---|---|---|---|
| GBLU | PIBA | 31 | 96.97 | 4557 | 29/29 | 1773–2010 | 1850–2010 |
| GBLD | PIBA | 31 | 96.96 | 4455 | 33/33 | 1621–2010 | 1850–2010 |
| DJU | ABSP | 27.837 | 87.47 | 3920 | 19/19 | 1780–2006 | 1888–2006 |
| DJD | ABSP | 27.84 | 87.46 | 3410 | 13/13 | 1893–2006 | 1897–2006 |
Table 2.
Summary of the piecewise structural equation meta-model (pSEM) for testing the influences of growing season (from April to September) mean temperature (Tgrs) and iWUE on basal area increment (BAI) and the influences of growing season (from April to September) mean temperature (Tgrs), vapor pressure deficit (VPD) and atmospheric CO2 (Ca) on water-use efficiency (iWUE). β is the standardized regression coefficient, and S.E. is the standard error.
| Site | Response Variable | Predictor Variable | β | S.E. | Critical Value | p-Value |
|---|---|---|---|---|---|---|
| Treeline | BAI | Tgrs | 0.6537 | 0.1938 | 6.7469 | <0.001 |
| BAI | VPD | −0.4339 | 0.1961 | −5.4778 | <0.001 | |
| BAI | iWUE | 0.3659 | 0.0128 | 4.4411 | <0.001 | |
| iWUE | Tgrs | 0.6215 | 1.2916 | 6.1758 | <0.001 | |
| iWUE | VPD | −0.3059 | 1.5057 | −3.2257 | <0.01 | |
| iWUE | Ca | 0.3443 | 0.0488 | 4.0213 | <0.001 | |
| Lower-elevation | BAI | Tgrs | −0.9092 | 0.3387 | −9.0619 | <0.001 |
| BAI | VPD | 0.4058 | 0.3524 | 4.8106 | <0.001 | |
| BAI | iWUE | −0.0258 | 0.0262 | −0.2948 | 0.769 | |
| iWUE | Tgrs | 0.4557 | 1.19 | 4.3074 | <0.001 | |
| iWUE | VPD | −0.0412 | 1.3873 | −0.4137 | 0.6803 | |
| iWUE | Ca | 0.4094 | 0.045 | 4.5477 | <0.001 |
Publisher’s Note: MDPI stays neutral with regard to jurisdictional claims in published maps and institutional affiliations. |
© 2021 by the authors. Licensee MDPI, Basel, Switzerland. This article is an open access article distributed under the terms and conditions of the Creative Commons Attribution (CC BY) license (https://creativecommons.org/licenses/by/4.0/).
Share and Cite
MDPI and ACS Style
Pu, X.; Wang, X.; Lyu, L. Recent Warming-Induced Tree Growth Enhancement at the Tibetan Treeline and the Link to Improved Water-Use Efficiency. Forests 2021, 12, 1702. https://doi.org/10.3390/f12121702
AMA Style
Pu X, Wang X, Lyu L. Recent Warming-Induced Tree Growth Enhancement at the Tibetan Treeline and the Link to Improved Water-Use Efficiency. Forests. 2021; 12(12):1702. https://doi.org/10.3390/f12121702
Chicago/Turabian StylePu, Xing, Xiaochun Wang, and Lixin Lyu. 2021. "Recent Warming-Induced Tree Growth Enhancement at the Tibetan Treeline and the Link to Improved Water-Use Efficiency" Forests 12, no. 12: 1702. https://doi.org/10.3390/f12121702
Note that from the first issue of 2016, this journal uses article numbers instead of page numbers. See further details here.