Article

Spectroscopic Stability Studies of Pressure Sensitive Labels Facestock Made from Recycled Post-Consumer Waste and Agro-Industrial By-Products

by
Marina Vukoje
*,
Katarina Itrić Ivanda
*,
Rahela Kulčar
and
Ana Marošević Dolovski
Faculty of Graphic Arts, University of Zagreb, Getaldićeva 2, 10000 Zagreb, Croatia
*
Authors to whom correspondence should be addressed.
Forests 2021, 12(12), 1703; https://doi.org/10.3390/f12121703
Submission received: 19 November 2021 / Revised: 1 December 2021 / Accepted: 3 December 2021 / Published: 5 December 2021
(This article belongs to the Special Issue Weathering and Field Testing of Wood and Lignocellulosic Materials)

Abstract

:
To support circular economy and sustainability, the use of synthetic polymers should be minimized due to their excessive accumulation in the environment and low biodegradation rate which leads to a global waste problem. Thus, the quota of natural resources should be increased, as well as the use of agriculture and industrial waste or by-products as raw materials in industrial processes. Agro-industrial wastes were found to have high cellulose fiber potential which makes them an excellent resource for paper production. This study investigates the influence of artificial aging test on the stability of commercially available fiber based self-adhesive pressure sensitive labels (PSL), in which the facestock is made of 15% agro-industrial byproducts, 40% post-consumer recycled paper and 45% virgin wood pulp and compared to ones made of biobased polyethylene. The results showed that optical brighteners are present in the composition of fiber based PSL. Moreover, the fluorescence and UV-Visible spectroscopy results indicated that by the action of UV irradiation and temperature. The oxidation of cellulose was not found by FTIR spectroscopy, indicating its high stability.

1. Introduction

Today, more than ever, we are witnesses to everyday market and supply chain disruptions due to a problem related to petroleum-based resources and its unstable world price level dictated and dependent solely on political decision makers, which in numerous cases take no consideration of the sustainability repercussions of their unthought decisions. There are many drawbacks related to synthetic polymers despite their good mechanical performance, availability, and low price, which are mainly related to their high global consumption and excessive accumulation in the environment, leading to the global waste problem [1]. Synthetic polymers have a low biodegradation rate, and their recyclability potential is still limited due to a very large number of different compounds on the market. The plastic industry is dependent upon crude oil, its availability and price, as well as political impact, which in the end can have an economic influence on the plastic market [1]. Thus, moving from traditional production towards a circular economy is crucial, i.e., with improved waste and materials management the issue related to the problem in polymer waste accumulation can be minimized. As the name implies, a circular economy seeks to minimize material consumption, maximize the value of the materials that circulate within the economy, and reduce waste generation [2]. By sharing goods through different areas and industries, material consumption can be minimized, the value of the materials that circulate within the economy can be maximized, and waste generation can be reduced [3]. To support a circular economy and sustainability, the use of natural resources instead of synthetic ones should be increased, as well as the use of wastes and byproducts from one industry as raw material and inputs into some different industrial processes and production.
The main raw materials which can be used in papermaking are classified as wood, non-wood, and recycled fibers. A scarcity of wood resources and the massive destruction of forests in the past decades, has resulted in global environmental problems, as well as an abundance of non-woody raw materials, making non-wood resources a good choice for the extraction of cellulose fibers [4]. Due to the rising demand of paper industry for raw materials in general, the trend towards sustainable fiber sourcing and sustainable and controlled forestry, especially during the last couple of decades, is noticed. According to Abd El-Sayed et al. (2020) some non-wood plant fibers have some special properties that make them superior to wood fibers for the production of special papers [4]. Often, agricultural residues are the source of non-wood fibers as well. Agro-industrial residues/wastes of banana, corn, citrus, grape, pomegranate, strawberry-tree fruit and barley straw were found to have high cellulose fiber potential [5,6,7,8,9,10,11]. Recently, potential sources from non-wood raw material for paper production, as well as low-cost raw material for papermaking have become an interest of different studies. For example, banana [12], pineapple leaves [13], and citrus wastes [14] are non-wood lignocellulosic materials that may be alternative raw materials for paper and packaging production.
In the packaging printing segment, pressure sensitive label (PSL) producers have a crucial role in sustainability as they have the large opportunity to benefit from alternatively sourced material used in different ways: from a marketing point of view, where the benefit is visible through strong campaigns and advertising process of sustainable material usage, and a real point where they implement sustainability pillars in daily life. The pressure sensitive label (PSL) industry, in a total amount of paper business, holds a relatively small share. But, as AWA predicts globally, the predicted CAGR of the PSL material industry is 5.1%, respectively between 2020–2023 [15]. Due to this expected growth, the industry is aware that with the fact of growing business, the spent liner and problematic volumes of waste, in general, are also expected to enlarge [16]. Despite that fact, there is a lack of research papers dealing with the sustainability issues of these materials. Medeiros et al. (2019) in the study related to the LCA assessment of self-adhesive labels made from PET and glassine paper, concluded that the use of recycled materials and waste material recycling, as well as pollution prevention scenarios, such as the acquisition of key inputs by domestic suppliers, elimination of waste from key inputs at the printing facility and lineless label production, can be a promising direction of environmental improvement in the labeling industry [17].
Pressure sensitive labeling methods, also known as self-adhesive technology have proven themselves to be versatile, easy to use, and thus very popular. They have gained momentum over competing technologies, esp. so-called wet glue labels, so typical in the beverage industry (esp. labeling of the returnable beer bottles) [16]. All pressure sensitive labels (PSL) comprise three basic elements: facestock, adhesive and liner. All those components are defined by the application of the final label and usage of the labeled product. The application of PSL is influenced by several parameters, of which some of most important are where the label is placed and where it will be used, general usage information, such as application surface, application speed, application temperature (in terms of the room temperature where the application is taking place and temperature of the product itself), humidity, etc. All those parameters define the suitable selection of facestock, adhesive and liner [18]. All components of pressure sensitive labeling materials are dependent on various external influences, such as weathering and storage conditions, labeling application methods and conditions, printing and converting methods, recovery, etc. Many obstacles can occur when using a PSL, from non-quality print to poor application process. Thus, it should be emphasized that each step of the way is crucial in decision making moment at the point of sale for the customer.
This research aims to investigate the influence of artificial aging tests on the stability of commercially available PSL. Commercially available PSL were used, due to the simulation of real conditions occurring during their life cycle. During the production of paper-based packaging, the products are subjected to various processes, for example within the formation of paper sheets, in addition to cellulose pulp, different additives (fillers, sizing agents, etc.) are added. All these additives will have different influences on paper-based packaging stability. In contrast, various studies involving the production of paper from agricultural waste, often include only the laboratory paper sheets made from raw pulp without any additives added, which can be a drawback.
During storage and transportation, as well as during shelf life of some products PSL may be exposed to UV irradiation from lamps in the supermarket, or elevated humidity and temperature during storage and transportation. For this reason, the stability of PSL made from agricultural waste materials (grape, citrus, barley) and their comparison to PSL made from biogenic polyethylene was examined. For the evaluation of stability, two accelerated aging tests were used, UV irradiation and elevated temperature and humidity.

2. Materials and Methods

2.1. Materials

For this study, different pressure sensitive label (PSL) materials, commonly used on the market for various applications were studied. Facestock for the PSL can be paper or filmic. For this research, both types of constructions were chosen. Three PSL have a fiber based facestock, while two filmic materials used biogenic polymers as facestock (Table 1).
Fiber based facestock of PSL used in this research are produced with 15% agro-industrial byproducts (grape, citrus, and barley), 40% post-consumer recycled paper and 45% virgin wood pulp in order to form a high-quality natural paper. According to a producer, grape fibers are obtained from wine making processes as residue leftovers after grape pressing procedure, citrus fibers are collected from citrus mash, leftover from fruit juice production, while barely fibers are recovered from brewing beer and malt whiskey. Papers are wet strength treated, as PSL materials are the product in this case dedicated for labeling of primary labels used on high and premium goods with a natural appearance, e.g., wine, spirits, specialist foods [21,22,23].
The polymer based facestock of used PSL is made mostly from sugar cane ethanol, certified under the Bonsucro® scheme, which is converted in a similar way to conventional polyethylene (PE), and available in white and clear performance [24].
Adhesives used with paper laminates are permanent adhesives, both emulsion acrylic and rubber based. The glassine liners used in this research are FSC certified, fossil-free and recyclable. The glassine liner used with recycled content fiber based PSL materials is white, supercalendered glassine paper, with a basis weight of 70 g/m2 and thickness of 61 µm. Glassine liner used with filmic recycled content PSL materials is white, supercalendered glassine paper, with a basis weight of 59 g/m2 and thickness of 53 µm.

2.2. Methods

2.2.1. Accelerated Ageing Tests

The used PSL were exposed to accelerated aging by UV irradiation in a Solarbox 1500e device (CO.FO.ME.GRA), in which the simulation of environmental conditions in an open or closed space is possible, with control of temperature and radiation. All the samples were exposed to filtered xenon light for a period of 5 and 10 days, at a BST temperature of 60 °C, at irradiation of 550 W/m2. The UV indoor filter was used to change the xenon spectral curve into the ultraviolet range, and for the simulation of conditions of internal exposure, i.e., the simulation of sun rays filtered through a windowpane.
The samples were exposed to elevated humidity and temperature in controlled conditions for 5 and 10 days, at a relative humidity of 50% and temperatures of 80 °C. The “Kottermann” air chamber Type 2306 was used in the experiment.

2.2.2. Visual Evaluation

Samples were visually observed in lighting booth X-rite Judge II for the purpose of evaluation of the color of the tested substrate and the presence of optical brighteners, as well as their performance after exposure to UV light and elevated temperature. Two types of illuminants, D50 and UV, were used for the observation of the samples. The Canon EOS D450 camera with 50 mm, 1/30 s at f5.6, ISO 400 (Japan) was used for the imaging of the samples.

2.2.3. Fluorescence Spectroscopy

For fluorescence measurement, the same combination of a spectrometer and integrating sphere was used as in UV-Vis spectroscopy with the addition of LSM Series LED light source at 365 nm. LED light source is operated via a smart controller during the measurement. A constant current of 0.140 A was kept stable in order to maintain a constant excitation light source with the aim to excite fluorescence whitening agents within the samples. The possibilities of using the integration sphere in fluorescence spectroscopy characterization have been discussed in a number of articles [25,26,27]. Fluorescence intensity was measured in the spectral range between 330 and 630 nm.

2.2.4. UV-Vis Spectroscopy

Spectral reflectance was measured by using Ocean Optics USB2000+ spectrometer using a 30 mm wide integrating sphere under (8:di) measuring geometry (diffuse geometry, specular component included). OceanView software 2.0 was used for the calculation of the CIELAB values from measured spectral reflectance. The D65 illuminant and 10° standard observer were applied in these calculations. Color differences were calculated using the CIEDE2000 total color difference formula [28].

2.2.5. Fourier Transform Infrared (FTIR) Spectroscopy

The ATR spectra of the samples surface (PSL facestock), unexposed and exposed to artificial ageing tests were measured using Shimadzu FTIR IRAffinity-21 spectrometer with the Specac Silver Gate Evolution as a single reflection ATR sampling accessory with a ZnSe flat crystal plate (index of refraction 2.4). The IR spectra were recorded in the spectral range between 4000 and 500 cm−1 at 4 cm−1 resolution and averaged over 15 scans.

3. Results and Discussion

3.1. Visual Evaluation

Results of the visual evaluation under illuminant D50 can be seen in Figure 1a. It is evident that the grape based PSL samples that were exposed to UV radiation for five and ten days, respectively, differ significantly in appearance compared to the original sample, as well as to the PSL samples exposed to elevated temperature and humidity.
When observing the samples under illuminant UV (Figure 1b) these differences for grape based PSL samples are even more pronounced. Likewise, two remaining fiber based PSLs (citrus and barley), as well as polyethylene clear PSL, show similar characteristics only less pronounced. Polyethylene PSL shows no visual differences compared to the original, regardless of the accelerated aging test type.

3.2. Fluorescence Spectroscopy

The results of the visual evaluation indicated the need for qualitative fluorescence spectroscopy measurements. Optical brighteners (OBAs) or fluorescence whitening agents (FWAs) are added during the paper manufacturing process in order to increase paper whiteness [29]. OBAs absorb light in the UV part of the spectrum in order to get from the ground state to the excited states. Given that the excited state is unstable, the electron emits energy in the form of visible light when going back to the ground state. Since the part of the energy is converted to heat and movement, emitted energy corresponds to higher wavelengths compared to excitation wavelengths [30,31].
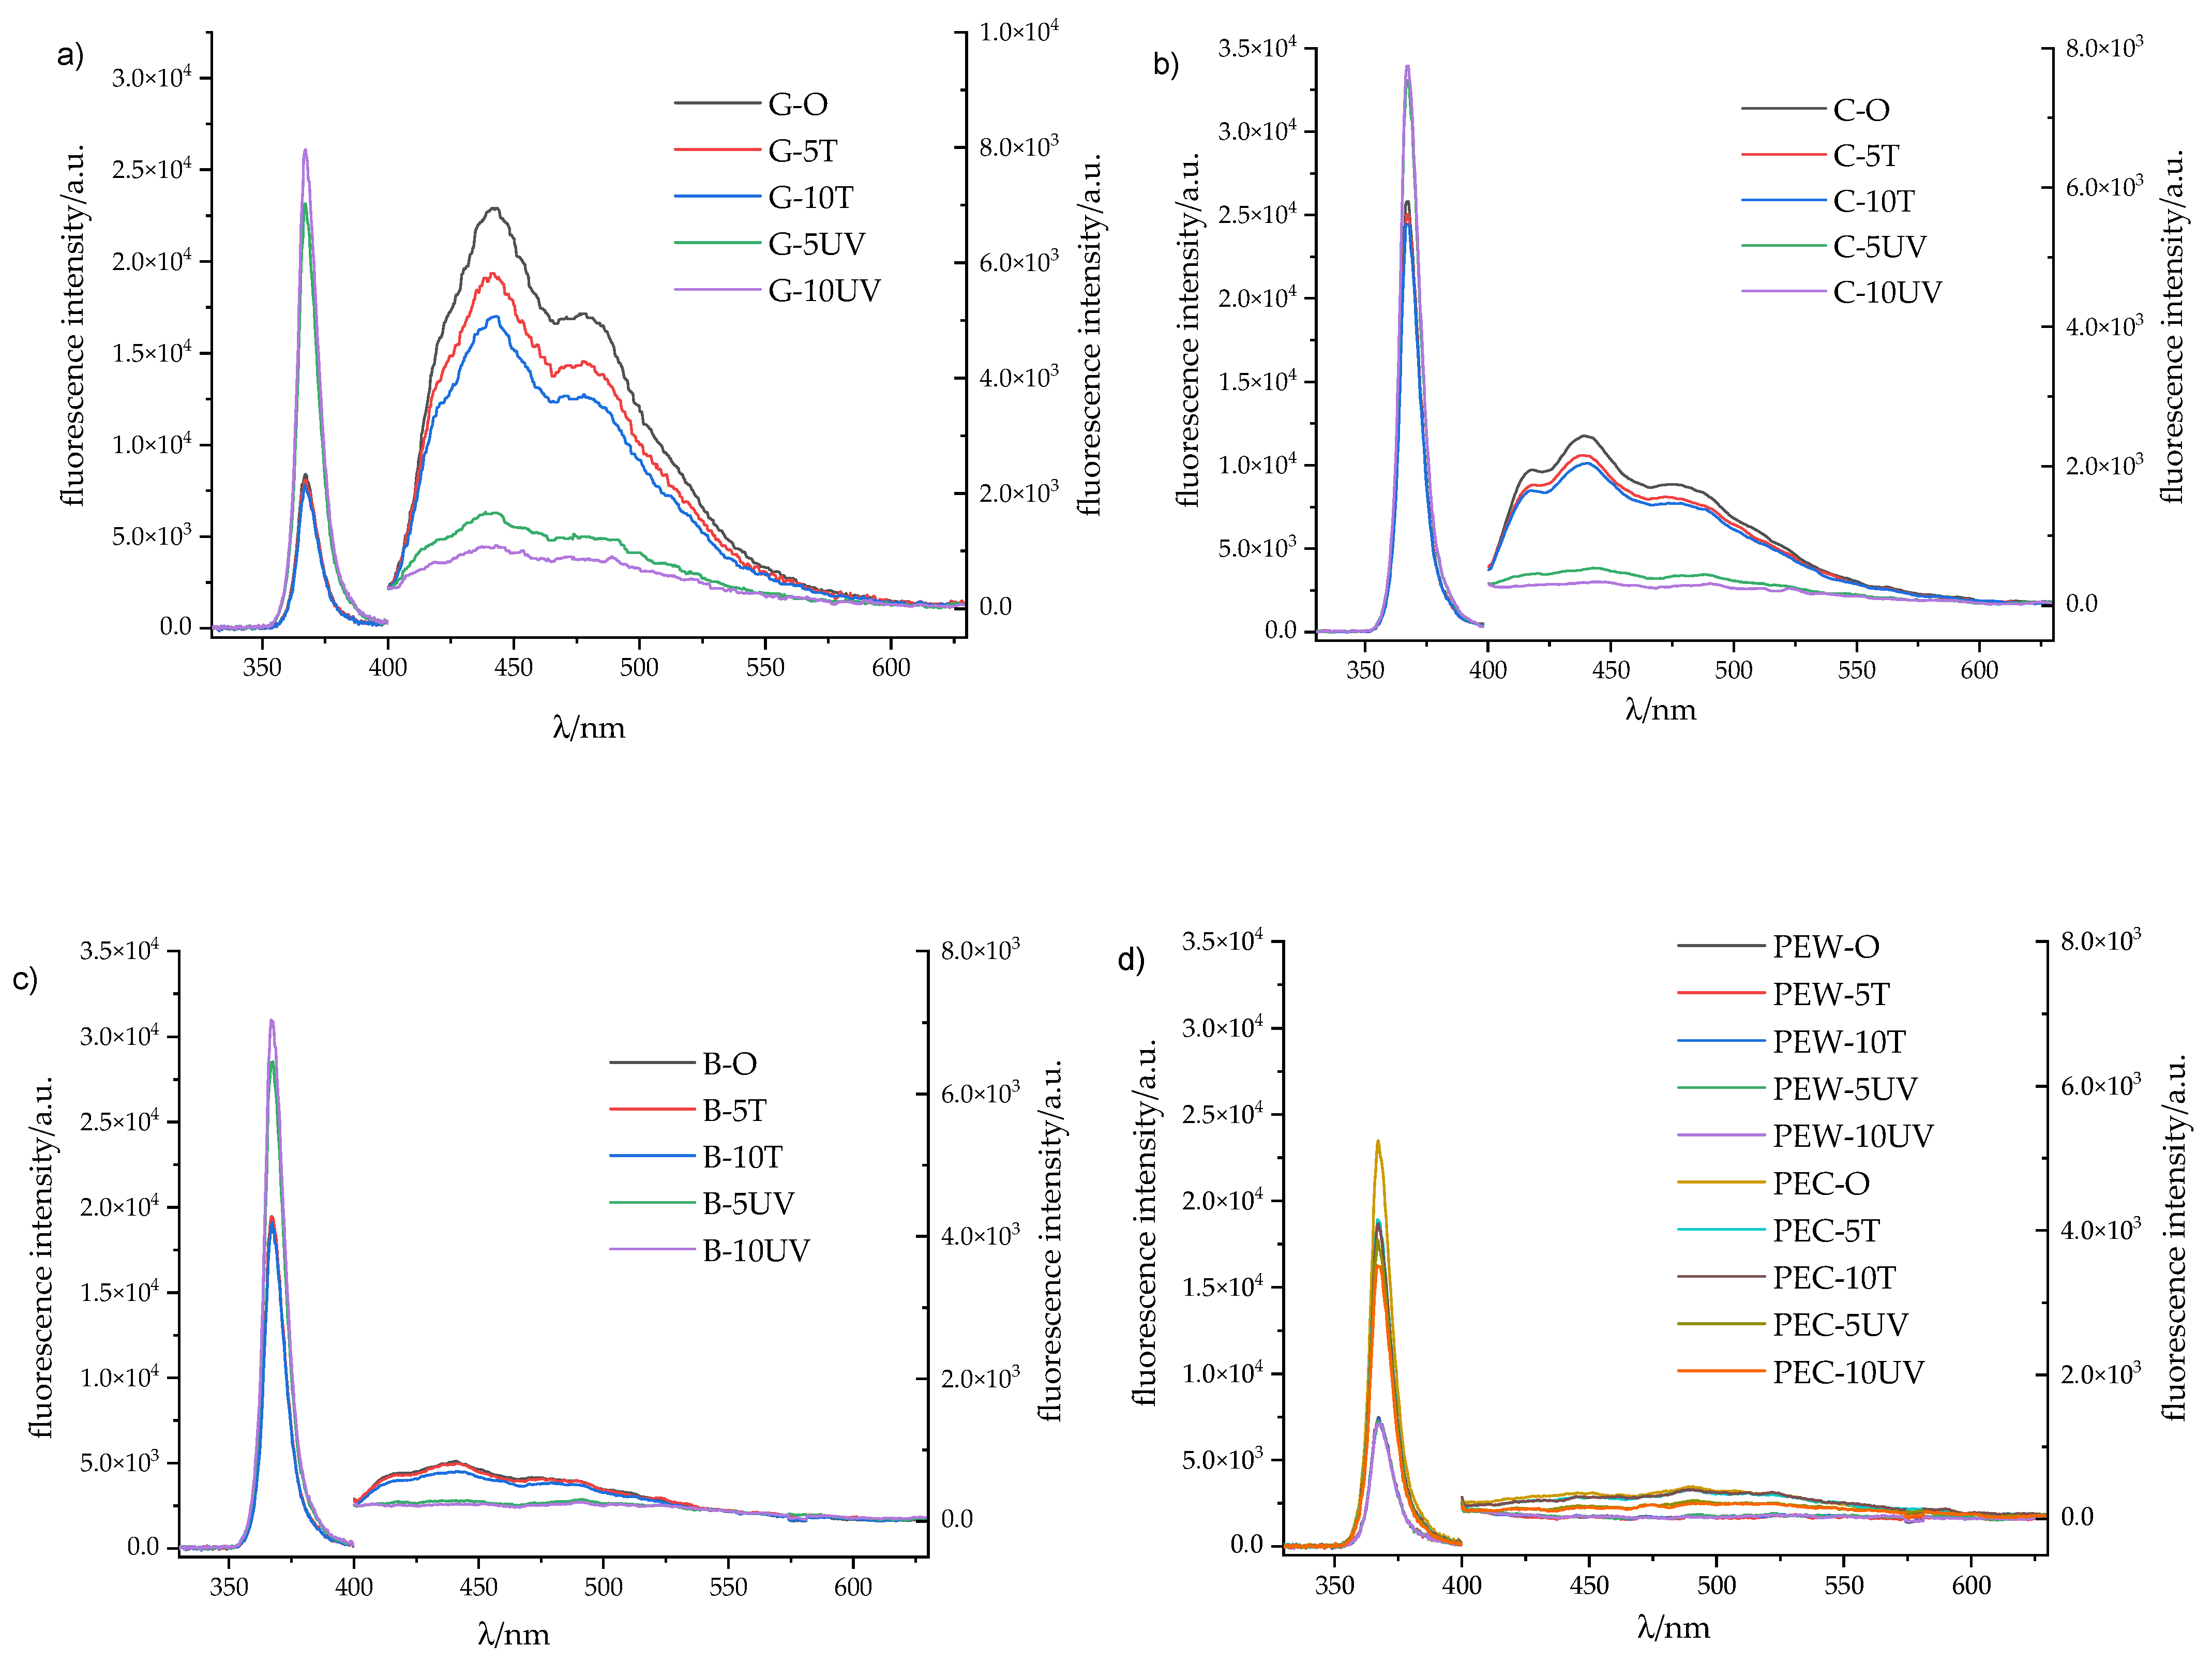
Figure 2a–c shows the fluorescence intensity spectra for fiber based PSL samples while the results for synthetic polymer based samples are given in Figure 2d. For easier comparison, each fluorescence intensity spectra were divided into two parts, excitation area, between 330 and 390 nm, and emission part of the spectrum, between 400 and 630 nm which is in line with the areas of activity of optical brighteners in the paper industry [32,33]. Excitation fluorescence intensity is much higher than the emission, so the excitation part of the spectrum is scaled on the left part of the diagram while the emission spectra in the visible part of the spectrum are scaled on the right side of the diagram.
Fluorescence intensity emission spectra of the original three fiber-based PSL (grape, citrus and barley) correspond to the emission of the OBAs in the blue part of the spectrum, between 400 and 490 nm [29,34,35]. It is evident that the original grape based PSL sample, as well as the grape based PSL samples exposed to elevated temperature and humidity for 5 and 10 days show lower fluorescence intensity, i.e., high absorption of incident light in comparison to the samples exposed to UV light for the duration of 5 and 10 days, respectively. Likewise, it can be seen from the measurements that the fluorescence intensity in the visible part of the spectrum is the highest for the untreated grape based samples and its intensity decreases with the exposure to elevated temperature and significantly more after exposure to UV light. Two peaks appeared in the visible part of the fluorescence spectrum of the grape based untreated sample at 430 nm and 490 nm. The same peaks were present in the spectra of the samples exposed to elevated temperature, while the peak at 490 nm completely disappeared while at the same time the peak at 430 nm had broadened.
Citrus-based fiber samples (Figure 2b) show similar behavior to grape based samples, meaning that the absorption of the indent light decreases after the exposure of the samples to UV light whereas exposing the samples to elevated temperature had almost no effect at the absorption at 365 nm. As for fluorescence emission in the visible region, it can be seen that the fluorescence intensity slightly decreases compared to the untreated citrus based sample after exposure to elevated temperatures. For the samples exposed to UV light the decrease in fluorescence intensity is considerably more pronounced and the characteristic peaks that can be seen in the original sample at 410 and 440 nm completely disappeared.
The last of the fiber based PSL samples, barley (Figure 2c), show identical behavior in the excitation region of the spectra as the citrus based PSL. In the visible part of the spectrum, barley shows the lowest values of fluorescence intensity which tends towards zero after the exposure of the samples to UV light.
Although the exact concentration of OBAs in the sample cannot be determined, it is known that the amount of OBAs is proportional to the area of fluorescence intensity summed over all wavelengths [27]. The decrease in fluorescence intensity can be linked to the decomposition of OBAs since they are highly sensitive to UV light [29]. Simultaneously, a reduced amount of actively available OBAs decreases the absorption in the excitation part of the spectra. Optical brighteners are not compatible with the pulp rich in lignin content since lignin absorbs UV radiation leaving a low amount of UV radiation for activating OBA [29]. Different fibers contain different ratios of cellulose and lignin. Various studies have found that grape fibers from wine making processes contain 30% cellulose, 21% hemicellulose and 17% lignin [36,37], citrus fibers from fruit juice production contain 16% cellulose and 10% hemicellulose [38], while barely fibers obtained from brewing beer contain 17% cellulose and 28% lignin [39]. It is evident that most of the lignin from the grape based PSL facestock was chemically removed to enable OBAs activation.
The remaining two bio-based polymer PSL (Figure 2d) show diametrically different values in the UV part of the spectrum. Namely, PSL made from white PE absorbs a significant amount of incident light at 365 nm and this value is constant regardless of the exposure of the samples to different degradation processes. At the same time, the fluorescence intensity of the specified PSL doesn’t exist in the visible part of the spectrum. PSL made from clear PE shows lower absorption at 365 nm which increases slightly after the exposures of the samples to both, UV light and elevated temperature. Fluorescence intensity in the visible part of the spectrum that exists as the result of the excitation at 365 nm is negligible.

3.3. UV-Vis Spectroscopy

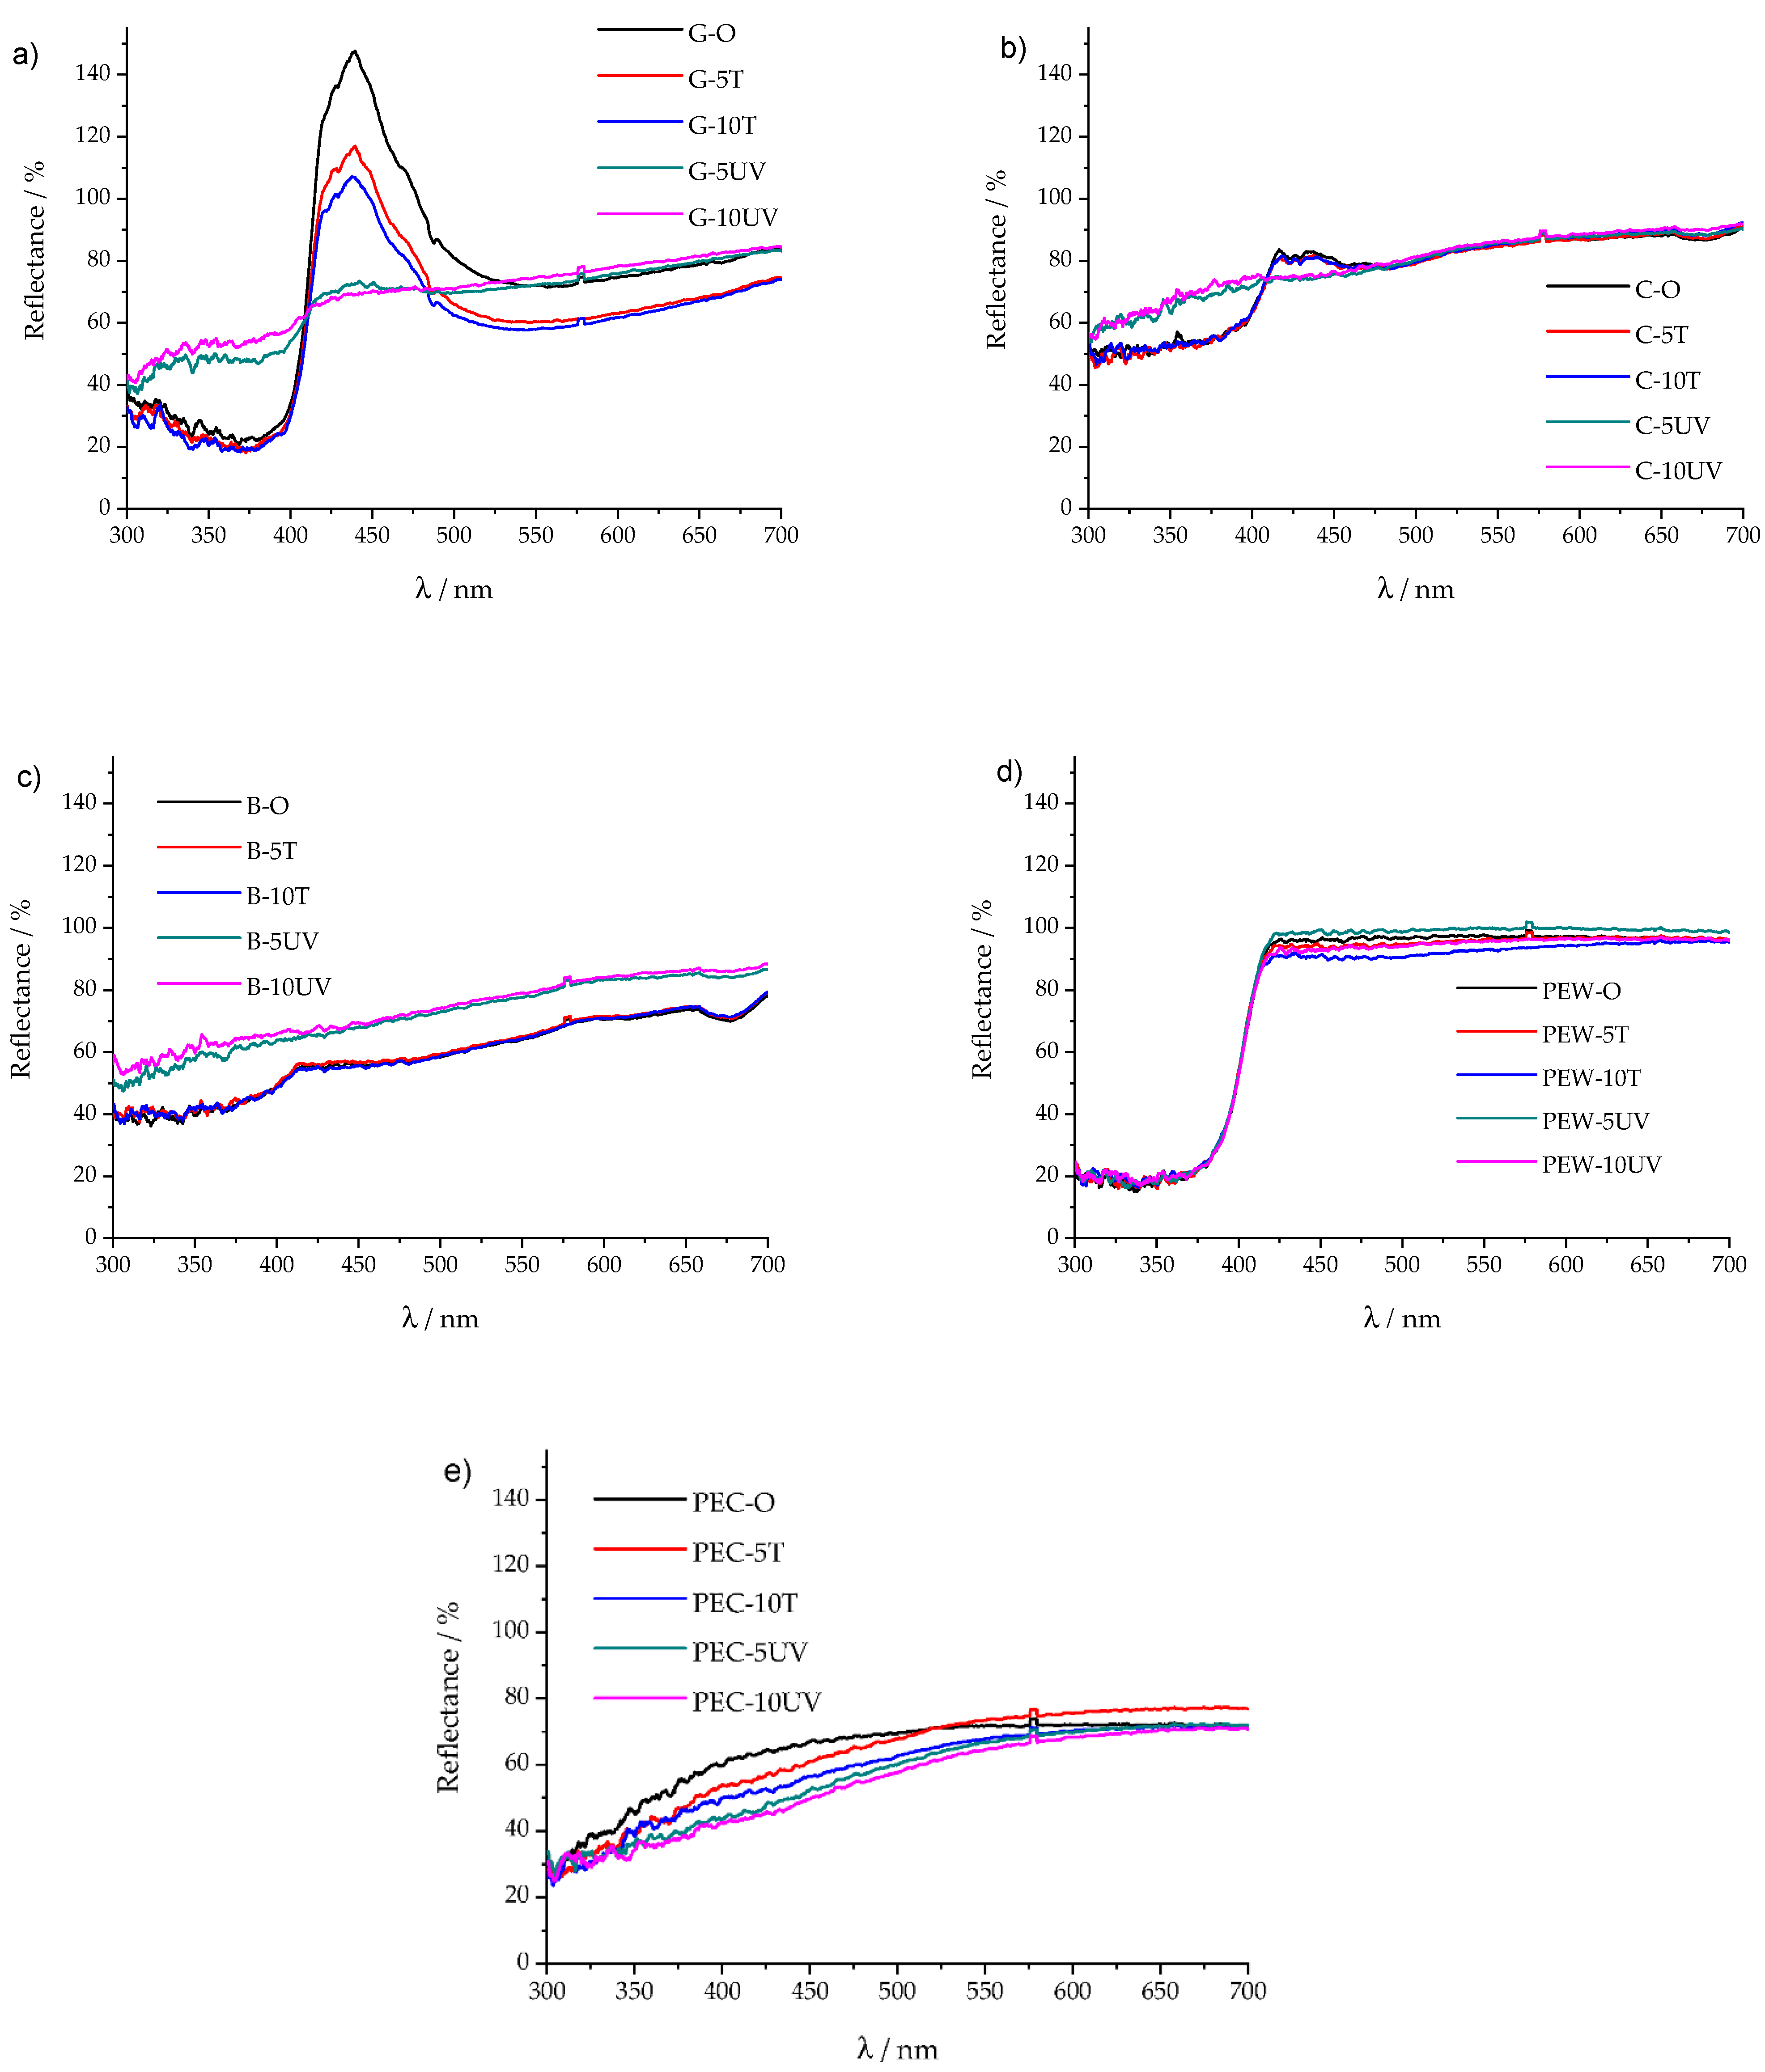
The spectral reflection curves (Figure 3) show that the greatest changes are visible after exposure of the samples to UV radiation rather than by the action of elevated temperature and humidity. The biggest change is visible on the grape based substrate. Minimal change is visible on PSL made on polyethylene white (PEW) and then on polyethylene clear PEC. The PEW sample is stable through the whole part of the UV-Vis spectrum. Low reflection (below 20%) in the UV part of the spectrum for the PEW sample indicates the addition of UV absorbers in the production process of PE. UV absorbers selectively absorb UV light and reemit it afterward at a wavelength that does not cause the degradation of PE material [40].
PEC shows small changes in the UV part of the spectrum, and changes in the Vis part of the spectrum (400–525 nm) pointing to the change of color (Figure 3e). The PEC sample is transparent and is dependent upon the substrate to which the label is applied. Those changes in the whole part of the observed spectrum are probably related to the changes of the liner. When observing the fiber based PSL, the highest changes were noticed in the sample made from grape, followed by barley and then citrus.
When observing fiber based PSL, the UV irradiance causes a change in the whole UV-Vis spectrum for grape and barley based PSL. For citrus based PSL, the UV irradiance causes the change only in the UV part of the spectrum while in the Vis part, only slight changes occur in the spectral range from 400–500 nm. Elevated temperature and humidity cause no changes in the whole part of the UV-Vis spectra for citrus and barley based PSL facestock (Figure 3b,c).
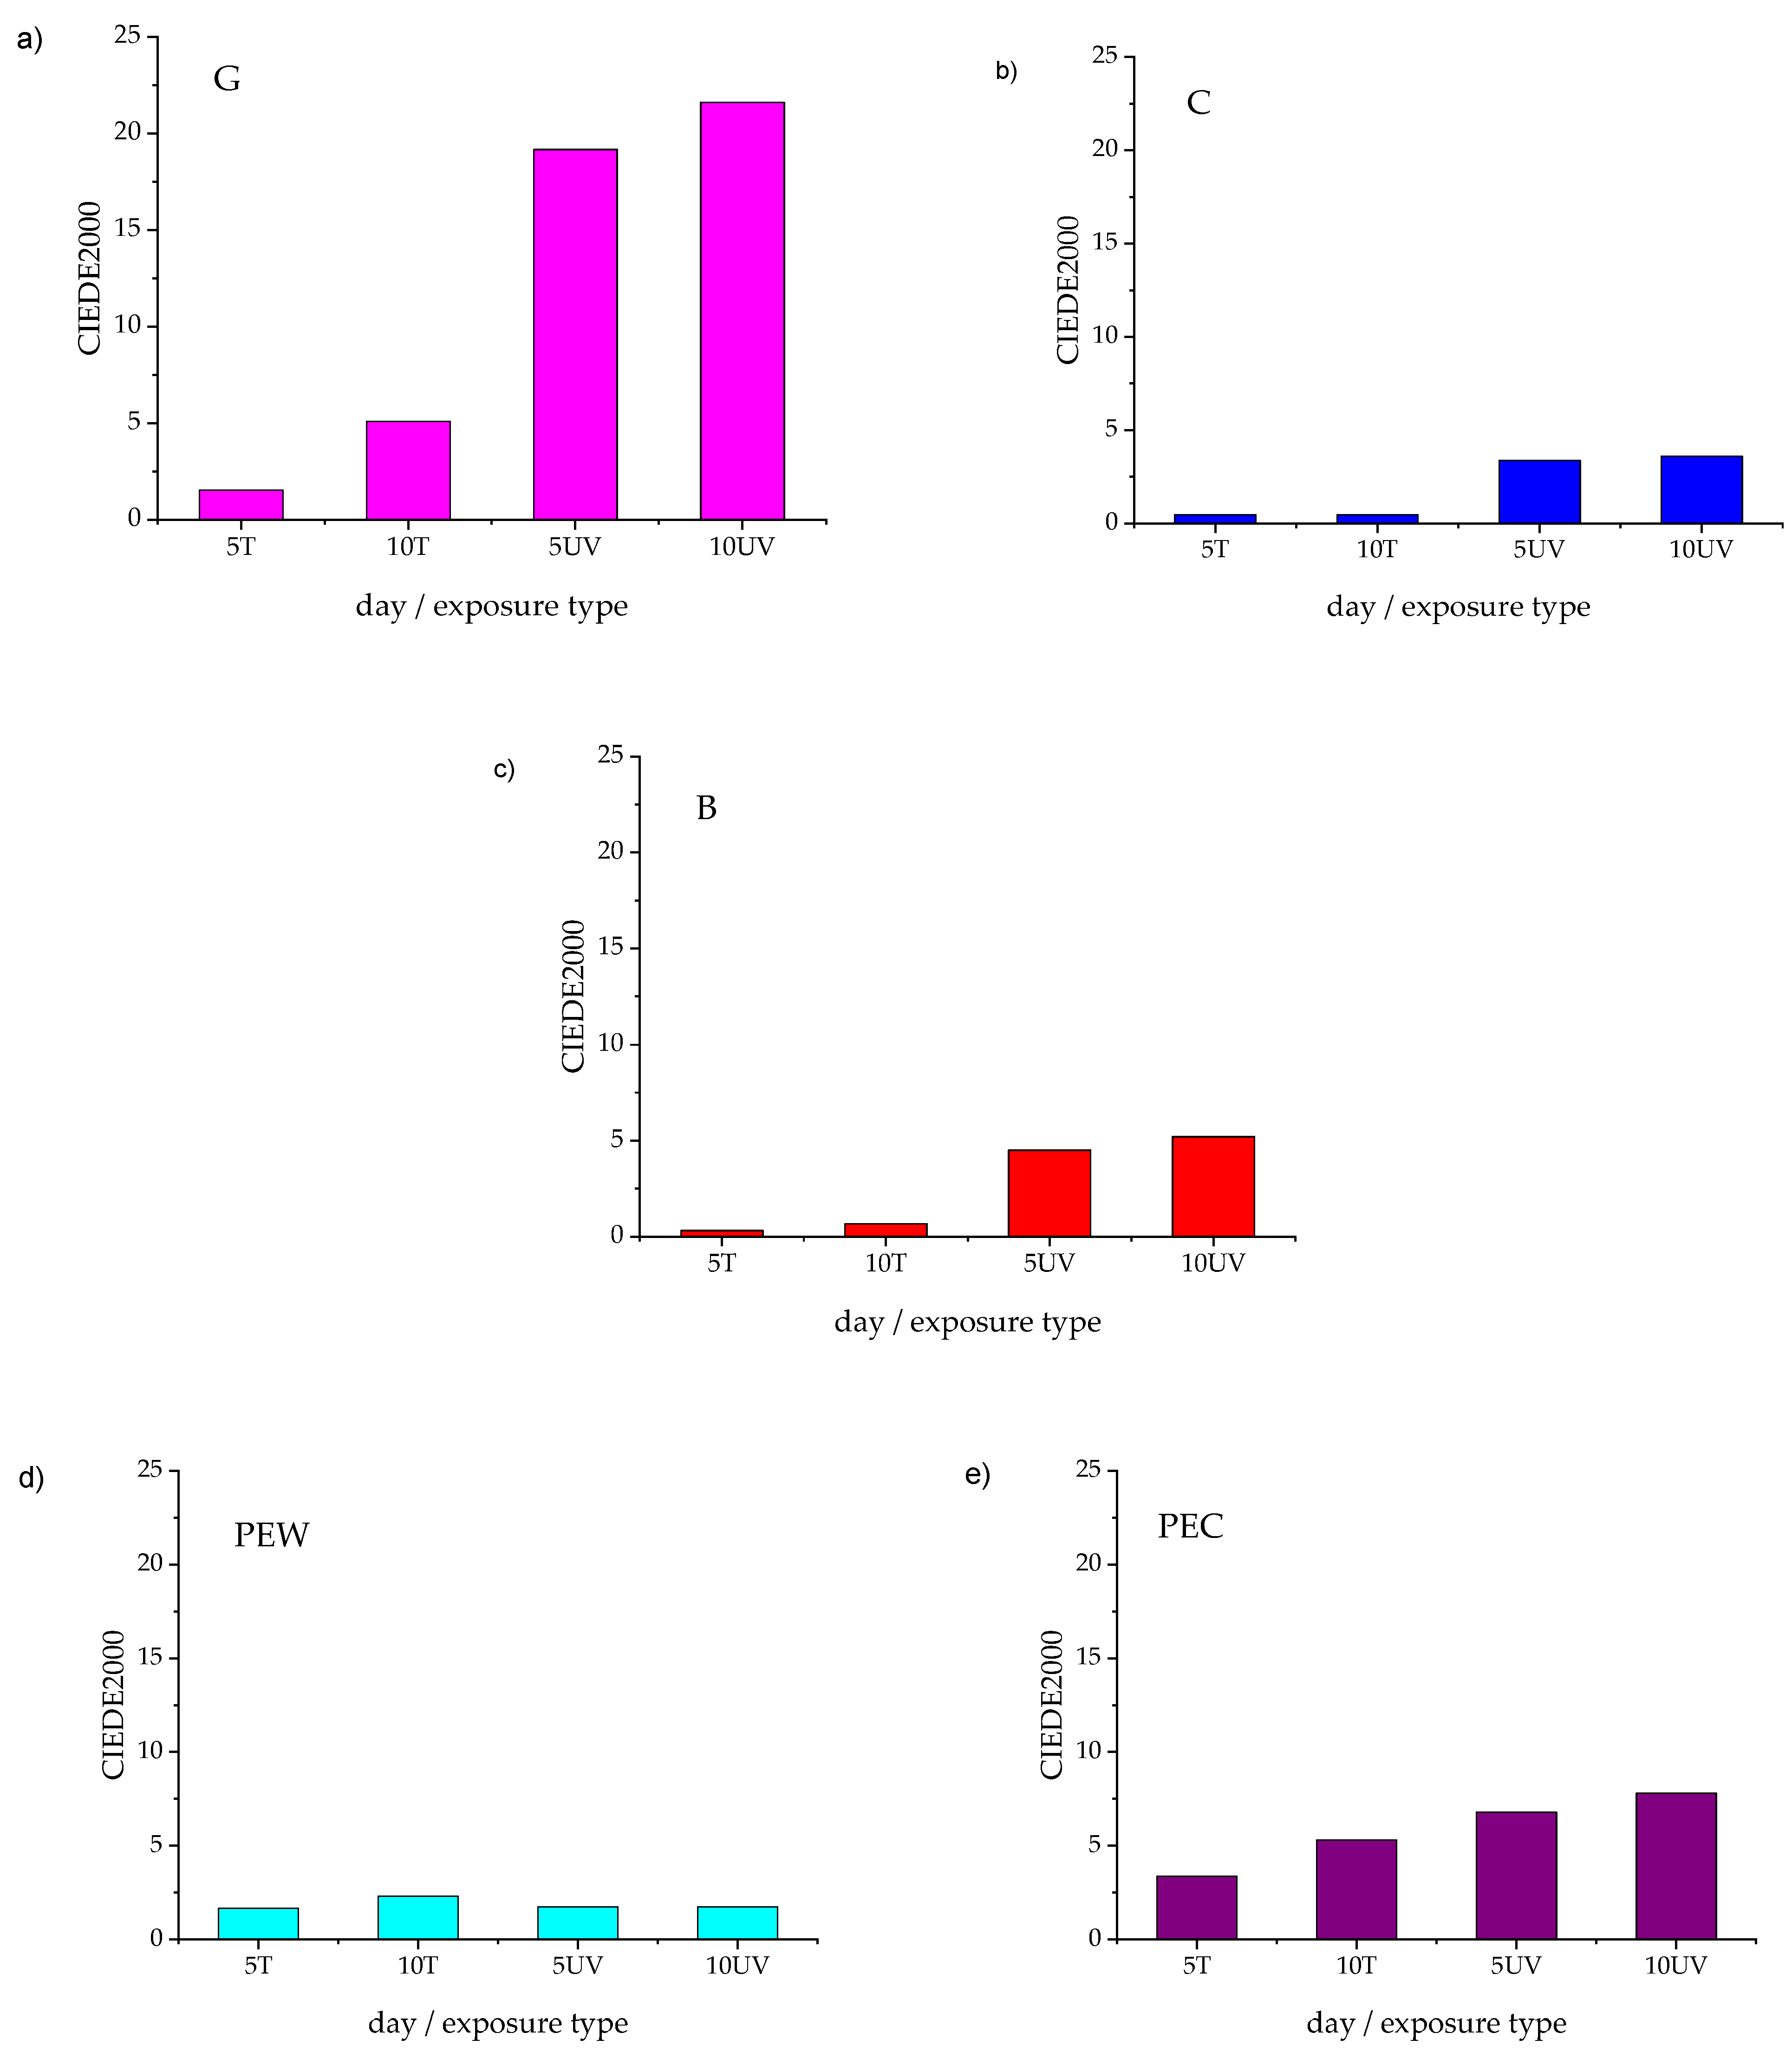
Color difference calculation CIEDE2000 shows that there was a greater color change on the examined substrates after UV exposure than after exposure to elevated temperature (Figure 4). To obtain more information about the color change, the individual color parameters L* (Lightness), C* (Chroma) and h° (hue) were also observed. In grape based PSL after UV exposure, the change in color tone is most noticeable. In all other bio-based PSL the change remained within the same quadrant in the CIELAB color space while in the grape-based substrate the color change was extended to another quadrant. In addition to hue (h°), chroma (C*) was drastically reduced after exposure of the samples to UV light. The change in C* decreased from 31.7 to 3.8 units (Table 2). A higher value indicates higher color intensities [41].
After the exposure of the grape-based sample to elevated temperature, the change in hue and chroma is not large. It is interesting to note that chroma decreases only on this substrate in contrast to citrus and barley-based substrates where chroma increases with longer exposure to temperature. In citrus-based substrates, the change in hue is greater than the change in chroma after prolonged UV exposure while the elevated temperature had very little effect on this substrate. Barley-based substrates recorded approximately equal changes in hue and chromaticity but showed the largest change in lightness L* compared to other samples.

3.4. FTIR Spectroscopy

The IR spectrum of the surface of fiber based PSL corresponds to the spectrum of cellulose (Figure 5a). In addition to cellulose, the IR spectra of studied samples show vibrational bands related to additives (fillers, sizing agents, etc.). The FTIR spectra did not reveal the presence of optical brighteners in the structure of studied samples since incorporated organic reagents present in papers are difficult to detect using conventional spectroscopic techniques due to their low concentrations [42]. The changes in grape based sample, compared to citrus and barley-based sample can be observed in the spectral range between 1500 and 1300 cm−1 where deformational vibration of a group of cellulose are present due to changes in cellulose structure by rearrangement in hydrogen bonding occurring from additives added during paper manufacture or processing of cellulose pulp [43,44]. This may lead to changes from crystalline to amorphous forms, and changes to the vibrational pattern of C-C-H, C-OH, O-C-H and H-C-H bending vibrations. In the fingerprint region, calcium carbonate can be described with three absorption bands at 871 and 707 cm–1 [45,46], which can be attributed to the CO3 and CO2 bending vibration of calcium carbonate. The antisymmetric bridge stretching of C-O-C groups is detected as a strong band at 1157 cm−1 while C-O stretching in cellulose/hemicellulose molecules is detected at 1103 cm−1 and very strong band at 1022 cm−1, which is accompanied by two characteristic peaks at 1049 and 993 cm−1 [45]. Those characteristic cellulose bands are observed for all fiber-based samples. The absorption band at 898 cm−1 (for citrus and barley-based samples) and 900 cm−1 (grape based), assigned to C-O-C stretching at β-(1-4)-glycosidic linkages. This band is called an “amorphous” absorption band [47]. Broadening of the band at 896 cm−1 reflects higher amount of disordered structure. The band at 1651 cm−1 (grape) 1645 cm−1 (citrus) 1643 cm−1 (barley) arises from the bending vibration of adsorbed water molecules (Figure 5a).
Bands associated with lignin cannot be identified in both, grape and barley based, PSL. In the paper industry, calcium carbonate serves as a filler because of its low light absorption that enhances light scattering and consequently increases brightness [48]. These properties correspond to the filler characteristics compatible for use in combination with OBAs [49].
The FTIR spectra of biobased polymer PSL, PEW and PEC, are clearly the same (Figure 5b). The influence of white pigment in polymer composition cannot be detected by FTIR spectroscopy.
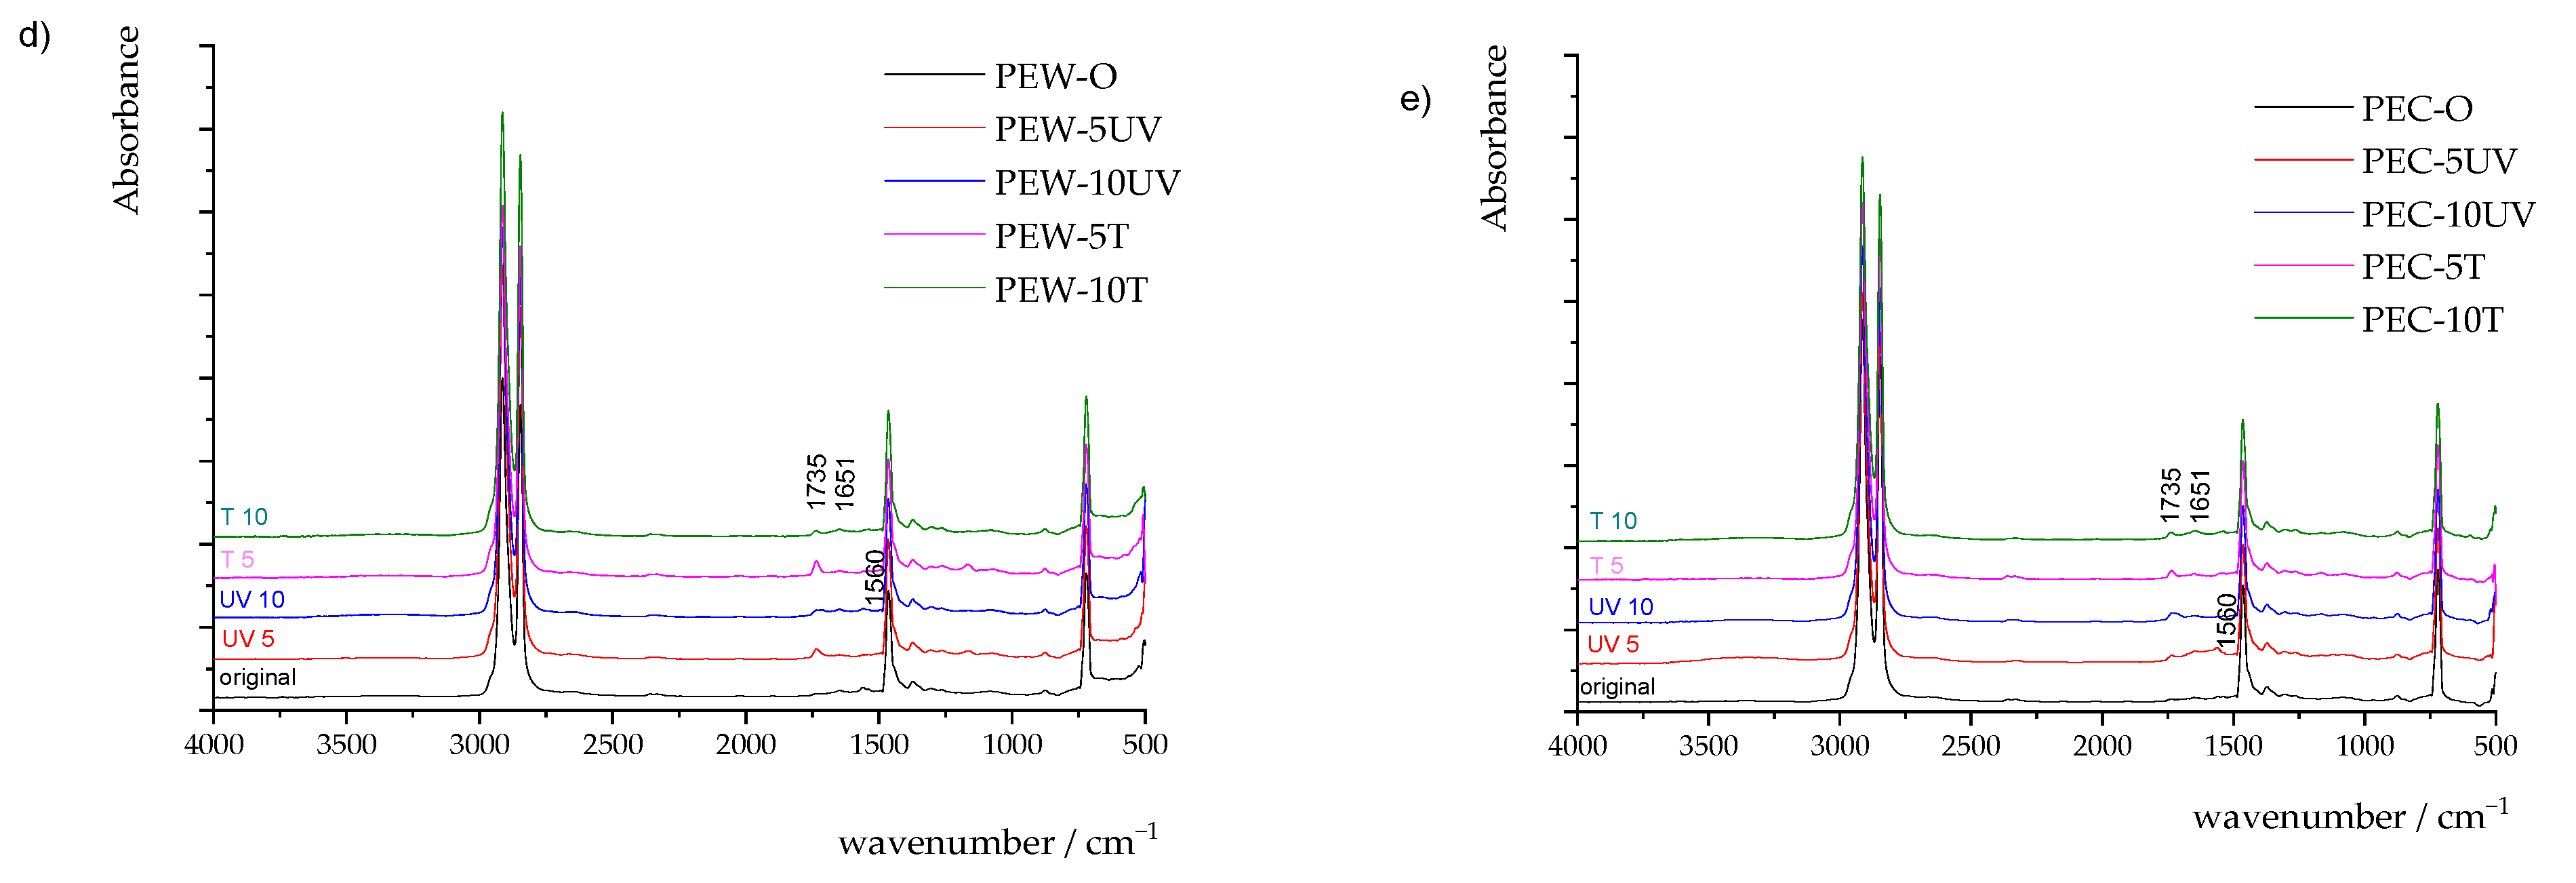
The FTIR spectra of PEW and PEC samples show characteristic bands of polyethylene with the two very strong vibrational bands of the doublet at 2914 cm−1 (CH2 asymmetric stretching) and 2846 cm−1 (CH2 symmetric stretching). The strong vibrational band at 1462 cm−1 is the bending deformation of methylene CH2 groups while the strong band at 719 cm−1 is assigned to CH2 rocking deformation in amorphous and crystalline domains. The weak vibrational band at 1377 cm−1 is related to CH3 symmetric deformation [50,51].
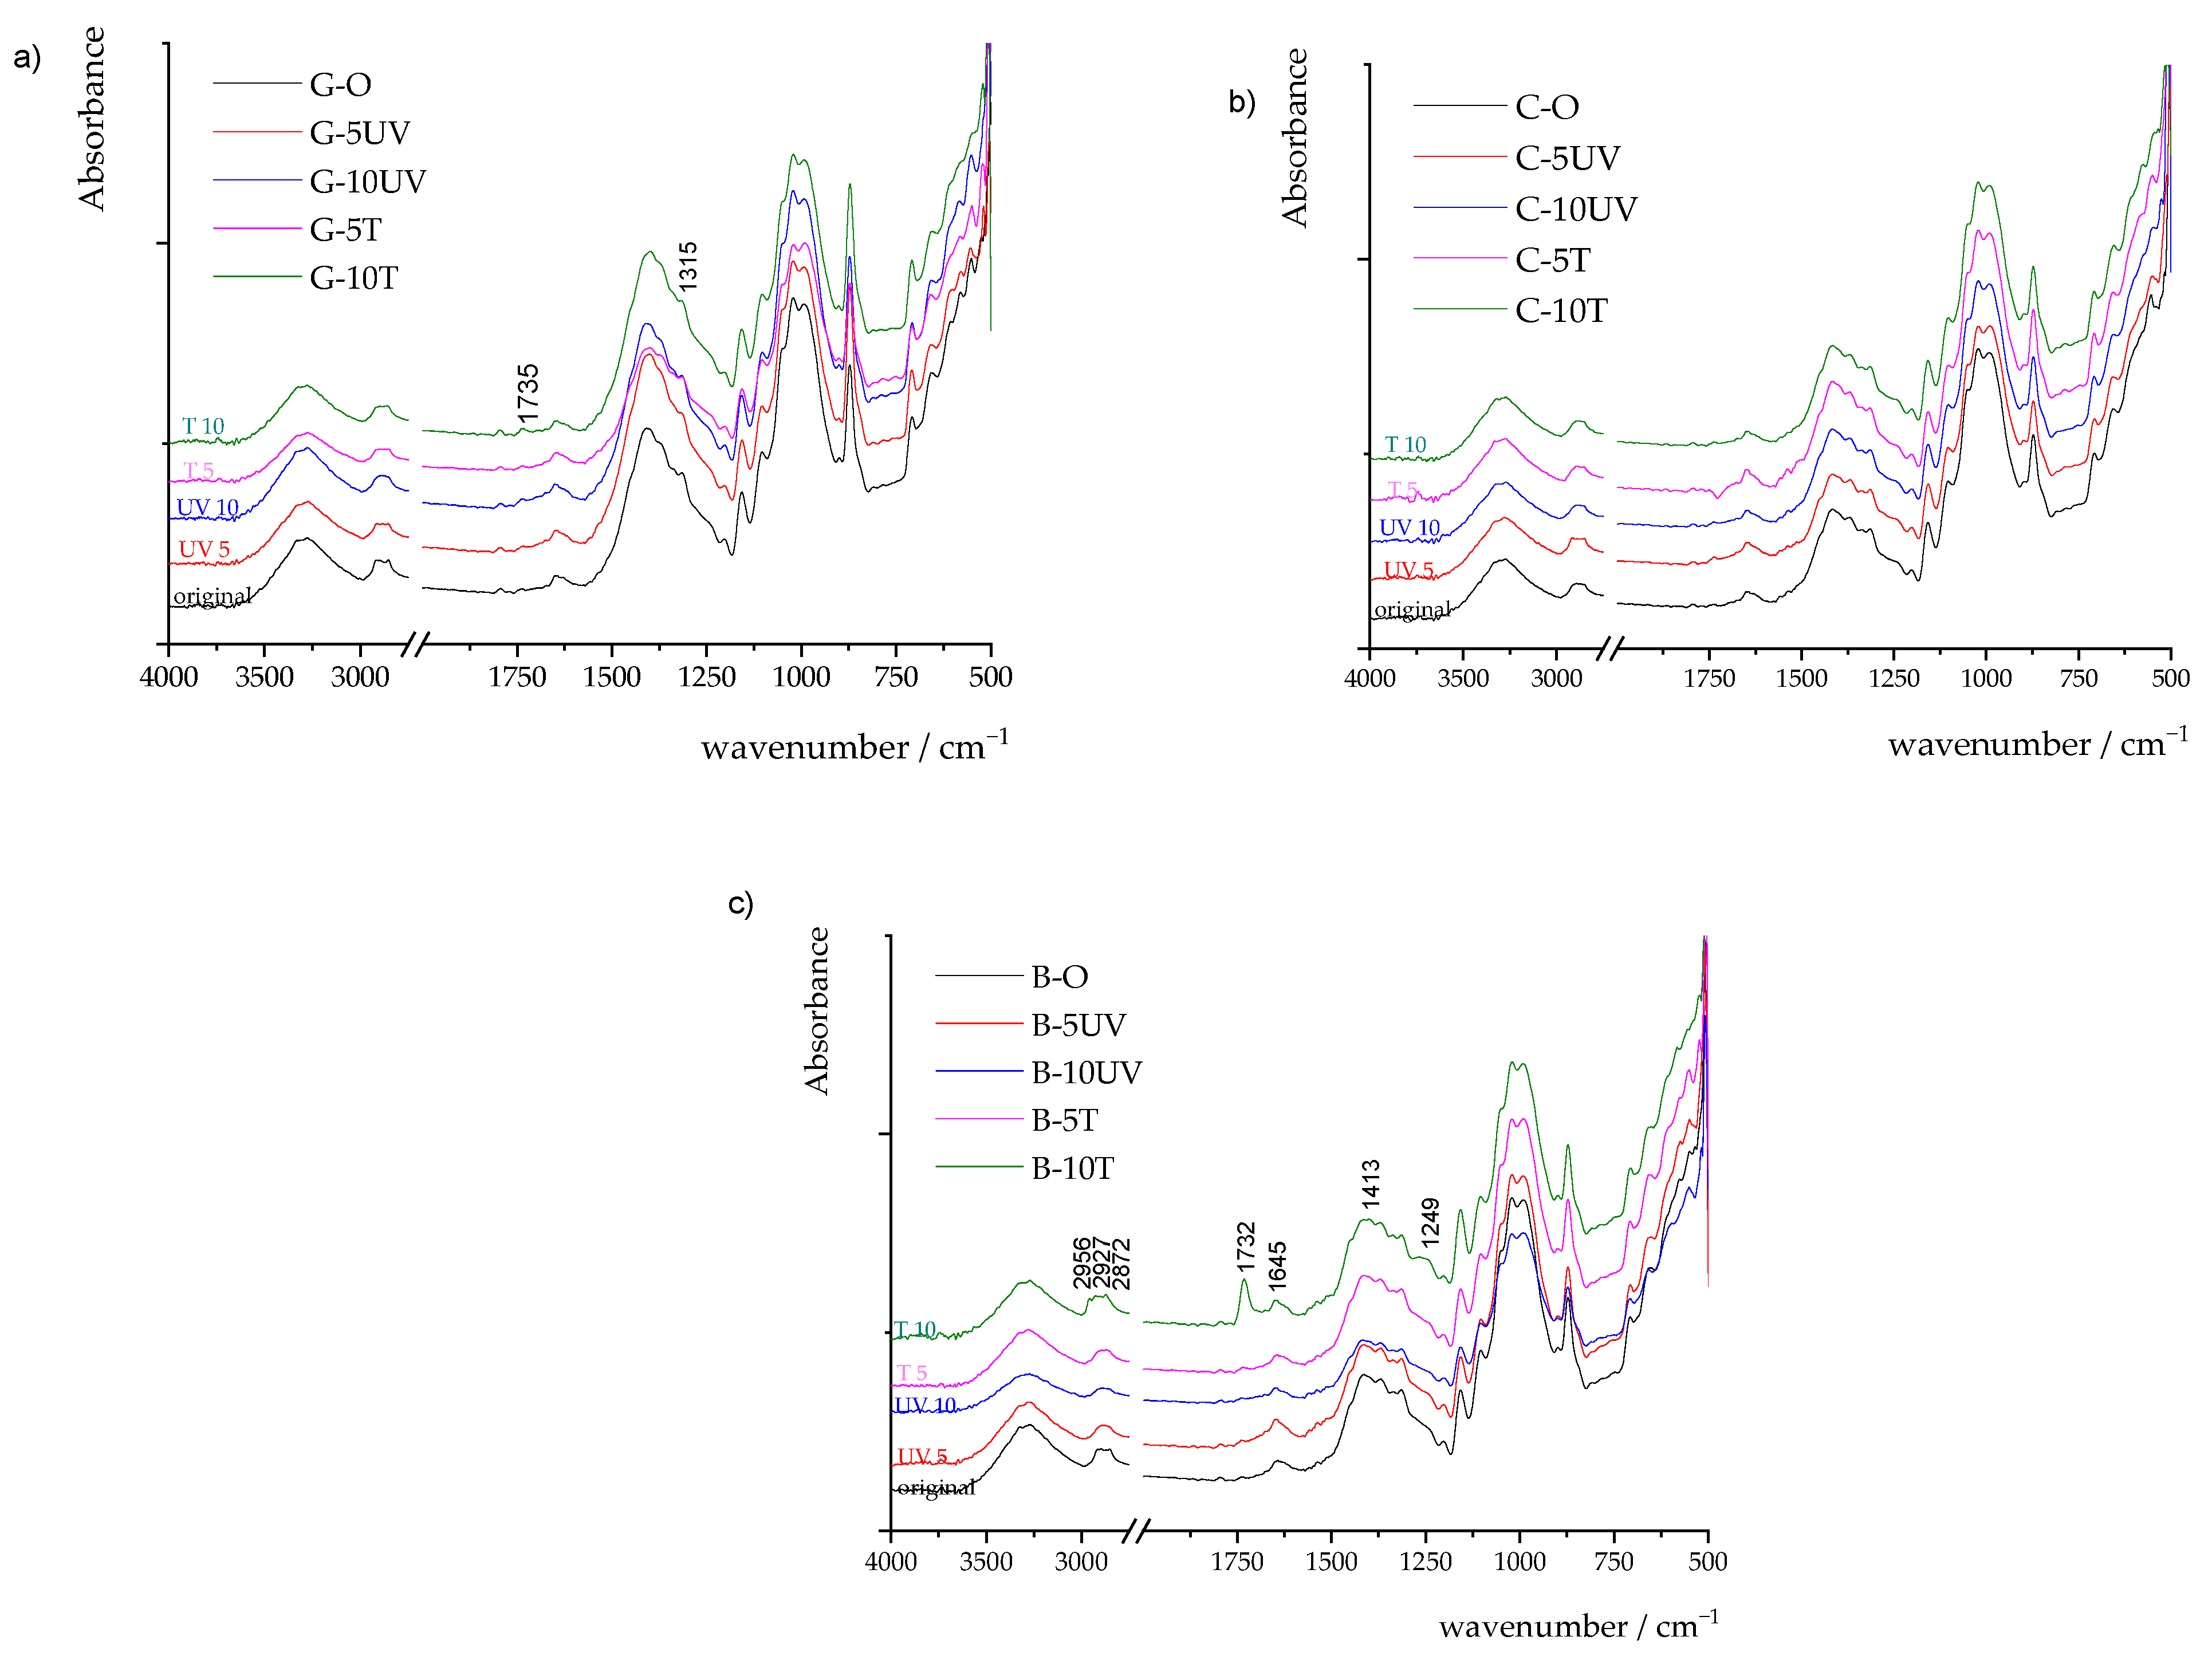
The FTIR spectroscopy of PSL indicates that on the surface of the samples only a slight change occurred during exposure to UV irradiation and elevated temperature and stability (Figure 6). Barley based PSL showed the highest rate of changes during exposure of samples to UV irradiation and elevated temperature and humidity. After exposure to elevated temperature and humidity for a duration of 10 days, the IR spectra of grape and barley based PSL (Figure 6a,c) showed a new weak band at around 1735 m−1 pointing to partial oxidation of the samples [52]. Carboxyl or aldehyde absorption bands occurring in cellulose chains can be detected in the IR spectra above 1700 cm−1 as arising from the opened terminal glucopyranose rings or oxidation of the C-OH groups, with a maximum around 1730 cm−1 [53]. The carbonyl bands occurring in the IR spectra of PEW and PEC samples, at around 1735 cm−1 after the exposure of samples to UV irradiation and temperature, were assigned to C=O stretching vibrations in aldehydes and/or esters pointing to slight oxidation of samples (Figure 6d,e).

4. Conclusions

The limiting circumstance of fiber based PSL, in this case fibers from agricultural waste and post-consumer recycled fibers, is that they cannot be used in applications that require rigid conditions such as high humidity, temperature and UV radiation. To increase the environmental sustainability in the packaging materials sector, the use of such materials should be increasingly encouraged whenever possible and when the application itself does not require extreme conditions. By using fiber based PSL, at the end of their life cycle, recyclable waste is generated that can potentially be a source of new recycled fibers as opposed to synthetic polymers that are more difficult to recycle, which are non-biodegradable and whose excessive accumulation in the environment causes permanent damage. This research has shown that PSL based on agro-industrial and post-consumer recycled fibers can be irreversibly damaged during storage in uncontrolled conditions of temperature and humidity, but also the effects of UV radiation during the shelf life of certain products. The results of the study showed higher stability of polymer based PSL, in comparison to fiber based PSL, as expected. In addition, this research has shown that optical brighteners are present in the composition of fiber based PSL. Moreover, the fluorescence and UV-Vis spectroscopy results indicated that by the action of UV irradiation and temperature, optical brighteners present in PSL facestock are degraded, which consequently causes a change in the colorimetric characteristics of the samples. Also, the fluorescence results show that the optical brighteners degrade by the action of UV radiation and to a smaller extent during exposure to elevated temperatures. FTIR spectroscopy has shown that fiber based PSL facestock corresponds to the spectra of cellulose, while for the polymer based PSL spectra there are some minor differences in the composition of the PSL facestock (papers) themselves used in the formation of the label, but FTIR spectroscopy did not reveal the presence of optical brighteners nor their degradation. The results of FTIR spectroscopy indicate that during exposure of the PSL to UV radiation and increased temperature and humidity, there were no significant chemical changes of cellulose on the surface of the samples, although insignificant oxidation is present. Nevertheless, this oxidation of cellulose did not directly affect the color change of the samples. Color changes that occur in the fiber based PSL can later cause a change in the color/stability of the prints, so when choosing a PSL, it is especially necessary to pay attention to the quality and stability of the layers of which it is made of, to make the final product as good as possible. This paper shows that no physical degradation of PSL occurred during the exposure to UV irradiation and elevated temperature and humidity, but only a color change. Further research will therefore be focused on examining whether the stability of optical brighteners present in fiber based PSL will affect the quality of prints.

Author Contributions

Conceptualization, M.V. and K.I.I.; methodology, M.V., K.I.I. and R.K.; software, K.I.I. and R.K.; validation, M.V., K.I.I., R.K. and A.M.D.; formal analysis, K.I.I. and R.K..; investigation, M.V., K.I.I., R.K. and A.M.D.; resources, A.M.D., K.I.I., R.K. and M.V.; data curation, M.V., K.I.I. and R.K.; writing—original draft preparation, M.V. and K.I.I.; writing—review and editing, A.M.D. and R.K.; visualization, M.V. and K.I.I.; supervision, R.K.; project administration, M.V.; funding acquisition, M.V., K.I.I., R.K. and A.M.D. All authors have read and agreed to the published version of the manuscript.

Funding

The APC was funded by University of Zagreb.

Data Availability Statement

Not Applicable.

Conflicts of Interest

The authors declare no conflict of interest.

References

  1. Siracusa, V.; Rocculi, P.; Romani, S.; Rosa, M.D. Biodegradable polymers for food packaging: A review. Trends Food Sci. Technol. 2008, 19, 634–643. [Google Scholar] [CrossRef]
  2. Branowski, B.; Zabłocki, M.; Sydor, M. The Material Indices Method in the Sustainable Engineering Design Process: A Review. Sustainability 2019, 11, 5465. [Google Scholar] [CrossRef] [Green Version]
  3. OECD. Circular Economy, Waste and Materials. Environment at A Glance. 2000, pp. 1–12. Available online: https://www.oecd.org/environment/environment-at-a-glance/Circular-Economy-Waste-Materials-Archive-February-2020.pdf (accessed on 14 September 2021).
  4. Abd El-Sayed, E.S.; El-Sakhawy, M.; El-Sakhawy, M.A.M. Non-wood fibers as raw material for pulp and paper industry. Nord. Pulp Pap. Res. J. 2020, 35, 215–230. [Google Scholar] [CrossRef]
  5. Vallejo, M.; Cordeiro, R.; Dias, P.A.N.; Moura, C.; Henriques, M.; Seabra, I.J.; Malça, C.M.; Morouço, P. Recovery and evaluation of cellulose from agroindustrial residues of corn, grape, pomegranate, strawberry-tree fruit and fava. Bioresour. Bioprocess. 2021, 8, 25. [Google Scholar] [CrossRef]
  6. El Halal, S.L.M.; Colussi, R.; Deon, V.G.; Pinto, V.Z.; Villanova, F.A.; Carreño, N.L.V.; Dias, A.R.G.; Zavareze, E.D.R. Films based on oxidized starch and cellulose from barley. Carbohydr. Polym. 2015, 133, 644–653. [Google Scholar] [CrossRef] [Green Version]
  7. Espino, E.; Cakir, M.; Domenek, S.; Román-Gutiérrez, A.D.; Belgacem, N.; Bras, J. Isolation and characterization of cellulose nanocrystals from industrial by-products of Agave tequilana and barley. Ind. Crops Prod. 2014, 62, 552–559. [Google Scholar] [CrossRef]
  8. Alzate Acevedo, S.; Díaz Carrillo, Á.J.; Flórez-López, E.; Grande-Tovar, C.D. Recovery of Banana Waste-Loss from Production and Processing: A Contribution to a Circular Economy. Molecules 2021, 26, 5282. [Google Scholar] [CrossRef]
  9. Scurria, A.; Albanese, L.; Pagliaro, M.; Zabini, F.; Giordano, F.; Meneguzzo, F.; Ciriminna, R. CytroCell: Valued Cellulose from Citrus Processing Waste. Molecules 2021, 26, 596. [Google Scholar] [CrossRef]
  10. Mariño, M.; Lopes da Silva, L.; Durán, N.; Tasic, L. Enhanced Materials from Nature: Nanocellulose from Citrus Waste. Molecules 2015, 20, 5908–5923. [Google Scholar] [CrossRef]
  11. Tayengwa, T.; Mapiye, C. Citrus and Winery Wastes: Promising Dietary Supplements for Sustainable Ruminant Animal Nutrition, Health, Production, and Meat Quality. Sustainability 2018, 10, 3718. [Google Scholar] [CrossRef] [Green Version]
  12. Ramdhonee, A.; Jeetah, P. Production of wrapping paper from banana fibres. J. Environ. Chem. Eng. 2017, 5, 4298–4306. [Google Scholar] [CrossRef]
  13. Sibaly, S.; Jeetah, P. Production of paper from pineapple leaves. J. Environ. Chem. Eng. 2017, 5, 5978–5986. [Google Scholar] [CrossRef]
  14. Chavan, P.; Singh, A.K.; Kaur, G. Recent progress in the utilization of industrial waste and by-products of citrus fruits: A review. J. Food Process Eng. 2018, 41, 1–10. [Google Scholar] [CrossRef]
  15. The AWAreness Report Global Pressure-Sensitive Adhesives Market. 2021. Available online: https://www.labelsandlabeling.com/news/industry-updates/awa-publishes-2021-awareness-report (accessed on 14 September 2021).
  16. Tesařová, M.; Krmela, A.; Šimberová, I. Digital support to external sustainability communication in self-adhesive labelling industry. Entrep. Sustain. Issues 2020, 7, 2109–2125. [Google Scholar] [CrossRef]
  17. Medeiros, D.L.; Braghirolli, F.L.; Ramlow, H.; Ferri, G.N.; Kiperstok, A. Environmental improvement in the printing industry: The case study of self-adhesive labels. Environ. Sci. Pollut. Res. 2019, 26, 13195–13209. [Google Scholar] [CrossRef] [PubMed]
  18. Marošević Dolovski, A. Etikete i etiketiranje. Print Mag. 2016, 4, 34–40. [Google Scholar]
  19. Avery Dennison. Tehnical Data Sheet Fasson ® PE85 BIOB WHITE S692N-BG40WH FSC PE85. Spec Code: BC449. 2021. Available online: https://www.pds.averydennison.com/content/PDS/BC449 (accessed on 14 September 2021).
  20. Avery Dennison. Tehnical Data Sheet Fasson ® PE85 BIOB CLEAR S692N-BG40WH FSC PE85. Spec Code: BD380. 2021. Available online: https://www.pds.averydennison.com/content/PDS/BD380 (accessed on 14 September 2021).
  21. Avery Dennison. Tehnical Data Sheet Fasson ® rCRUSH CITRUS FSC S2030-BG45WH FSC. Spec Code: BT025. 2021. Available online: https://www.pds.averydennison.com/content/PDS/AE294?UL=4 (accessed on 14 September 2021).
  22. Avery Dennison. Tehnical Data Sheet Fasson ® rCRUSH GRAPE FSC S2047N-BG45WH IMP FSC. Spec Code: BD733. 2021. Available online: https://www.pds.averydennison.com/content/PDS/BD733 (accessed on 14 September 2021).
  23. Avery Dennison. Tehnical Data Sheet Fasson ® rCRUSH BARLEY FSC S2030-BG45WH FSC. Spec Code: BT024. 2021. Available online: https://www.pds.averydennison.com/content/PDS/BT024 (accessed on 14 September 2021).
  24. Avery Dennison. Bio-Based PE Film—A Sugar-Sweet Opportunity, Product Overview. 2016, p. 2. Available online: https://label.averydennison.com/content/dam/averydennison/lpm-responsive/na/doc/product-overviews/product/Film/sustainabiliy-and-clear-intent/po-eu-bio-based-pe.pdf (accessed on 14 September 2021).
  25. Shaw, P.S.; Li, Z. On the fluorescence from integrating spheres. Appl. Opt. 2008, 47, 3962–3967. [Google Scholar] [CrossRef] [PubMed]
  26. Zwinkels, J.C. Errors and accuracies in integrating sphere measurements of diffuse reflectance and transmittance. In Proceedings of the Workshop on Optical Property Measurement Techniques, Ispra, Italy, 27–29 October 1987. [Google Scholar]
  27. Zwinkels, J.C.; DeRose, P.C.; Leland, J.E. Spectral Fluorescence Measurements; Elsevier Inc.: Amsterdam, The Netherlands, 2014. [Google Scholar]
  28. CIE Central Bureau. Colorimetry, 3rd ed.; CIE Central Bureau: Vienna, Austria, 2004. [Google Scholar]
  29. Pauler, N. Paper Optics; AB Lorentzen & Wettre: Stockholm, Sweden, 2012. [Google Scholar]
  30. Brand, L.; Johnson, M.L. An Introduction to Fluorescence Spectroscopy; PerkinElmer: Buckinghamshire, UK, 2011; p. 15. [Google Scholar]
  31. Itagaki, H. Fluorescence Spectroscopy; Academic Press: San Diego, CA, USA, 2012. [Google Scholar]
  32. Mercer, A.V. Fluorescent Brightening Agents: Colourants and Auxiliaries. Org. Chem. Appl. Prop. 1990, 2, 471–511. [Google Scholar]
  33. Shakespeare, D.T.; Shakespeare, D.J. Fluorescence and the Paper Appearance-Challenges in Paper Coloring. In Proceedings of the Papermaking Research Symposium (PRS): Web Tension Variations and Runnability of the Open Draw Section, Kuopio, Finland, 1–4 June 2009; pp. 1–4. [Google Scholar]
  34. Coppel, L.G.; Andersson, M.; Edström, P.; Kinnunen, J. Limitations in the efficiency of fluorescent whitening agents in uncoated paper. Nord. Pulp Pap. Res. J. 2011, 26, 319–328. [Google Scholar] [CrossRef] [Green Version]
  35. Coppel, L.G. Whiteness and Fluorescence in Paper-Perception and Optical Modelling; Kopieringen Mittuniversitetet: Sundsvall, Sweden, 2010. [Google Scholar]
  36. Prozil, S.O.; Evtuguin, D.V.; Lopes, L.P.C. Chemical composition of grape stalks of Vitis vinifera L. from red grape pomaces. Ind. Crops Prod. 2012, 35, 178–184. [Google Scholar] [CrossRef]
  37. Amendola, D.; De Faveri, D.M.; Egües, I.; Serrano, L.; Labidi, J.; Spigno, G. Autohydrolysis and organosolv process for recovery of hemicelluloses, phenolic compounds and lignin from grape stalks. Bioresour. Technol. 2012, 107, 267–274. [Google Scholar] [CrossRef]
  38. Lundberg, B.; Pan, X.; White, A.; Chau, H.; Hotchkiss, A. Rheology and composition of citrus fiber. J. Food Eng. 2014, 125, 97–104. [Google Scholar] [CrossRef]
  39. Mussatto, S.I.; Dragone, G.; Roberto, I.C. Brewers’ spent grain: Generation, characteristics and potential applications. J. Cereal Sci. 2006, 43, 1–14. [Google Scholar] [CrossRef]
  40. Pickett, J.E. Permanence of UV Absorbers in Plastics and. In Handbook of Polymer Degradation; Taylor & Francis: Boca Raton, FL, USA, 2000; p. 163. [Google Scholar]
  41. Berns, R.S. Billmeyer and Saltzman’s Principles of Color Technology; Wiley: Hoboken, NJ, USA, 2019. [Google Scholar]
  42. Brinen, J.S. The observation and distribution of organic additives on paper surfaces using surface spectroscopic techniques. Nord. Pulp Pap. Res. J. 1993, 8, 123–129. [Google Scholar] [CrossRef]
  43. Tomšič, B.; Simončič, B.; Orel, B.; Vilčnik, A.; Spreizer, H. Biodegradability of cellulose fabric modified by imidazolidinone. Carbohydr. Polym. 2007, 69, 478–488. [Google Scholar] [CrossRef]
  44. Fan, M.; Dai, D.; Huang, B. Fourier Transform-Materials Analysis; InTechOpen: Shangai, China, 2012; pp. 45–68. [Google Scholar]
  45. Ferreira, P.J.; Gamelas, A.; Moutinho, I.M.; Ferreira, A.G.; Go, N.; Molleda, C.; Figueiredo, M.M. Application of FT-IR-ATR Spectroscopy to Evaluate the Penetration of Surface Sizing Agents into the Paper Structure; American Chemical Society: Washington, WA, USA, 2009; pp. 3867–3872. [Google Scholar]
  46. Grilj, S.; Klanjšek Gunde, M.; Szentgyörgyvölgyi, R.; Gregor-Svetec, D. FT-IR and UV/VIS analysis of classic and recycled papers. Papíripar 2012, 56, 7–13. [Google Scholar]
  47. Ciolacu, D.; Ciolacu, F.; Popa, V.I. Amorphous Cellulose–Structure and Characterization. Cellul. Chem. Technol. 2011, 45, 13–21. [Google Scholar] [CrossRef] [Green Version]
  48. Fjellström, H.; Höglund, H.; Forsberg, S.; Paulsson, M. The UV-screening properties of coating layers: The influence of pigments, binders and additives. Nord. Pulp Pap. Res. J. 2009, 24, 206–212. [Google Scholar] [CrossRef] [Green Version]
  49. Heikkilä, K.; Alatalo, M. Grankvist, Laboratory Studies of Simultaneous Use of Titanium Dioxide Pigment and Fluorescent Whitening Agent in Double Coated Printing Paper. In Proceedings of the Coating Papermakers Conference, New Orleans, LA, USA, 4–6 May 1998; pp. 355–372. [Google Scholar]
  50. Hamzah, M.; Khenfouch, M.; Rjeb, A.; Sayouri, S.; Houssaini, D.S.; Darhouri, M.; Srinivasu, V.V. Surface chemistry changes and microstructure evaluation of low density nanocluster polyethylene under natural weathering: A spectroscopic investigation. J. Phys. Conf. Ser. 2018, 984, 012010. [Google Scholar] [CrossRef]
  51. Gulmine, J.V.; Janissek, P.R.; Heise, H.M.; Akcelrud, L. Polyethylene characterization by FTIR. Polym. Test. 2002, 21, 557–563. [Google Scholar] [CrossRef]
  52. Durmić, A.; Rožić, M.; Vukoje, M. Mechanisms of paper degradation in different conditions. In Proceedings of the International Conference Printing and Design 2017, Zagreb, Croatia, 9–10 March 2017; pp. 118–125. [Google Scholar]
  53. Łojewska, J.; Lubańska, A.; Miśkowiec, P.; Łojewski, T.; Proniewicz, L.M. FTIR in situ transmission studies on the kinetics of paper degradation via hydrolytic and oxidative reaction paths. Appl. Phys. A 2006, 83, 597–603. [Google Scholar] [CrossRef]
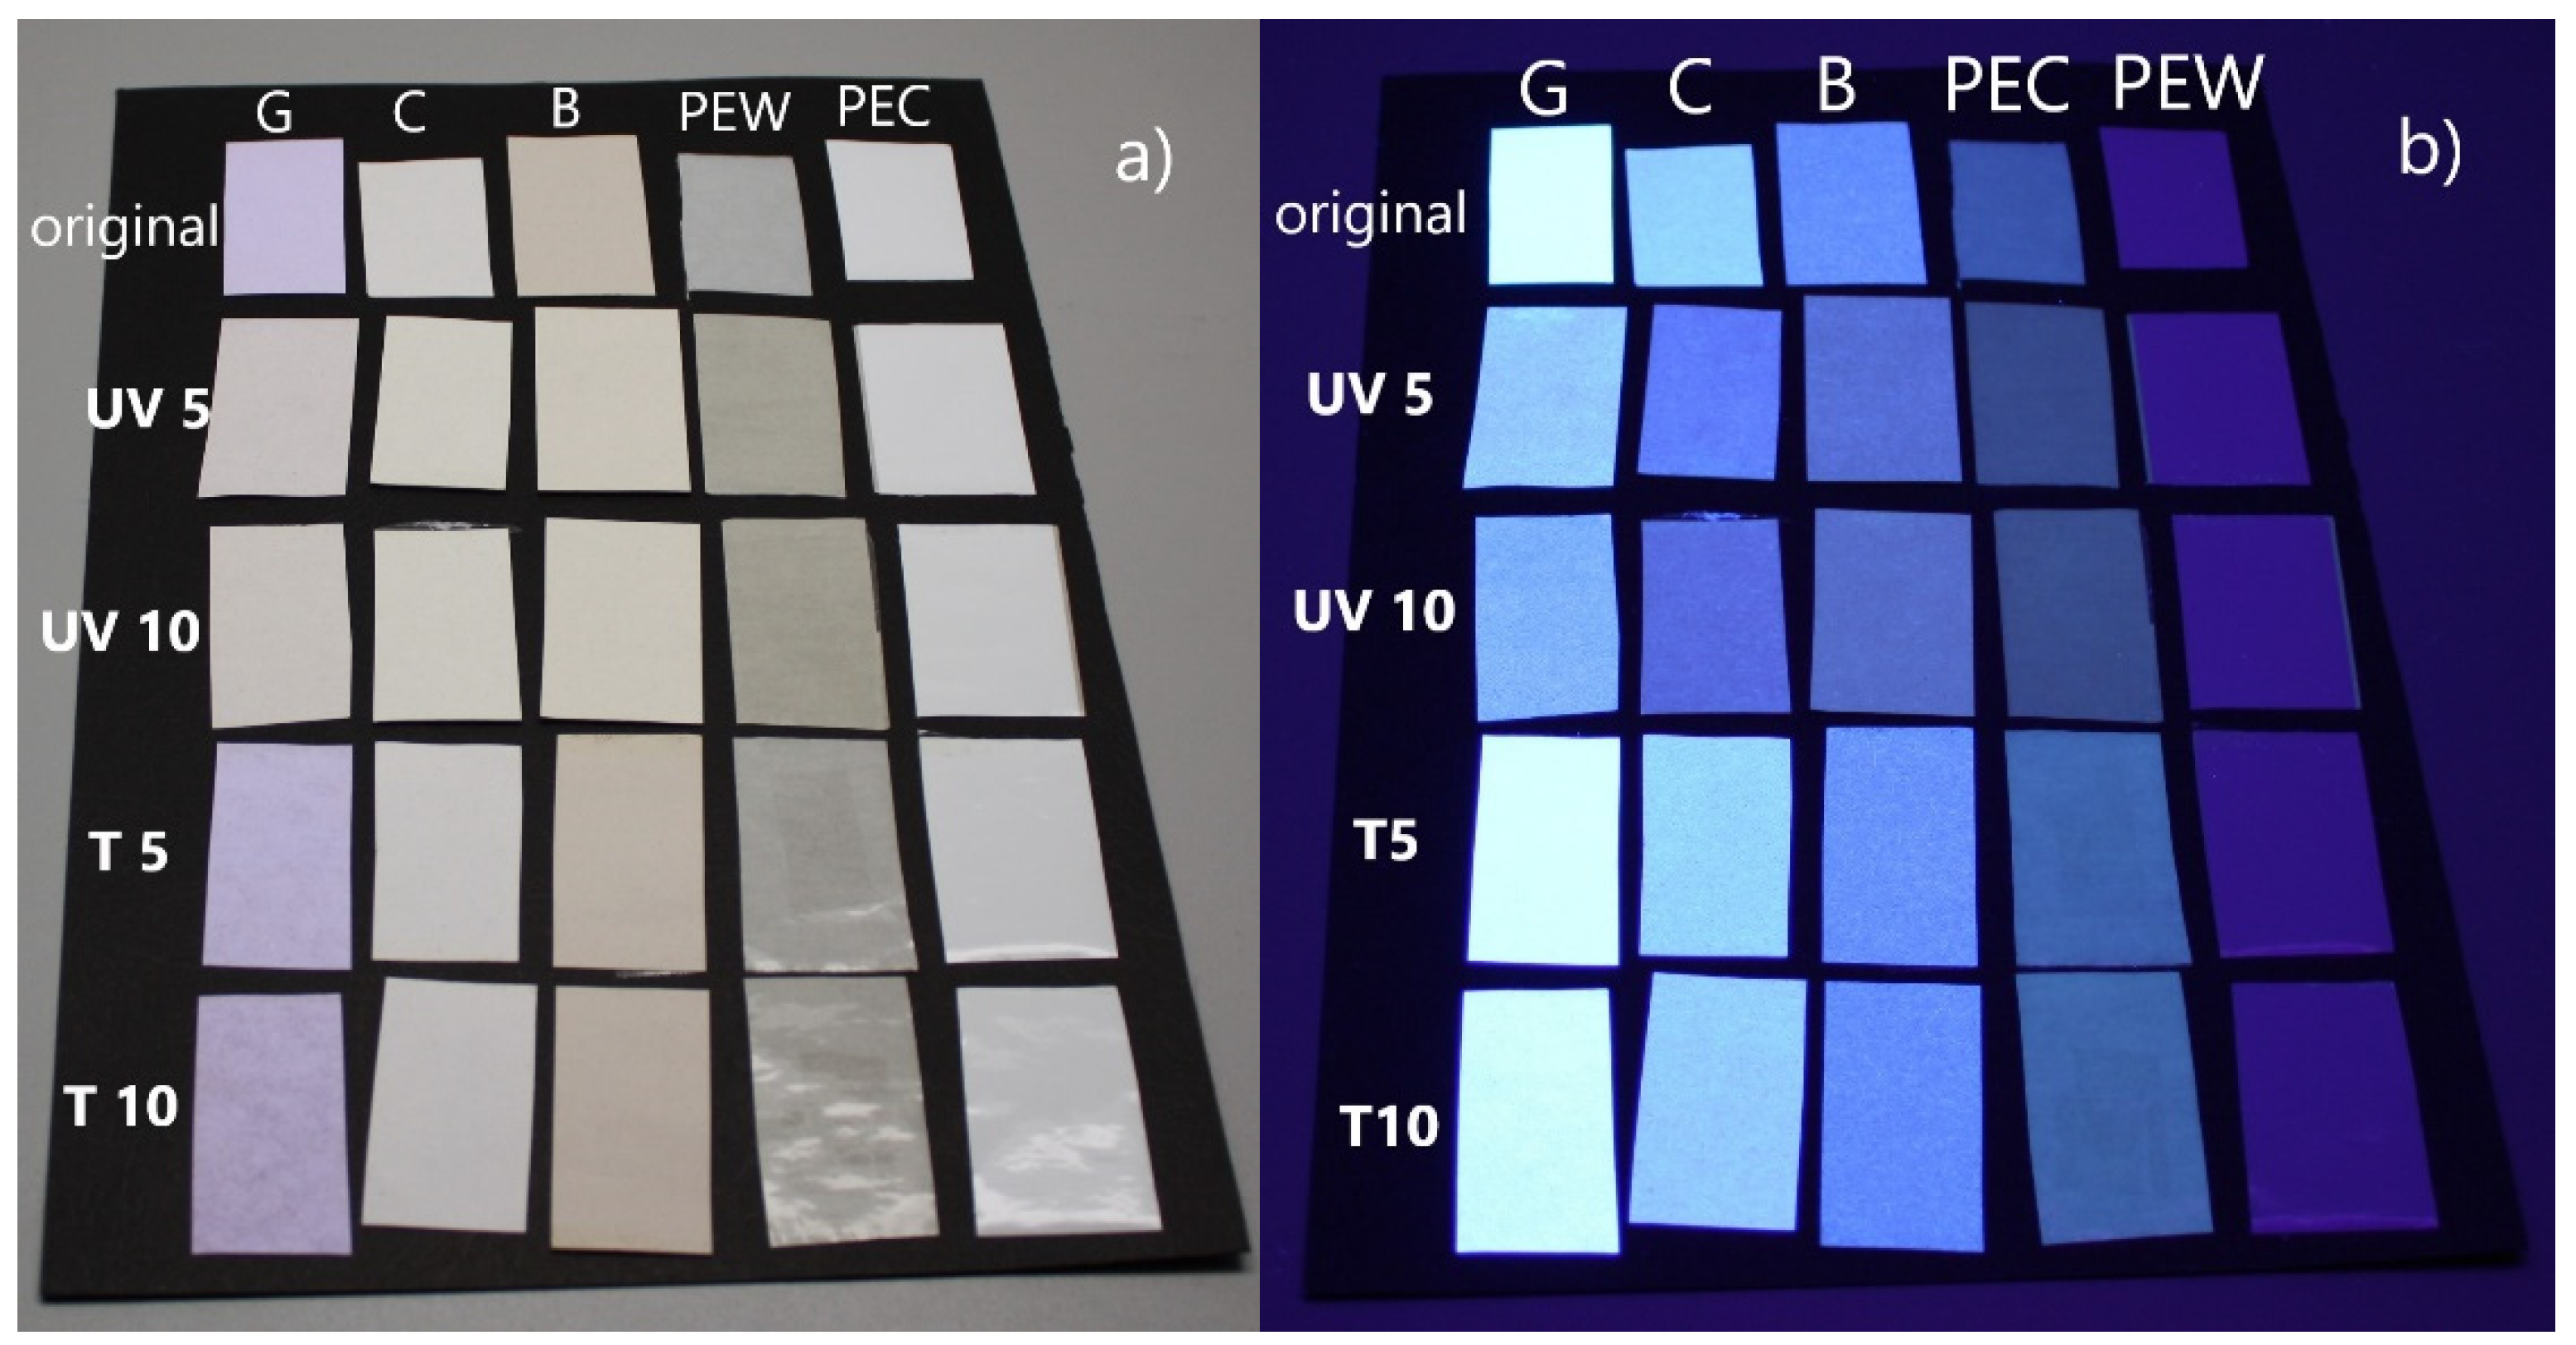
Figure 1. Visual evaluation of fiber based and polymer based PSL under (a) illuminant D50 and (b) illuminant UV.
Forests 12 01703 g001
Figure 2. Fluorescence intensity spectra of original and treated PSL samples: (a) grape fiber based, (b) citrus fiber based, (c) barley fiber based and (d) PE polymer based.
Forests 12 01703 g002
Figure 3. Spectral reflection curves in the UV-Vis range (300 to 700 nm) PLS made of (a) grape, (b) citrus, (c) barley, (d) polyethylene white and (e) polyethylene clear.
Forests 12 01703 g003
Figure 4. CIEDE2000 color difference between original and treated PSL samples after 5 days of exposure to temperature (5T), 10 days of exposure to temperature (10T), 5 days of exposure to UV radiation (5UV) and 10 days of exposure to UV radiation (10UV) for (a) grape, (b) citrus, (c) barley, (d) polyethylene white and (e) polyethylene clear.
Forests 12 01703 g004
Figure 5. FTIR spectra of original untreated PSL samples: (a) fiber based and (b) PE polymer based.
Forests 12 01703 g005
Figure 6. FTIR spectra of original and treated PSL samples: (a) grape fiber based, (b) citrus fiber based, (c) barley fiber based, (d) polymer fiber based white and (e) polymer based clear.
Forests 12 01703 g006aForests 12 01703 g006b
Table 1. Properties of used PSL given by the producer [19,20,21,22,23].
FacestockLinerTotal Laminate
Substrate GradeAbbreviationBasis Weight ISO 536, g/m2Caliper ISO 534, µmBasis Weight ISO 536, g/m2Caliper ISO 534, µmCaliper ISO 534, µm
Fasson® rCRUSH BARLEY FSC S2030-BG45WH FSCB901107061190 ± 10%
Fasson® rCRUSH GRAPE FSC S2047N-BG45WH IMP FSCG901147061192 ± 10%
Fasson® rCRUSH CITRUS FSC S2030-BG45WH FSCC1001307061210 ± 10%
Fasson® PE85 BIOB CLEAR S692N-BG40WH FSCPEC78825953152 ± 10%
Fasson® PE85 BIOB WHITE S692N-BG40WH FSCPEW82825953152 ± 10%
Table 2. Colorimetric parameters L* C* h° of all PSL samples, untreated and treated by UV irradiation and elevated temperature and humidity.
SampleOriginalT-5 DaysT-10 DaysUV-5 DaysUV-10 Days
L* C* h° L* C* h° L* C* h° L* C* h° L* C* h°
B84.58.762.384.59.162.984.59.464.590.17.874.891.57.273.7
C93.93.655.4593.63.958.892.94.153.694.16.182.293.46.581.3
G87.431.7−66.486.129.6−65.082.825.1−61.888.63.822.890.04.559.1
PEW96.20.7107.397.61.668.296.62.255.998.41.890.897.91.981.6
PEC92.26.096.689.79.891.288.712.488.587.814.687.886.916.187.4
Publisher’s Note: MDPI stays neutral with regard to jurisdictional claims in published maps and institutional affiliations.