
Water Availability Controls the Biomass Increment of Melia dubia in South India
by
 , , ,
, , ,
Alexander Röll
1,*,† ,
,
Mundre N. Ramesha
1,2,†,
Roman M. Link
3,
Dietrich Hertel
4,
Bernhard Schuldt
3,4,
Shekhargouda L. Patil
2,5 and
Dirk Hölscher
1 1
Tropical Silviculture and Forest Ecology, University of Göttingen, 37077 Göttingen, Germany
2
ICAR-IISWC Research Centre, Ballari 583104, India
3
Ecophysiology and Vegetation Ecology, Julius-von-Sachs-Institute of Biological Sciences, University of Würzburg, 97082 Würzburg, Germany
4
Plant Ecology and Ecosystems Research, Albrecht-von-Haller Institute for Plant Sciences, University of Göttingen, 37073 Göttingen, Germany
5
ICAR-IIPR Research Centre, Dharwad 580005, India
*
Author to whom correspondence should be addressed.
†
The authors contributed equally to the manuscript.
Forests 2021, 12(12), 1675; https://doi.org/10.3390/f12121675
Submission received: 1 November 2021
/
Revised: 20 November 2021
/
Accepted: 23 November 2021
/
Published: 30 November 2021
(This article belongs to the Section Forest Hydrology)
Abstract
:Farmland tree cultivation is considered an important option for enhancing wood production. In South India, the native leaf-deciduous tree species Melia dubia is popular for short-rotation plantations. Across a rainfall gradient from 420 to 2170 mm year–1, we studied 186 farmland woodlots between one and nine years in age. The objectives were to identify the main factors controlling aboveground biomass (AGB) and growth rates. A power-law growth model predicts an average stand-level AGB of 93.8 Mg ha–1 for nine-year-old woodlots. The resulting average annual AGB increment over the length of the rotation cycle is 10.4 Mg ha–1 year–1, which falls within the range reported for other tropical tree plantations. When expressing the parameters of the growth model as functions of management, climate and soil variables, it explains 65% of the variance in AGB. The results indicate that water availability is the main driver of the growth of M. dubia. Compared to the effects of water availability, the effects of soil nutrients are 26% to 60% smaller. We conclude that because of its high biomass accumulation rates in farm forestry, M. dubia is a promising candidate for short-rotation plantations in South India and beyond.
1. Introduction
Increasing landscape tree cover and carbon sequestration is considered a cost-effective climate change mitigation tool. While natural secondary succession of native forest tree species is likely the preferred option from an ecological point of view, agroforests, farm woodlots and tree plantations are land-use options that can balance ecological and socio-economic needs [1,2,3,4]. They are considered particularly important regarding the extent and further expansion of global drylands [5,6,7]. Fast-growing short-rotation plantations constitute one potentially important component of future climate-smart ‘designer landscapes’ (see, e.g., [8]), particularly in tropical regions with climatically favorable conditions for fast growth. They can shift pressure from remaining forests and help to meet the booming wood demand in fast-emerging economies [9].
A prime example is India, which houses nearly 18% of the global human population on 2.4% of the world’s land area [10]. Its economic growth and increasing population are associated with an increasing demand for wood and wood-based products [11,12]. In 2019, India imported 8.7 billion USD worth of wood products (Figure S1) [13]. The further projected high economic growth rate [14], continued population growth [12] and forest policy reforms are expected to create substantial additional demand for wood-based products in the coming years [15]. An additional, intrinsic value of landscape tree cover may further arise from future ecosystem service payment schemes for carbon storage or other protective purposes.
Tree plantations in India and elsewhere in the tropics are often established from a very limited number of ‘classic’, highly productive plantation species [16,17,18,19]. Within relatively short rotation cycles, which vary among species but are often around ten years, substantial aboveground biomass (AGB) is accumulated. For example, an AGB of about 140 Mg ha−1 was reported for nine-year-old Eucalyptus tereticornis plantations in India [20]. There are, however, controversies about potential negative impacts of some introduced plantation species on soil, water and biodiversity [21,22,23]. This has led to a ban of Eucalyptus and Acacia plantations in some southern states of India [24].
Among the tree species commonly used for plantation establishment in India, the native Melia dubia Cav. (Meliaceae) is gaining popularity due to its fast growth, straight boles and self-pruning, and its ability to cope with different edaphic and climate conditions [25,26]. It occurs naturally in the moist tropical forests of peninsular and northeastern India and can also be found, either naturally or introduced, in Sri Lanka, Malaysia, Indonesia, the Philippines, Australia and Ghana [27,28]. M. dubia is a light-demanding, deciduous tree species [29,30] and its wood is suitable for plywood, paper and engineered-wood industries [27,31,32]. However, studies on AGB and the growth of M. dubia are rare so far, and with exception of one study on the effects of varying stand densities [33], its growth potential has not yet been assessed comprehensively across gradients in water and nutrient availability.
For tropical trees, several studies reported that biomass and growth are often largely controlled by climate and specifically by water availability, while factors such as soil or disturbance history are secondary [34,35,36,37,38]. Therein, higher precipitation and shorter and less intense dry periods were associated with significantly higher tree growth rates, while weak or no relationships with soil nitrogen or plant available phosphorus were found [34]. The climatic variable mean annual precipitation often explains a large part of the observed variation in AGB or growth [35,38]; however, the variable climatological water deficit is deemed even more suitable for studying the effects of water availability on growth because it reflects both the duration and severity of water-limited conditions over the course of a year [39,40]. Indications that water availability often is a crucial factor controlling tree growth are further strengthened by previous reports of vastly increased growth in irrigated compared to non-irrigated plantations, particularly in water-limited tropical regions [41,42,43,44,45]. To our knowledge, no previous studies investigating effects of natural or artificial water supply or their interaction on the growth of M. dubia are available. However, such information is essential for further improving its management, e.g., with regard to optimized site selection or drought-adapted irrigation schemes.
M. dubia is particularly popular in South India, a region characterized by a tropical monsoon climate with a distinct seasonality and steep gradients in annual rainfall. On South Indian farms, we studied 186 M. dubia farmland woodlots between one and nine years in age and covering a rainfall gradient from 420 to 2170 mm year−1. The objectives were to quantify aboveground biomass and growth rates of M. dubia and to identify their main controlling factors, with a focus on the role of natural and artificial water supply and their interaction.
2. Materials and Methods
2.1. Study Region
The studied woodlots were located in the South Indian states of Andhra Pradesh, Karnataka and Tamil Nadu (Figure 1). Tropical monsoon climate prevails in the region, with a rainy season from May to October and a dry season from November to April. Mean annual precipitation (MAP) increases from the interiors with around 400 mm year−1 towards the Western Ghats with more than 3000 mm year−1 (Figure 1). Mean annual temperature (MAT) ranges from 29.5 °C in the inland lowlands to 21.6 °C in the highlands (Ghats) [46]. The soils in the region are variable [47] and accommodate diverse vegetation formations ranging from open thorn scrub over wooded grasslands to closed forests [48,49]. The region has a long-standing history of diverse land-use practices; coffee, coconut, areca nut and rubber plantations dominate in the moist, humid and sub-humid zones, whereas rainfed and irrigated agriculture dominates in the dry lowland plains [50]. Today, forest cover in the region is about 14% [51].
2.2. Study Sites and Plot Design
The woodlots ranged from approx. one to nine years in age; older stands were not found in the region. The woodlots covered a gradient in MAP from 420 to 2170 mm year−1 (Figure 2); M. dubia is commonly not grown at higher rainfall levels. The gradient encompasses four climatic zones (arid, semi-arid, dry-sub-humid and humid; zonation according to Trabucco and Zomer 2019 [52]). The plots were identified and located based on information from the Karnataka Forest Department, forestry colleges and research institutes, NGOs, nursery enterprises, media and farmers.
General land-use history and management information on each woodlot were raised through interviewing farmers with semi-structured questionnaires. All studied M. dubia woodlots were established on former agricultural land. To avoid early-stage failures of the woodlots, all interviewed farmers irrigated the seedlings for at least one growing season. Most farmers (66%) continued supplemental irrigation for more than one growing season, but with reduced irrigation frequencies (hereafter referred to as ‘irrigated’). A total of 34% moved to exclusively rainfed cultivation after the initial irrigation period (hereafter referred to as ‘non-irrigated’); MAP at all non-irrigated woodlots was higher than 670 mm year−1. In each woodlot, biometric data were collected within a 20 m × 20 m plot. The plots were established near the center of the woodlots to avoid edge effects, at locations typical for the average growth conditions (based on visual assessment and discussion with the owner).
2.3. Tree Observations
Trees with a diameter at breast height (DBH, cm) equal to or larger than 2 cm whose center-points lay within the plot boundaries were recorded as sample trees. Stand density (trees ha−1) was estimated from the number of recorded trees per 400 m2 plot. For each sample tree, DBH was measured with a diameter tape and height (m) was measured using a marked PVC pipe for smaller trees and a Vertex IV hypsometer (Haglöf, Langsele, Sweden) for trees higher than approx. 8 m. A total of 6898 M. dubia trees were recorded across the studied woodlots.
2.4. Wood Density
On a subset of 31 woodlots covering a MAP gradient from 420 to 1530 mm year−1 and a plantation age gradient from four to seven years, stem wood density (WD; g cm−3) was additionally measured. In these plots, one wood core each was extracted at breast height (1.3 m) from the six trees that were closest to the plot center, adding up to 186 cores. Volumes (cm³) of the cores were determined by Newton’s volume equation:
where v is the volume of the core, Ao, Am and Ai are the cross sectional areas obtained by A = πD2/4, using diameter (D, cm) measured at outer, middle and inner end of the core, and l is the core length (cm). WD was calculated as the ratio of oven-dry mass (105 °C for 72 h) to fresh volume of each core.
v = [(Ao + 4Am + Ai) ÷ 6] × l
The average WD derived from the 31-plot subsample was 0.349 ± 0.003 g cm−3 (mean ± SE, n = 186 trees), with a range from 0.253 to 0.435 g cm−3. This falls into the range of WD estimates previously reported for M. dubia [53,54,55]. WD showed no or only weak correlations (R < 0.22) with the available stand, management, climate and soil variables (see overview in Table S1), and linear regressions between WD and selected key variables show either no significant influence on WD (P > 0.05) or did not explain a sufficiently large fraction of the variance in the variable (R2 < 0.05) to use them to predict WD (Figure S2a–f). We therefore decided to use the overall average of WD for the aboveground biomass estimates at all woodlots in our study.
2.5. Aboveground Biomass Estimation
For estimating tree-level aboveground biomass (AGB, kg tree−1), no allometric equation specifically calibrated for M. dubia was available from existing literature. We thus used an improved pan-tropical allometric model [39], which predicts AGB (kg) based on WD (g cm−3), DBH (cm) and tree height, H (m):
AGB = 0.0673 × (WD × DBH2 × H)0.976
The model is widely applied for estimating the AGB of tropical trees including plantation species such as Eucalyptus, Gmelina arborea and Tectona grandis [56,57,58]. Its pantropical predecessor [59], which yields slightly lower but highly correlated estimates (R = 1, Figure S3a), was previously applied for AGB estimation in a Melia azedarach plantation [60]. The AGB values derived with the improved pan-tropical model for M. dubia correspond very closely to values derived with an approach using a reported species-specific form factor of 0.7 [61], along with mean WD as established in our study, with only marginal divergences from the 1:1 line and close correlation (R = 1, Figure S3b). Other potentially suitable equations for tropical trees also produce comparable absolute estimates and close correlations (n = 6898 trees, R > 0.9, Figure S3c–e). A species-specific model calibration in future studies would most likely improve the accuracy of predictions, foremost by a more precise estimation of the wood volume for given age classes, as WD did not vary across gradients of key management, climate and soil variables in our study (Figure S2).
The target variable, stand-level AGB (Mg ha−1) was determined by multiplying the mean tree level AGB of a given plot by the respective stand density (trees ha−1).
2.6. Bioclimatic Variables
We used the point sampling tool of QGIS software [62] for extracting bioclimatic data for each woodlot from available global grids. We extracted variables related to precipitation and temperature from the WorldClim database (Version 2, http://worldclim.org, accessed on 20 June 2021). The data are provided as monthly long-term averages (1970–2000) at a spatial resolution of 30 arc seconds [46]. We further extracted monthly potential evapotranspiration (PET, mm) and aridity index estimates from 30 arc seconds resolution global raster grids [52]. We derived the number of dry months per year at each site by combining the extracted monthly precipitation (WorldClim) and PET (CGIAR-CSI) data series following an approach by Guan et al. [38], where dry months are defined as months in which PET exceeds precipitation. We further calculated the climatological water deficit (CWD, mm year−1) following Chave et al. [39], where the annual CWD is the sum of the differences between monthly precipitation (WorldClim) and monthly PET (CGIAR-CSI), taking into consideration only months with negative values. For the modeling in our study, we chose the annual CWD as the climatic variable as it integrates both the duration and severity of water-limited conditions over the course of a given year [39,40].
Calculating climate variables specifically for the growing season of M. dubia was not possible due to a lack of information on the expected substantial changes in the phenology of M. dubia as a drought-deciduous species along the steep climatic gradient. A list of all available climate variables is presented in Table S1.
2.7. Soil Variables
Soil texture was assessed by the ‘finger probe’ field method [63], as modified by www.nrcs.usda.gov. Near the center of each plot, soil pH was recorded using a handheld pH/ORP meter (GMH 5530, Greislinger, Regenstauf, Germany) by dissolving 20 g of soil in 50 mL of distilled water. Similarly, soil electrical conductivity (dS m−1) was measured using the Fieldscout EC 110 Meter (Spectrum Technologies Inc., Aurora, CO, USA). In each plot, a composite soil sample was extracted at 0–15 cm depth and air-dried. Samples were passed through a 2 mm sieve to determine available soil nutrient contents in the laboratory of the Indian Institute of Soil and Water conservation, Ballari, India. The content of organic carbon (OCsoil) was estimated by rapid titration method using 1 g of sample sieved through 0.2 mm mesh [64]. Available soil nitrogen (Nsoil, mg kg−1) was determined by the alkaline permanganate method [65], available phosphorus (Psoil, mg kg−1) by Olsen’s method using ascorbic acid [66] and available potassium (Ksoil, mg kg−1) was determined with the flame photometer method using ammonium acetate extracts [67]. Soil depth was approximated by measuring the distance from the top of the soil to the bedrock in existing pits, trenches or channels dug in the plots for planting or other purposes. A list of all available soil variables is compiled in Table S1.
2.8. Statistical Analyses
To identify relationships between our target variable stand-level AGB and potential explanatory variables, we computed a correlation matrix with the R package ggcorrplot (Version 0.1.3, [68]). Out of the list of more than 40 available stand, management, climate and soil variables (Table S1, Figure S4), we chose a limited set of weakly correlated predictor variables based on a priori knowledge about their association with plant growth.
To model the stand-level AGB increment in M. dubia in the studied woodlots, we first fitted a simple regression model between AGB (Mg ha−1) and stand age. We found a power-law relationship between the AGB of plot i and its age (months since planting) to fit the data best:
AGBi = a × ageib
This model can be linearized by natural log-transforming AGB and stand age:
log (AGBi) = log(a) + b × log(agei) + ϵi
On the scale of the raw data, fitting a log-log linear model as in (4) with a simple linear model corresponds to a power-law relationship of AGB with age, and a lognormal error distribution.
To examine the effects of management, climate and soil on AGB and AGB growth, we further fitted an extended version of model (3) that expresses the baseline ai and growth rate bi for observation i as functions of stem density, water availability and soil nutrients:
ai = a0 × exp (a1 × densityi)
bi = b0 + b1 × densityi + b2 × irrigationi + b3 × CWDi + b4 × Nsoil[i] + b5 × Psoil[i] + b6 × CWDi × irrigationi
We therein assumed that the baseline biomass a only depends on the initial planting density, while the effects of water availability, soil nutrients and potential negative density-dependent effects on growth manifest their influence on biomass via the growth rate b. As the effect of irrigation is likely more pronounced on sites that have a more negative water balance, we further allowed for an interaction between climatological water deficit and the categorical management variable irrigation. On the log-log scale, the model implied by (3), (5) and (6) can be expressed as a multiple linear regression model:
log(AGBi) = log(a0) + a1 × log(densityi) + b0 × log(agei) + b1 × densityi × log(agei) + b2 × irrigationi × log(agei) + b3 × CWDi × log(agei) + b4 × Nsoil[i] × log(agei) + b5 × Psoil[i] × log (agei) + b6 × CWDi × irrigationi × log(agei) + ϵi
To fit model (7), all numeric predictor variables except the (negative) CWD were natural log-transformed in order to accommodate the skew of the data. Except for age, all numeric predictors were then scaled by their standard deviations and centered around zero to ease the interpretation of model coefficients. To visualize the results of the multiple regression model, we computed partial predictions for the key variables CWD, stand density, Nsoil and Psoil along their respective observed ranges (rescaled to original units) for both irrigated and non-irrigated woodlots while keeping all other variables at their average values (see Table S1).
3. Results
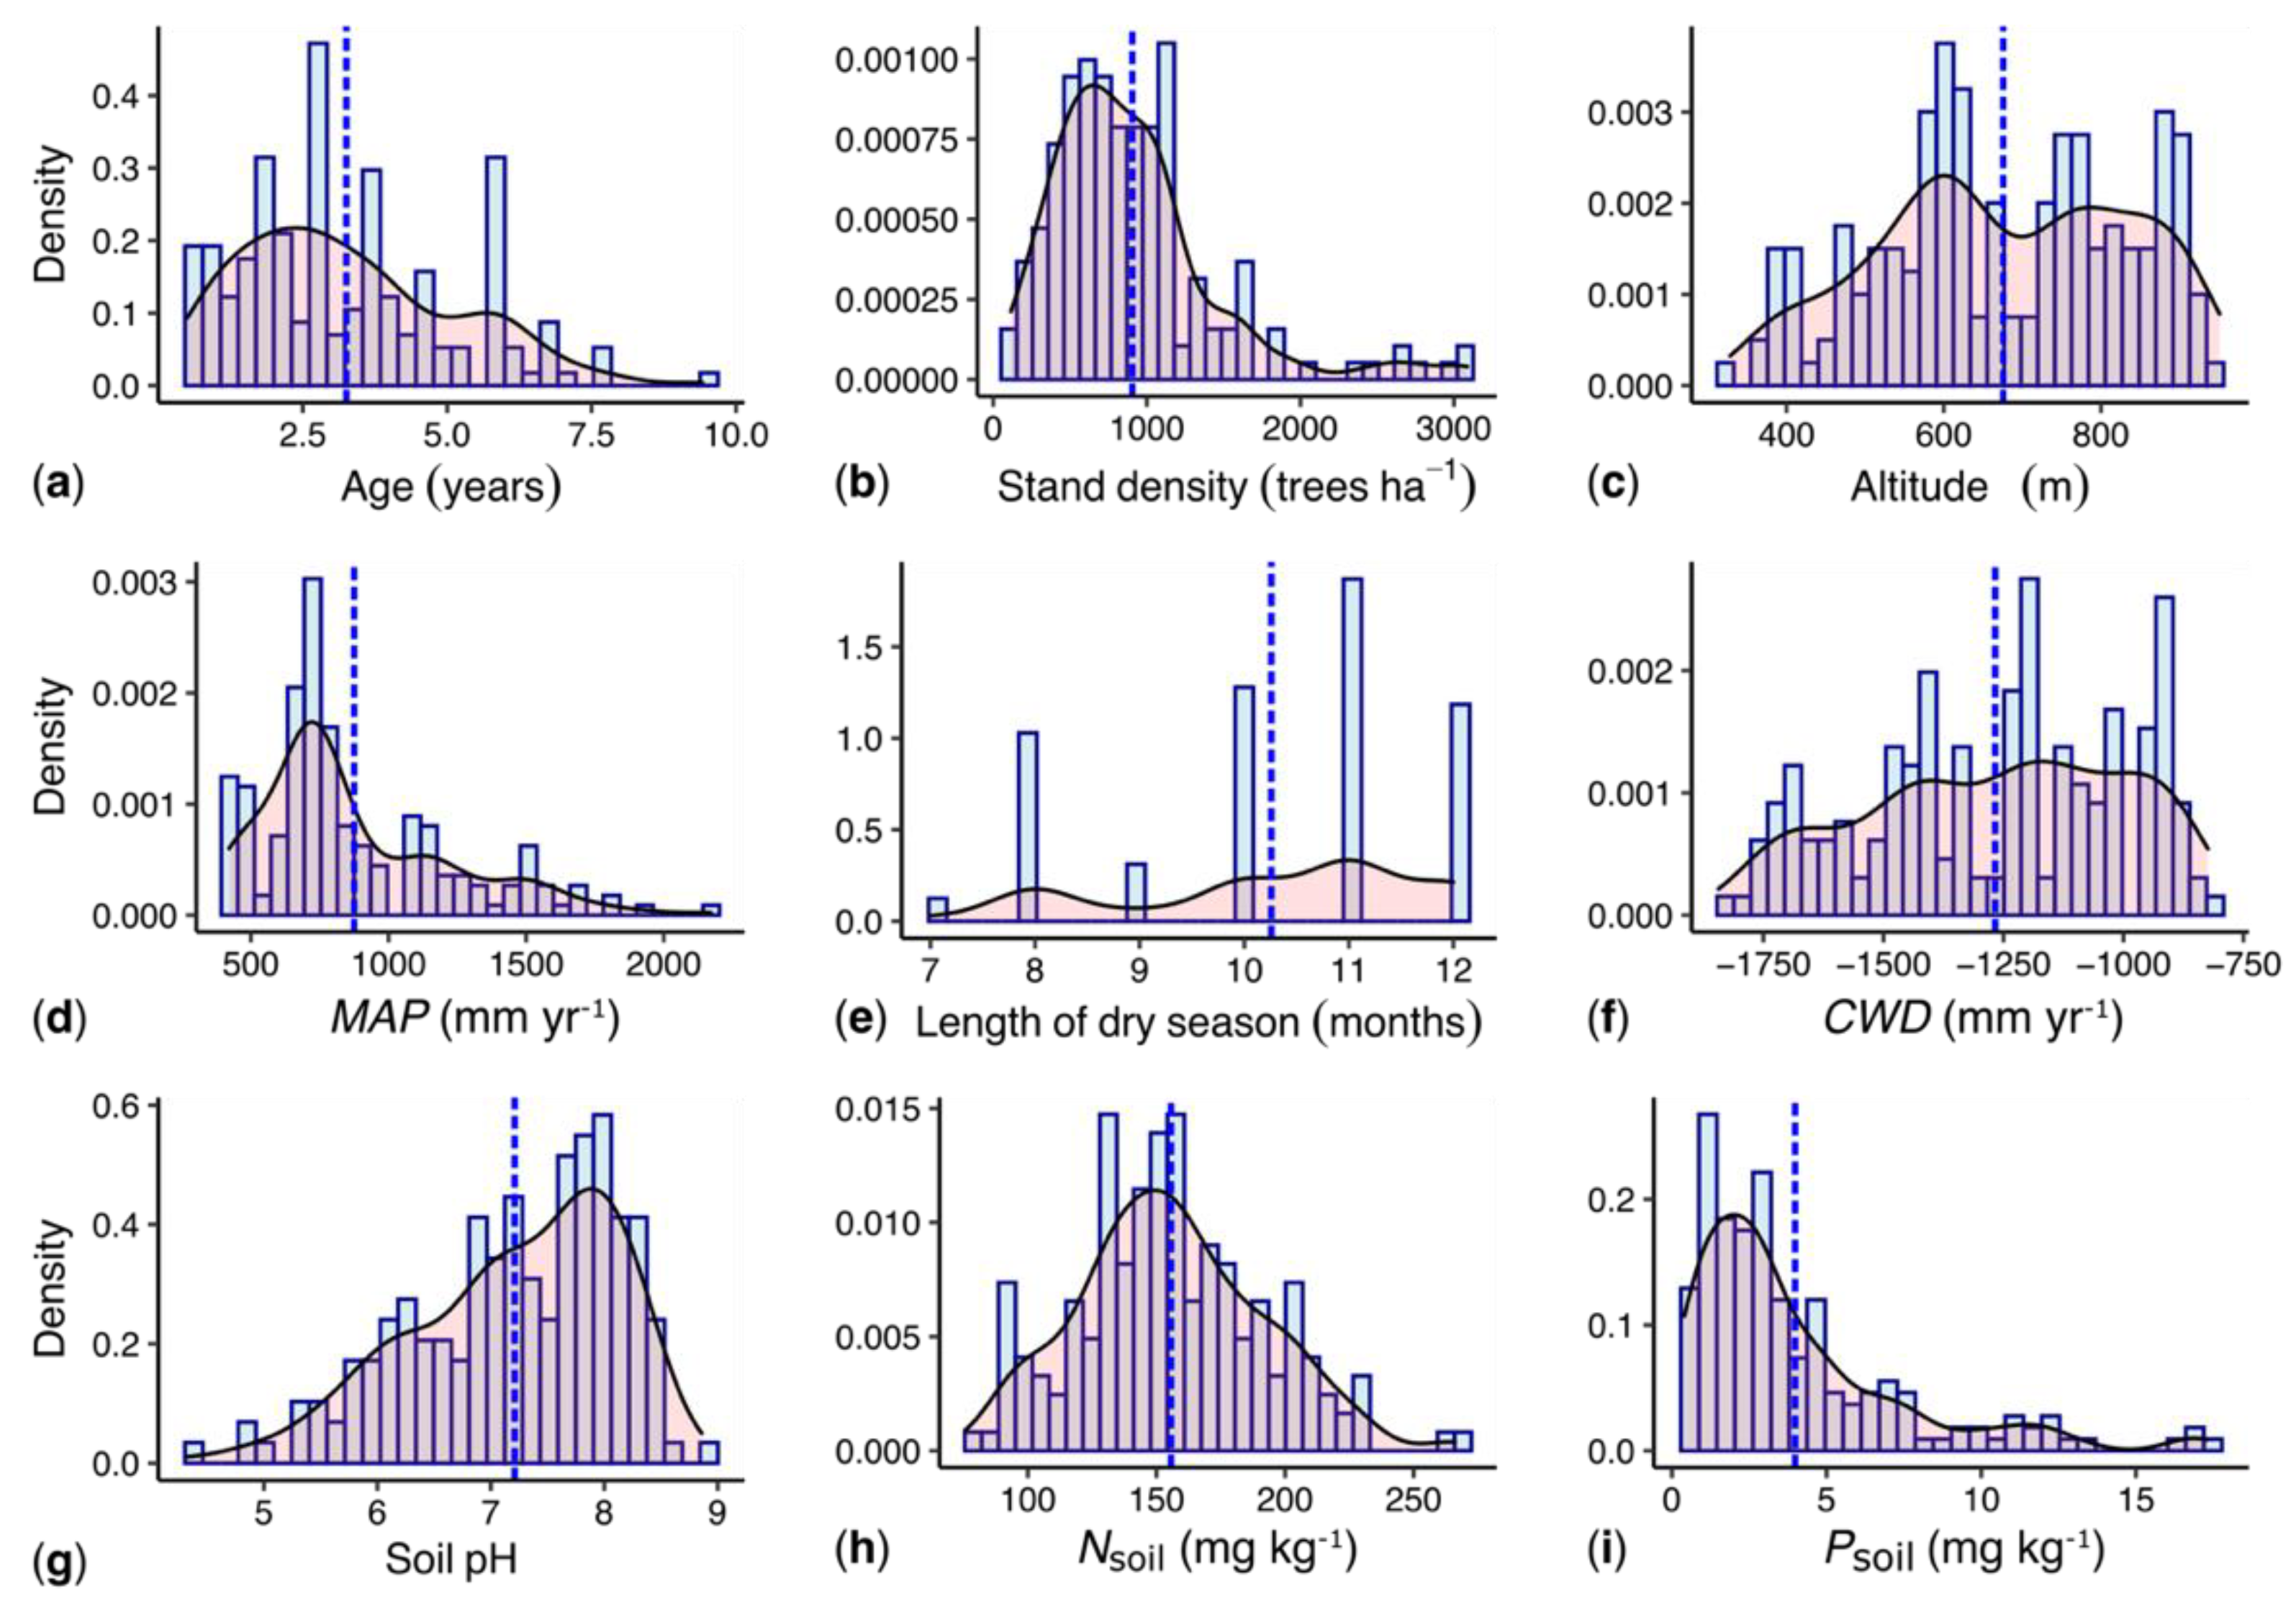
The studied woodlots were vastly heterogeneous with regard to management, climate and soil conditions (Figure 2). A total of 66% of the woodlots were irrigated (vs. 34% non-irrigated). Stand densities varied 26-fold, from 116 to over 3000 trees ha−1. MAP ranged from 420 to 2170 mm year−1 and the CWD from –1823 to –832 mm year–1. Nsoil and Psoil varied by three- and forty-fold, respectively.
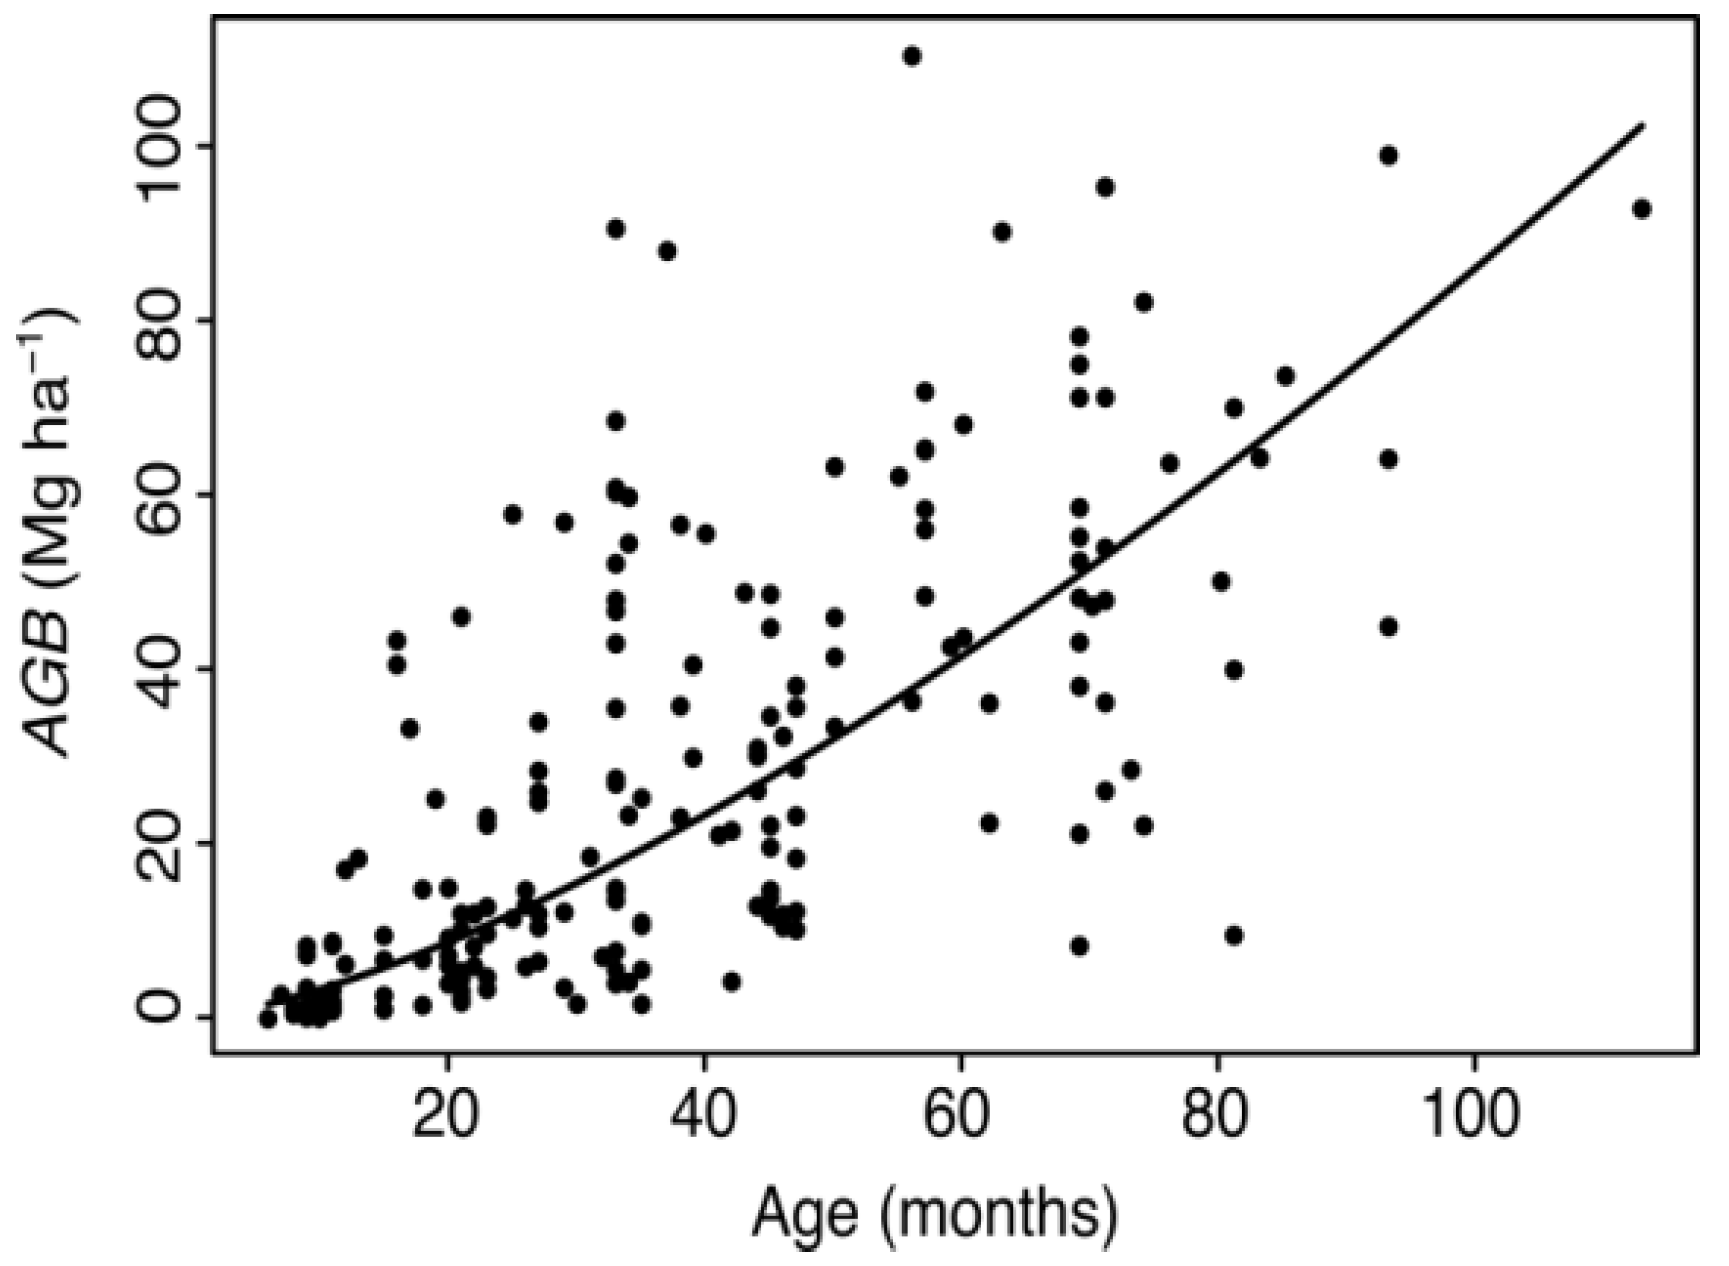
Across all woodlots, stand-level AGB varied from 0.3 to 110.4 Mg ha−1. Variables that could potentially explain the high observed variance in AGB were plotted in a correlation matrix; stand age had the highest independent correlation with AGB (R = 0.55, Figure S4). A log-log linear regression model using age as a predictor explained 55% of the variance in AGB (F-statistic: 225.4 on 1 and 184 DF, p < 0.001) (Figure 3). It predicted an AGB of 94 Mg ha−1 for nine-year-old M. dubia stands, which corresponded to an average annual AGB increment of 10.4 Mg ha−1 year−1.
The updated growth model taking into account the effects of management, climate and soil explained 65% of the observed variance in AGB (F-statistic: 41.6 on 8 and 177 DF, p < 0.001) (Table 1). Stand density had a marginally significant positive effect on initial AGB (p = 0.068) and an non-significant negative effect on aboveground biomass increment (AGBI). Water availability had a much stronger positive effect on AGBI than nutrient availability, as indicated by the larger standardized effect sizes of irrigation (0.061, p = 0.096) and CWD (0.078, p < 0.01) compared to Nsoil (0.031, p = 0.107) and Psoil (0.045, p < 0.01). The three-way interaction term between stand age, CWD and irrigation indicates a slight but non-significant reduction in the irrigation effect at wetter sites (p = 0.173).
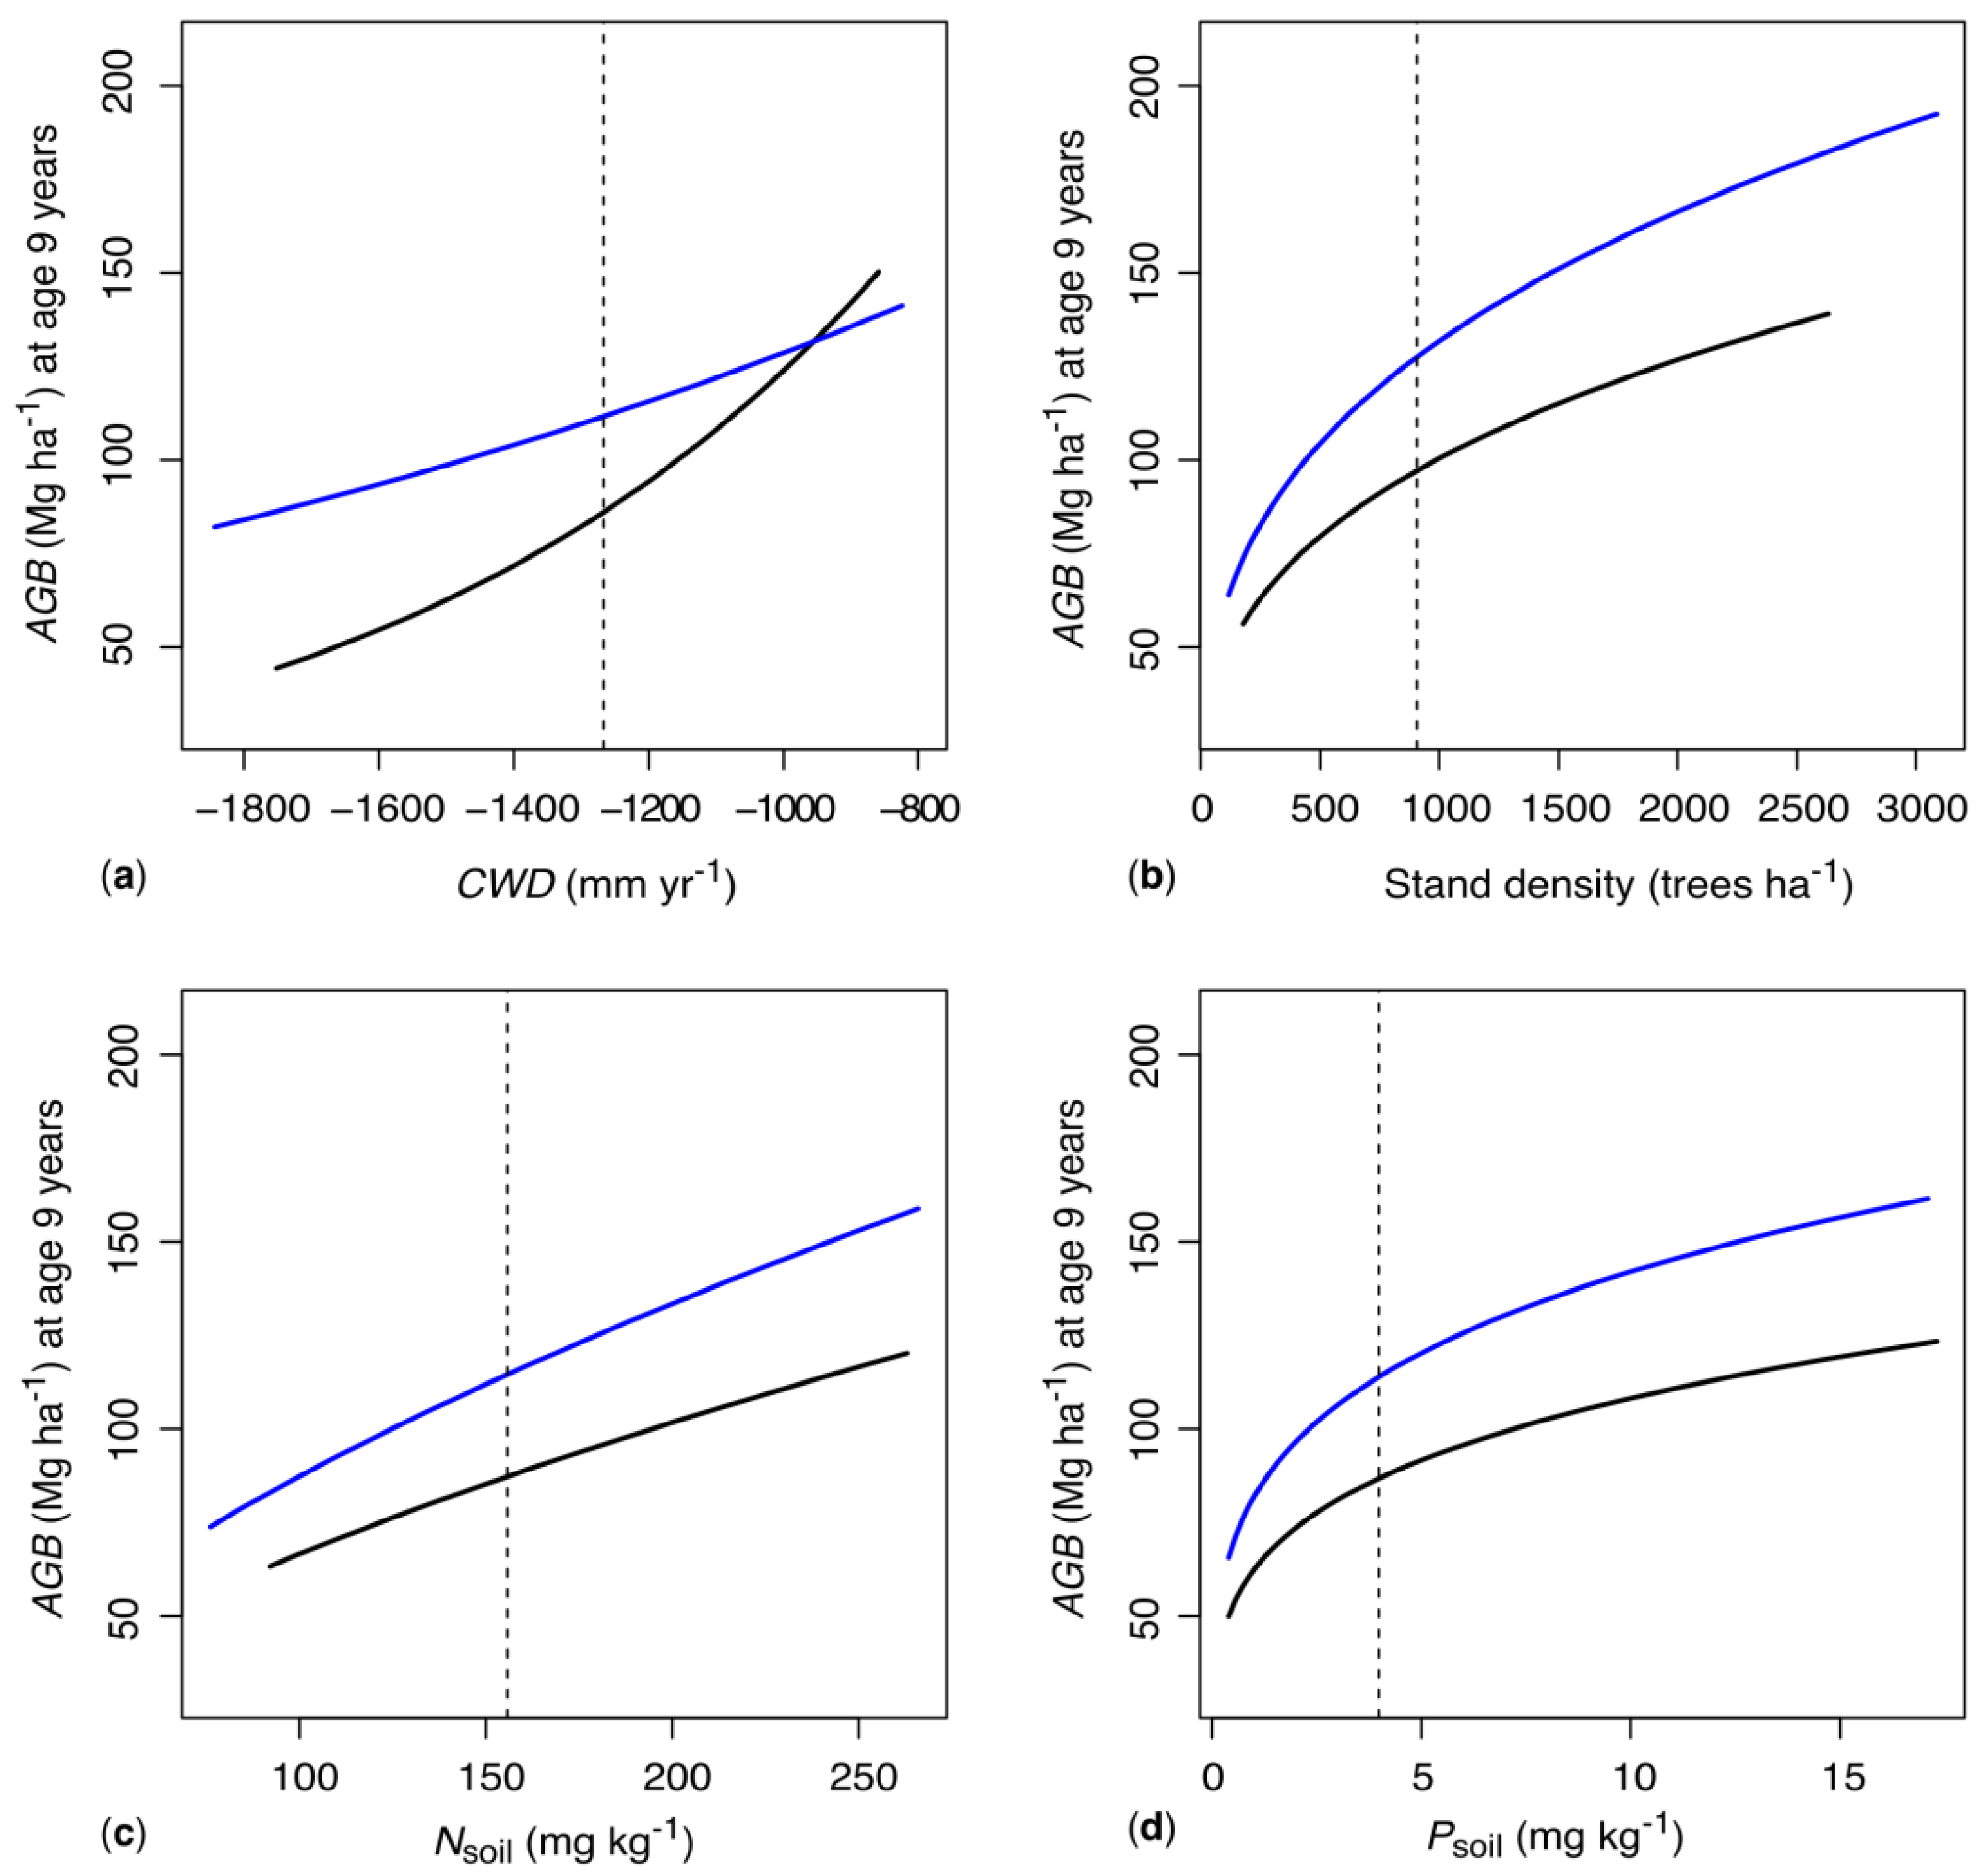
Using the model to predict the stand-scale AGB of ‘mature’ (harvest-ready, nine-year old) woodlots illustrates the important role of water availability. For non-irrigated mature woodlots of otherwise average characteristics, AGB more than triples along the steep CWD gradient, from 44.4 Mg ha–1 to 150.3 Mg ha–1. The relationship is non-linear, with smaller increases in AGB per unit of CWD at the dry end of the gradient (Figure 4a). Along the same CWD range, AGB in irrigated woodlots increases by only 60% and almost linearly. While an almost twice as high AGB is predicted for irrigated woodlots at very negative CWD, AGB predictions for irrigated and non-irrigated woodlots are similar at the wet end of the gradient past approx. −1000 mm year–1. Along the observed gradients in stand density, Nsoil and Psoil, AGB increases of 90% to 147% are predicted for non-irrigated mature woodlots of otherwise average characteristics; the model predicts 31% higher AGB at a given stand density, Nsoil or Psoil when the woodlots are irrigated (Figure 4b–d). However, all described trends for irrigated woodlots are associated with substantial additional uncertainties due to the large standard errors of the two interaction terms involving irrigation (Table 1).
4. Discussion
4.1. Aboveground Biomass of M. dubia
In South India, the native M. dubia is a popular plantation species due to its versatile use, fast growth, straight boles and its ability to cope with different edaphic and climate conditions [25,26] (Figure 5). On farmland woodlots across large gradients in management, climate and soil conditions, our regression model predicts an average stand-level AGB of 93.8 Mg ha–1 for nine-year-old M. dubia stands. At this age, trees are commonly harvested, and we did not observe any older stands across the studied woodlots. Predictions from our regression model for a hypothetic landscape with a homogeneous distribution of M. dubia plantations across nine age classes (i.e., one to nine years in steps of one year, then immediate harvest and replanting) yield an average AGB stock of 44.1 Mg ha–1. Assuming a carbon content of AGB of approx. 50% [71], this corresponds to an average permanent aboveground carbon stock of 22.1 Mg ha–1. In comparison, dry forests in South India were reported to have aboveground carbon stocks of 37 to 116 Mg ha–1 [72,73,74]. Such carbon stock quantifications may be of interest for life cycle analysis of M. dubia products, carbon offset programs or other climate change mitigation mechanisms.
4.2. Growth Potential of M. dubia
Of central interest for short-rotation plantation species is their growth, i.e., their average annual AGBI over a typical rotation cycle. Based on the AGB estimate for an average nine-year old woodlot from our simple regression model, the mean AGBI across our study region is 10.4 Mg ha−1 year–1. This estimate falls within the range of values reported for four-year-old M. dubia plantations in South India (9.6 to 12.7 Mg ha−1 year−1, estimates derived in analogy to our study using DBH and height data; see Table S2 for details on all cited studies) [33]. The AGBI rate of M. dubia is comparable to or higher than those reported for several other popular plantation species across India. This includes reports from teak (Tectona grandis) of varying ages (2.6 to 16 Mg ha−1 year−1, [75,76]), five- to eleven-year-old Populus deltoides (6.3 to 16.4 Mg ha−1 year−1, [77,78]), four- to six-year-old Gmelina arborea (0.6 to 8.5 Mg ha−1 year−1, [79,80]), three- to ten-year-old Dalbergia sissoo (2.5 to 7.8 Mg ha−1 year−1, [41,77,81,82]) as well as from nine-year-old plantations of Casuarina equisetifolia (10.9 Mg ha−1 year−1), Pterocarpus marsupium (7.5 Mg ha−1 year−1), Ailanthus triphysa (4.6 Mg ha−1 year−1) and Leucaena leucocephala (2.6 Mg ha−1 year−1) [81]. Other studies on common plantation species reported higher AGBI (12.2 to 37.5 Mg ha−1 year−1, Table S2) than we found for M. dubia, both for India [20,44,81,83,84] and other tropical countries [85,86,87,88]. However, these studies commonly examine only one or few sites. In contrast, our average M. dubia AGBI estimate is based on studying 186 woodlots across steep environmental gradients. At single sites in our study, AGBI rates of well over 20 Mg ha−1 year−1 were observed.
4.3. Controls of Biomass and Growth of M. dubia
A power-law growth curve represented the changes in AGB with increasing woodlot age well for the studied stands between one and nine years of age (Figure 3). Our findings are in line with several previous studies in monocultural short-rotation tree plantations showing similar relationships (e.g., [44,78,89,90]).
The multiple regression model (Table 1) explained 65% of the observed variance in stand-scale AGB. It indicates a key role of water availability for the growth of M. dubia. Therein, both natural (CWD) and artificial (irrigation) water supply have strong effects on AGB, and the effects of irrigation vary strongly along the studied CWD gradient (Figure 4a). The annual CWD was highly significant in the model (Table 1). Its standardized effect size on growth was 28% larger than that of irrigation and 72–150% larger than the effect sizes of Nsoil and Psoil. These results are in line with several previous studies reporting that the natural water availability is closely related to the growth of tropical trees, while soil conditions and further factors such as land-use history are often secondary [34,35,36,37,38].
Likewise, the observed strong positive influence of irrigation of AGB growth is in line with several previous studies in tree plantations [41,42,43,44]. Our model goes a step further in including an interaction between natural and artificial water supply, which showed an expected decreasing benefit of irrigation as the natural water availability increases (i.e., as CWD becomes less negative). This results in similar AGB predictions for mature irrigated and non-irrigated woodlots at the wet end of the studied CWD gradient past approx. –1000 mm year–1, while an almost twice as high AGB is predicted for irrigated woodlots at the dry end at around –1800 mm year–1 (Figure 4a). Such information is essential for further optimizing the growth of M. dubia through enhanced site selection and water management schemes.
Notably, both interaction terms involving irrigation were associated with substantial uncertainties and were thus only marginally significant and non-significant, respectively, in the multiple model (Table 1). There are several potential reasons for this: Firstly, there is uncertainty arising from a lack of information on irrigation frequency and volume, as irrigation only appears as a categorical variable. Secondly, first- and second-order interaction terms in general have much higher uncertainties than main effects. Thirdly, irrigation is a conscious and complex management decision by the farmers likely already taking into account local conditions and planting densities, which are not considered in our relatively simplistic model. Finally, the irrigation effect refers to a woodlot of average characteristics, i.e., at average CWD, while differences at the dry end of the gradient would likely be more pronounced. Despite such limitations, our model does confirm a key role of the water supply for the AGB growth of tropical trees, in our case for M. dubia in South India: growth is strongly constrained at the dry end of the studied CWD gradient, but can be increased considerably by irrigation.
Within the studied stand density range (116 to 3086 trees ha–1, 67% between 116 and 1000 trees ha–1), the model showed a marginally significant positive effect of stand density on initial AGB and a negative effect of stand density on AGB growth; the latter was non-significant in our model (Table 1). As for irrigation, a potential explanation for the lack of significant growth effects is that stand density is a management decision by farmers that is likely based on prior knowledge on recommended planting distances under the respective site conditions. For mature, non-irrigated woodlots at average CWD (–1293 mm year–1) and of average soil characteristics, increases in stand density lead to pronounced increases in predicted AGB until a stand density of approx. 1000 trees ha–1; higher densities result in under-proportional further increases in AGB (Figure 4b). Our results of increasing stand-scale AGB with increasing stand densities up to over 3000 trees ha–1 somewhat contrast the results from a previous experimental study on M. dubia in South India, which showed slightly higher growth at lower stand densities (below 833 trees ha–1) compared to higher stand densities (1000–2500 trees ha–1) [33]. However, the study was based on few spatial replicates, the observed differences were not examined statistically and the stands were only four years old at the time of study. Overall, the influence of the stand density of AGB growth of M. dubia is still associated with too many uncertanties to derive clear management recommendations and requires further experimental studies. Our results do, however, suggest that M. dubia can achieve considerable stand-scale growth over a relatively broad range of stand densities, which gives farmers flexibility with regard to producing wood of variable, locally desired dimensions.
The effect of nutrient availability on AGB growth was small compared to the effect of water availability (Table 1). Our model contained Nsoil and Psoil as predictors for soil nutrient effects, as these are the two macronutrients that are commonly found to limit plant growth [91,92]. Nsoil varied three-fold across the studied woodlots, and Psoil varied forty-fold. While the relatively small positive effect of Nsoil on AGB was non-significant (p = 0.107), the stronger positive effect of Psoil was highly significant, indicating partially pronounced soil phosphorus limitations in our study region. Our result of a rather moderate influence of soil nutrient status on AGBI is in line with several previous studies on tropical tree species; exceptions are typically only found on severely nutrient-limited sites with drastically reduced growth [34,91,92,93]. This is also indicated by the distinctly non-linear effect of Psoil on AGB of mature, non-irrigated woodlots: while increases in Psoil from near zero to approx. 5 mg kg–1 result almost in a doubling of AGB, further increases in Psoil are associated with relatively small increases in AGB (Figure 4d). This suggests that there may be room for further growth optimization by enhanced site selection and by (moderate) fertilizer application on nutrient-poor sites.
5. Conclusions
We conclude that due to its rapid growth rates in farmland forestry, M. dubia is a species with considerable potential for short-rotation plantations in South India and beyond. Its average growth rate across steep environmental and management gradients falls within the range reported for popular tropical tree plantation species. Water availability is the main driver of the growth of M. dubia, while the effects of soil nutrients are relatively small. Growth is strongly constrained at sites with high climatological water deficit, but can be increased considerably by irrigation. Generally, there remains large potential for tree-based land use with mixed stands of native species to foster effects of complementarity and optimize ecological benefits.
Supplementary Materials
The following are available online at https://www.mdpi.com/article/10.3390/f12121675/s1: Figure S1: India’s annual import value of forest products (blank circles with blue line) and gross domestic product (GDP) growth (black squares with orange line), from 1961 to 2019 [12,13]. Figure S2: The influence of the key variables stand age (a), irrigation (b), stand density (c), climatological water deficit (CWD) (d), soil nitrogen (Nsoil) (e) and soil phosphorus (Psoil) content (f) on wood density. Wood density was measured from cores extracted at breast height on 186 trees across a subset of 31 woodlots. Linear regression models were fitted and regression lines (blue) and standard error corridors (gray) are depicted for p < 0.05. The categorical variable irrigation was tested for significant differences (p < 0.05) among groups with the Wilcoxon rank sum test (with continuity correction). Figure S3: Comparison of tree-level aboveground biomass (AGB) estimates derived from the pantropical model applied in our study [39] to other AGB models. Data from all 6898 studied trees are depicted (dots). The solid blue lines are the respective regression lines, the dashed black lines represent 1:1 lines. Figure S4: Correlation matrix of available growth, climate, soil and management variables. Units and descriptions for all variables are presented in Table S1. Table S1: List of available growth, climate, soil and management variables. Given are the measurement units, means, standard deviations, standard errors, minimum and maximum values among the 186 studied woodlots. Table S2: Aboveground biomass (AGB), average annual AGB increment (AGBI), key characteristics (age, stand density, mean annual precipitation MAP, soil conditions) and further information on tropical tree plantations as cited for comparison to our study. NA: no data available.
Author Contributions
Conceptualization, M.N.R., D.H. (Dietrich Hertel), B.S. and D.H. (Dirk Hölscher); Data curation, M.N.R. and R.M.L.; Formal analysis, A.R. and R.M.L.; Investigation, M.N.R. and S.L.P.; Methodology, A.R., M.N.R., R.M.L., D.H. (Dietrich Hertel), B.S., S.L.P. and D.H. (Dirk Hölscher); Supervision, D.H. (Dirk Hölscher); Visualization, A.R., M.N.R. and R.M.L.; Writing—original draft, A.R., M.N.R. and D.H. (Dirk Hölscher); Writing—review and editing, A.R., M.N.R., R.M.L., D.H. (Dietrich Hertel), B.S., S.L.P. and D.H. (Dirk Hölscher). All authors have read and agreed to the published version of the manuscript.
Funding
Mundre Ramesha received the Netaji Subhas ICAR-International Fellowship by the Indian Council of Agricultural Research. We acknowledge support by the Open Access Publication Funds of Göttingen University.
Data Availability Statement
The data presented in this study are available on request from the corresponding author, Alexander Röll.
Acknowledgments
We thank all woodlot owners who extended their cooperation during field work. We further thank the field staff of the Karnataka Forest Department as well as staff and students of the College of Forestry, Ponnampet.
Conflicts of Interest
The authors declare no conflict of interest.
References
- Ghazoul, J.; Bugalho, M.; Keenan, R. Plantations take economic pressure off natural forests. Nature 2019, 570, 307. [Google Scholar] [CrossRef] [PubMed]
- Guariguata, M.R.; Chazdon, R.L.; Brancalion, P.H.S.; David, L. Forests: When natural regeneration is unrealistic. Nature 2019, 570, 164. [Google Scholar] [CrossRef] [PubMed] [Green Version]
- Lewis, S.L.; Wheeler, C.E.; Mitchard, E.T.A.; Koch, A. Regenerate natural forests to store carbon. Nature 2019, 568, 25–28. [Google Scholar] [CrossRef] [PubMed]
- Dave, R.; Maginnis, S.; Crouzeilles, R. Forests: Many benefits of the Bonn Challenge. Nature 2019, 570, 164. [Google Scholar] [CrossRef] [PubMed]
- Maestre, F.T.; Quero, J.L.; Gotelli, N.J.; Escudero, A.; Delgado-baquerizo, M.; García-gómez, M.; Bowker, M.A.; Soliveres, S.; Escolar, C.; García-palacios, P.; et al. Europe PMC Funders Group Plant species richness and ecosystem multifunctionality in glob-al drylands. Science 2012, 335, 214–218. [Google Scholar] [CrossRef] [Green Version]
- Huang, J.; Yu, H.; Guan, X.; Wang, G.; Guo, R. Accelerated dryland expansion under climate change. Nat. Clim. Chang. 2016, 6, 166–171. [Google Scholar] [CrossRef]
- Bastin, J.-F.; Berrahmouni, N.; Grainger, A.; Maniatis, D.; Mollicone, D.; Moore, R.; Patriarca, C.; Picard, N.; Sparrow, B.; Abra-ham, E.M.; et al. The extent of forest in dryland biomes. Science 2017, 356, 635–638. [Google Scholar] [CrossRef] [Green Version]
- Koh, L.P.; Levang, P.; Ghazoul, J. Designer landscapes for sustainable biofuels. Trends Ecol. Evol. 2009, 24, 431–438. [Google Scholar] [CrossRef]
- FAO; UNEP. The State of the World’s Forests 2020: Forests, Biodiversity and People; FAO: Rome, Italy; UNEP: Nairobi, Kenya, 2020; 188p, ISBN 978-92-5-132419-6. [Google Scholar]
- United Nations United Nations Population Division-Department of Economic and Social Affairs: World Population Prospects 2019. Available online: http://creativecommons.org/licenses/by/3.0/igo/ (accessed on 25 October 2021).
- Singh, S.J.; Krausmann, F.; Gingrich, S.; Haberl, H.; Erb, K.H.; Lanz, P.; Martinez-Alier, J.; Temper, L. India’s biophysical econ-omy, 1961–2008. Sustainability in a national and global context. Ecol. Econ. 2012, 76, 60–69. [Google Scholar] [CrossRef]
- World Bank. The World Bank Data. Available online: https://data.worldbank.org/country/india?view=chart (accessed on 25 October 2021).
- FAO. Forestry Production and Trade. FAOSTAT Database. Available online: http://fenix.fao.org/faostat/beta/en/#data/FO (accessed on 17 October 2021).
- OECD. Economic Outlook for Southeast Asia, China and India 2019: Towards Smart Urban Transportation; OECD Publishing: Paris, France, 2018; 280p. [Google Scholar] [CrossRef]
- Ghosh, M.; Sinha, B. Impact of forest policies on timber production in India: A review. Nat. Resour. Forum 2016, 40, 62–76. [Google Scholar] [CrossRef] [Green Version]
- Lamb, D.; Erskine, P.D.; Parrotta, J.A. Restoration of degraded tropical forest landscapes. Science 2005, 310, 1628–1632. [Google Scholar] [CrossRef] [Green Version]
- FAO. Global Forest Resources Assessment 2010-Main Report; FAO Forestry Paper 163; FAO: Rome, Italy, 2010; 340p, Available online: http://www.fao.org/3/i1757e/i1757e.pdf (accessed on 25 October 2021).
- Amazonas, N.T.; Forrester, D.I.; Silva, C.C.; Almeida, D.R.A.; Rodrigues, R.R.; Brancalion, P.H.S. High diversity mixed planta-tions of Eucalyptus and native trees: An interface between production and restoration for the tropics. For. Ecol. Manage. 2018, 417, 247–256. [Google Scholar] [CrossRef]
- Liu, C.L.C.; Kuchma, O.; Krutovsky, K.V. Mixed-species versus monocultures in plantation forestry: Development, benefits, ecosystem services and perspectives for the future. Glob. Ecol. Conserv. 2018, 15, e00419. [Google Scholar] [CrossRef]
- Rawat, V.; Negi, J.D.S. Biomass production of Eucalyptus tereticornis in different agroecological region. Indian For. 2004, 130, 762–770. [Google Scholar]
- Hughes, C.E. Risks of species introductions in tropical forestry. Commonw. For. Rev. 1994, 73, 243–252. [Google Scholar]
- Joshi, M.; Palanisami, K. Impact of Eucalyptus Plantations on Ground Water Availability in South Karnataka. In Proceedings of the ICID 21st International Congress on Irrigation and Drainage, Tehran, Iran, 15–23 October 2011; International Commission on Irrigation and Drainage: Tehran, Iran, 2011; pp. 255–262. [Google Scholar]
- Bilal, H.; Nisa, S.; Shahid Ali, S. Effects of Exotic Eucalyptus Plantation on the Ground and Surface Water of District Malakand, Pakistan. Int. J. Innov. Sci. Res. 2014, 8, 299–304. [Google Scholar]
- GOK. Government of Karnataka Notification No. FEE 37 FDP 2017 Dated 23.02.2017; Government of Karnataka: Bengaluru, India, 2017; 6p.
- Nasayao, E.E.; Nasayao, L.Z.; Zara, M.A.; Ulep, F.V. Bagalunga (Melia dubia Cav.): An indigenous fast-growing multipurpose tree species in Eastern Visayas, Philippines. Ann. Trop. Res. 1994, 16, 6–19. [Google Scholar]
- Sharma, S.K.; Shukla, S.R.; Sujatha, M.; Shashikala, S.; Kumar, P. Assessment of certain wood quality parameters of selected gen-otypes of Melia dubia Cav. grown in a seedling seed orchard. J. Indian Acad. Wood Sci. 2012, 9, 165–169. [Google Scholar] [CrossRef]
- Thakur, N.S.; Mohanty, S.; Gunaga, R.P.; Gajbhiye, N.A. Melia dubia Cav. spatial geometries influence the growth, yield and es-sential oil principles content of Cymbopogon flexuosus (Nees Ex Steud.) W.Watson. Agrofor. Syst. 2020, 94, 985–995. [Google Scholar] [CrossRef]
- Wunder, S.; Kaphengst, T.; Timeus, K.; Berzins, K. Impact of EU Bioenergy Policy on Developing Countries; EP/EXPO/B/DEVE/2011/FWC/2009-01/LOT 5/21; EU: Brussels, Belgium, 2012; 24p. [Google Scholar] [CrossRef]
- Warrier, R.R. Money Spinning Trees 2: Melia dubia Cav. Synonyms: Melia composita Willd., Melia superb Roxb; Director, Institute of Forest Genetics and Tree Breeding: Coimbatore, India, 2011; 16p. [Google Scholar]
- Nguyen, H.; Lamb, D.; Herbohn, J.; Firn, J. Designing mixed species tree plantations for the tropics: Balancing ecological attributes of species with landholder preferences in the Philippines. PLoS ONE 2014, 9, e95267. [Google Scholar] [CrossRef]
- Parthiban, K.T.; Bharathi, A.K.; Seenivasan, R.; Kamala, K.; Rao, M.G. Integrating Melia dubia in Agroforestry farms as an alter-nate pulpwood species. Asia-Pac. Agrofor. Newsl. 2009, 34, 3–4. [Google Scholar]
- Sinha, S.K.; Chaudhari, P.A.; Thakur, N.S.; Jha, S.K.; Patel, D.P.; Dhaka, R.K. Melia dubia Cav. wood properties vary with age and influence the pulp and paper quality. Int. Wood Prod. J. 2019, 10, 139–148. [Google Scholar] [CrossRef]
- Kirankumar, G.K.; Patil, H.Y. Growth and productivity of Melia dubia under different plant density. J. farm Sci. 2017, 30, 70–73. [Google Scholar]
- Toledo, M.; Poorter, L.; Peña-Claros, M.; Alarcón, A.; Balcázar, J.; Leaño, C.; Licona, J.C.; Llanque, O.; Vroomans, V.; Zuidema, P.; et al. Climate is a stronger driver of tree and forest growth rates than soil and disturbance. J. Ecol. 2011, 99, 254–264. [Google Scholar] [CrossRef]
- Becknell, J.M.; Kissing Kucek, L.; Powers, J.S. Aboveground biomass in mature and secondary seasonally dry tropical forests: A literature review and global synthesis. For. Ecol. Manag. 2012, 276, 88–95. [Google Scholar] [CrossRef]
- Wagner, F.; Rossi, V.; Stahl, C.; Bonal, D.; Hérault, B. Water availability is the main climate driver of neotropical tree growth. PLoS ONE 2012, 7, e34074. [Google Scholar] [CrossRef] [PubMed]
- Wagner, F.; Rossi, V.; Aubry-Kientz, M.; Bonal, D.; Dalitz, H.; Gliniars, R.; Stahl, C.; Trabucco, A.; Hérault, B. Pan-tropical analysis of climate effects on seasonal tree growth. PLoS ONE 2014, 9, e92337. [Google Scholar] [CrossRef]
- Guan, K.; Pan, M.; Li, H.; Wolf, A.; Wu, J.; Medvigy, D.; Caylor, K.K.; Sheffield, J.; Wood, E.F.; Malhi, Y.; et al. Photosynthetic seasonality of global tropical forests constrained by hydroclimate. Nat. Geosci. 2015, 8, 284–289. [Google Scholar] [CrossRef]
- Chave, J.; Réjou-Méchain, M.; Búrquez, A.; Chidumayo, E.; Colgan, M.S.; Delitti, W.B.C.; Duque, A.; Eid, T.; Fearnside, P.M.; Goodman, R.C.; et al. Improved allometric models to estimate the aboveground biomass of tropical trees. Glob. Chang. Biol. 2014, 20, 3177–3190. [Google Scholar] [CrossRef]
- Esquivel-Muelbert, A.; Baker, T.R.; Dexter, K.G.; Lewis, S.L.; ter Steege, H.; Lopez-Gonzalez, G.; Monteagudo Mendoza, A.; Bri-enen, R.; Feldpausch, T.R.; Pitman, N.; et al. Seasonal drought limits tree species across the Neotropics. Ecography 2017, 40, 618–629. [Google Scholar] [CrossRef] [Green Version]
- Hunter, I. Above ground biomass and nutrient uptake of three tree species (Eucalyptus camaldulensis, Eucalyptus grandis and Dalbergia sissoo) as affected by irrigation and fertiliser, at 3 years of age, in southern India. For. Ecol. Manage. 2001, 144, 189–200. [Google Scholar] [CrossRef]
- Stape, J.L.; Binkley, D.; Ryan, M.G.; Fonseca, S.; Loos, R.A.; Takahashi, E.N.; Silva, C.R.; Silva, S.R.; Hakamada, R.E.; de A Ferreira, J.M.; et al. The Brazil Eucalyptus Potential Productivity Project: Influence of water, nutrients and stand uniformity on wood production. For. Ecol. Manag. 2010, 259, 1684–1694. [Google Scholar] [CrossRef]
- Campoe, O.C.; Stape, J.L.; Albaugh, T.J.; Lee Allen, H.; Fox, T.R.; Rubilar, R.; Binkley, D. Fertilization and irrigation effects on tree level aboveground net primary production, light interception and light use efficiency in a loblolly pine plantation. For. Ecol. Manage. 2013, 288, 43–48. [Google Scholar] [CrossRef]
- Minhas, P.S.; Yadav, R.K.; Lal, K.; Chaturvedi, R.K. Effect of long-term irrigation with wastewater on growth, biomass production and water use by Eucalyptus (Eucalyptus tereticornis Sm.) planted at variable stocking density. Agric. Water Manag. 2015, 152, 151–160. [Google Scholar] [CrossRef]
- Pérez-Cruzado, C.; Sanchez-Ron, D.; Rodríguez-Soalleiro, R.; Hernández, M.J.; Mario Sánchez-Martín, M.; Cañellas, I.; Sixto, H. Biomass production assessment from Populus spp. short-rotation irrigated crops in Spain. GCB Bioenergy 2014, 6, 312–326. [Google Scholar] [CrossRef]
- Fick, S.E.; Hijmans, R.J. WorldClim 2: New 1 km spatial resolution climate surfaces for global land areas. Int. J. Climatol. 2017, 37, 4302–4315. [Google Scholar] [CrossRef]
- Bhattacharyya, T.; Pal, D.K.; Mandal, C.; Chandran, P.; Ray, S.K.; Sarkar, D.; Velmourougane, K.; Srivastava, A.; Sidhu, G.S.; Singh, R.S.; et al. Soils of India: Historical perspective, classification and recent advances. Curr. Sci. 2013, 104, 1308–1323. [Google Scholar]
- Reddy, C.S.; Jha, C.S.; Diwakar, P.G.; Dadhwal, V.K. Nationwide classification of forest types of India using remote sensing and GIS. Environ. Monit. Assess. 2015, 187, 1–30. [Google Scholar] [CrossRef]
- Ratnam, J.; Chengappa, S.K.; Machado, S.J.; Nataraj, N.; Osuri, A.M.; Sankaran, M. Functional Traits of Trees from Dry Decidu-ous “Forests” of Southern India Suggest Seasonal Drought and Fire Are Important Drivers. Front. Ecol. Evol. 2019, 7, 1–6. [Google Scholar] [CrossRef] [Green Version]
- Roy, P.S.; Behera, M.D.; Murthy, M.S.R.; Roy, A.; Singh, S.; Kushwaha, S.P.S.; Jha, C.S.; Sudhakar, S.; Joshi, P.K.; Reddy, C.S.; et al. New vegetation type map of India prepared using satellite remote sensing: Comparison with global vegetation maps and utili-ties. Int. J. Appl. Earth Obs. Geoinf. 2015, 39, 142–159. [Google Scholar] [CrossRef]
- GOI. Pocket Book of Agricultural Statistics; Ministry of Agriculture & Farmers Welfare Department of Agriculture, Cooperation & Farmers Welfare, Directorate of Economics & Statistics, Government of India: New Delhi, India, 2019; 122p. Available online: https://eands.dacnet.nic.in/PDF/Pocket%20Book%202019.pdf (accessed on 25 October 2021).
- Trabucco, A.; Zomer, R. Global Aridity Index and Potential Evapotranspiration (ET0) Climate Database v2. Figshare Dataset 2019. [Google Scholar] [CrossRef]
- Chauhan, S.; Arun Kumar, A.N. Assessment of variability in morphological and wood quality traits in Melia dubia Cav. for selec-tion of superior trees. J. Indian Acad. Wood Sci. 2014, 11, 25–32. [Google Scholar] [CrossRef]
- Reyes, G.; Brown, S.; Chapman, J.; Lugo, A.E. Wood Densities of Tropical Tree Species: General Technical Report SO-88; U.S. Dept of Agriculture, Forest Service, Southern Forest: New Orleans, LA, USA, 1992; 15p. [CrossRef]
- Zanne, A.E.; Lopez-Gonzalez, G.; Coomes, D.A.; Ilic, J.; Jansen, S.; Lewis, S.L.; Miller, R.B.; Swenson, N.G.; Wiemann, M.C.; Chave, J. Data from: Towards a Worldwide Wood Economics Spectrum. Available online: https://datadryad.org/stash/dataset/doi:10.5061/dryad.234 (accessed on 25 October 2021).
- Osuri, A.M.; Gopal, A.; Raman, T.R.S.; Defries, R.; Cook-Patton, S.C.; Naeem, S. Greater stability of carbon capture in spe-cies-rich natural forests compared to species-poor plantations. Environ. Res. Lett. 2020, 15, 034011. [Google Scholar] [CrossRef]
- Sales-come, R.; Baldos, A.P. Carbon Stocks Assessment of Various Land Uses in Marginal Land. J. Sci. Eng. Technol. 2018, 6, 201–207. [Google Scholar]
- Tesfaye, M.A.; Gardi, O.; Anbessa, T.B.; Blaser, J. Aboveground biomass, growth and yield for some selected introduced tree species, namely Cupressus lusitanica, Eucalyptus saligna, and Pinus patula in Central Highlands of Ethiopia. J. Ecol. Environ. 2020, 44, 1–18. [Google Scholar] [CrossRef] [Green Version]
- Chave, J.; Andalo, C.; Brown, S.; Cairns, M.A.; Chambers, J.Q.; Eamus, D.; Fölster, H.; Fromard, F.; Higuchi, N.; Kira, T.; et al. Tree allometry and improved estimation of carbon stocks and balance in tropical forests. Oecologia 2005, 145, 87–99. [Google Scholar] [CrossRef]
- Rahman, S.A.; Sunderland, T.; Kshatriya, M.; Roshetko, J.M.; Pagella, T.; Healey, J.R. Towards productive landscapes: Trade-offs in tree-cover and income across a matrix of smallholder agricultural land-use systems. Land Use Policy 2016, 58, 152–164. [Google Scholar] [CrossRef] [Green Version]
- Nuthan, D.; Chandrashekara Reddy, K.M.; Sunil Kumar, P.; Vajranabhaiah, S.N.; Yogeesha, T.D. Cultivation of Melia dubia on Farm Lands in Kanakapura Taluk, Ramanagara District of Karnataka-a Success Story; University of Agricultural Sciences: Bangalore, India, 2009; 33p. [Google Scholar]
- QGIS. Development Team Geographic Information System. Open Source Geospatial Foundation Project. Available online: http://qgis.osgeo.org2017 (accessed on 26 October 2021).
- Thien, S.J. A flow diagram for teaching texture by feel analysis. J. Agron. Educ. 1979, 8, 54–55. [Google Scholar] [CrossRef]
- Walkley, A.; Black, I.A. An Examination of the Degtjareff method for determining soil organic matter and a proposed modifica-tion of the chromic acid titration method. Soil Sci. 1934, 37, 29–38. [Google Scholar] [CrossRef]
- Subbiah, B.V.; Asija, G.L. A rapid procedure for the estimation of available nitrogen in soils. Curr. Sci. 1934, 25, 59–60. [Google Scholar]
- Olsen, S.R.; Cole, C.V.; Watanabe, F.S.; Dean, L.A. Estimation of Available Phosphorus in Soils by Extraction with Sodium Bicar-Bonate; Circular/United States Department of Agriculture: Washington, DC, USA, 1954.
- Richards, L.A. Diagnosis and Improvement of Saline and Sodic Soils; Richards, L.A., Ed.; United States Department of Agriculture: Washington, DC, USA, 1954; 160p.
- Kassambara, A. ggcorrplot: Visualization of a Correlation Matrix Using “ggplot2”. R Package Version 0.1.3, 2019. Available online: https://CRAN.R-project.org/package=ggcorrplot (accessed on 4 June 2021).
- R Core Team. R: A Language and Environment for Statistical Computing; R Foundation for Statistical Computing: Vienna, Austria, 2020. [Google Scholar]
- Inkscape Inkscape 1.0 (4035a4fb49, 2020-05-01). Open Source Scalable Vector Graphics Editor 2020. Available online: https://inkscape.org/ (accessed on 26 October 2021).
- Thomas, S.C.; Martin, A.R. Carbon content of tree tissues: A synthesis. Forests 2012, 3, 332–352. [Google Scholar] [CrossRef] [Green Version]
- Mani, S.; Parthasarathy, N. Above-ground biomass estimation in ten tropical dry evergreen forest sites of peninsular India. Biomass Bioenergy 2007, 31, 284–290. [Google Scholar] [CrossRef]
- Naveenkumar, J.; Arunkumar, K.S.; Sundarapandian, S. Biomass and carbon stocks of a tropical dry forest of the Javadi Hills, Eastern Ghats, India. Carbon Manag. 2017, 8, 351–361. [Google Scholar] [CrossRef]
- Kothandaraman, S.; Dar, J.A.; Sundarapandian, S.; Dayanandan, S.; Khan, M.L. Ecosystem-level carbon storage and its links to diversity, structural and environmental drivers in tropical forests of Western Ghats, India. Sci. Rep. 2020, 10, 13444. [Google Scholar] [CrossRef] [PubMed]
- Karmacharya, S.B.; Singh, K.P. Biomass and net production of teak plantations in a dry tropical region in India. For. Ecol. Manage. 1992, 55, 233–247. [Google Scholar] [CrossRef]
- Buvaneswaran, C.; George, M.; Perez, D.; Kanninen, M. Biomass of Teak Plantations in Tamil Nadu, India and Costa Rica Com-pared. J. Trop. For. Sci. 2006, 18, 195–197. [Google Scholar]
- Kanime, N.; Kaushal, R.; Tewari, S.K.; Raverkar, K.P.; Chaturvedi, S.; Chaturvedi, O.P. Biomass production and carbon sequestra-tion in different tree-based systems of Central Himalayan Tarai region. For. Trees Livelihoods 2013, 22, 38–50. [Google Scholar] [CrossRef]
- Arora, G.; Chaturvedi, S.; Kaushal, R.; Nain, A.; Tewari, S.; Alam, N.M.; Chaturvedi, O.P. Growth, biomass, carbon stocks, and sequestration in an age series of Populus deltoids plantations in Tarai region of central Himalaya. Turkish J. Agric. For. 2014, 38, 550–560. [Google Scholar] [CrossRef]
- Swamy, S.L.; Puri, S.; Singh, A.K. Growth, biomass, carbon storage and nutrient distribution in Gmelina arborea Roxb. stands on red lateritic soils in central India. Bioresour. Technol. 2003, 90, 109–126. [Google Scholar] [CrossRef]
- Swamy, S.L.; Mishra, A.; Puri, S. Biomass production and root distribution of Gmelina arborea under an agrisilviculture system in subhumid tropics of Central India. New For. 2003, 26, 167–186. [Google Scholar] [CrossRef]
- Kumar, B.M.; George, S.J.; Jamaludheen, V.; Suresh, T.K. Comparison of biomass production, tree allometry and nutrient use efficiency of multipurpose trees grown in woodlot and silvopastoral experiments in Kerala, India. For. Ecol. Manag. 1998, 112, 145–163. [Google Scholar] [CrossRef]
- Tyagi, K.; Sharma, S.D.; Tyagi, P. Development of biomass and productivity in an age series of Dalbergia sissoo plantations in sodic lands of Uttar Pradesh. Ann. For. 2009, 17, 219–233. [Google Scholar]
- Rana, B.S.; Rao, O.P.; Singh, B.P. Biomass production in 7 year old plantations of Casuarina equisetifolia on sodic soil. Trop. Ecol. 2001, 42, 207–212. [Google Scholar]
- Rajendran, K.; Devaraj, P. Biomass and nutrient distribution and their return of Casuarina equisetifolia inoculated with biofertiliz-ers in farm land. Biomass Bioenergy 2004, 26, 235–249. [Google Scholar] [CrossRef]
- Frederick, D.J.; Madgwick, H.A.I.; Jurgensen, M.F.; Oliver, G.R. Dry matter content and nutrient distribution in an age series of Eucalyptus regnans plantations in New Zealand. New Zeal. J. For. Sci. 1985, 15, 158–179. [Google Scholar]
- Frederick, D.J.; Madgwick, H.A.I.; Oliver, G.R.; Jurgensen, M.F. Dry matter and nutrient content of 8-year-old Eucalyptus saligna growing at Taheke forest. New Zeal. J. For. Sci. 1985, 15, 251–254. [Google Scholar]
- Wang, D.; Bormann, F.H.; Lugo, A.E.; Bowden, R.D. Comparison of nutrient-use efficiency and biomass production in five tropical tree taxa. For. Ecol. Manag. 1991, 46, 1–21. [Google Scholar] [CrossRef]
- Fuwape, J.A.; Akindele, S.O. Biomass yield and energy value od some fast-growing multipurpose trees in Nigeria. Biomass Bioenergy 1997, 12, 101–106. [Google Scholar] [CrossRef]
- Paula, R.R.; Reis, G.G.; Reis, M.G.F.; Neto, S.N.O.; Leite, H.G.; Melido, R.C.N.; Lopes, H.N.S.; Souza, F.C. Eucalypt growth in monoculture and silvopastoral systems with varied tree initial densities and spatial arrangements. Agrofor. Syst. 2013, 87, 1295–1307. [Google Scholar] [CrossRef]
- Acuña, E.; Cancino, J.; Rubilar, R.; Sandoval, S. Aboveground biomass growth and yield of first rotation cutting cycle of Acacia and Eucalyptus short rotation dendroenergy crops. Rev. Árvore 2017, 41, e410608. [Google Scholar] [CrossRef]
- Turner, B.L.; Brenes-Arguedas, T.; Condit, R. Pervasive phosphorus limitation of tree species but not communities in tropical forests. Nature 2018, 555, 367–370. [Google Scholar] [CrossRef] [PubMed]
- Soong, J.L.; Janssens, I.A.; Grau, O.; Margalef, O.; Stahl, C.; Van Langenhove, L.; Urbina, I.; Chave, J.; Dourdain, A.; Ferry, B.; et al. Soil properties explain tree growth and mortality, but not biomass, across phosphorus-depleted tropical forests. Sci. Rep. 2020, 10, 2302. [Google Scholar] [CrossRef] [PubMed] [Green Version]
- Alvarez-Clare, S.; Mack, M.C.; Brooks, M. A direct test of nitrogen and phosphorus limitation to net primary productivity in a lowland tropical wet forest. Ecology 2013, 94, 1540–1551. [Google Scholar] [CrossRef] [PubMed] [Green Version]
Figure 1.
Study region in South India and location of the 186 M. dubia woodlots. The sites span across a gradient in mean annual precipitation (MAP) ranging from 420 to 2170 mm year–1.
Figure 1.
Study region in South India and location of the 186 M. dubia woodlots. The sites span across a gradient in mean annual precipitation (MAP) ranging from 420 to 2170 mm year–1.
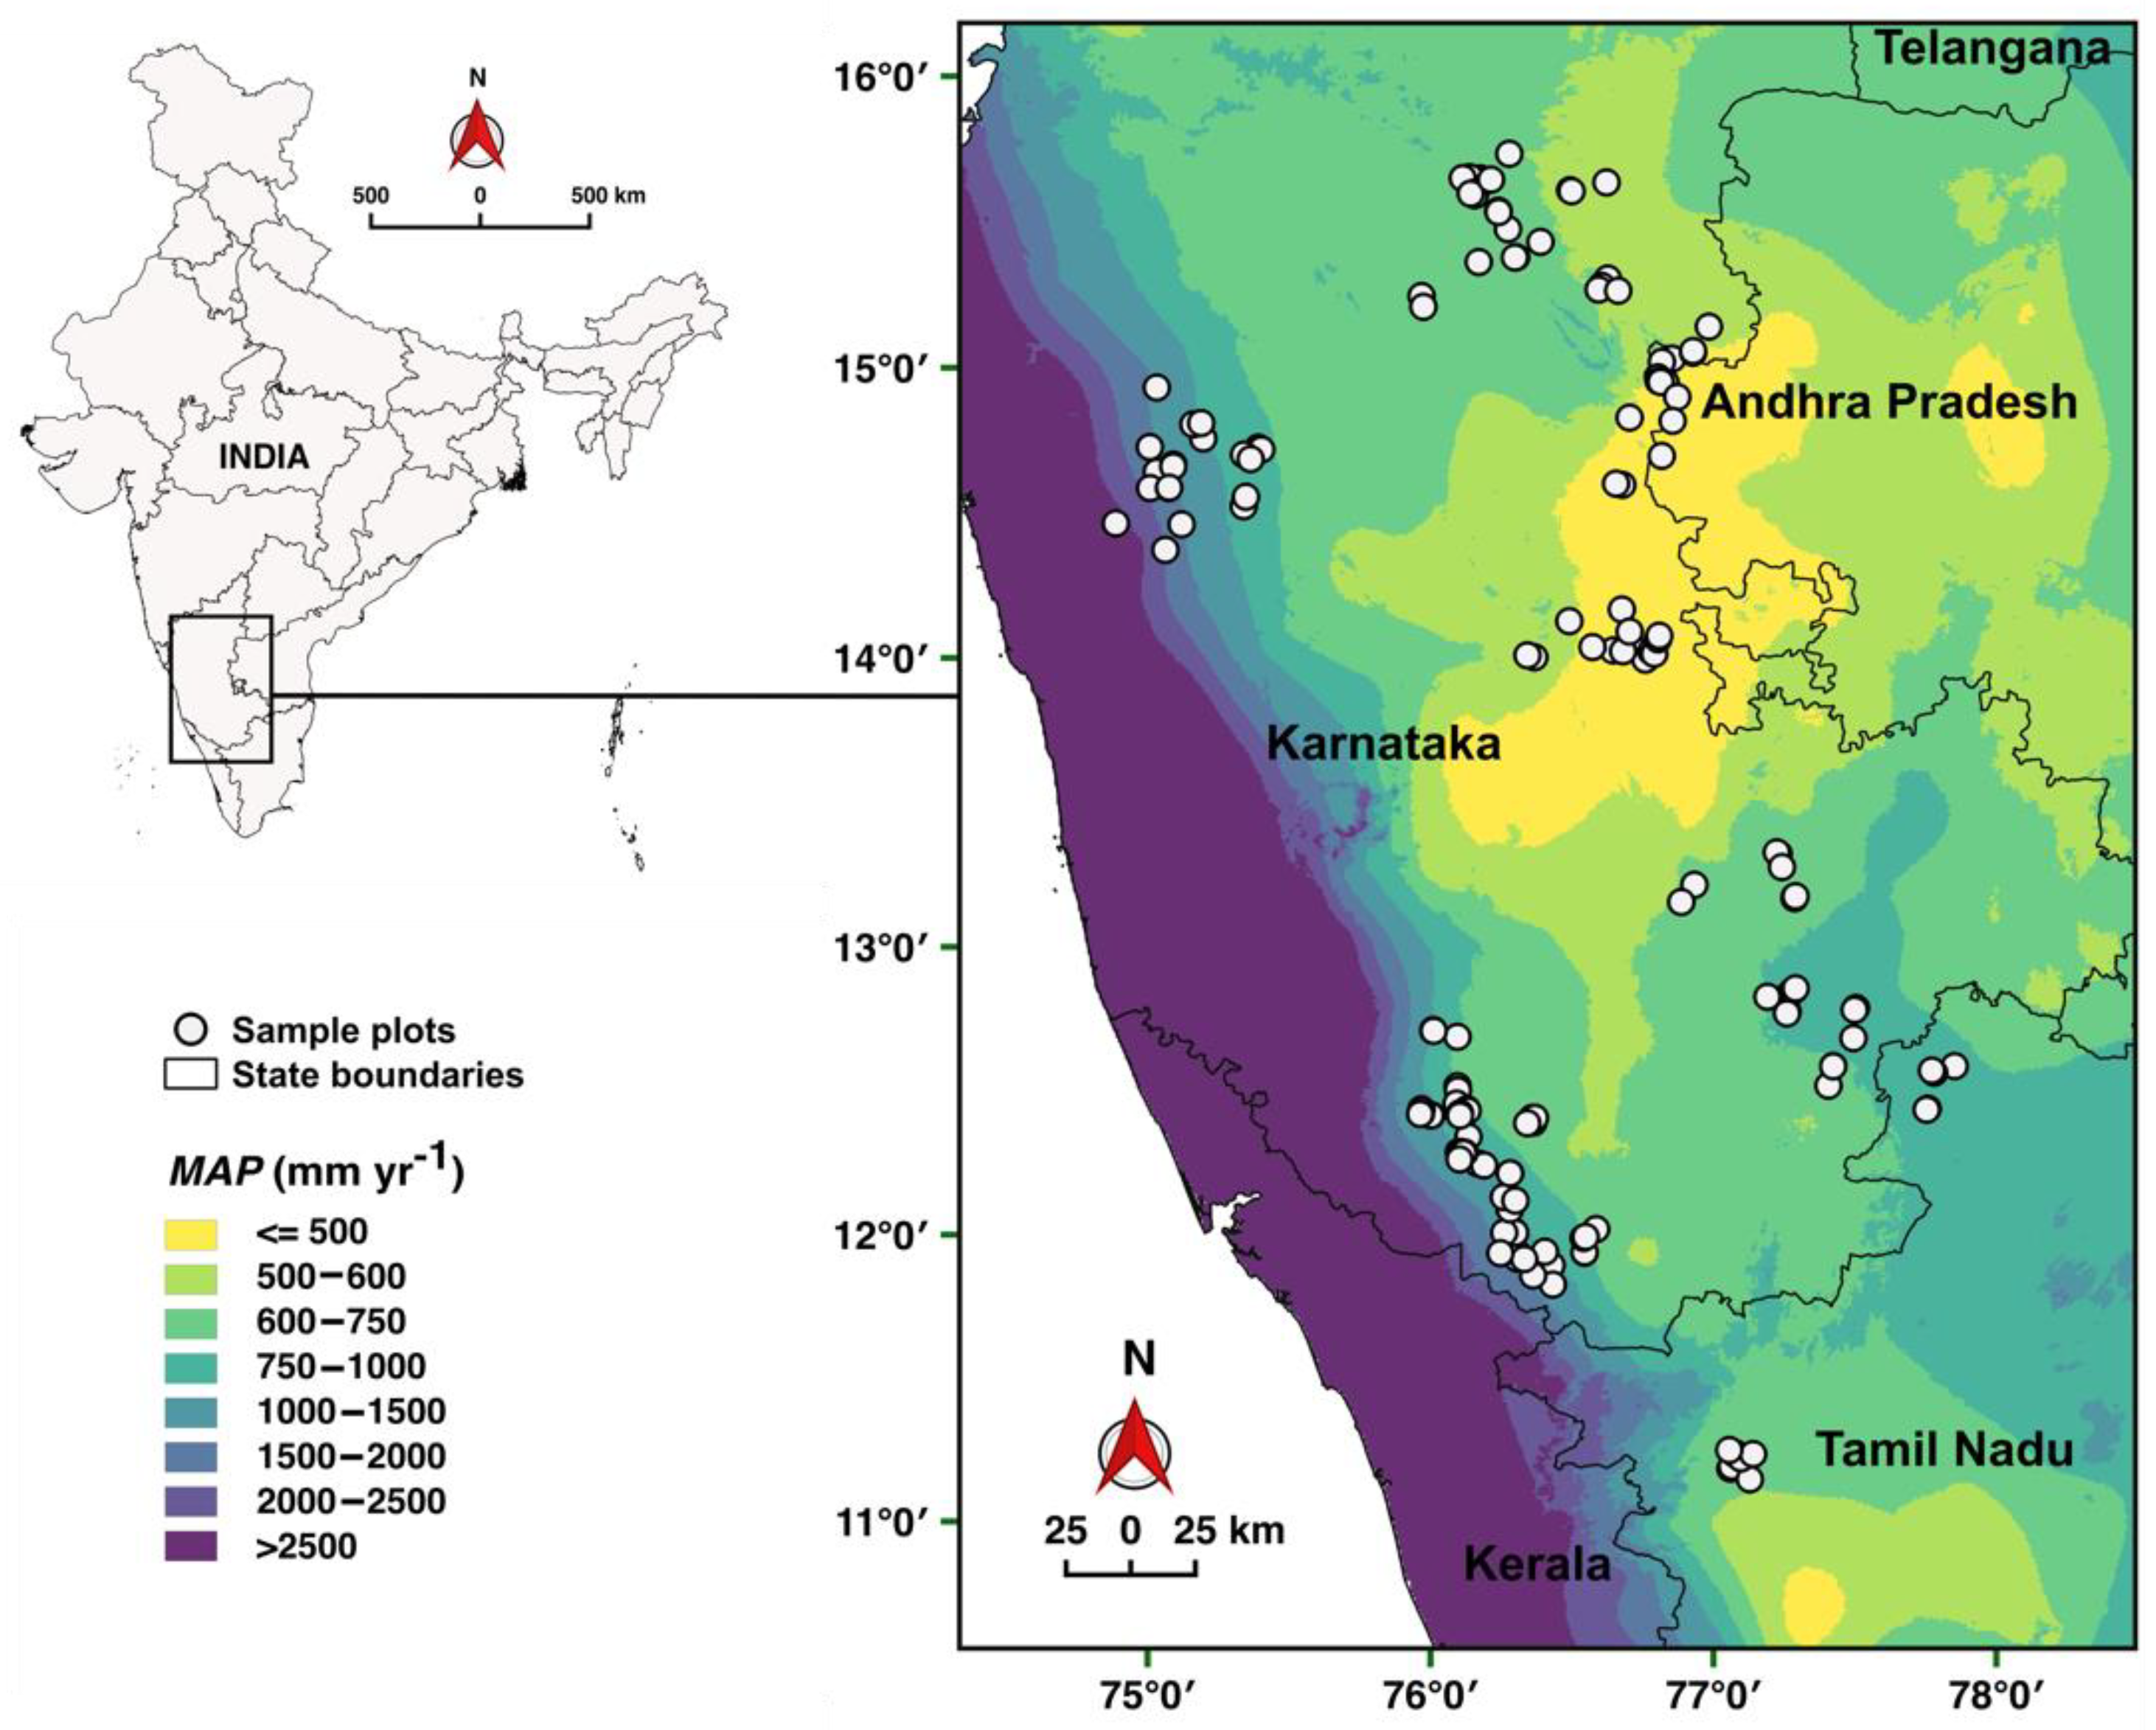
Figure 2.
Key characteristics of the studied M. dubia woodlots. Histograms and kernel densities of selected key sites and management (a–c), climate (d–f) and soil variables (g–i) along the studied gradients. MAP: Mean annual precipitation; CWD: climatological water deficit; Nsoil: soil nitrogen content; Psoil: soil phosphorous content.

Figure 3.
Stand-level aboveground biomass (AGB, Mg ha–1) vs. stand age (months) across the 186 studied woodlots. The line shows the predictions of a log-log linear regression (R² = 0.55, F-statistic: 225.4 on 1 and 184 DF, p < 0.001). Prediction model: AGB = 0.12 × age1.42, valid for an age range from 1 to 108 months.

Figure 4.
Partial predictions of stand-level aboveground biomass (AGB, Mg ha–1) of harvest-ready, nine-year-old woodlots as influenced by key management, climate, and soil variables. Along the observed gradients in climatological water deficit (CWD) (a), stand density (b) and soil nitrogen (Nsoil) (c) and phosphorus (Psoil) (d), AGB is predicted separately for irrigated (blue lines) and non-irrigated woodlots (black lines) from the multiple model. All variables other than tree age (kept at nine years) and the respective displayed variable were kept at their average values (dashed vertical lines). Predictions were computed for the observed ranges of CWD, stand density, Nsoil and Psoil in the irrigated and non-irrigated woodlots, respectively.

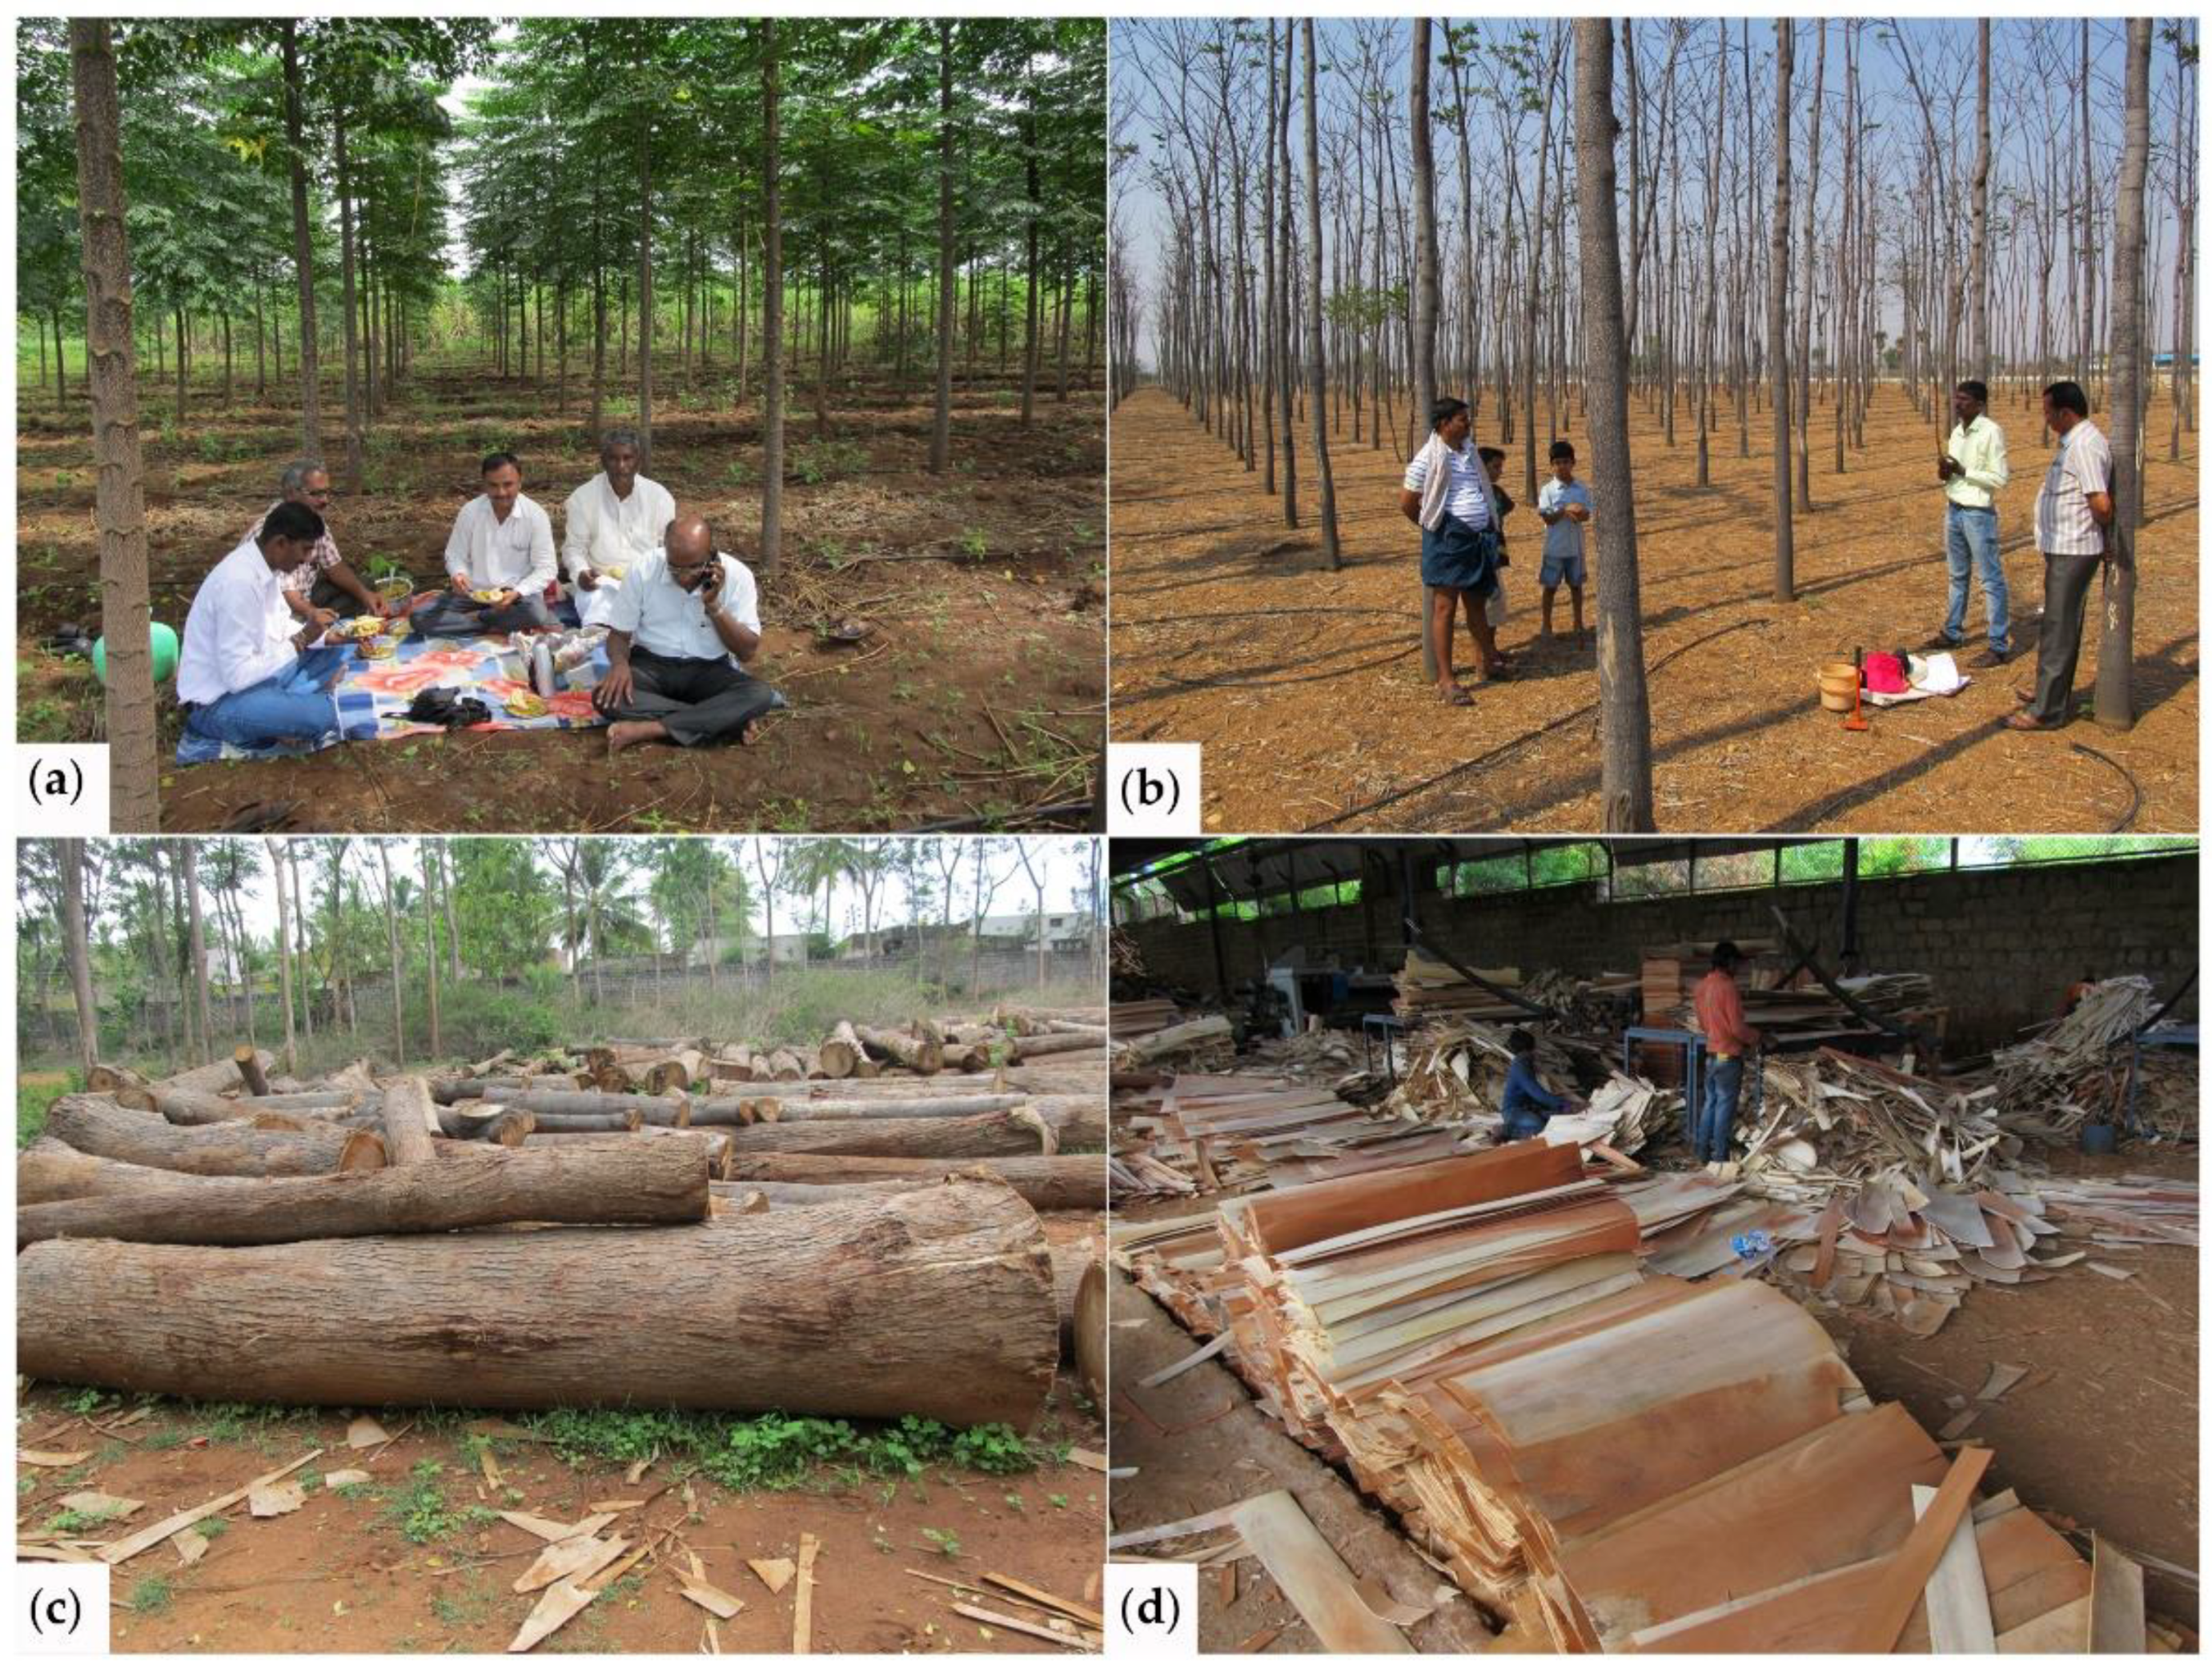
Figure 5.
Fully leafed one-year-old M. dubia woodlot with MAP over 700 mm (a) and a leaf-shed four-year-old woodlot at MAP below 500 mm (b). M. dubia logs at an industrial yard for peeling veneers (c) and extracted veneers (d).
Figure 5.
Fully leafed one-year-old M. dubia woodlot with MAP over 700 mm (a) and a leaf-shed four-year-old woodlot at MAP below 500 mm (b). M. dubia logs at an industrial yard for peeling veneers (c) and extracted veneers (d).


Table 1.
Results of the multiple regression model for stand-level aboveground biomass (AGB) using stand age and preselected key management, climate and soil variables and their interactions as predictors. AGB and predictors (except irrigation, CWD) were natural log-transformed. Except for the main predictor, age, numeric variables were scaled by their standard deviations and centered around zero. The model explains 65% of the variance in AGB across the studied woodlots (F-statistic 41.6 on 8 and 177 DF, p < 0.001). CWD: climatological water deficit; Nsoil: soil nitrogen content; Psoil: soil phosphorus content.
| Parameters | Estimate | SE | t Statistic | p-Value |
|---|---|---|---|---|
| Intercept | 4.52 | 0.32 | 14.27 | <0.001 |
| Age | 1.45 | 0.09 | 16.28 | <0.001 |
| Stand density | 0.54 | 0.29 | 1.84 | 0.06 |
| Age: Stand density | −0.07 | 0.09 | −0.83 | 0.40 |
| Age: Irrigation (irrigated) | 0.06 | 0.04 | 1.67 | 0.09 |
| Age: CWD | 0.08 | 0.03 | 2.62 | <0.01 |
| Age: Nsoil | 0.03 | 0.02 | 1.62 | 0.10 |
| Age: Psoil | 0.05 | 0.02 | 2.89 | <0.01 |
| Age: CWD: Irrigation (irrigated) | −0.05 | 0.03 | −1.37 | 0.17 |
Publisher’s Note: MDPI stays neutral with regard to jurisdictional claims in published maps and institutional affiliations. |
© 2021 by the authors. Licensee MDPI, Basel, Switzerland. This article is an open access article distributed under the terms and conditions of the Creative Commons Attribution (CC BY) license (https://creativecommons.org/licenses/by/4.0/).
Share and Cite
MDPI and ACS Style
Röll, A.; Ramesha, M.N.; Link, R.M.; Hertel, D.; Schuldt, B.; Patil, S.L.; Hölscher, D. Water Availability Controls the Biomass Increment of Melia dubia in South India. Forests 2021, 12, 1675. https://doi.org/10.3390/f12121675
AMA Style
Röll A, Ramesha MN, Link RM, Hertel D, Schuldt B, Patil SL, Hölscher D. Water Availability Controls the Biomass Increment of Melia dubia in South India. Forests. 2021; 12(12):1675. https://doi.org/10.3390/f12121675
Chicago/Turabian StyleRöll, Alexander, Mundre N. Ramesha, Roman M. Link, Dietrich Hertel, Bernhard Schuldt, Shekhargouda L. Patil, and Dirk Hölscher. 2021. "Water Availability Controls the Biomass Increment of Melia dubia in South India" Forests 12, no. 12: 1675. https://doi.org/10.3390/f12121675
Note that from the first issue of 2016, this journal uses article numbers instead of page numbers. See further details here.