
Identifying Wood Based on Near-Infrared Spectra and Four Gray-Level Co-Occurrence Matrix Texture Features


Abstract
:1. Introduction
2. Materials and Methods
2.1. Sample Preparation
2.2. NIR Spectra and Digital Image Collection
2.3. Feature Extraction Analysis and the Fusion Information Model
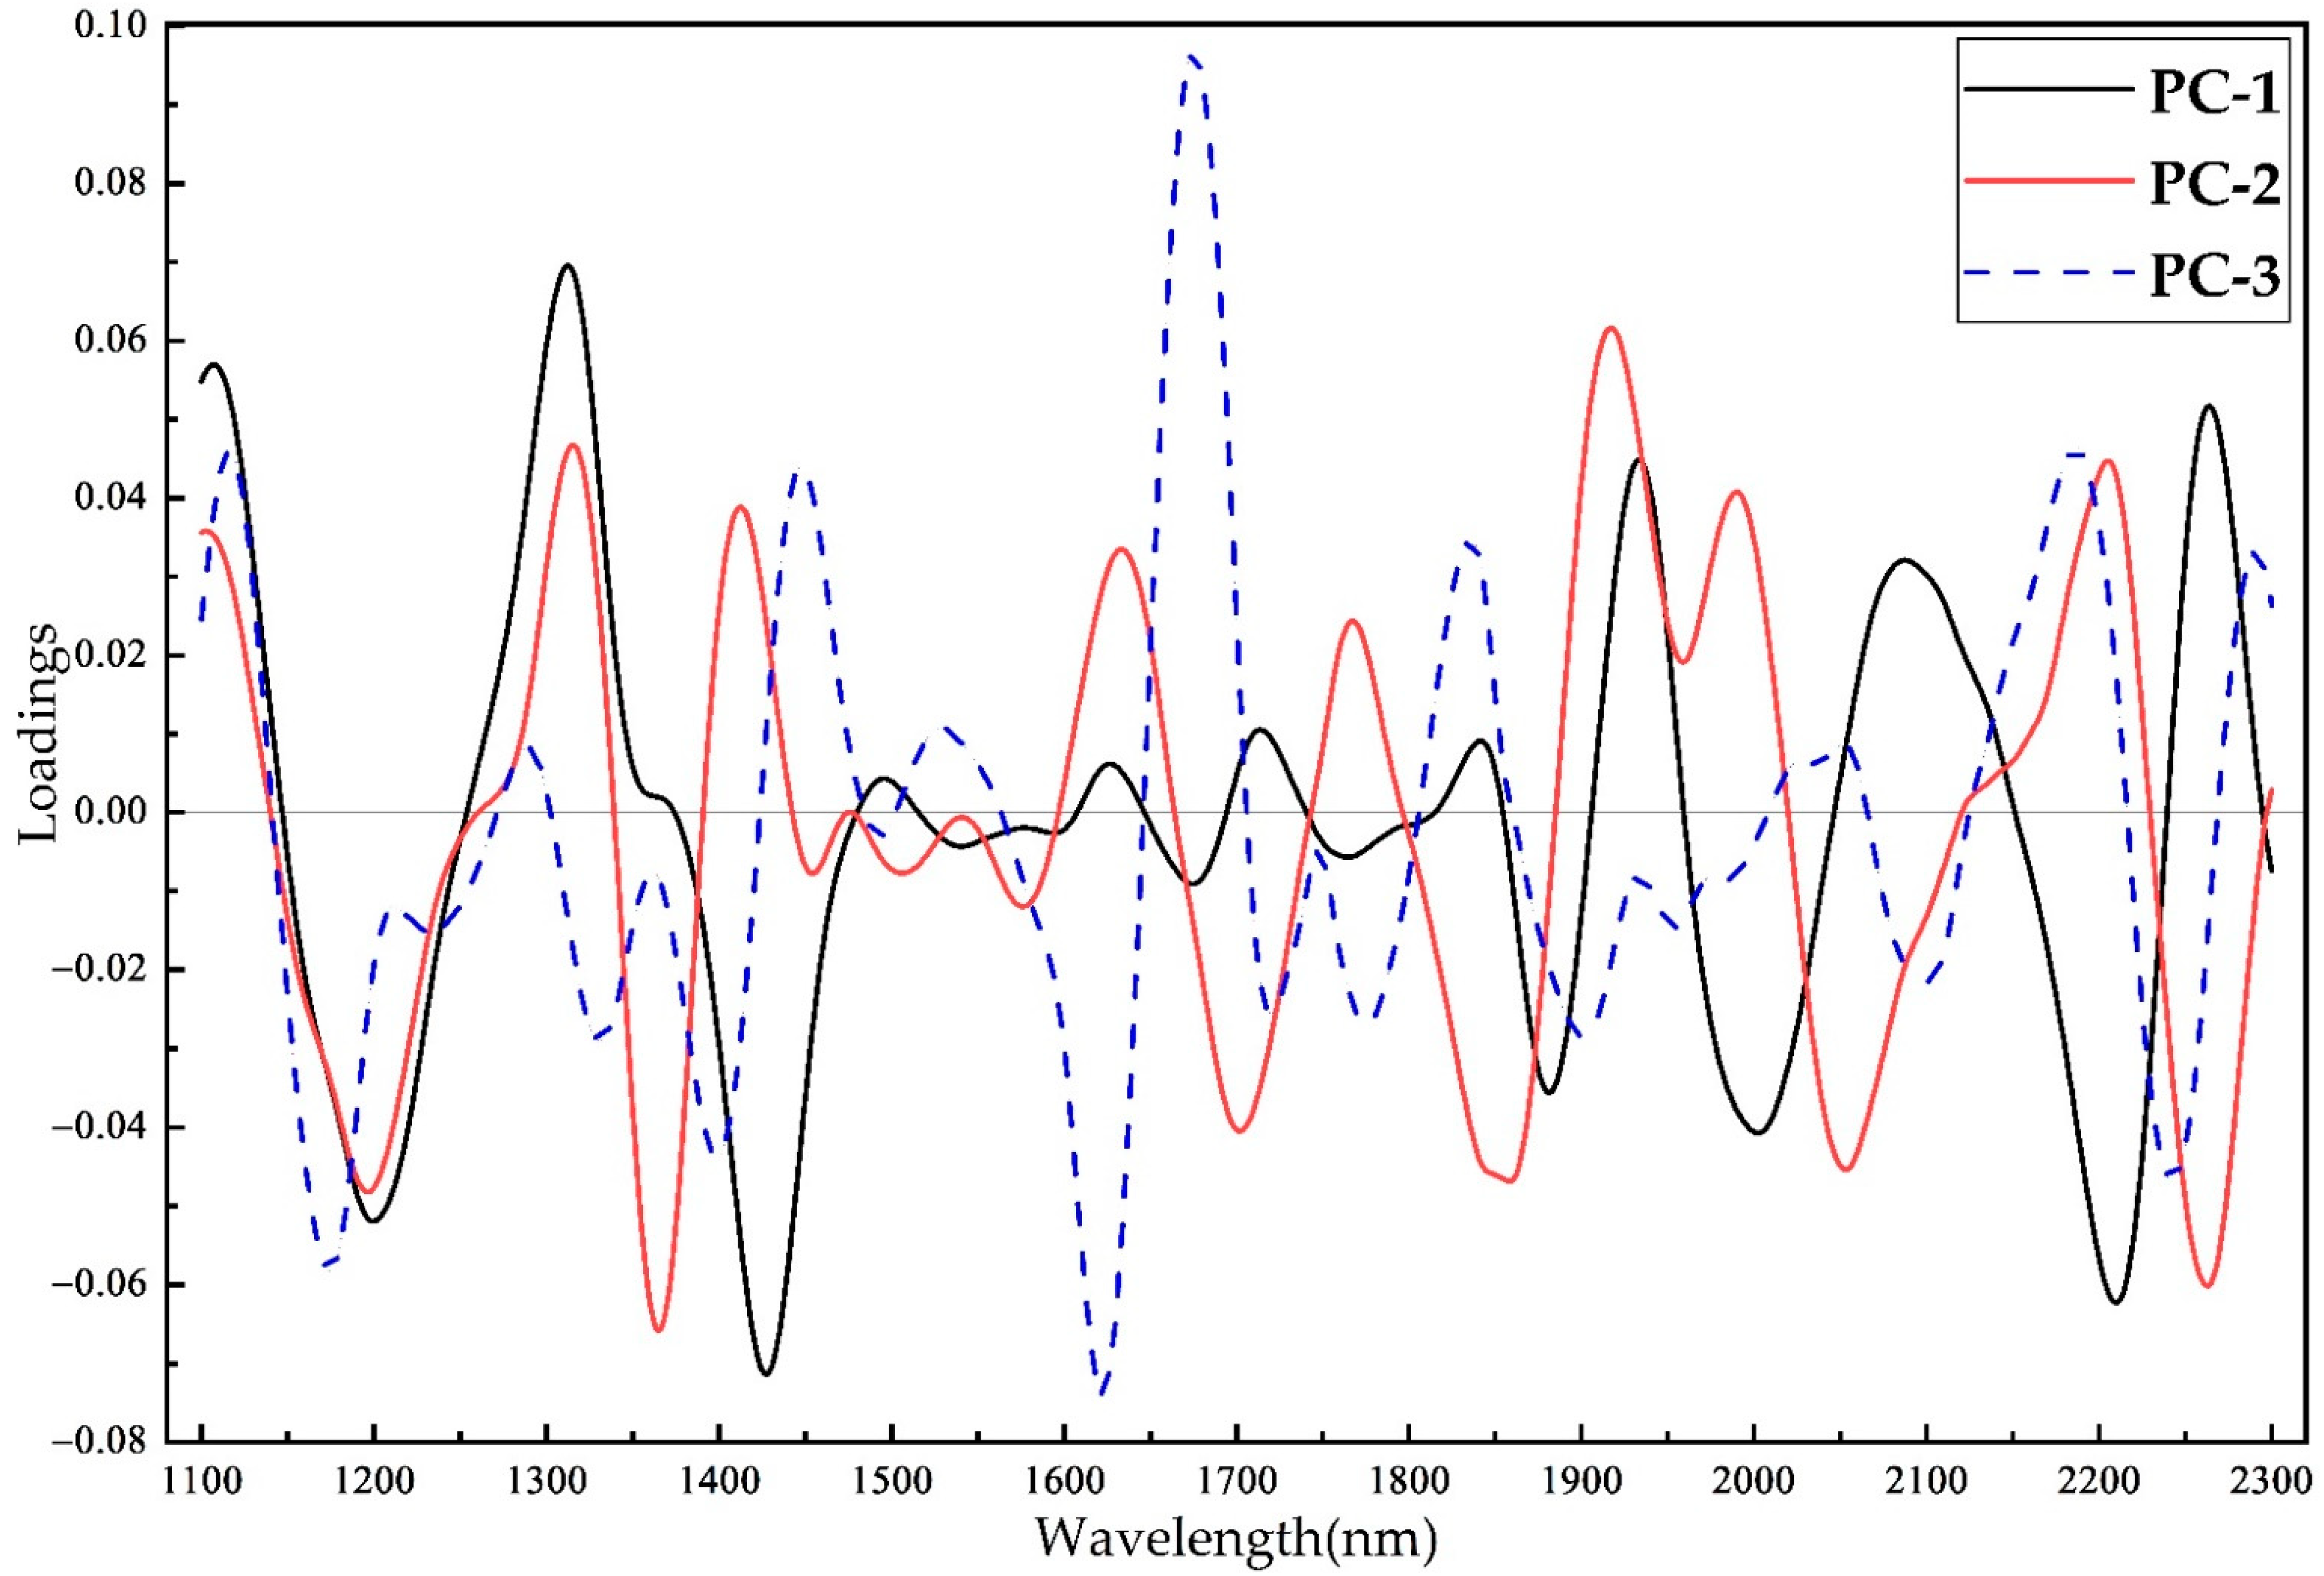
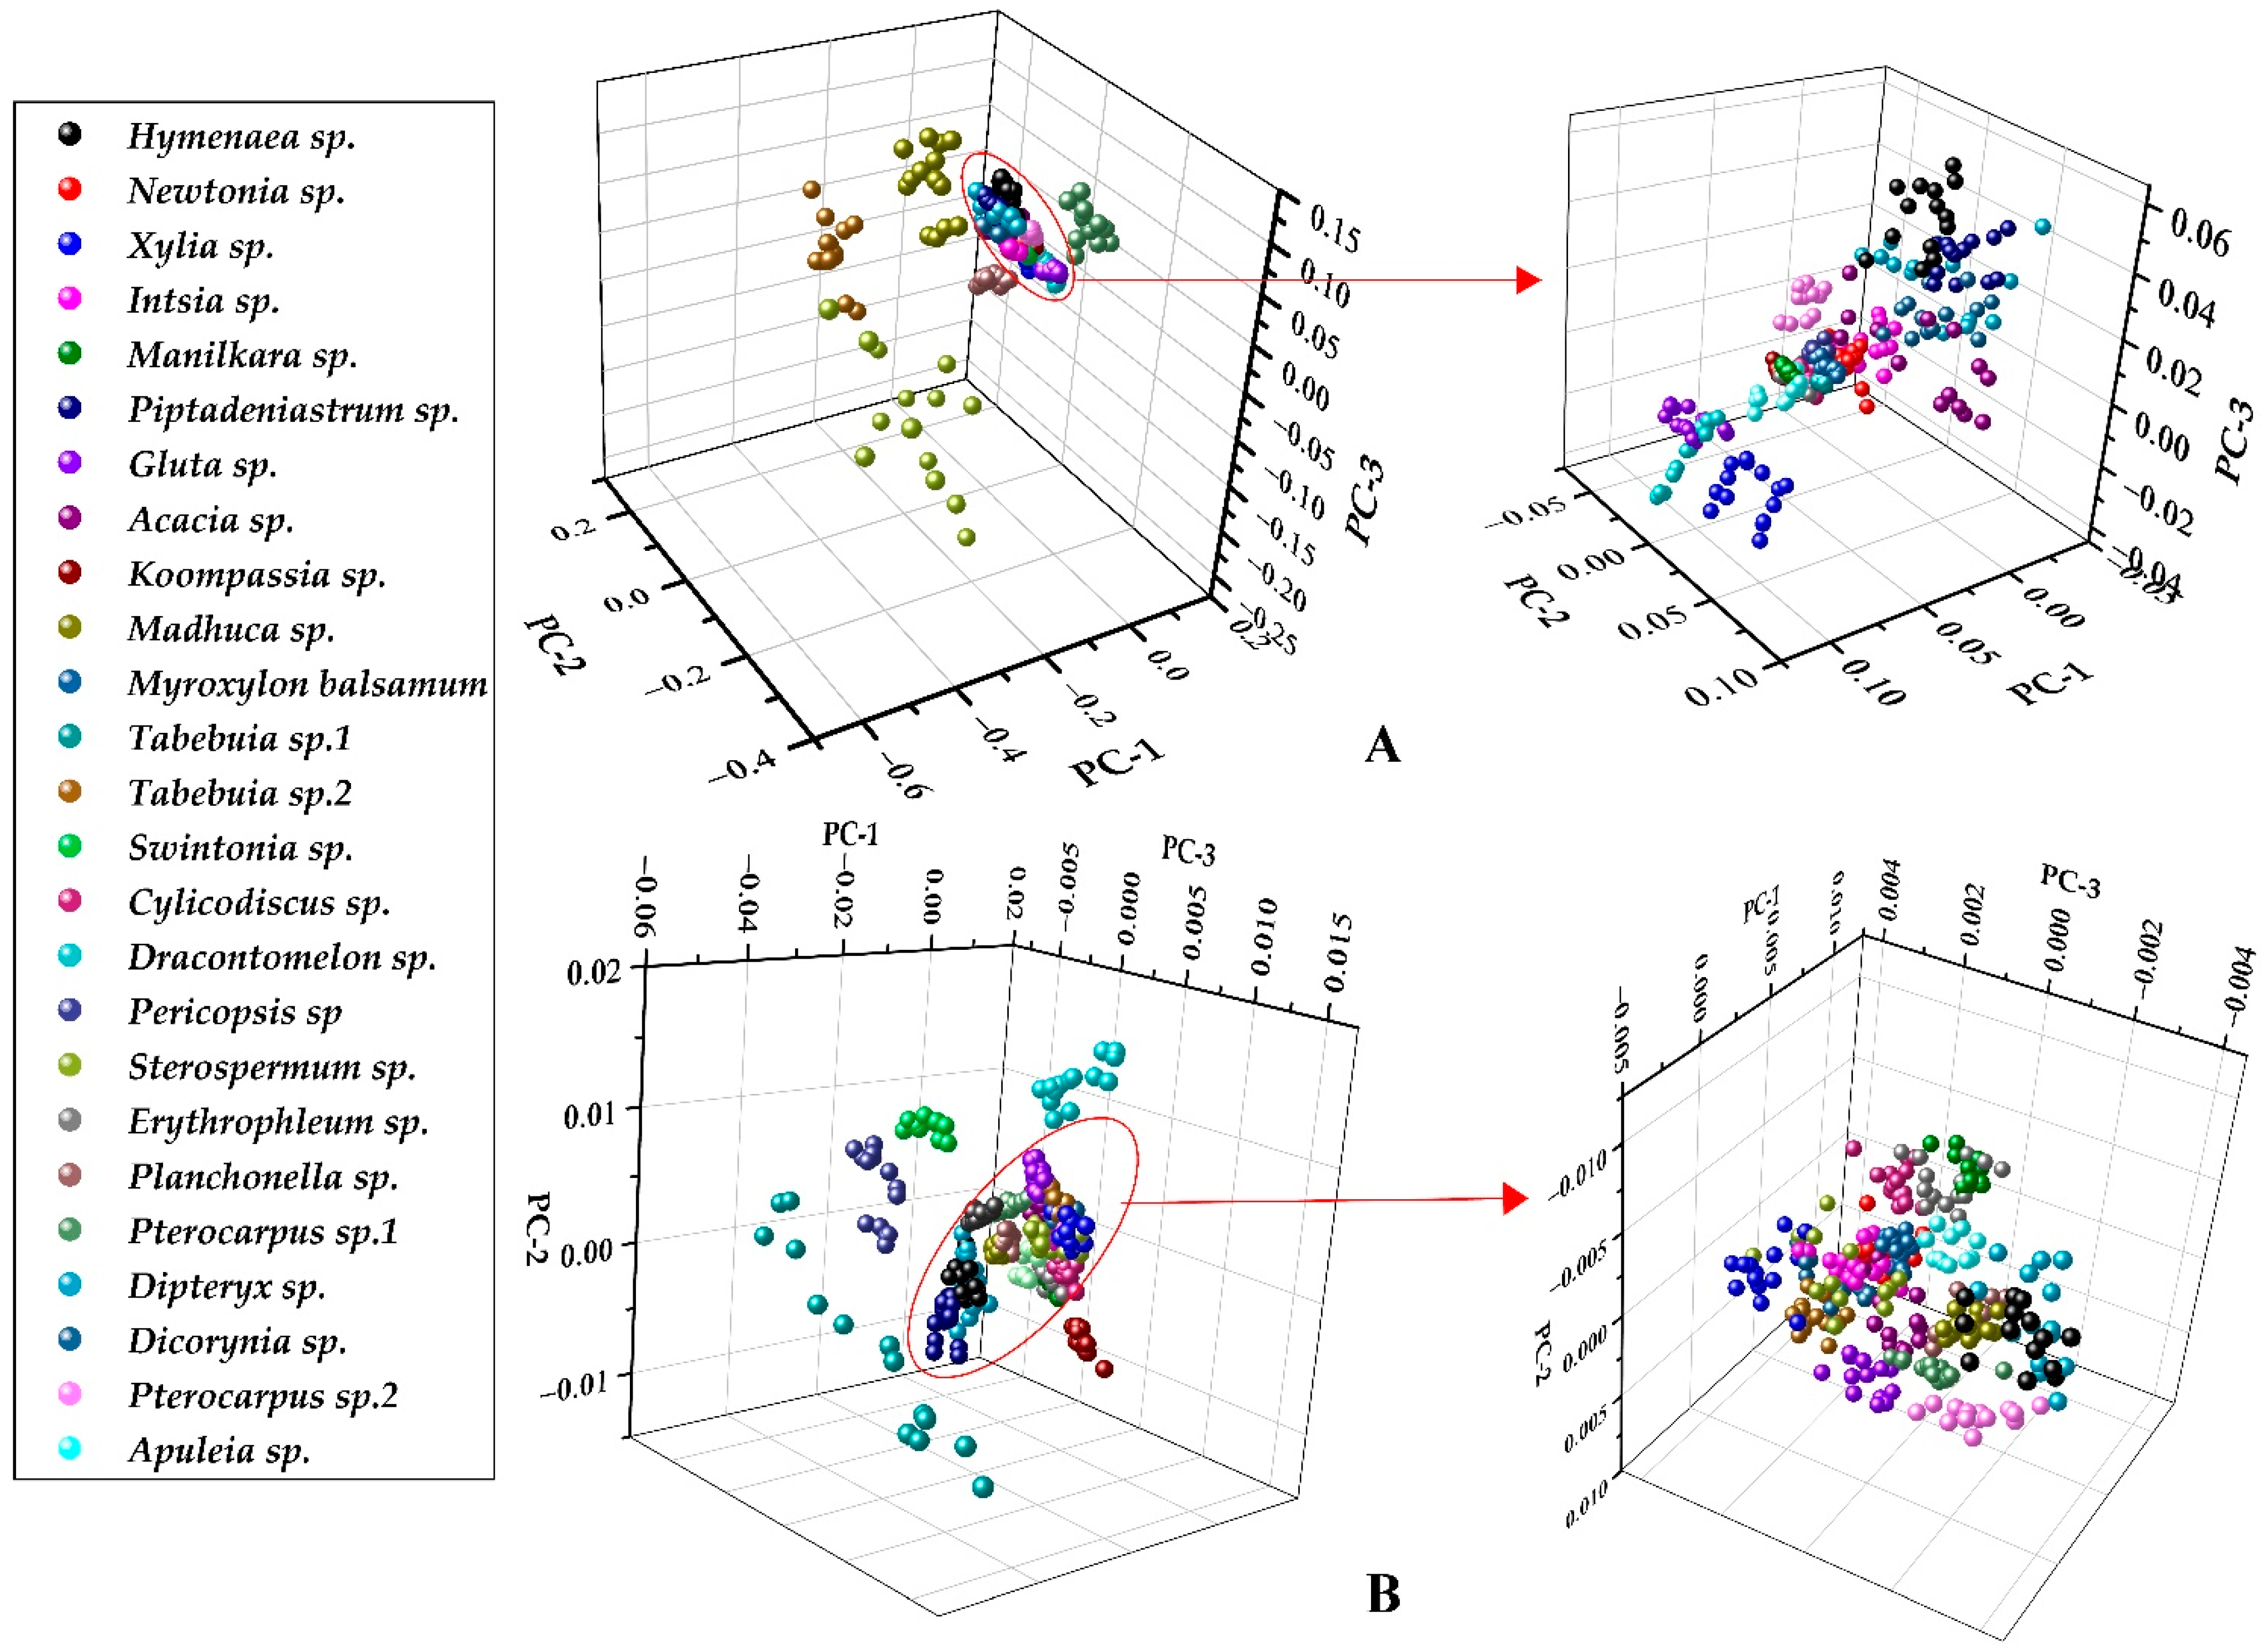
2.3.1. Principal Component Analysis
2.3.2. Extracting the Textural Feature Based on the GLCM
3. Results and Discussion
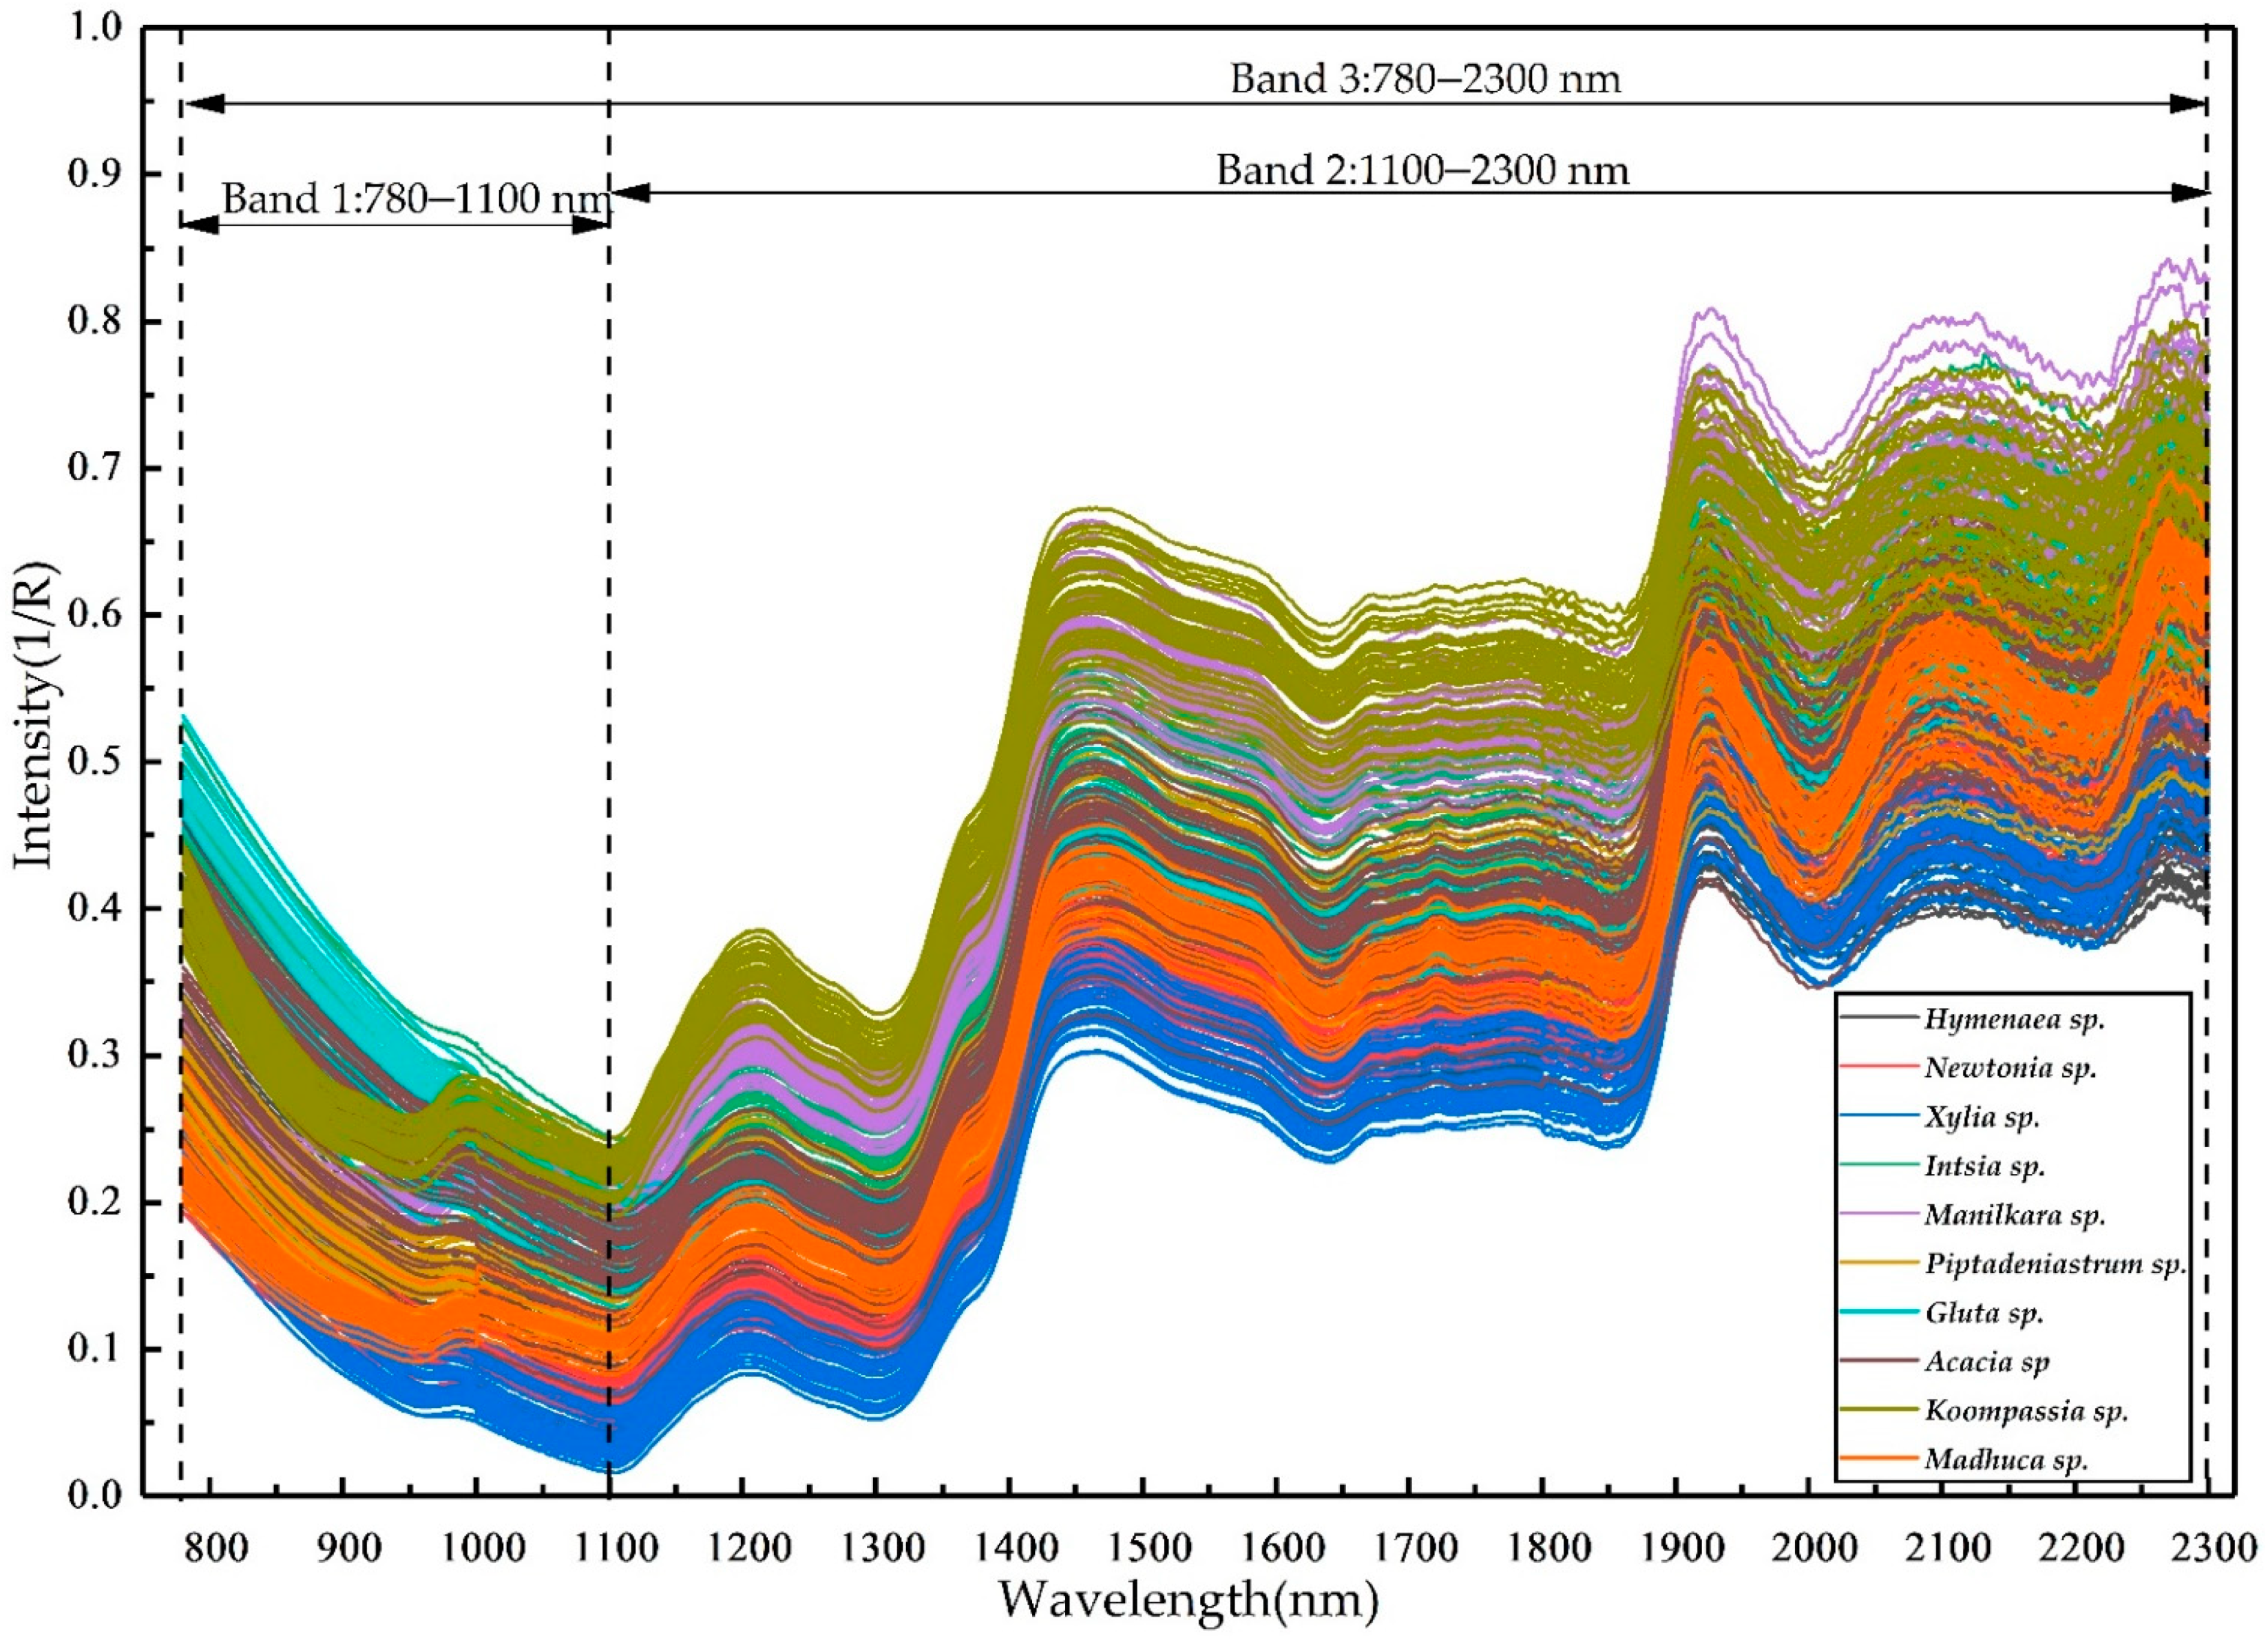
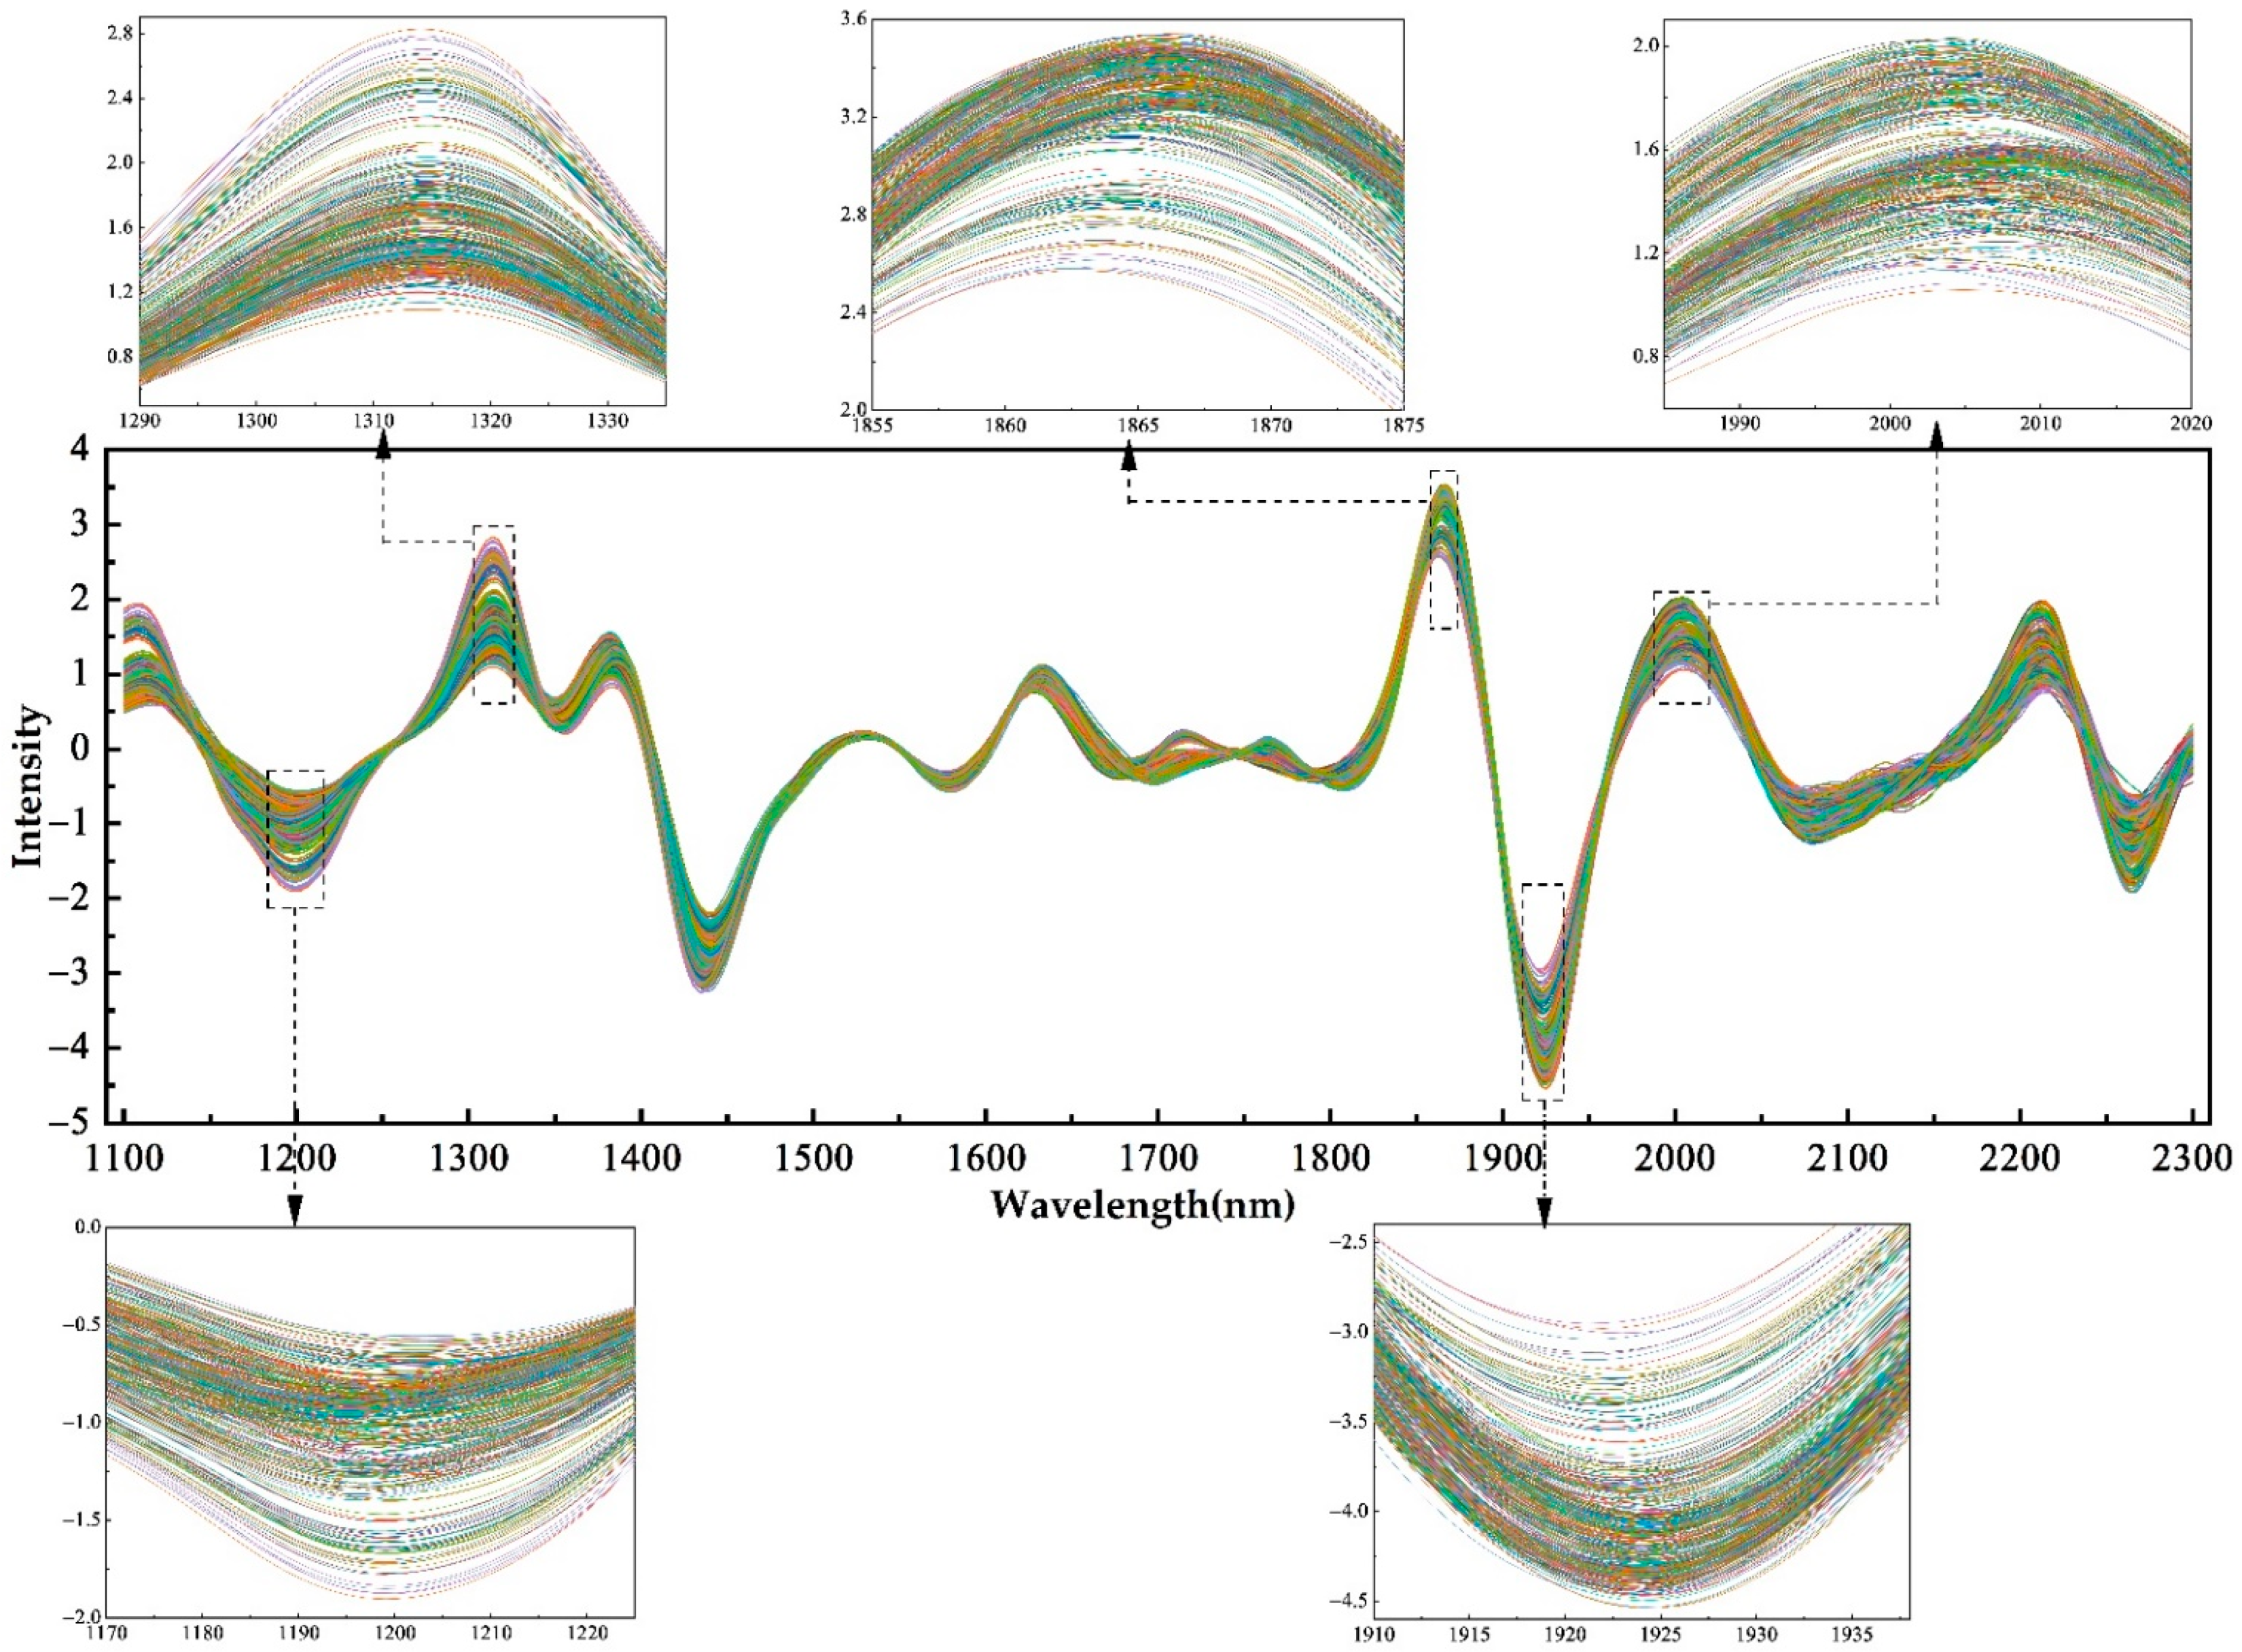
3.1. NIR Spectra and GLCM Features
3.2. Wood Identification Based on Raw NIR Spectra and GLCM Features
3.3. The Influence of Heterogeneity for Identifying Wood
3.4. Wood Identification Based on Shorter NIR Band Fused GLCM Features
3.5. Effects of the GLCM Features on Wood Identification
4. Conclusions
Supplementary Materials
Author Contributions
Funding
Conflicts of Interest
References
- Wang, D.J. Status quo and Characteristics of Global Trade of Forest products. Res. Dev. 2019, 49, 49–53. (In Chinese) [Google Scholar]
- Barmpoutis, P.; Dimitropoulos, K.; Barboutis, I.; Grammalidis, N.; Lefakis, P. Wood species recognition through multidimensional texture analysis. Comput. Electron. Agric. 2018, 144, 241–248. [Google Scholar] [CrossRef]
- Adedipe, O.E.; Dawson-Andoh, B.; Slahor, J.; Osborn, L. Classification of Red Oak (Quercus Rubra) and White Oak (Quercus Alba) Wood Using a near Infrared Spectrometer and Soft Independent Modelling of Class Analogies. J. Near Infrared Spectrosc. 2008, 16, 49–57. [Google Scholar] [CrossRef]
- Pastore, T.C.M.; Braga, J.W.B.; Coradin, V.T.R.; Magalhaes, W.; Okino, E.Y.A.; Camargos, J.A.A.; de Muniz, G.I.B.; Bressan, O.A.; Davrieux, F. Near infrared spectroscopy (NIRS) as a potential tool for monitoring trade of similar woods: Discrimination of true mahogany, cedar, andiroba, and curupixá. Holzforschung 2011, 65, 73–80. [Google Scholar] [CrossRef]
- Braga, J.W.B.; Pastore, T.C.M.; Coradin, V.T.R.; Camargos, J.A.A.; da Silva, A.R. The use of near Infrared Spectroscopy to Identify solid wood Specimens of Swietenia Macrophylla0 (Cites Appendix II). IAWA J. 2011, 32, 285–296. [Google Scholar] [CrossRef]
- Yang, Z.; Lv, B.; Fu, Y.J. The Relationship between near Infrared Spectroscopy and Surface Color of Eight Rosewoods. Adv. Mater. Res. 2012, 479–481, 1772–1776. [Google Scholar] [CrossRef]
- Snel, F.A.; Braga, J.W.B.; Da Silva, D.; Wiedenhoeft, A.C.; Costa, A.D.C.; Soares, R.; Coradin, V.T.R.; Pastore, T.C.M. Potential field-deployable NIRS identification of seven Dalbergia species listed by CITES. Wood Sci. Technol. 2018, 52, 1411–1427. [Google Scholar] [CrossRef] [Green Version]
- Abe, H.; Kurata, Y.; Watanabe, K.; Ishikawa, A.; Noshiro, S.; Fujii, T.; Iwasa, M.; Kaneko, H.; Wada, H. The separation of softwood and hardwood in historical wooden statues of the Nazenji-temple in Japan using NIR spectroscopy. IAWA J. 2020, 41, 740–750. [Google Scholar] [CrossRef]
- Ibrahim, I.; Khairuddin, A.S.M.; Abu Talip, M.S.; Arof, H.; Yusof, R. Tree species recognition system based on macroscopic image analysis. Wood Sci. Technol. 2017, 51, 431–444. [Google Scholar] [CrossRef]
- Ibrahim, I.; Khairuddin, A.S.M.; Arof, H.; Yusof, R.; Hanafi, E. Statistical feature extraction method for wood species recognition system. Holz. Als. Roh. Werkst. 2017, 76, 345–356. [Google Scholar] [CrossRef]
- Yusof, R.; Khalid, M.; Khairuddin, A.S.M. Application of kernel-genetic algorithm as nonlinear feature selection in tropical wood species recognition system. Comput. Electron. Agric. 2013, 93, 68–77. [Google Scholar] [CrossRef]
- Rajagopal, H.; Khairuddin, A.S.M.; Mokhtar, N.; Ahmad, A.; Yusof, R. Application of image quality assessment module to motion-blurred wood images for wood species identification system. Wood Sci. Technol. 2019, 53, 967–981. [Google Scholar] [CrossRef]
- Kobayashi, K.; Akada, M.; Torigoe, T.; Imazu, S.; Sugiyama, J. Automated recognition of wood used in traditional Japanese sculptures by texture analysis of their low-resolution computed tomography data. J. Wood Sci. 2015, 61, 630–640. [Google Scholar] [CrossRef] [Green Version]
- Bremanath, R.; Nithiya, B.; Saipriya, R. Wood Species Recognition Using GLCM and Correlation. In Proceedings of the 2009 International Conference on Advances in Recent Technologies in Communication and Computing, Kottayam, India, 27–28 October 2009; pp. 615–619. [Google Scholar]
- Yusof, R.; Khalid, M.; Khairuddin, A.S.M. Fuzzy logic-based pre-classifier for tropical wood species recognition system. Mach. Vis. Appl. 2013, 24, 1589–1604. [Google Scholar] [CrossRef]
- Wold, S.; Esbensen, K.; Geladi, P. Principal component analysis. Chemom. Intell. Lab. Syst. 1987, 2, 37–52. [Google Scholar] [CrossRef]
- Toscano, G.; Rinnan, Å.; Pizzi, A.; Mancini, M. The Use of Near-Infrared (NIR) Spectroscopy and Principal Component Analysis (PCA) To Discriminate Bark and Wood of the Most Common Species of the Pellet Sector. Energy Fuels 2017, 31, 2814–2821. [Google Scholar] [CrossRef]
- Bharati, M.H.; Liu, J.J.; MacGregor, J.F. Image texture analysis: Methods and comparisons. Chemom. Intell. Lab. Syst. 2004, 72, 57–71. [Google Scholar] [CrossRef]
- Fongaro, L.; Kvaal, K. Surface texture characterization of an Italian pasta by means of univariate and multivariate feature extraction from their texture images. Food Res. Int. 2013, 51, 693–705. [Google Scholar] [CrossRef]
- Kumar, D. Feature Extraction and Selection of kidney Ultrasound Images Using GLCM and PCA. Procedia Comput. Sci. 2020, 167, 1722–1731. [Google Scholar] [CrossRef]
- Turhan, K.; Serdar, B. Support Vector Machines in Wood Identification: The Case of Three Salix Species from Turkey. Turk. J. Agric. For. 2013, 37, 249–256. [Google Scholar]
- Fujimoto, T.; Kurata, Y.; Matsumoto, K.; Tsuchikawa, S. Application of near Infrared Spectroscopy for Estimating Wood Mechanical Properties of Small Clear and Full Length Lumber Specimens. J. Near Infrared Spectrosc. 2008, 16, 529–537. [Google Scholar] [CrossRef]
- Schwanninger, M.; Rodrigues, J.C.; Fackler, K. A Review of Band Assignments in near Infrared Spectra of Wood and Wood Components. J. Near Infrared Spectrosc. 2011, 19, 287–308. [Google Scholar] [CrossRef]
- Park, S.-Y.; Kim, J.-C.; Yeon, S.; Yang, S.-Y.; Yeo, H.; Choi, I.-G. Rapid Prediction of the Chemical Information of Wood Powder from Softwood Species Using Near-Infrared Spectroscopy. Bioresources 2018, 13, 2440–2451. [Google Scholar] [CrossRef] [Green Version]
- Yeon, S.; Park, S.-Y.; Kim, J.-H.; Kim, J.-C.; Yang, S.-Y.; Yeo, H.; Kwon, O.; Choi, I.-G. Effect of Organic Solvent Extractives on Korean Softwoods Classification Using Near-Infrared Spectroscopy. J. Korean Wood Sci. Technol. 2019, 47, 509–518. [Google Scholar] [CrossRef]
- Park, S.-Y.; Kim, J.-H.; Yang, S.-Y.; Yeo, H.; Choi, I.-G. Classification of softwoods using wood extract information and near infrared spectroscopy. Bioresources 2021, 16, 5301–5312. [Google Scholar] [CrossRef]


| ID | Latin Name | Trade Name | Genus | Family |
|---|---|---|---|---|
| 1 | Hymenaea sp. | Courbaril, Jatoba, Jutai, Jatai et al. | Hymenaea | Caesalpiniaceae |
| 2 | Newtonia sp. | Dahoma | Newtonia | Mimosaceae |
| 3 | Xylia sp. | Pyinkado, Cam xe, Deng, Sokram | Xylia | Mimosaceae |
| 4 | Intsia sp. | Merbau, Mirabow, Ipil, Djumelai et al. | Intsia | Caesalpiniaceae |
| 5 | Manilkara sp. | Macaranduba, Kating, Sawokecik | Manilkara | Sapotaceae |
| 6 | Piptadeniastrum sp. | Dabema, Dahoma, Ekhimi, Toum et al. | Piptadeniastrum | Mimosaceae |
| 7 | Gluta sp. | Rengas, Inhas, Thitsi, Rengas hutan et al. | Gluta | Anacardiaceae |
| 8 | Acacia sp. | Brown salwood, African rosewood et al. | Acacia | Mimosaceae |
| 9 | Koompassia sp. | Kempas, Empas, Impas, Mengeris et al. | Koompassia | Caesalpiniaceae |
| 10 | Madhuca sp. | Bitis, Betis, Masang | Madhuca | Sapotaceae |
| 11 | Myroxylon balsamum (L.) Harms | Balsamo, Estoraque | Myroxylon | Fabaceae |
| 12 | Tabebuia sp. 1 | Tabebuia, Hakia, Guayacan, Ipe et al. | Tabebuia | Bignoniaceae |
| 13 | Tabebuia sp. 2 | White cedar, Whitetababuia, Jahoto et al. | Tabebuia | Bignoniaceae |
| 14 | Swintonia sp. | Merpauh, Civit, Boilam, Merpau et al. | Swintonia | Anacardiaceae |
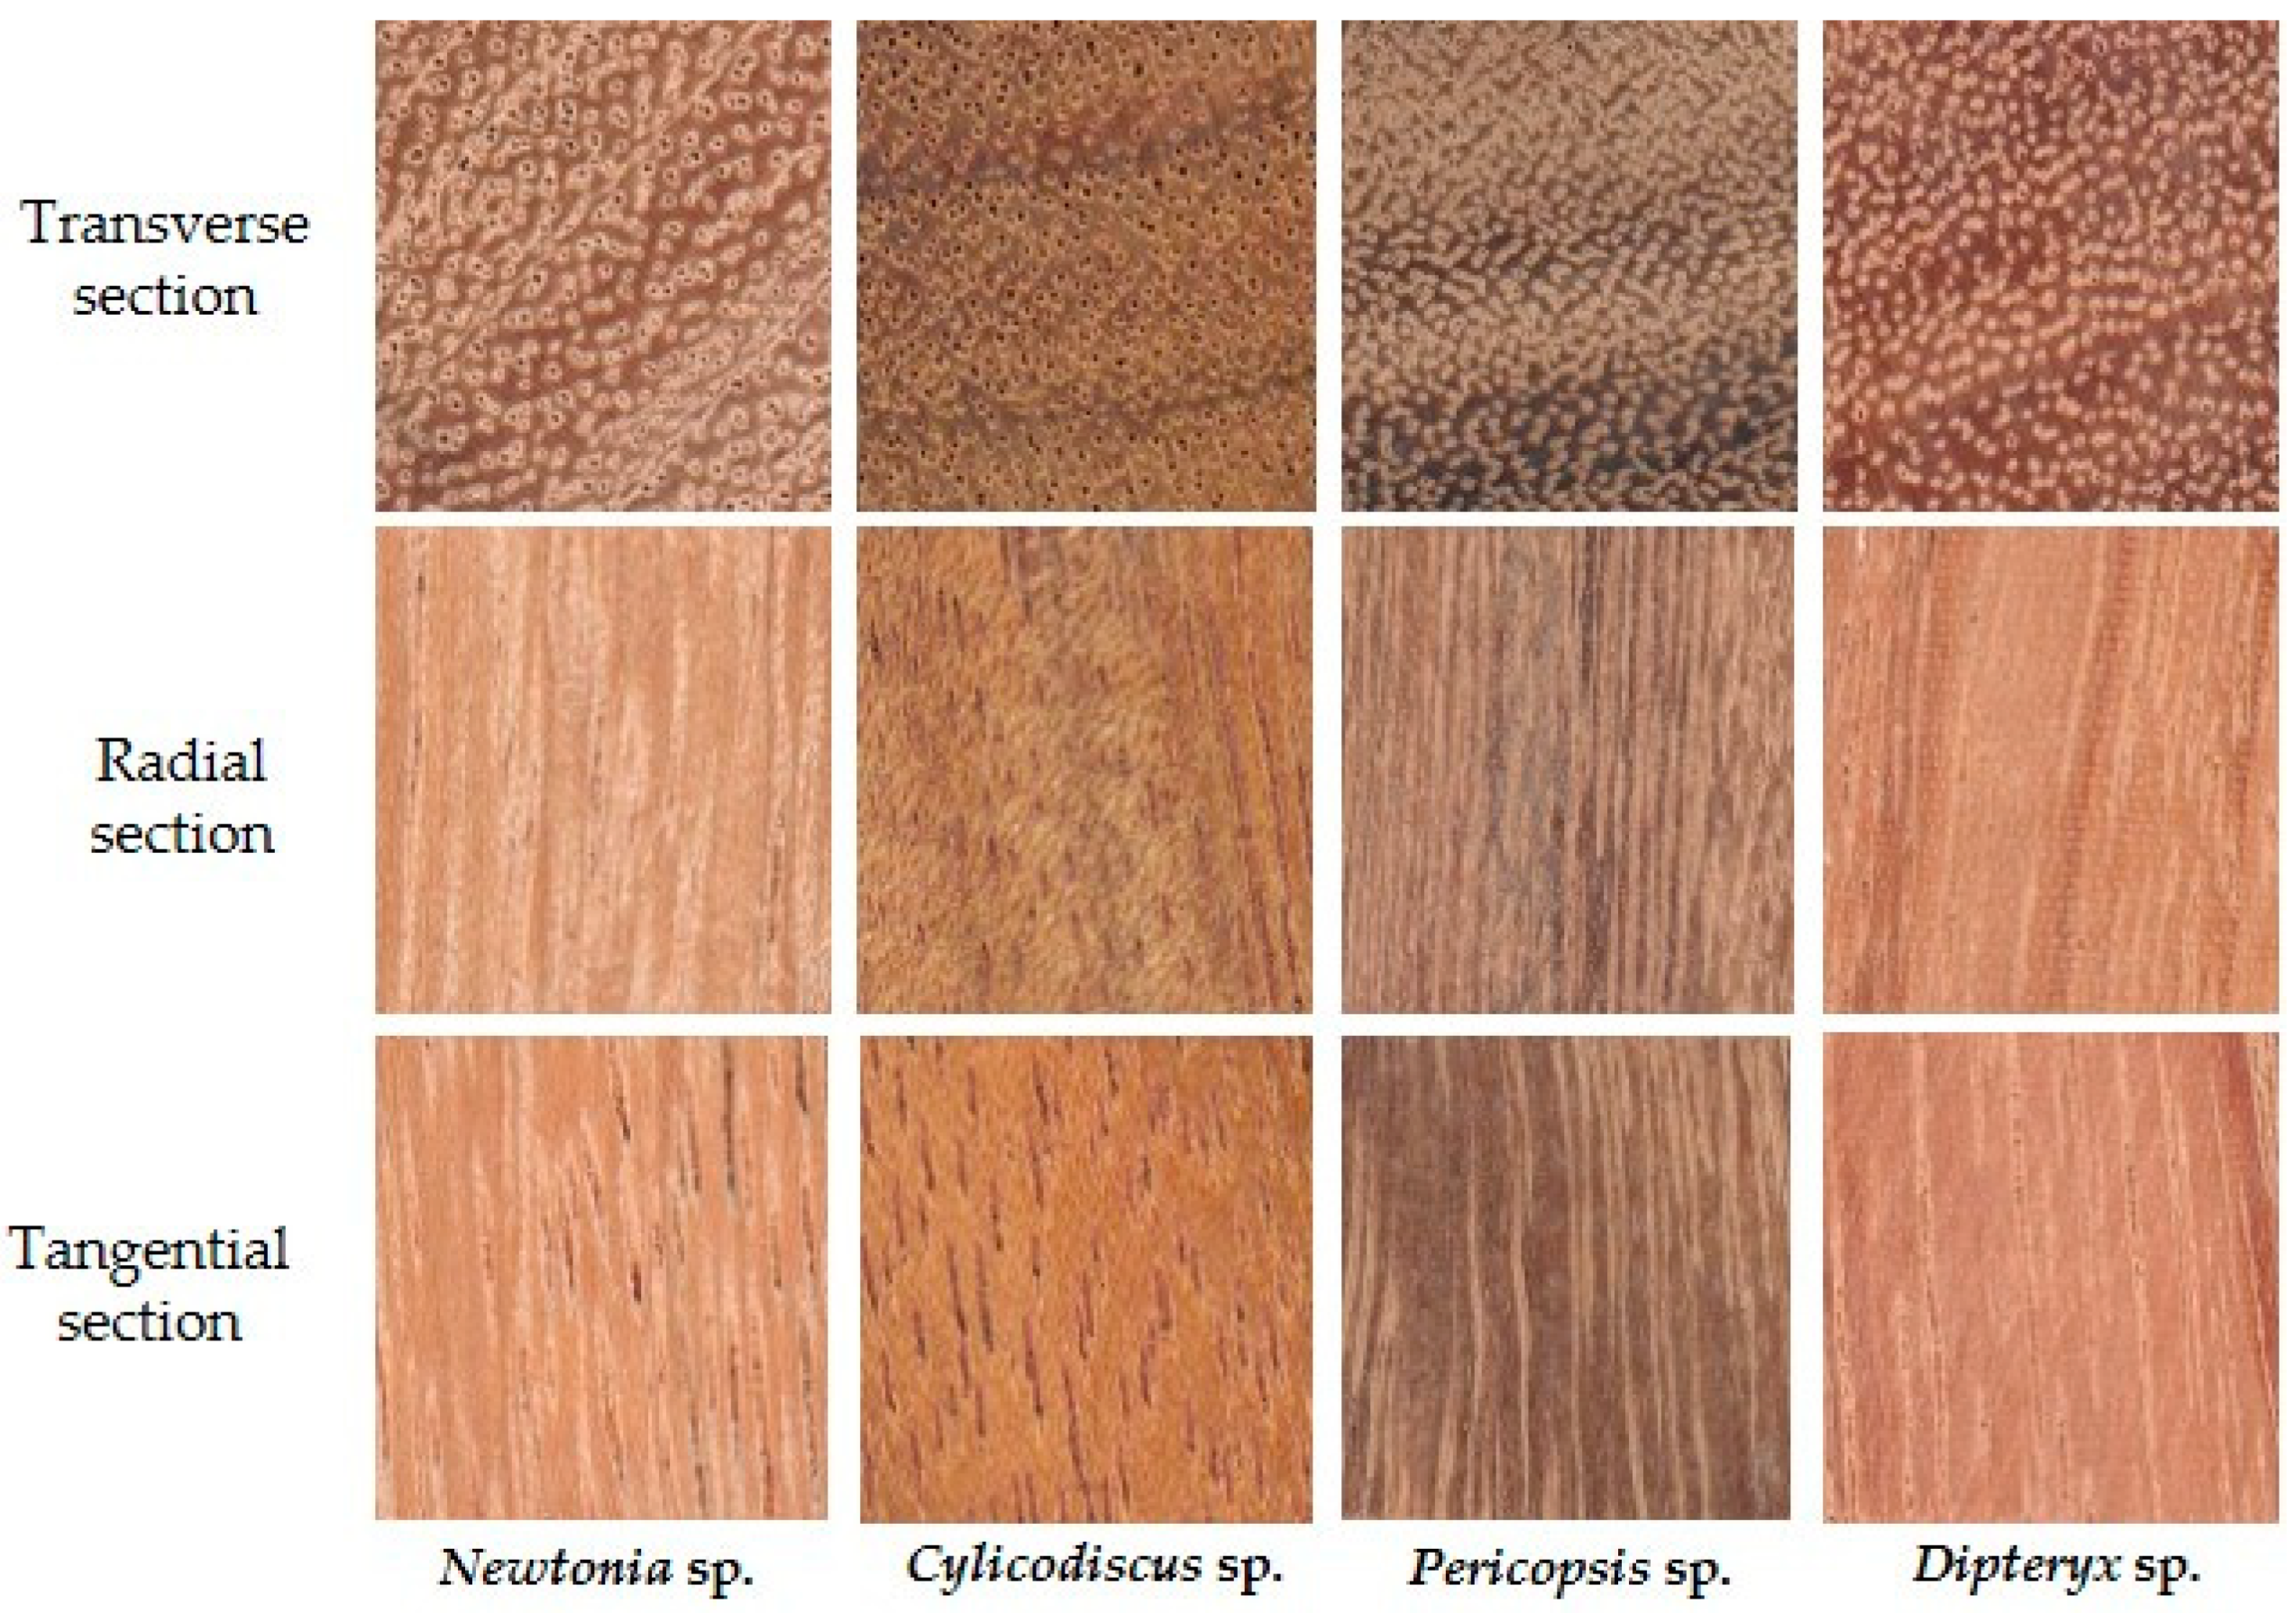
| 15 | Cylicodiscus sp. | Okan, Buemon, Denya, Edum | Cylicodiscus | Mimosaceae |
| 16 | Dracontomelon sp. | Dao, Kaililaki, Seng kuang, Lamio et al. | Dracontomelon | Anacardiaceae |
| 17 | Pericopsis sp. | Afrormosia, Assamela, Obang | Pericopsis | Fabaceae |
| 18 | Sterospermum sp. | Padretree | Sterospermum | Bignoniaceae |
| 19 | Erythrophleum sp. | Tali, Missanda, Sasswood, Alui et al. | Erythrophleum | Caesalpiniaceae |
| 20 | Planchonella sp. | White planchonella, Kete | Planchonella | Sapotaceae |
| 21 | Pterocarpus sp. 1 | Muniga, Nkula, African padauk | Pterocarpus | Fabaceae |
| 22 | Dipteryx sp. | Cumaru, Tonka bean, Almendrillo et al. | Dipteryx | Fabaceae |
| 23 | Dicorynia sp. | Angelique, Angelica, Basralocus et al. | Dicorynia | Caesalpiniaceae |
| 24 | Pterocarpus sp. 2 | Padauk, Ambila | Pterocarpus | Fabaceae |
| 25 | Apuleia sp. | Garapa, Pau mulato | Apuleia | Caesalpiniaceae |
| Timbers | ASM | Contrast | Correlation | Entropy |
|---|---|---|---|---|
| Maximum/Minimum | ||||
| Hymenaea sp. | 0.021037/0.018786 | 6.375925/5.188100 | 0.021853/0.014081 | 4.053281/3.985188 |
| Newtonia sp. | 0.020758/0.019108 | 6.693044/5.172383 | 0.021900/0.012249 | 4.024226/3.988707 |
| Xylia sp. | 0.019930/0.017489 | 7.674559/5.258430 | 0.021414/0.006082 | 4.095178/4.008789 |
| Intsia sp. | 0.020517/0.018185 | 7.118977/5.434322 | 0.020071/0.009208 | 4.072709/4.005149 |
| Manilkara sp. | 0.018000/0.017299 | 7.965371/7.124005 | 0.009527/0.004693 | 4.101009/4.076876 |
| Piptadeniastrum sp. | 0.021096/0.017824 | 7.796809/5.731049 | 0.017605/0.005607 | 4.087183/3.995309 |
| Gluta sp. | 0.019714/0.018141 | 7.004443/5.657133 | 0.018711/0.010394 | 4.074391/4.026978 |
| Acacia sp. | 0.021110/0.018087 | 7.053812/4.752345 | 0.024970/0.009276 | 4.076896/3.974451 |
| Koompassia sp. | 0.019957/0.018405 | 7.330459/5.964454 | 0.016465/0.008316 | 4.069544/4.021759 |
| Madhuca sp. | 0.018702/0.017667 | 8.342526/6.935808 | 0.010988/0.002389 | 4.090503/4.059368 |
| Timbers | Band 1 | Band 2 | Band 3 | GLCM | Band 1 + GLCM | Band 2 + GLCM | Band 3 + GLCM |
|---|---|---|---|---|---|---|---|
| Accuracy % | |||||||
| Hymenaea sp. | 92.86 | 100 | 100 | 100 | 100 | 100 | 100 |
| Newtonia sp. | 85.71 | 100 | 100 | 92.86 | 85.71 | 100 | 100 |
| Xylia sp. | 92.86 | 100 | 100 | 78.57 | 100 | 100 | 100 |
| Intsia sp. | 71.43 | 64.29 | 78.57 | 100 | 100 | 100 | 100 |
| Manilkara sp. | 100 | 92.86 | 100 | 100 | 100 | 100 | 100 |
| Piptadeniastrum sp. | 64.29 | 28.57 | 92.86 | 100 | 100 | 100 | 100 |
| Gluta sp. | 100 | 28.57 | 100 | 100 | 100 | 100 | 100 |
| Acacia sp. | 14.29 | 7.14 | 50 | 100 | 100 | 42.86 | 100 |
| Koompassia sp. | 85.71 | 100 | 100 | 85.71 | 92.86 | 100 | 100 |
| Madhuca sp. | 85.71 | 100 | 100 | 100 | 85.71 | 100 | 100 |
| Myroxylon balsamum | 78.57 | 64.29 | 100 | 100 | 100 | 100 | 100 |
| Tabebuia sp.1 | 71.43 | 92.86 | 100 | 100 | 100 | 100 | 100 |
| Tabebuia sp.2 | 64.29 | 71.43 | 78.57 | 50 | 100 | 100 | 92.86 |
| Swintonia sp. | 92.86 | 100 | 92.86 | 85.71 | 100 | 100 | 100 |
| Cylicodiscus sp. | 7.14 | 64.29 | 28.57 | 100 | 100 | 100 | 100 |
| Dracontomelon sp. | 64.29 | 78.57 | 85.71 | 100 | 92.86 | 100 | 100 |
| Pericopsis sp. | 64.29 | 78.57 | 92.86 | 57.14 | 100 | 100 | 100 |
| Sterospermum sp. | 42.86 | 100 | 100 | 100 | 100 | 100 | 100 |
| Erythrophleum sp. | 35.71 | 57.14 | 78.57 | 100 | 100 | 100 | 100 |
| Planchonella sp. | 71.43 | 78.57 | 100 | 100 | 100 | 92.86 | 100 |
| Pterocarpus sp.1 | 57.14 | 57.14 | 100 | 92.86 | 100 | 100 | 100 |
| Dipteryx sp. | 92.86 | 71.43 | 100 | 85.71 | 100 | 100 | 100 |
| Dicorynia sp. | 35.71 | 57.14 | 71.43 | 100 | 100 | 100 | 92.86 |
| Pterocarpus sp.2 | 0 | 7.14 | 28.57 | 100 | 85.71 | 100 | 100 |
| Apuleia sp. | 100 | 35.71 | 100 | 100 | 100 | 92.86 | 100 |
| Total Accuracy % | 66.86 | 69.43 | 87.14 | 93.14 | 97.71 | 97.14 | 99.43 |
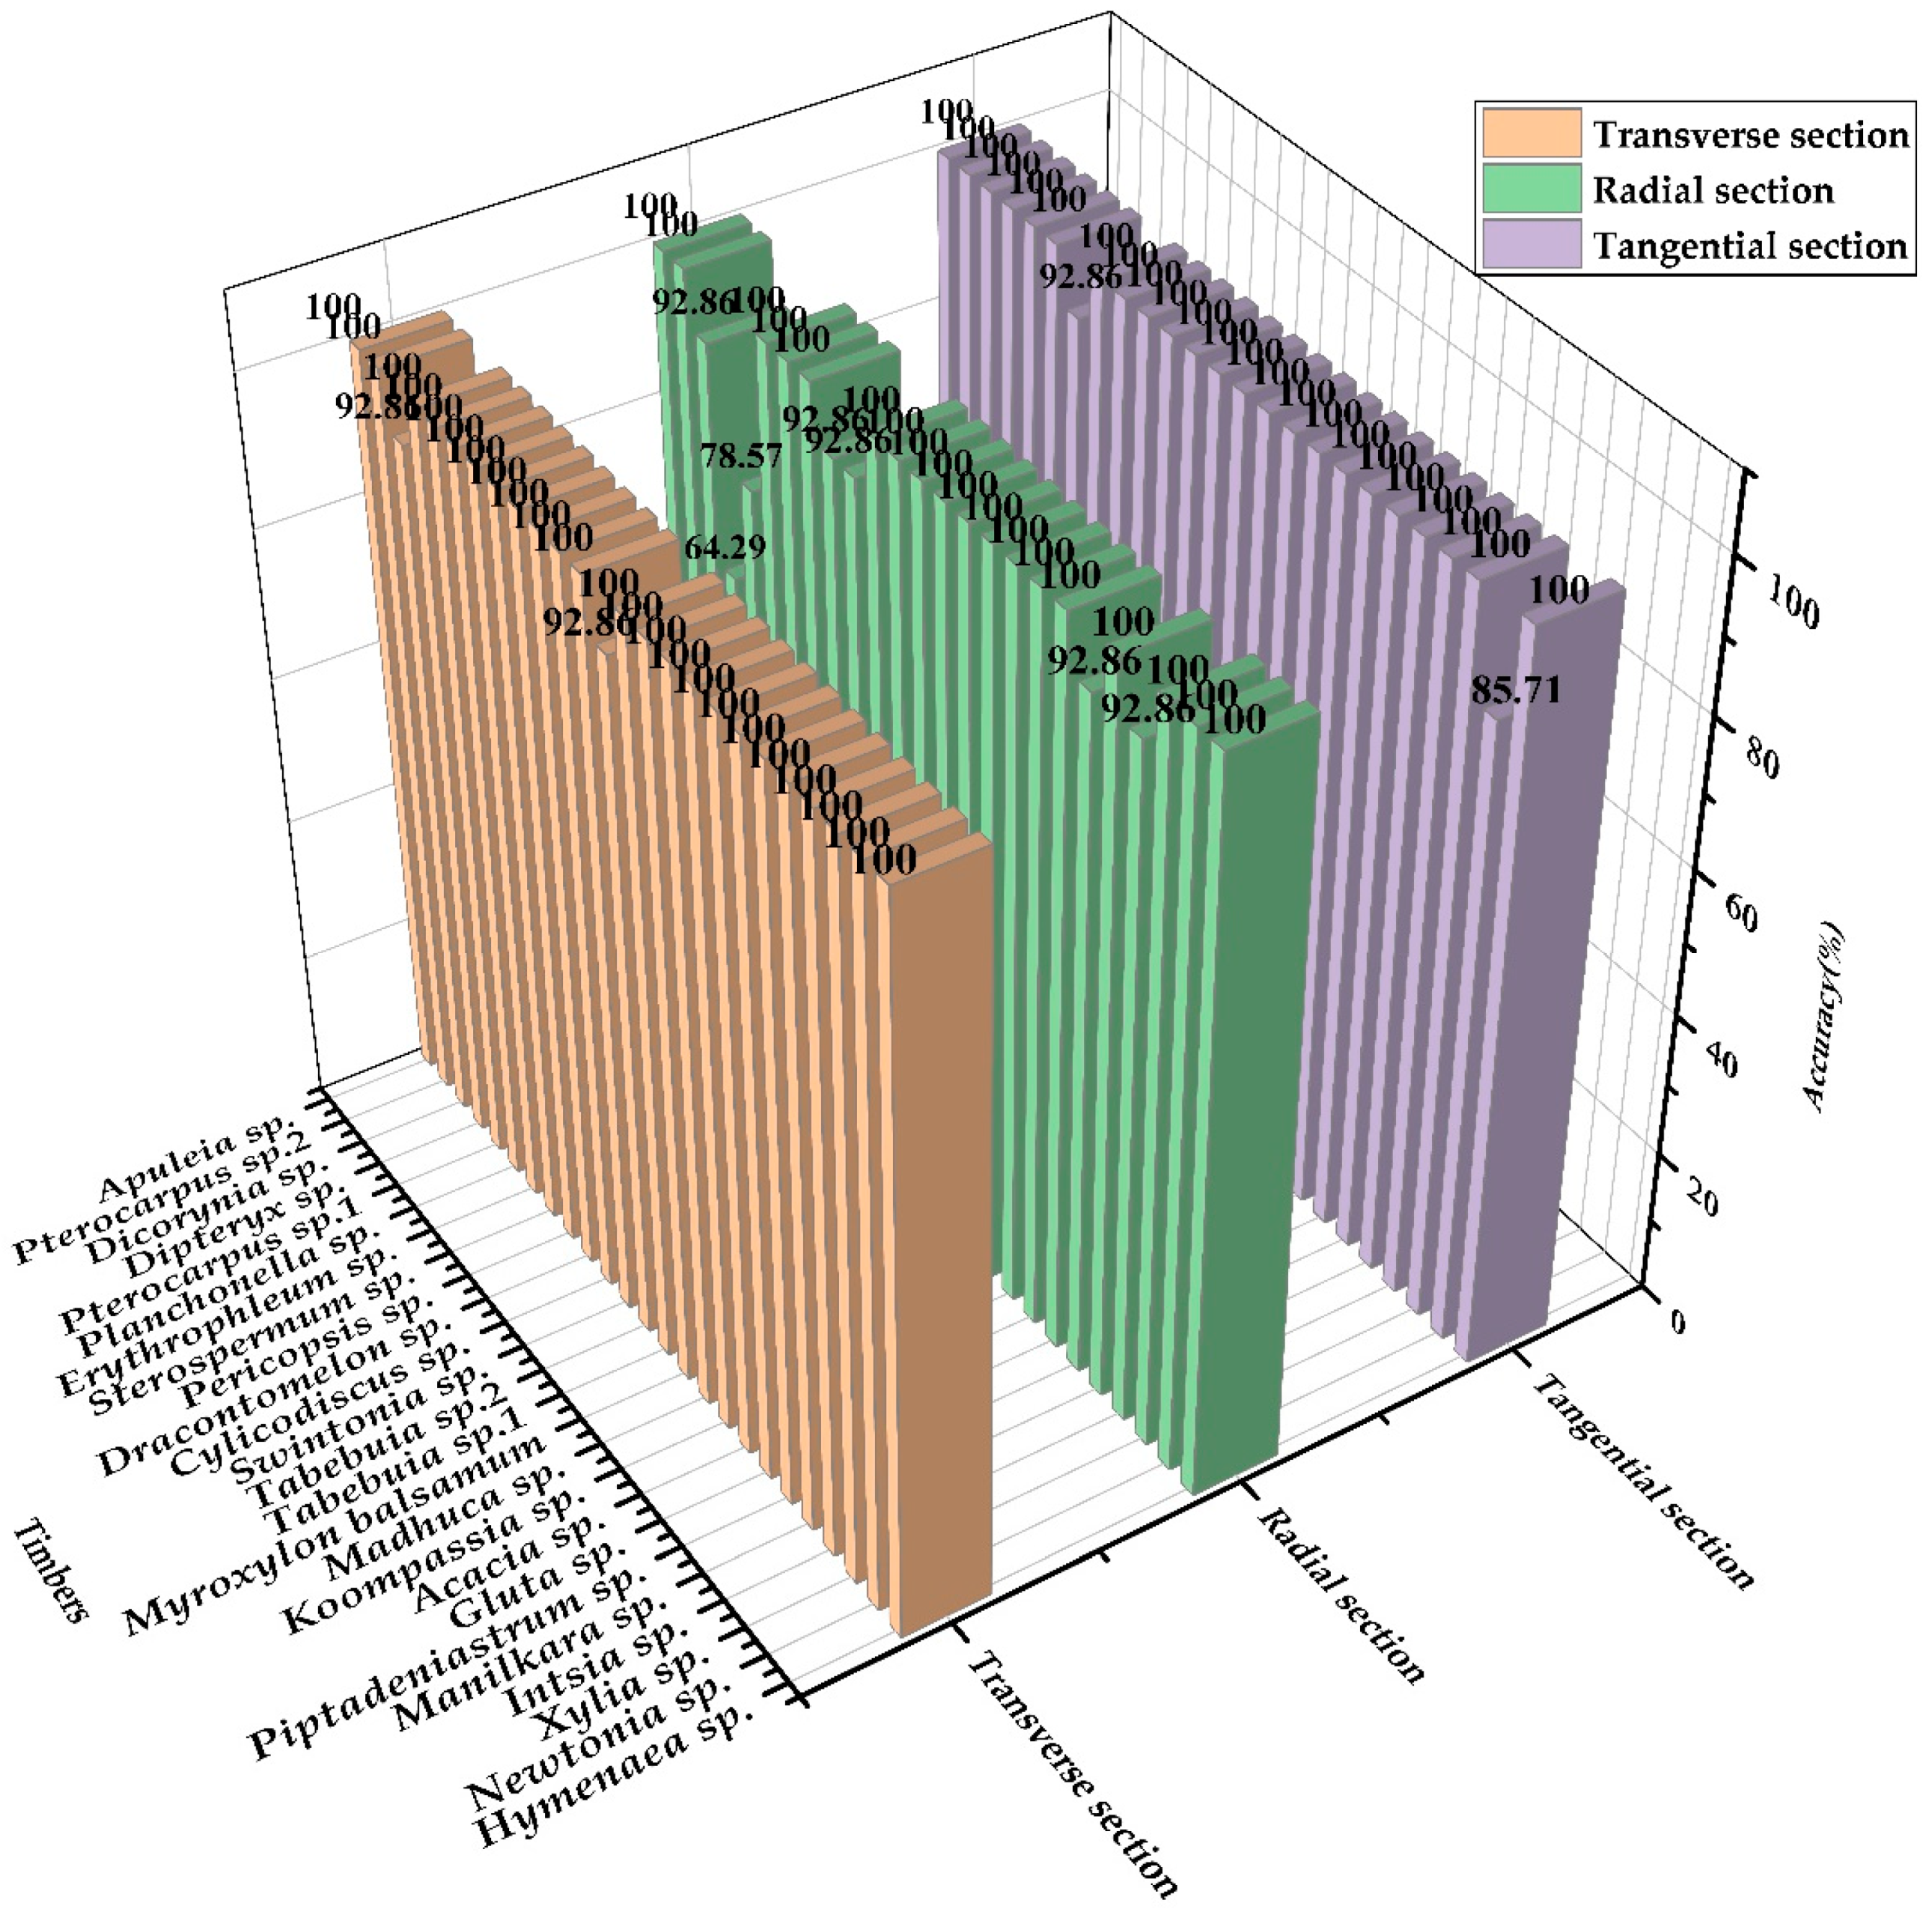
| Timbers | Sections | ASM | Contrast | Correlation | Entropy |
|---|---|---|---|---|---|
| Newtonia sp. | Transverse | 0.020548 | 5.590868 | 0.018861 | 4.000332 |
| Radial | 0.020928 | 5.338049 | 0.021251 | 3.978335 | |
| Tangential | 0.020488 | 6.352638 | 0.015480 | 3.996089 | |
| Cylicodiscus sp. | Transverse | 0.018336 | 7.264176 | 0.008220 | 4.070662 |
| Radial | 0.018370 | 6.779222 | 0.012461 | 4.064437 | |
| Tangential | 0.018946 | 7.023098 | 0.010805 | 4.046937 | |
| Pericopsis sp. | Transverse | 0.020827 | 5.156918 | 0.021766 | 3.978225 |
| Radial | 0.019921 | 6.408489 | 0.014959 | 4.012705 | |
| Tangential | 0.020725 | 5.080242 | 0.02263 | 3.979152 | |
| Dipteryx sp. | Transverse | 0.019977 | 5.614030 | 0.018394 | 4.011051 |
| Radial | 0.020440 | 5.587884 | 0.019364 | 3.992565 | |
| Tangential | 0.020233 | 6.059864 | 0.016631 | 4.002626 |
| Timbers | I | II | III | IV | I | II | III | IV |
|---|---|---|---|---|---|---|---|---|
| 780–1100 nm | 1100–2300 nm | |||||||
| Accuracy % | ||||||||
| Hymenaea sp. | 100 | 100 | 100 | 100 | 100 | 100 | 100 | 100 |
| Newtonia sp. | 85.71 | 85.71 | 85.71 | 85.71 | 100 | 100 | 100 | 100 |
| Xylia sp. | 100 | 100 | 100 | 100 | 100 | 100 | 100 | 100 |
| Intsia sp. | 100 | 100 | 100 | 100 | 100 | 100 | 100 | 100 |
| Manilkara sp. | 100 | 100 | 100 | 100 | 100 | 100 | 100 | 100 |
| Piptadeniastrum sp. | 100 | 100 | 100 | 100 | 100 | 100 | 100 | 100 |
| Gluta sp. | 100 | 100 | 100 | 100 | 100 | 100 | 100 | 100 |
| Acacia sp. | 100 | 92.86 | 100 | 92.86 | 100 | 100 | 100 | 100 |
| Koompassia sp. | 100 | 100 | 100 | 100 | 100 | 100 | 100 | 100 |
| Madhuca sp | 100 | 100 | 100 | 100 | 100 | 100 | 100 | 100 |
| Myroxylon balsamum | 100 | 100 | 100 | 100 | 100 | 100 | 100 | 100 |
| Tabebuia sp. 1 | 100 | 100 | 100 | 100 | 100 | 100 | 100 | 100 |
| Tabebuia sp. 2 | 100 | 100 | 100 | 100 | 100 | 100 | 100 | 100 |
| Swintonia sp. | 100 | 100 | 100 | 100 | 100 | 100 | 100 | 100 |
| Cylicodiscus sp. | 92.86 | 100 | 100 | 100 | 100 | 100 | 100 | 100 |
| Dracontomelon sp. | 100 | 78.57 | 100 | 78.57 | 100 | 100 | 100 | 100 |
| Pericopsis sp. | 100 | 100 | 100 | 100 | 100 | 100 | 100 | 100 |
| Sterospermum sp. | 100 | 85.71 | 100 | 85.71 | 100 | 100 | 100 | 100 |
| Erythrophleum sp. | 100 | 100 | 100 | 100 | 100 | 100 | 100 | 92.86 |
| Planchonella sp. | 100 | 100 | 100 | 100 | 100 | 100 | 100 | 100 |
| Pterocarpus sp.1 | 85.71 | 85.71 | 100 | 85.71 | 100 | 100 | 100 | 100 |
| Dipteryx sp. | 100 | 100 | 100 | 100 | 100 | 100 | 100 | 100 |
| Dicorynia sp. | 92.86 | 100 | 100 | 100 | 100 | 100 | 100 | 100 |
| Pterocarpus sp. 2 | 100 | 100 | 100 | 100 | 100 | 100 | 100 | 100 |
| Apuleia sp. | 100 | 100 | 100 | 100 | 100 | 100 | 100 | 100 |
| Total Accuracy % | 98.29 | 97.14 | 99.43 | 97.14 | 100 | 100 | 100 | 99.71 |
| SVM Model | NIR Band (nm) | GLCM Features | Feature Dimension | Accuracy (%) |
|---|---|---|---|---|
| Model 1 | 780–1100 | None | 6 | 96 |
| Model 2 | 780–1100 | ASM | 7 | 96 |
| Model 3 | 780–1100 | Con | 7 | 98.29 |
| Model 4 | 780–1100 | Cor | 7 | 96 |
| Model 5 | 780–1100 | Ent | 7 | 99.14 |
| Model 6 | 780–1100 | ASM + Con | 8 | 98.29 |
| Model 7 | 780–1100 | ASM + Cor | 8 | 96.57 |
| Model 8 | 780–1100 | ASM + Con + Cor | 9 | 98.29 |
| Model 9 | 780-1100 | ASM + Con + Cor + Ent | 10 | 99.43 |
Publisher’s Note: MDPI stays neutral with regard to jurisdictional claims in published maps and institutional affiliations. |
© 2021 by the authors. Licensee MDPI, Basel, Switzerland. This article is an open access article distributed under the terms and conditions of the Creative Commons Attribution (CC BY) license (https://creativecommons.org/licenses/by/4.0/).
Share and Cite
Pan, X.; Li, K.; Chen, Z.; Yang, Z. Identifying Wood Based on Near-Infrared Spectra and Four Gray-Level Co-Occurrence Matrix Texture Features. Forests 2021, 12, 1527. https://doi.org/10.3390/f12111527
Pan X, Li K, Chen Z, Yang Z. Identifying Wood Based on Near-Infrared Spectra and Four Gray-Level Co-Occurrence Matrix Texture Features. Forests. 2021; 12(11):1527. https://doi.org/10.3390/f12111527
Chicago/Turabian StylePan, Xi, Kang Li, Zhangjing Chen, and Zhong Yang. 2021. "Identifying Wood Based on Near-Infrared Spectra and Four Gray-Level Co-Occurrence Matrix Texture Features" Forests 12, no. 11: 1527. https://doi.org/10.3390/f12111527
APA StylePan, X., Li, K., Chen, Z., & Yang, Z. (2021). Identifying Wood Based on Near-Infrared Spectra and Four Gray-Level Co-Occurrence Matrix Texture Features. Forests, 12(11), 1527. https://doi.org/10.3390/f12111527