
Modeling Climatic Influences on Three Parasitoids of Low-Density Spruce Budworm Populations. Part 3: Actia interrupta (Diptera: Tachinidae)


Abstract
:1. Introduction
2. Materials and Methods
2.1. Experimental Data
2.2. Analysis
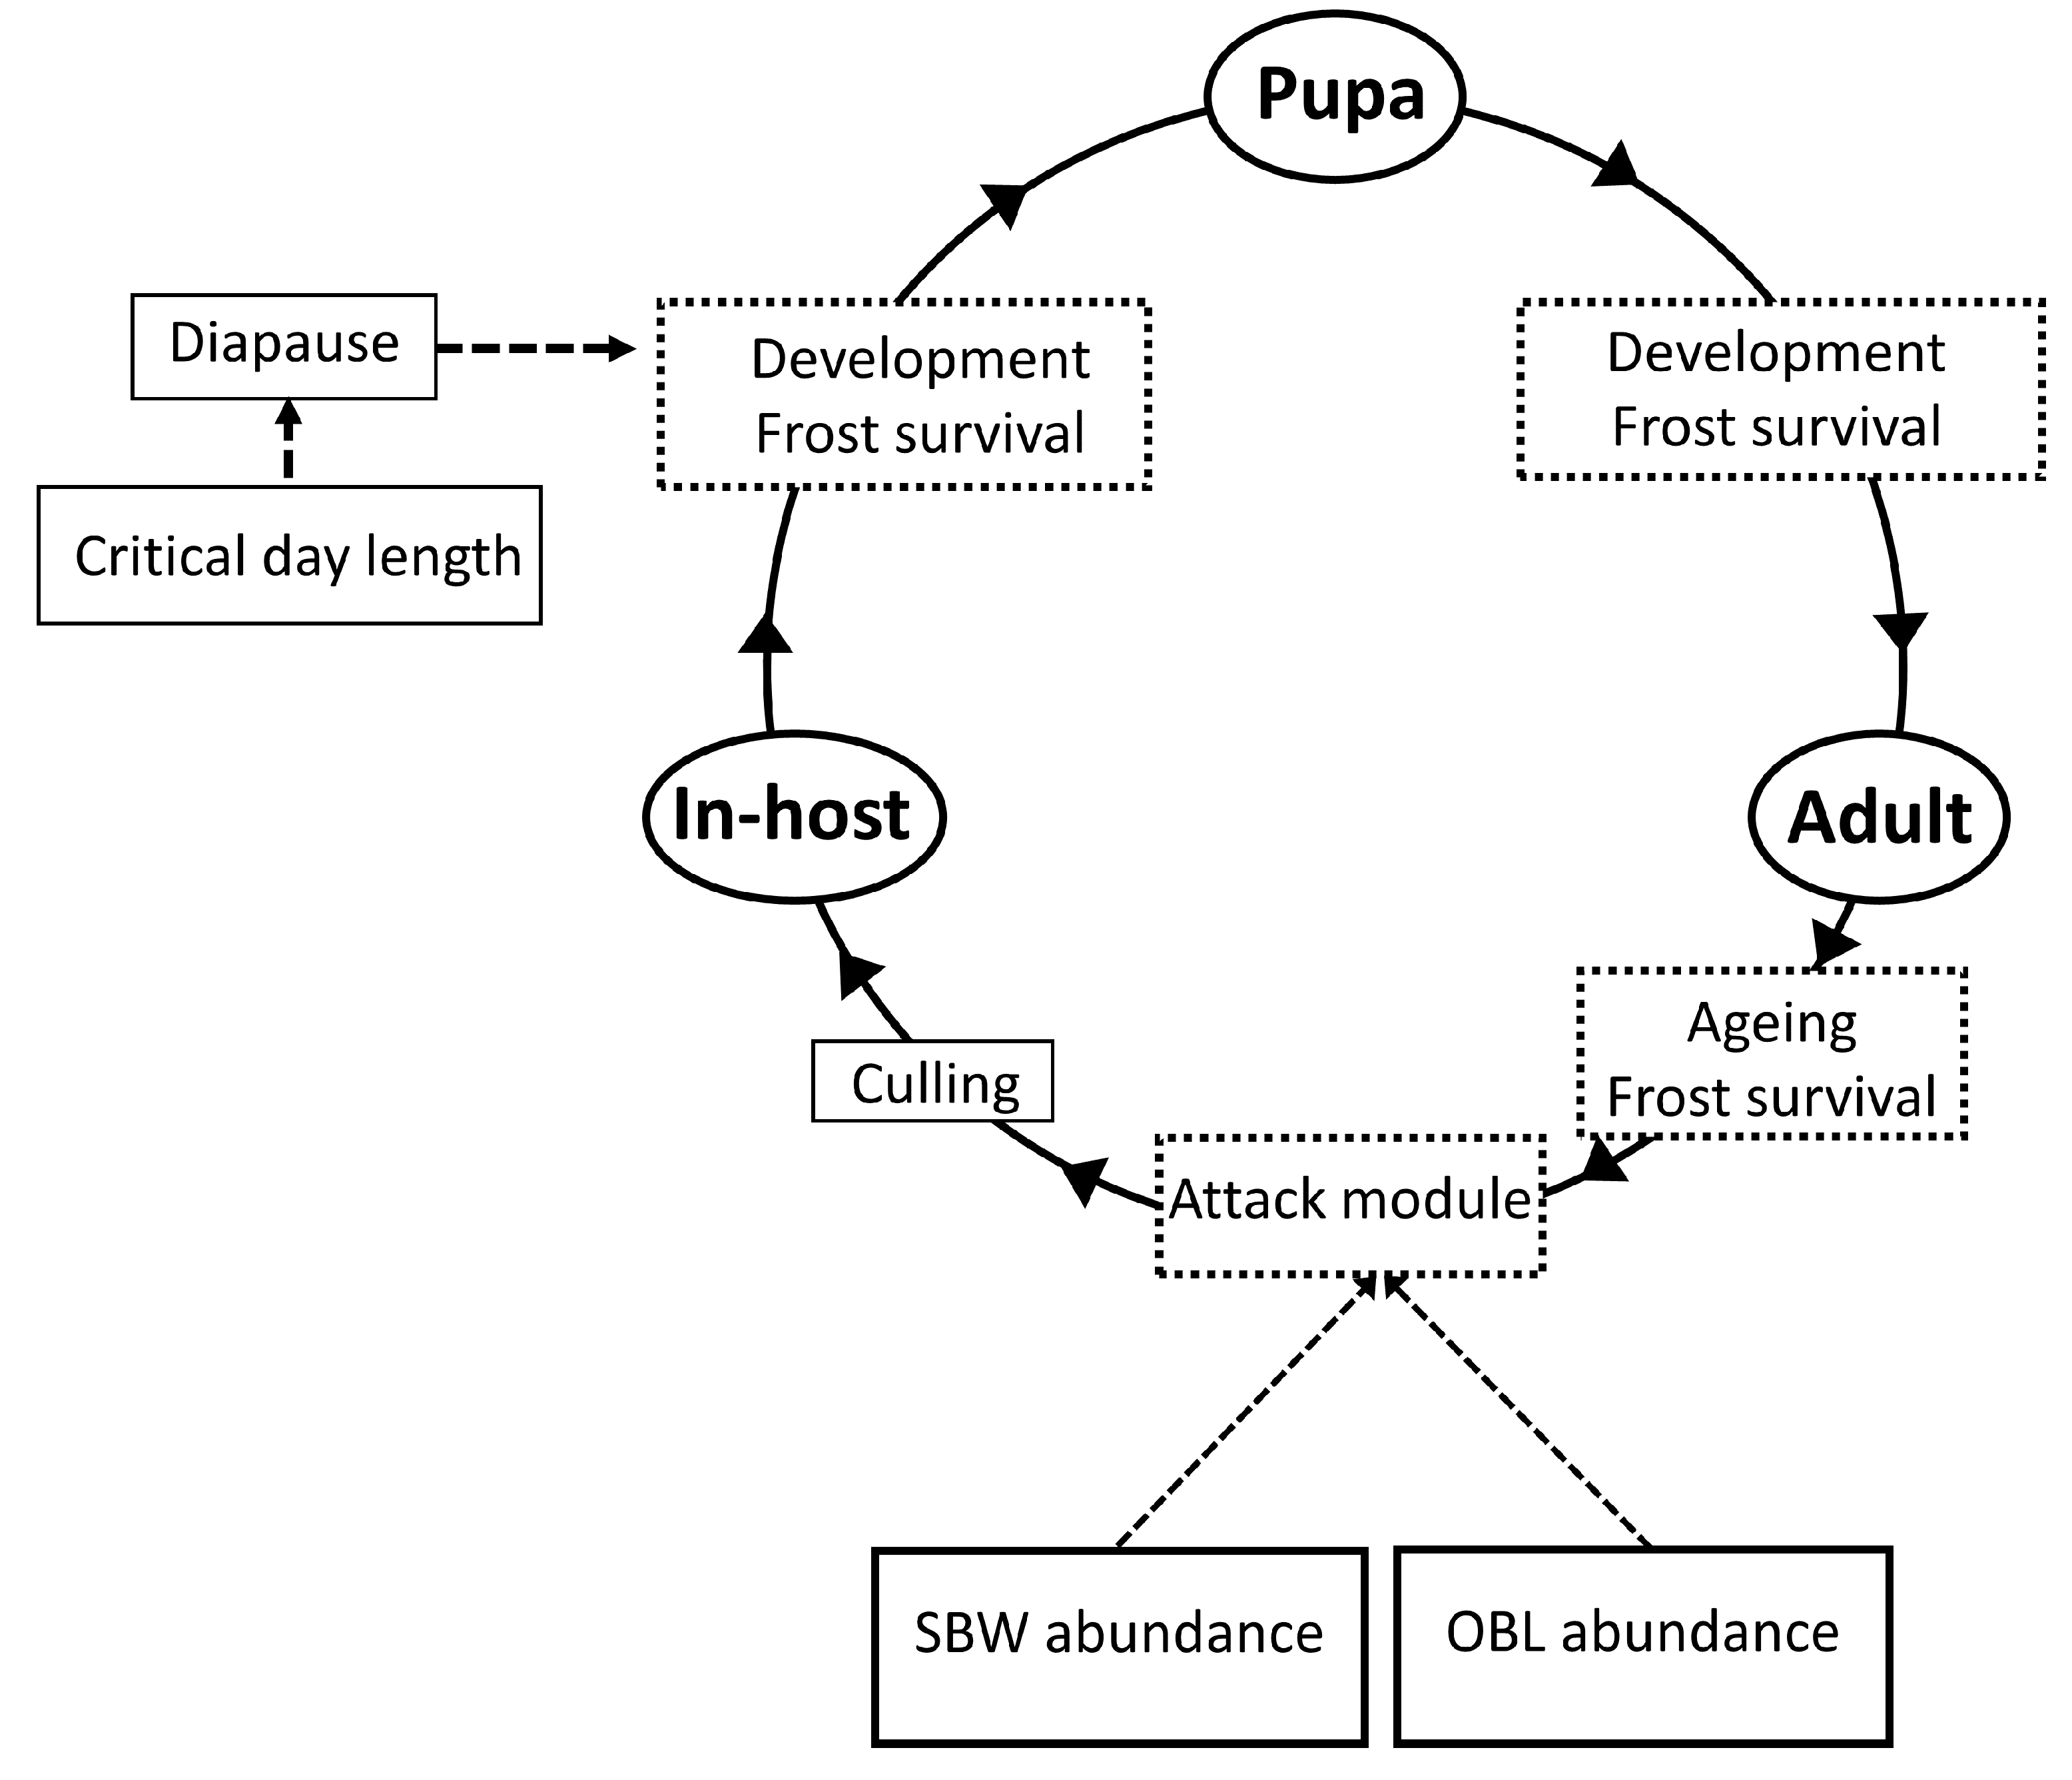
2.3. Model Description
2.4. Simulations
3. Results
3.1. Model Fitting
3.2. Comparison of Model Output with Field Observations
3.3. Predicted Seasonality in Armagh and at Epaule
3.4. Spatial Simulation
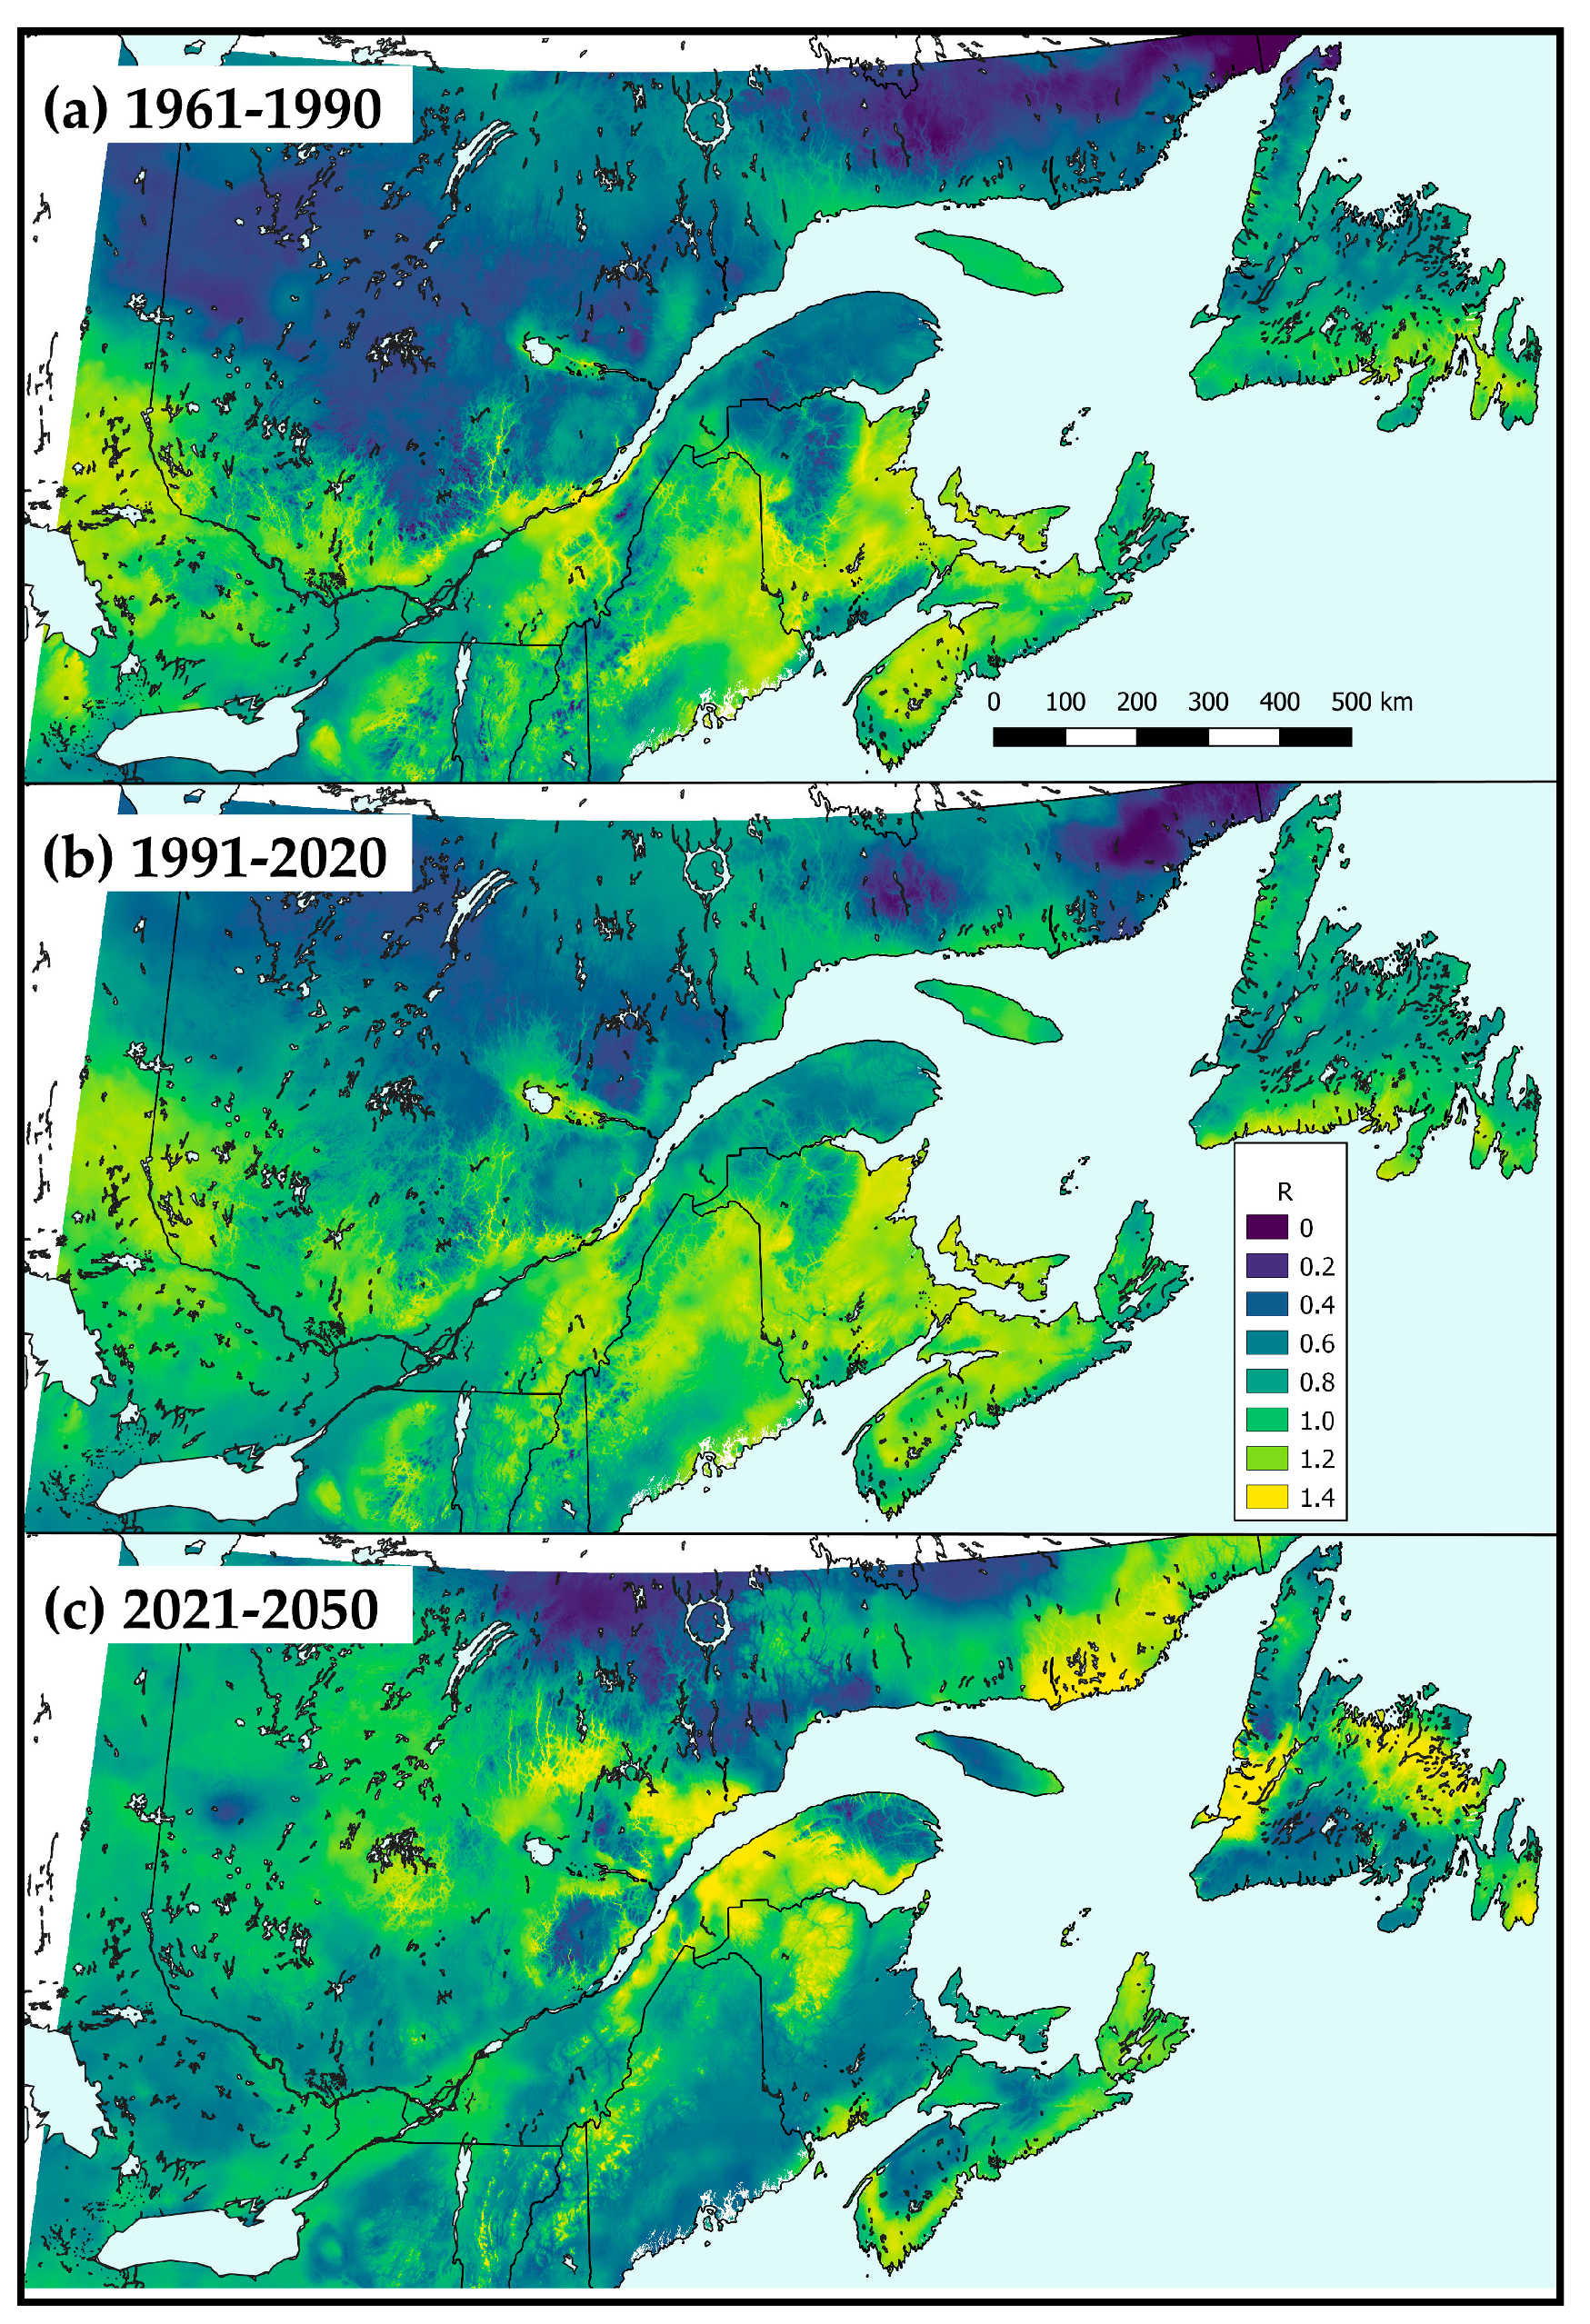
3.4.1. Mapping
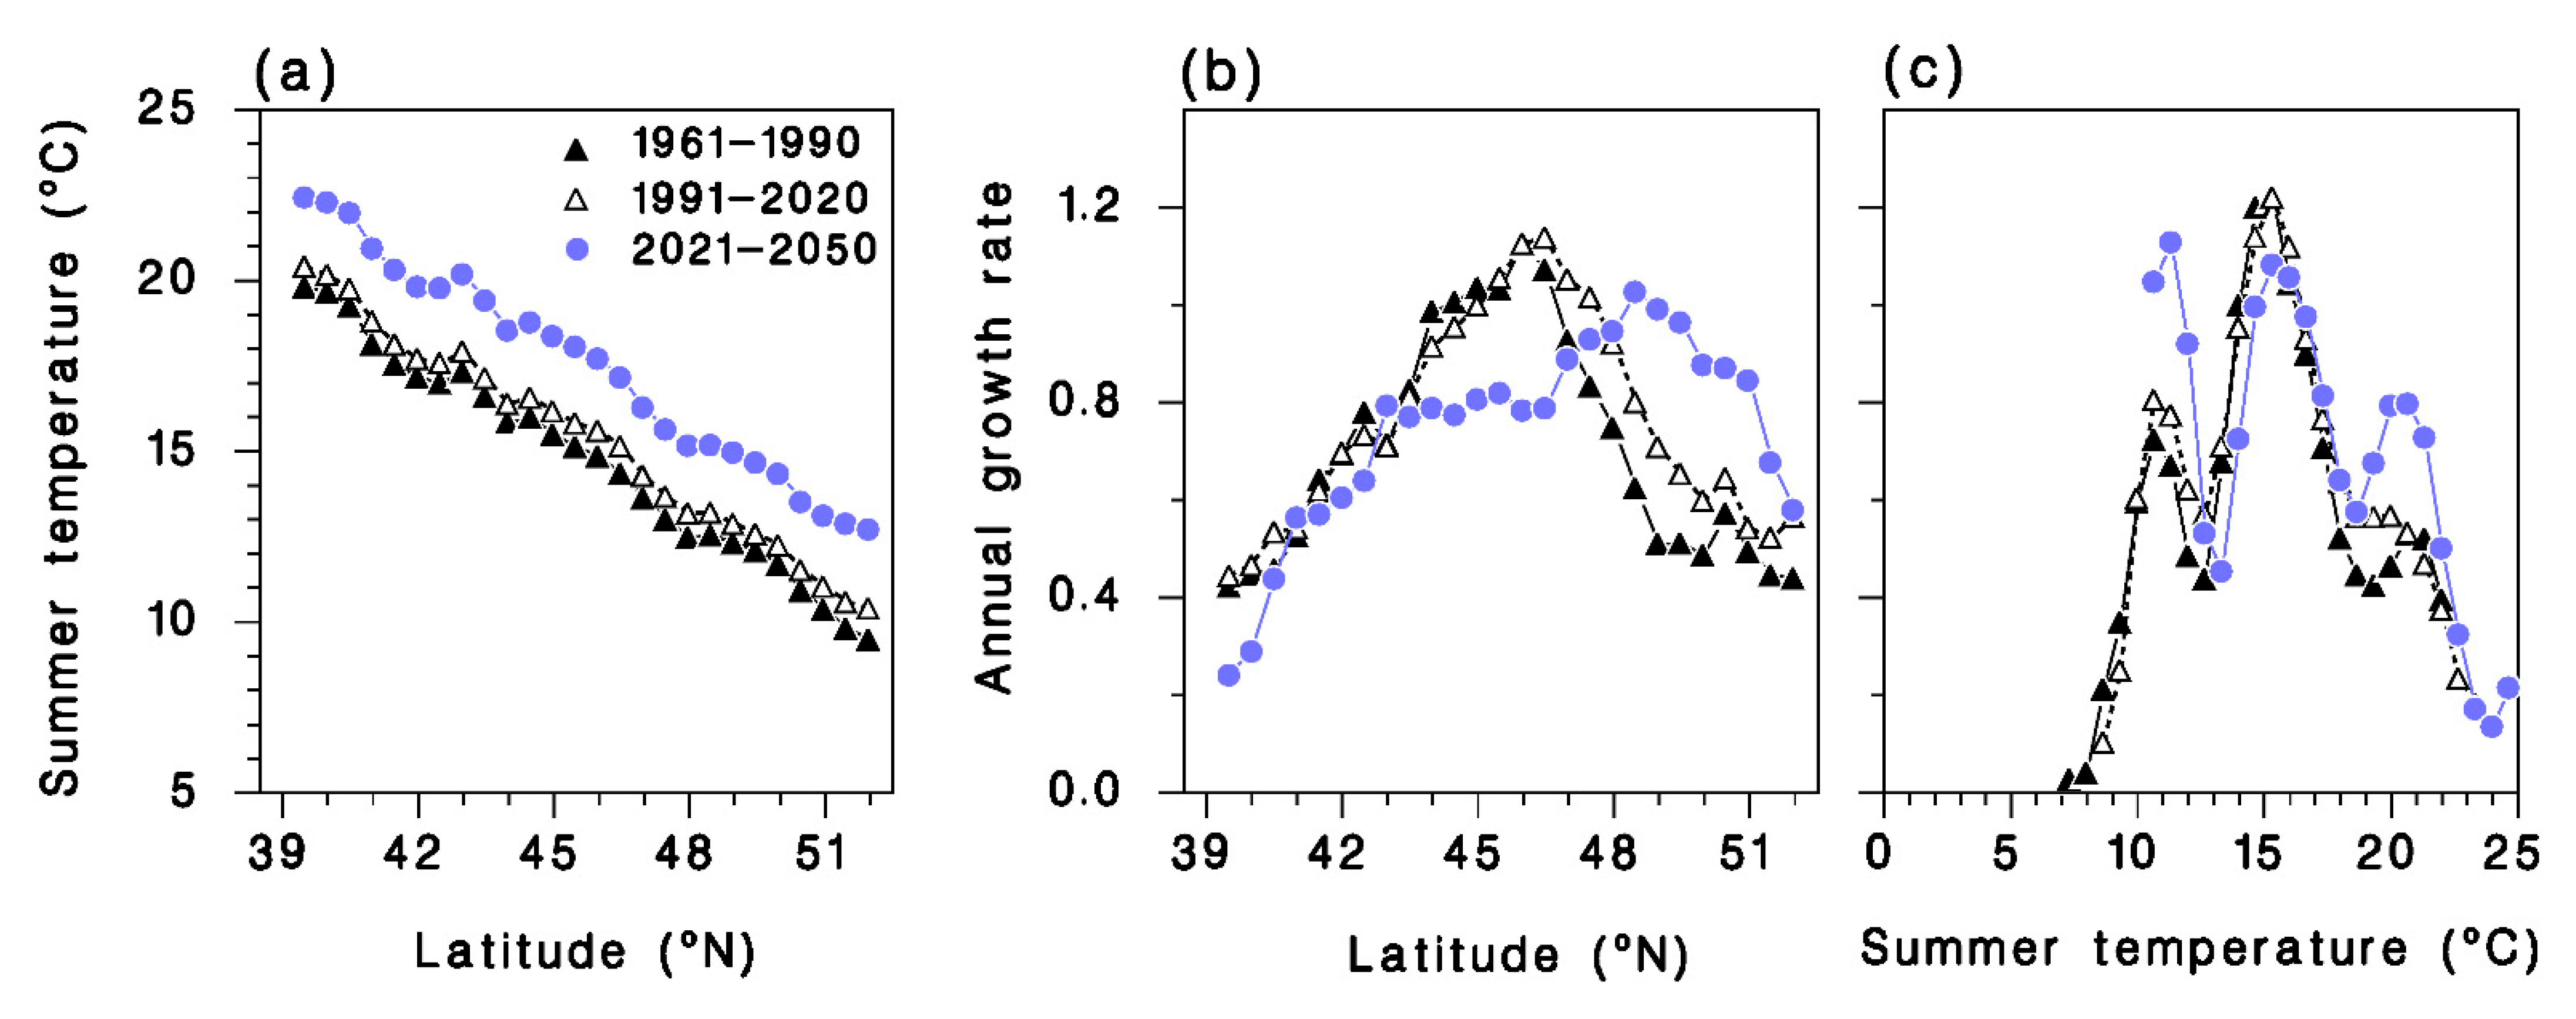
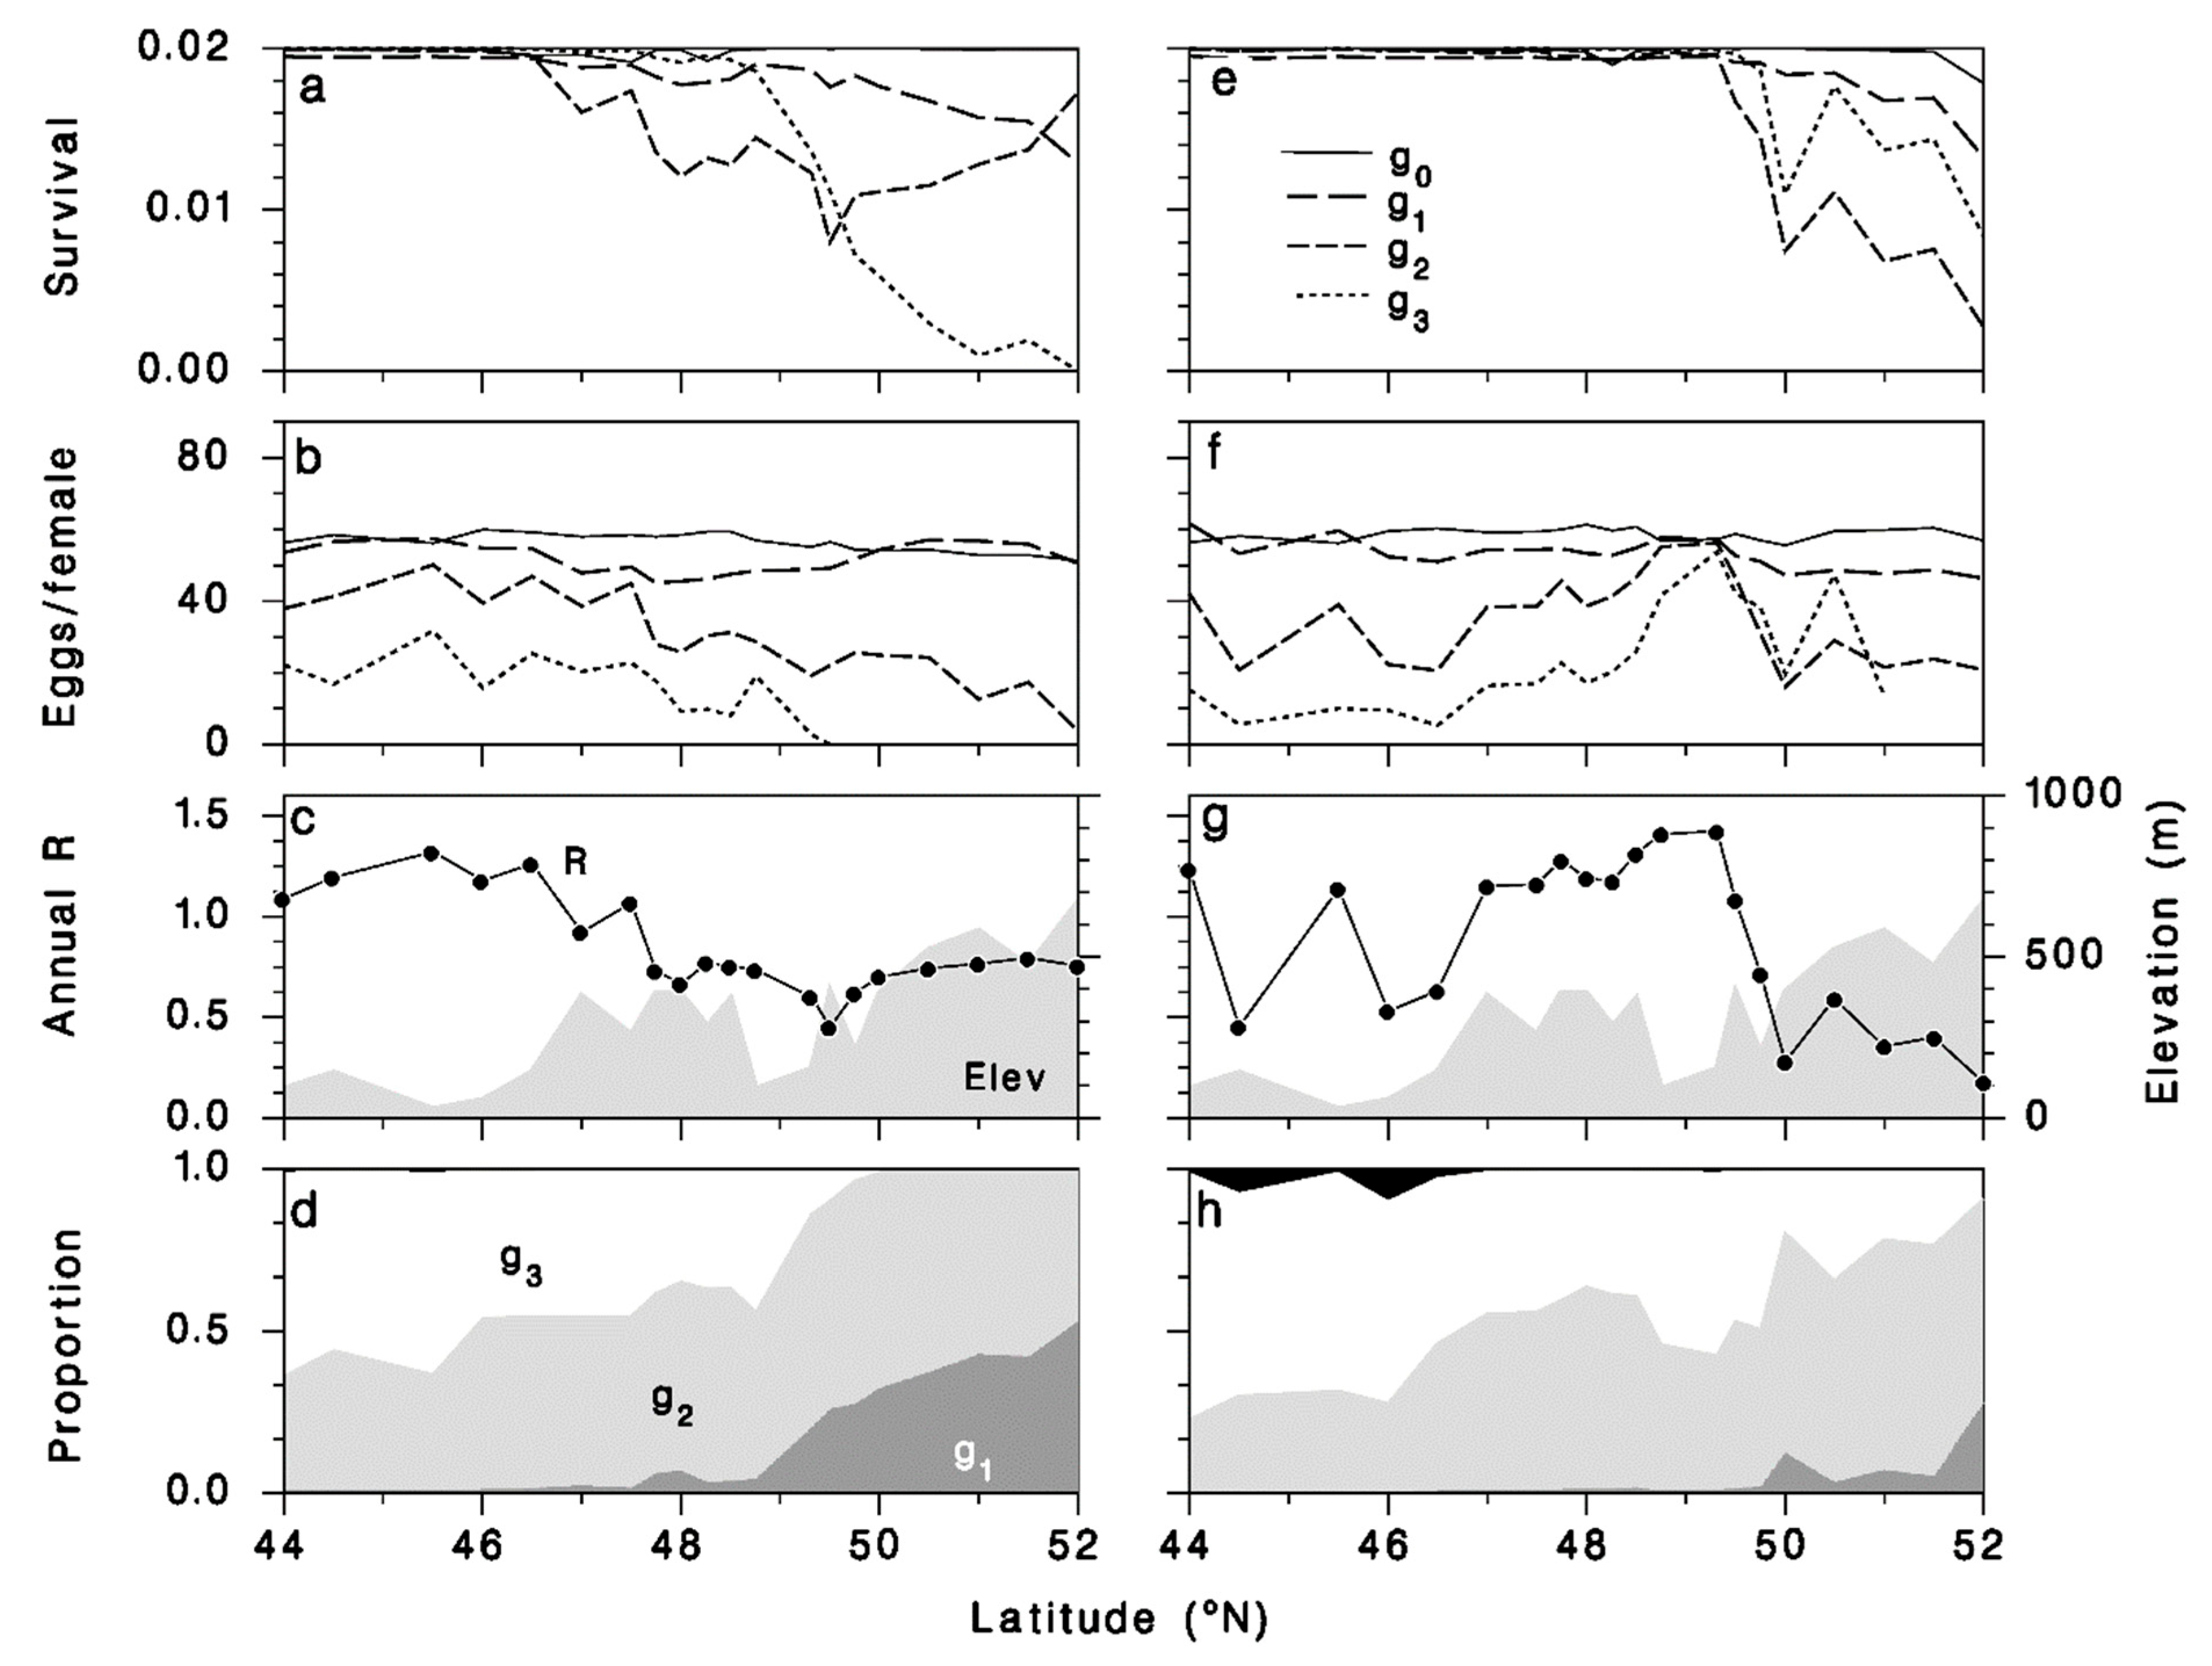
3.4.2. Transect
4. Discussion
5. Conclusions
Author Contributions
Funding
Data Availability Statement
Acknowledgments
Conflicts of Interest
References
- Malhi, Y.; Franklin, J.; Seddon, N.; Solan, M.; Turner, M.G.; Field, C.B.; Knowlton, N. Climate change and ecosystems: Threats, opportunities and solutions. Philos. Trans. R. Soc. B Biol. Sci. 2020, 375, 20190104. [Google Scholar] [CrossRef] [Green Version]
- Chidawanyika, F.; Mudavanhu, P.; Nyamukondiwa, C. Global Climate Change as a Driver of Bottom-Up and Top-Down Factors in Agricultural Landscapes and the Fate of Host-Parasitoid Interactions. Front. Ecol. Evol. 2019, 7. [Google Scholar] [CrossRef] [Green Version]
- Bouyer, J.; Cordier, S.; Levallois, P. Épidémiologie. In Environnement et Santé Publique—Fondements et Pratiques; Guérin, M., Gosselin, P., Cordier, S., Viau, C., Quénel, P., Dewailly, É., Eds.; Edisem: Acton Vale, QC, Canada, 2003; pp. 89–119. Available online: https://espum.umontreal.ca/lespum/departement-de-sante-environnementale-et-sante-au-travail/production-scientifique/livres/environnement-et-sante-publique-fondements-et-pratiques/ (accessed on 21 October 2021).
- Bradshaw, C.J.A.; Leroy, B.; Bellard, C.; Roiz, D.; Albert, C.; Fournier, A.; Barbet-Massin, M.; Salles, J.-M.; Simard, F.; Courchamp, F. Massive yet grossly underestimated global costs of invasive insects. Nat. Commun. 2016, 7, 12986. [Google Scholar] [CrossRef]
- Logan, J.A.; Régnière, J.; Powell, J.A. Assessing the impacts of global climate warming on forest pest dynamics. Front. Ecol. Environ. 2003, 1, 130–137. [Google Scholar] [CrossRef]
- Régnière, J.; Powell, J.; Bentz, B.; Nealis, V. Effects of temperature on development, survival and reproduction of insects: Experimental design, data analysis and modeling. J. Insect Physiol. 2012, 58, 634–647. [Google Scholar] [CrossRef] [PubMed]
- McManis, A.E.; Powell, J.A.; Bentz, B.J. Developmental parameters of a southern mountain pine beetle (Coleoptera: Curculionidae) population reveal potential source of latitudinal differences in generation time. Can. Entomol. 2018, 151, 1–15. [Google Scholar] [CrossRef] [Green Version]
- Chuine, I.; Régnière, J. Process-Based Models of Phenology for Plants and Animals. Annu. Rev. Ecol. Evol. Syst. 2017, 48, 159–182. [Google Scholar] [CrossRef]
- Schmitz, O.J.; Barton, B.T. Climate change effects on behavioral and physiological ecology of predator–prey interactions: Implications for conservation biological control. Biol. Control. 2014, 75, 87–96. [Google Scholar] [CrossRef]
- Gehman, A.-L.M.; Hall, R.J.; Byers, J. Host and parasite thermal ecology jointly determine the effect of climate warming on epidemic dynamics. Proc. Natl. Acad. Sci. USA 2018, 115, 744–749. [Google Scholar] [CrossRef] [Green Version]
- Laws, A.N. Climate change effects on predator–prey interactions. Curr. Opin. Insect Sci. 2017, 23, 28–34. [Google Scholar] [CrossRef]
- Daugaard, U.; Petchey, O.L.; Pennekamp, F. Warming can destabilize predator–prey interactions by shifting the functional response from Type III to Type II. J. Anim. Ecol. 2019, 88, 1575–1586. [Google Scholar] [CrossRef]
- Johnston, A.S.A.; Boyd, R.J.; Watson, J.W.; Paul, A.; Evans, L.C.; Gardner, E.L.; Boult, V.L. Predicting population responses to environmental change from individual-level mechanisms: Towards a standardized mechanistic approach. Proc. R. Soc. B Boil. Sci. 2019, 286, 20191916. [Google Scholar] [CrossRef] [Green Version]
- Johns, R.; Bowden, J.; Carleton, R.D.; Cooke, B.J.; Edwards, S.; Emilson, E.; James, P.M.A.; Kneeshaw, D.; MacLean, D.A.; Martel, V.; et al. A conceptual framework for the spruce budworm early intervention strategy: Can outbreaks be stopped? Forests 2019, 10, 910. [Google Scholar] [CrossRef] [Green Version]
- Boulanger, Y.; Arseneault, D. Spruce budworm outbreaks in eastern Quebec over the last 450 years. Can. J. For. Res. 2004, 34, 1035–1043. [Google Scholar] [CrossRef]
- Boulanger, Y.; Arseneault, D.; Morin, H.; Jardon, Y.; Bertrand, P.; Dagneau, C. Dendrochronological reconstruction of spruce budworm (Choristoneura fumiferana) outbreaks in southern Quebec for the last 400 years1This article is one of a selection of papers from the 7th International Conference on Disturbance Dynamics in Boreal Forests. Can. J. For. Res. 2012, 42, 1264–1276. [Google Scholar] [CrossRef]
- Eveleigh, E.S.; McCann, K.S.; McCarthy, P.C.; Pollock, S.J.; Lucarotti, C.J.; Morin, B.; McDougall, G.A.; Strongman, D.B.; Huber, J.T.; Umbanhowar, J.; et al. Fluctuations in density of an outbreak species drive diversity cascades in food webs. Proc. Natl. Acad. Sci. USA 2007, 104, 16976–16981. [Google Scholar] [CrossRef] [Green Version]
- Greyson-Gaito, C.J.; McCann, K.S.; Fründ, J.; Lucarotti, C.J.; Smith, M.A.; Eveleigh, E.S. Parasitoid community responds indiscriminately to fluctuating spruce budworm (Lepidoptera: Tortricidae) and other caterpillars on balsam fir (Pinaceae). Can. Entomol. 2021, 153, 482–496. [Google Scholar] [CrossRef]
- Régnière, J.; Seehausen, M.L.; Martel, V. Modeling climatic influences on three parasitoids of low-density spruce budworm populations. Part 1: Tranosema rostrale (Hymenoptera: Ichneumonidae). Forests 2020, 11, 846. [Google Scholar] [CrossRef]
- Régnière, J.; Saint-Amant, R.; Thireau, J.-C.; Therrien, P.; Hébert, C.; Martel, V. Modeling Climatic Influences on Three Parasitoids of Low-Density Spruce Budworm Populations. Part 2: Meteorus trachynotus (Hymenoptera: Braconidae). Forests 2021, 12, 155. [Google Scholar] [CrossRef]
- Arnaud, P.H. A Host-Parasite Catalog of North American Tachinidae (Diptera); U.S. Department of Agriculture, Miscellaneous Publication: Washington, DC, USA, 1978; Available online: https://archive.org/details/hostparasitecata1319arna (accessed on 21 October 2021).
- O’Hara, J.E. Revision of nearctic species ofactiarobineau-desvoidy (diptera: Tachinidae). Can. Entomol. 1991, 123, 745–776. [Google Scholar] [CrossRef]
- Régnière, J.; St-Amant, R.; Duval, P. Predicting insect distributions under climate change from physiological responses: Spruce budworm as an example. Biol. Invasions 2010, 14, 1571–1586. [Google Scholar] [CrossRef]
- Cusson, M.; LaForge, M.; Régnière, J.; Béliveau, C.; Trudel, D.; Thireau, J.-C.; Bellemare, G.; Keirstead, N.; Stolz, D. Multiparasitism of Choristoneura fumiferana by the ichneumonid Tranosema rostrale and the tachinid Actia interrupta: Occurrence in the field and outcome of competition under laboratory conditions. Entomol. Exp. Appl. 2002, 102, 125–133. [Google Scholar] [CrossRef]
- Martel, V.; Thireau, J.-C.; Régnière, J. Manual inoculation of host larvae with first instar maggots as a rearing technique for the larval parasitoid Actia interrupta (Diptera: Tachinidae). Biocontrol Sci. Technol. 2021, 1–4. [Google Scholar] [CrossRef]
- Lethiecq, J.L.; Régnière, J. CFS Spruce Budworm Population Studies: Sites Descriptions; Info. Rep. LAU-X-83; Canadian Forest Service, Laurentian Forestry Centre: Quebec, QC, Canada, 1988; Available online: https://cfs.nrcan.gc.ca/publications/download-pdf/21262 (accessed on 21 October 2021).
- Seehausen, M.L.; Régnière, J.; Martel, V.; Smith, S.M. Seasonal Parasitism and Host Instar Preference by the Spruce Budworm (Lepidoptera: Tortricidae) Larval Parasitoid Tranosema rostrale (Hymenoptera: Ichneumonidae). Environ. Entomol. 2016, 45, 1123–1130. [Google Scholar] [CrossRef]
- Régnière, J.; St-Amant, R.; Béchard, A. BioSIM 10—User’s Manual; Info. Rep. LAU-X-155; Canadian Forest Service, Laurentian Forestry Centre: Quebec, QC, Canada, 2014; Available online: https://cfs.nrcan.gc.ca/publications/download-pdf/34818 (accessed on 21 October 2021).
- Gangavalli, R.; Aliniazee, M. Diapause induction in the oblique-banded leafroller Choristoneura rosaceana (Lepidoptera: Tortricidae): Role of photoperiod and temperature. J. Insect Physiol. 1985, 31, 831–835. [Google Scholar] [CrossRef]
- Holling, C.S. Some Characteristics of Simple Types of Predation and Parasitism. Can. Entomol. 1959, 91, 385–398. [Google Scholar] [CrossRef]
- Régnière, J. Generalized Approach to Landscape-Wide Seasonal Forecasting with Temperature-Driven Simulation Models. Environ. Entomol. 1996, 25, 869–881. [Google Scholar] [CrossRef]
- Scinocca, J.F.; Kharin, V.V.; Jiao, Y.; Qian, M.W.; Lazare, M.; Solheim, L.; Flato, G.M.; Biner, S.; Desgagne, M.; Dugas, B. Coordinated Global and Regional Climate Modeling. J. Clim. 2015, 29, 17–35. [Google Scholar] [CrossRef]
- Arora, V.K.; Scinocca, J.F.; Boer, G.J.; Christian, J.R.; Denman, K.L.; Flato, G.M.; Kharin, V.V.; Lee, W.; Merryfield, W.J. Carbon emission limits required to satisfy future representative concentration pathways of greenhouse gases. Geophys. Res. Lett. 2011, 38. [Google Scholar] [CrossRef]
- Pachauri, R.K.; Allen, M.R.; Barros, V.R.; Broome, J.; Cramer, W.; Christ, R.; Church, J.A.; Clarke, L.; Dahe, Q.; Dasgupta, P.; et al. Contribution of Working Groups I, II and III to the Fifth Assessment Report of the Intergovernmental Panel on Climate Change; Climate Change 2014: Synthesis Report; IPCC: Geneva, Switzerland, 2014; p. 151. Available online: https://www.ipcc.ch/report/ar5/syr (accessed on 21 October 2021).
- Canadian Centre for Climate Modelling and Analysis (CCCma) Climate Model Data, CanESM2/CGCM4 Model Output. 2018. Available online: http://climate-modelling.canada.ca/climatemodeldata/cgcm4/CanESM2/rcp45/ (accessed on 21 October 2021).
- Régnière, J.; Bolstad, P. Statistical Simulation of Daily Air Temperature Patterns Eastern North America to Forecast Seasonal Events in Insect Pest Management. Environ. Entomol. 1994, 23, 1368–1380. [Google Scholar] [CrossRef]
- Régnière, J.; St-Amant, R. Stochastic simulation of daily air temperature and precipitation from monthly normals in North America north of Mexico. Int. J. Biometeorol. 2007, 51, 415–430. [Google Scholar] [CrossRef]
- Seehausen, M.L.; Régnière, J.; Martel, V.; Smith, S.M. Developmental and reproductive responses of the spruce budworm (Lepidoptera: Tortricidae) parasitoid Tranosema rostrale (Hymenoptera: Ichneumonidae) to temperature. J. Insect Physiol. 2017, 98, 38–46. [Google Scholar] [CrossRef]
- Lauzière, I.; Setamou, M.; Legaspi, J.; Jones, W. Effect of Temperature on the Life Cycle of Lydella jalisco (Diptera: Tachinidae), a Parasitoid of Eoreuma loftini (Lepidoptera: Pyralidae). Environ. Entomol. 2002, 31, 432–437. [Google Scholar] [CrossRef]
- Harvey, J.A. Conserving host–parasitoid interactions in a warming world. Curr. Opin. Insect Sci. 2015, 12, 79–85. [Google Scholar] [CrossRef]
- Jeffs, C.T.; Lewis, O.T. Effects of climate warming on host-parasitoid interactions. Ecol. Entomol. 2013, 38, 209–218. [Google Scholar] [CrossRef]
- Durant, J.M.; Molinero, J.-C.; Ottersen, G.; Reygondeau, G.; Stige, L.C.; Langangen. Contrasting effects of rising temperatures on trophic interactions in marine ecosystems. Sci. Rep. 2019, 9, 1–9. [Google Scholar] [CrossRef] [PubMed] [Green Version]
- Tougeron, K.; Brodeur, J.; Le Lann, C.; van Baaren, J. How climate change affects the seasonal ecology of insect parasitoids. Ecol. Entomol. 2019, 45, 167–181. [Google Scholar] [CrossRef] [Green Version]
- Fidgen, J.G.; Eveleigh, E.S. Life history characteristics of Elachertus cacoeciae (hymenoptera: Eulophidae), an ectoparasitoid of spruce budwor larvae, Choristoneura fumiferana (lepidoptera: Tortricidae). Can. Entomol. 1998, 130, 215–229. [Google Scholar] [CrossRef]
- Bouchard, M.; Auger, I. Influence of environmental factors and spatio-temporal covariates during the initial development of a spruce budworm outbreak. Landsc. Ecol. 2013, 29, 111–126. [Google Scholar] [CrossRef]
- Bouchard, M.; Martel, V.; Régnière, J.; Therrien, P.; Correia, D.L.P. Do natural enemies explain fluctuations in low-density spruce budworm populations? Ecology 2018, 99, 2047–2057. [Google Scholar] [CrossRef]
- Régnière, J.; Cooke, B.J.; Béchard, A.; Dupont, A.; Therrien, P. Dynamics and Management of Rising Outbreak Spruce Budworm Populations. Forests 2019, 10, 748. [Google Scholar] [CrossRef] [Green Version]


 ).
).
).
).

| Parameter | Overwintered Maggot | Summer Maggot | Pupa |
|---|---|---|---|
| φ | 0.0172 ± 0.0438 | 0.0561 ± 0.0256 | 0.0117 ± 0.0193 |
| ω | 0.0721 ± 0.7017 | 0.0513 ± 0.0295 | 0.1496 ± 0.0809 |
| Tb | 0 * | 5.78 ± 0.31 | 1.78 ± 14.08 |
| Δb | 12.01 ±78.86 | 15.004 ± 10.00 | 5.05 ± 76.57 |
| Tm | 35.87 ± 3.73 | 33.37 ± 0.69 | 33.60 ± 0.97 |
| Δm | 11.09 ± 44.03 | 4.54 ± 1.80 | 5.87 ± 2.17 |
| σε | 0.3031 ± 0.0292 | 0.1867 ± 0.0059 | 0.1237 ± 0.0062 |
| MLH | −196.6 | −1156.0 | −470.0 |
Publisher’s Note: MDPI stays neutral with regard to jurisdictional claims in published maps and institutional affiliations. |
© 2021 by the authors. Licensee MDPI, Basel, Switzerland. This article is an open access article distributed under the terms and conditions of the Creative Commons Attribution (CC BY) license (https://creativecommons.org/licenses/by/4.0/).
Share and Cite
Régnière, J.; Thireau, J.-C.; Saint-Amant, R.; Martel, V. Modeling Climatic Influences on Three Parasitoids of Low-Density Spruce Budworm Populations. Part 3: Actia interrupta (Diptera: Tachinidae). Forests 2021, 12, 1471. https://doi.org/10.3390/f12111471
Régnière J, Thireau J-C, Saint-Amant R, Martel V. Modeling Climatic Influences on Three Parasitoids of Low-Density Spruce Budworm Populations. Part 3: Actia interrupta (Diptera: Tachinidae). Forests. 2021; 12(11):1471. https://doi.org/10.3390/f12111471
Chicago/Turabian StyleRégnière, Jacques, Jean-Claude Thireau, Rémi Saint-Amant, and Véronique Martel. 2021. "Modeling Climatic Influences on Three Parasitoids of Low-Density Spruce Budworm Populations. Part 3: Actia interrupta (Diptera: Tachinidae)" Forests 12, no. 11: 1471. https://doi.org/10.3390/f12111471
APA StyleRégnière, J., Thireau, J.-C., Saint-Amant, R., & Martel, V. (2021). Modeling Climatic Influences on Three Parasitoids of Low-Density Spruce Budworm Populations. Part 3: Actia interrupta (Diptera: Tachinidae). Forests, 12(11), 1471. https://doi.org/10.3390/f12111471