Article

Application of Models to Predict Stand Volume, Aboveground Biomass Accumulation, and Carbon Storage Capacity for a Konishii Fir (Cunninghamia konishii Hayata) Plantation in Central Taiwan

1
Department of Forestry, National Chung Hsing University, No. 145, Xingda Rd., Taichung 40227, Taiwan
2
Experimental Forest Management Office, National Chung Hsing University, No. 145, Xingda Rd., Taichung 40227, Taiwan
*
Author to whom correspondence should be addressed.
Forests 2021, 12(10), 1406; https://doi.org/10.3390/f12101406
Submission received: 3 September 2021 / Revised: 2 October 2021 / Accepted: 12 October 2021 / Published: 15 October 2021

Abstract

:
Konishii fir (Cunninghamia konishii Hayata) is an important conifer in Taiwan. The purpose of this study was to predict stand volume (V), aboveground biomass accumulation (AGB), and aboveground carbon storage (AGCST) for a Konishii fir plantation. This study was located at the Huisun Experimental Forest Station of Nantou County located in central Taiwan. Four sample plots, each with an area of 0.05 ha, were installed and surveyed from 29 June to 2 July 2020. Two models, the diameter distribution model (DDM) and allometric model (AM), were used to predict V, AGB, and AGCST. Each item predicted by these two models was compared by the paired sample t-test. We employed the Weibull function to quantify stand diameter distribution and this function can effectively quantify diameter distribution, because all plots passed the examination by the Kolmogorov–Smirnov test (non-significant). Therefore, the Weibull function was suitable for developing the DDM. The predicted V, AGB, and AGCST were 538.43 ± 140.52 m3 ha−1, 203.25 ± 52.79 Mg ha−1, and 100.85 ± 26.30 Mg ha−1 by DDM; and 555.90 ± 145.42 m3 ha−1, 209.10 ± 51.25 Mg ha−1, and 103.78 ± 25.51 Mg ha−1 by AM, respectively. Each item was insignificantly different between DDM and AM, indicating similarity in results for both predictions. Meanwhile, using DDM is advantageous, as it can provide more yield information in diameter classes; therefore, this approach was recommended for yield prediction of the Konishii fir plantation.

1. Introduction

From 1991 to 2020, although the world total forest cover decreased from 32.35% to 31%, the area of planted forests during this period increased by about 72% [1]. This result indicates that the importance of plantation in current forest management is increasing, because it can provide various ecosystem services and play an important role in ecological, economic, and social aspects [2,3,4,5]. In recent years, numerous studies have assessed various species of plantations and discovered that they possess high carbon storage (CST) capacity due to their fast growth [6,7,8,9,10]. Thus, establishing plantations for carbon sequestration is regarded as a valid method to reduce global warming worldwide. The plantations are also a key component of Taiwan’s forest resources and occupy approximately 422,600 ha, which mainly contains conifers [10,11,12,13].
Assessment of CST among various forests is significant, because it helps understanding the contribution of forests to CST [9,10,14]. Numerous approaches have been developed for predicting the CST. Usually, prediction of biomass accumulation or CST based on the allometric model (AM) is regarded as a reliable approach at stand level [15,16,17]. On the other hand, the diameter distribution model (DDM) is another approach that could be used to predict CST [18]. However, the structure of DDM is more complex than that of AM, because DDM integrates AM and the diameter distribution function [19,20]. The advantage of using DDM is that it provides more detailed information than AM, while quantification of the stand diameter distribution requires a distribution function that is one of the major limitations of DDM [21]. The Weibull function is one of the important diameter distribution functions that can validly quantify various shapes of diameter distribution, and its parameters help to explain the curve shapes predicted by this function [22]. Hence, this function has been widely employed for quantifying the diameter distribution of various forest types, and satisfactory prediction results were obtained [18,22,23,24,25,26].
Cunninghamia lanceolata var. Konishii or C. konishii is known as Konishii fir, was first discovered in Luanta mountain of central Taiwan and is also known as Luanta fir [8,27]. Generally, it is dealt with as a variety of China fir; however, this conifer is classified into a single species as well (hereafter use Konishii fir in this study). Konishii fir is one of the important conifers in Taiwan, because it possesses some distinctive characteristics, including excellent wood quality, fast growth, and short rotation [28,29,30]. Its bark produces essential oils that give anti-wood-decay properties and makes it more durable and decay-resistant [31]. The natural habitat of this conifer is narrow, and it is naturally found in Taiwan and the border between Vietnam and the Lao People’s Democratic Republic [27]. In Taiwan, it is mainly distributed in the central part between the latitude 23° 30′ and 24° 30′ at an elevation range from 1300–2800 m [8,32]. It is commonly found scattered within forests of Chamaecyparis spp. Pinus spp. and Pseudotsuga wilsoniana [32]. Since this conifer possesses both high economic and ecological values, it has been widely planted across Taiwan [8].
This study has addressed a Konishii fir plantation at Huisun Experimental Forest Station of central Taiwan. The purpose of this study was to (1) assess the applicability of the Weibull function to quantify stand diameter distribution, (2) predict stand volume (V), aboveground biomass accumulation (AGB), and aboveground carbon storage (AGCST) capacity by DDM and AM, and (3) compare V, AGB, and AGCST using two models.

2. Materials and Methods
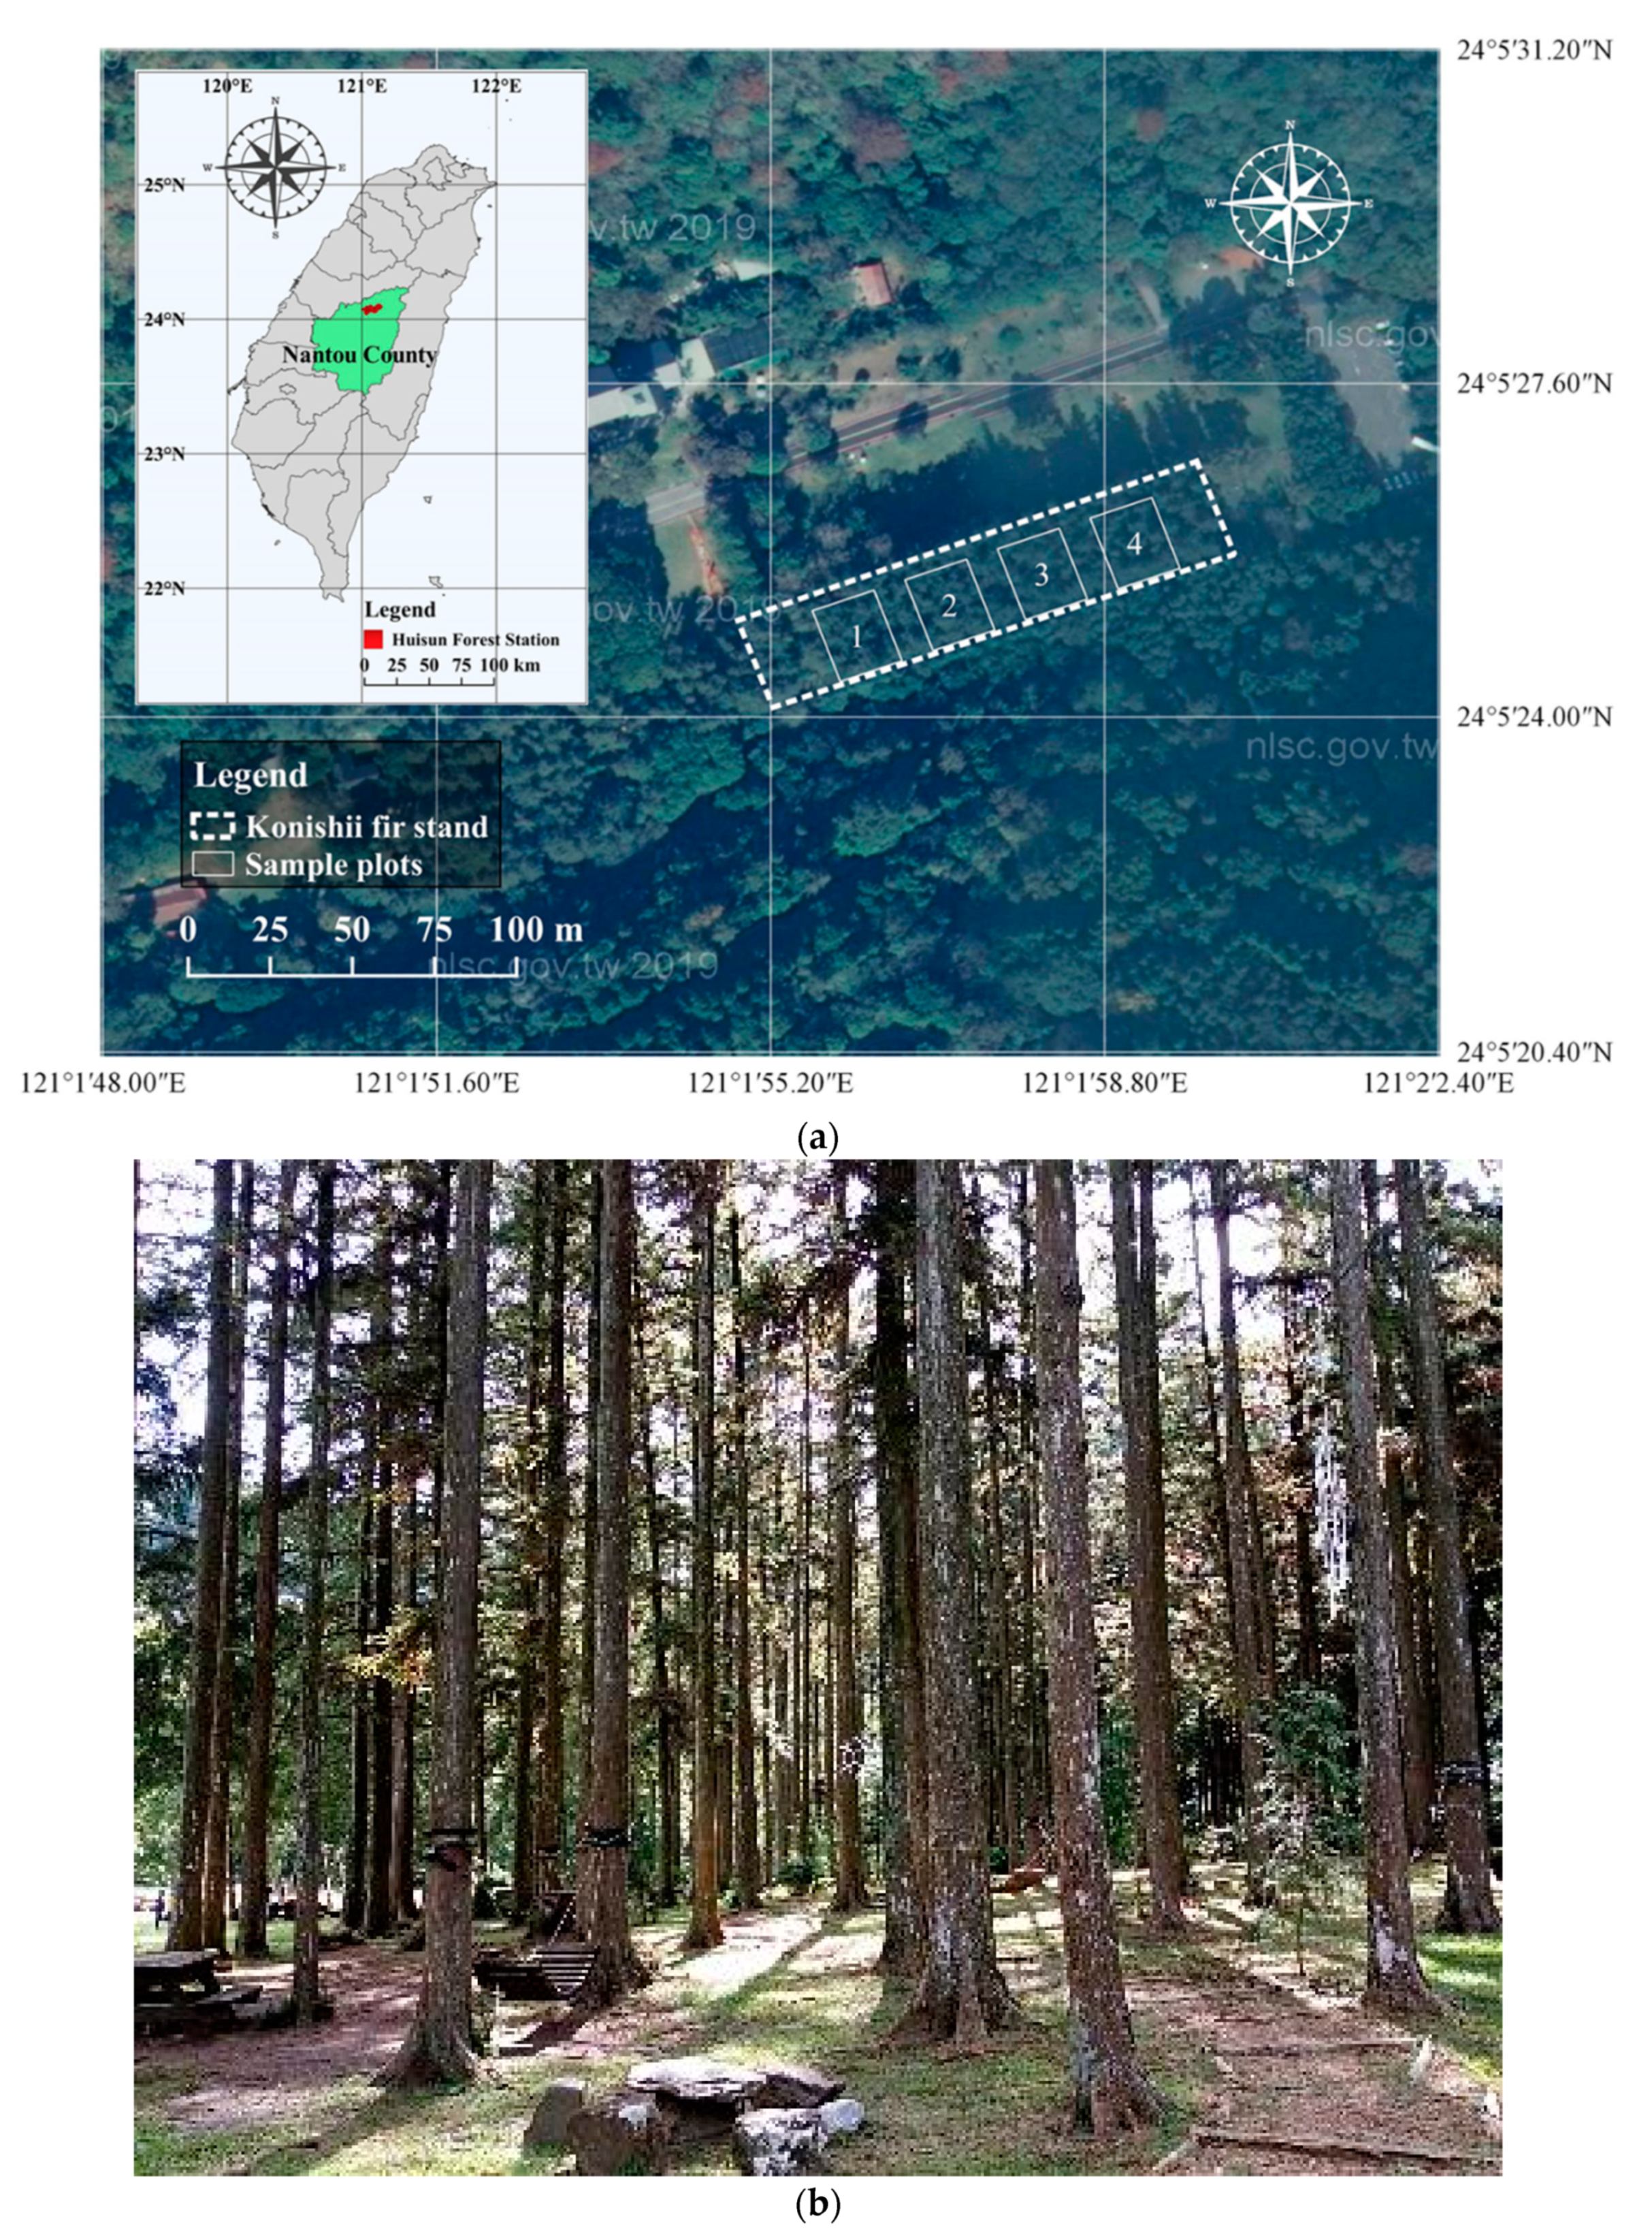
2.1. Study Areas

This research was conducted on a Konishii fir plantation at Huisun Experimental Forest Station of Nantou County located in central Taiwan (24°04′26″ N, 121°01′56.5″ E). This forest station has an area of 7477 ha and belongs to and is managed by the College of Agriculture and Natural Resource of National Chung Hsing University [33]. One of the important missions of this forest station is to provide a research facility for researchers. The structure of this forest station contains natural forest (70%), plantation (20%), and others including bamboo (10%) [34]. The altitude of this forest station ranges between 454 and 2419 m. The average annual temperature and annual rainfall are 21.0 °C and 2633 mm [35]. The Konishii fir is among the five most precious coniferous species of Taiwan and has been planted in various parts of the country [13]. It was selected as one of the major planting tree species in Taiwan during the 1970 plantation campaign [36]. To study its growth and yield, a Konishii fir plantation located at the third compartment was selected; the age of this stand at the time of the survey was 53 years based on the study of Liu [37]. The study site and stand status are shown in Figure 1.

2.2. Data Collection

Four sample plots were installed in the Konishii fir plantation site (Figure 1). The size of each plot was 0.05 ha (20 m × 25 m), and a total of 0.2 ha area from four plots was used. The field survey for data collection was conducted from 29 June to 2 July 2020.
During the fieldwork, trees in all the plots were fully enumerated for the measurement of diameter at breast height (DBH) using diameter tape (Yamayo, Tokyo, Japan); tree height (H) was measured with a Haga altimeter (Haga, Nürnberg, Germany); crown diameter (CD) was also measured by taking the mean of the longest and the shortest ground distance under the tree crown; and position of each tree within plots was measured with a Ushikata surveying compass LS-25 (Kantum Ushikata, Yokohama, Japan) and a Leica DISTO X4 (Leica Geosystems, Heerbrugg, Schweiz). Since the main focus of this study was stand level, we used plot data to scale out stand stockings. The detailed information of tree number within each plot was: 28, 25, 18, and 21 for plots 1 to 4, respectively. A total of 92 trees from 4 plots were selected for the complete measurement of the above characteristics. Because the present study only used DBH and H in the data set, other tree characteristics were not carried out for further analysis.

2.3. Method

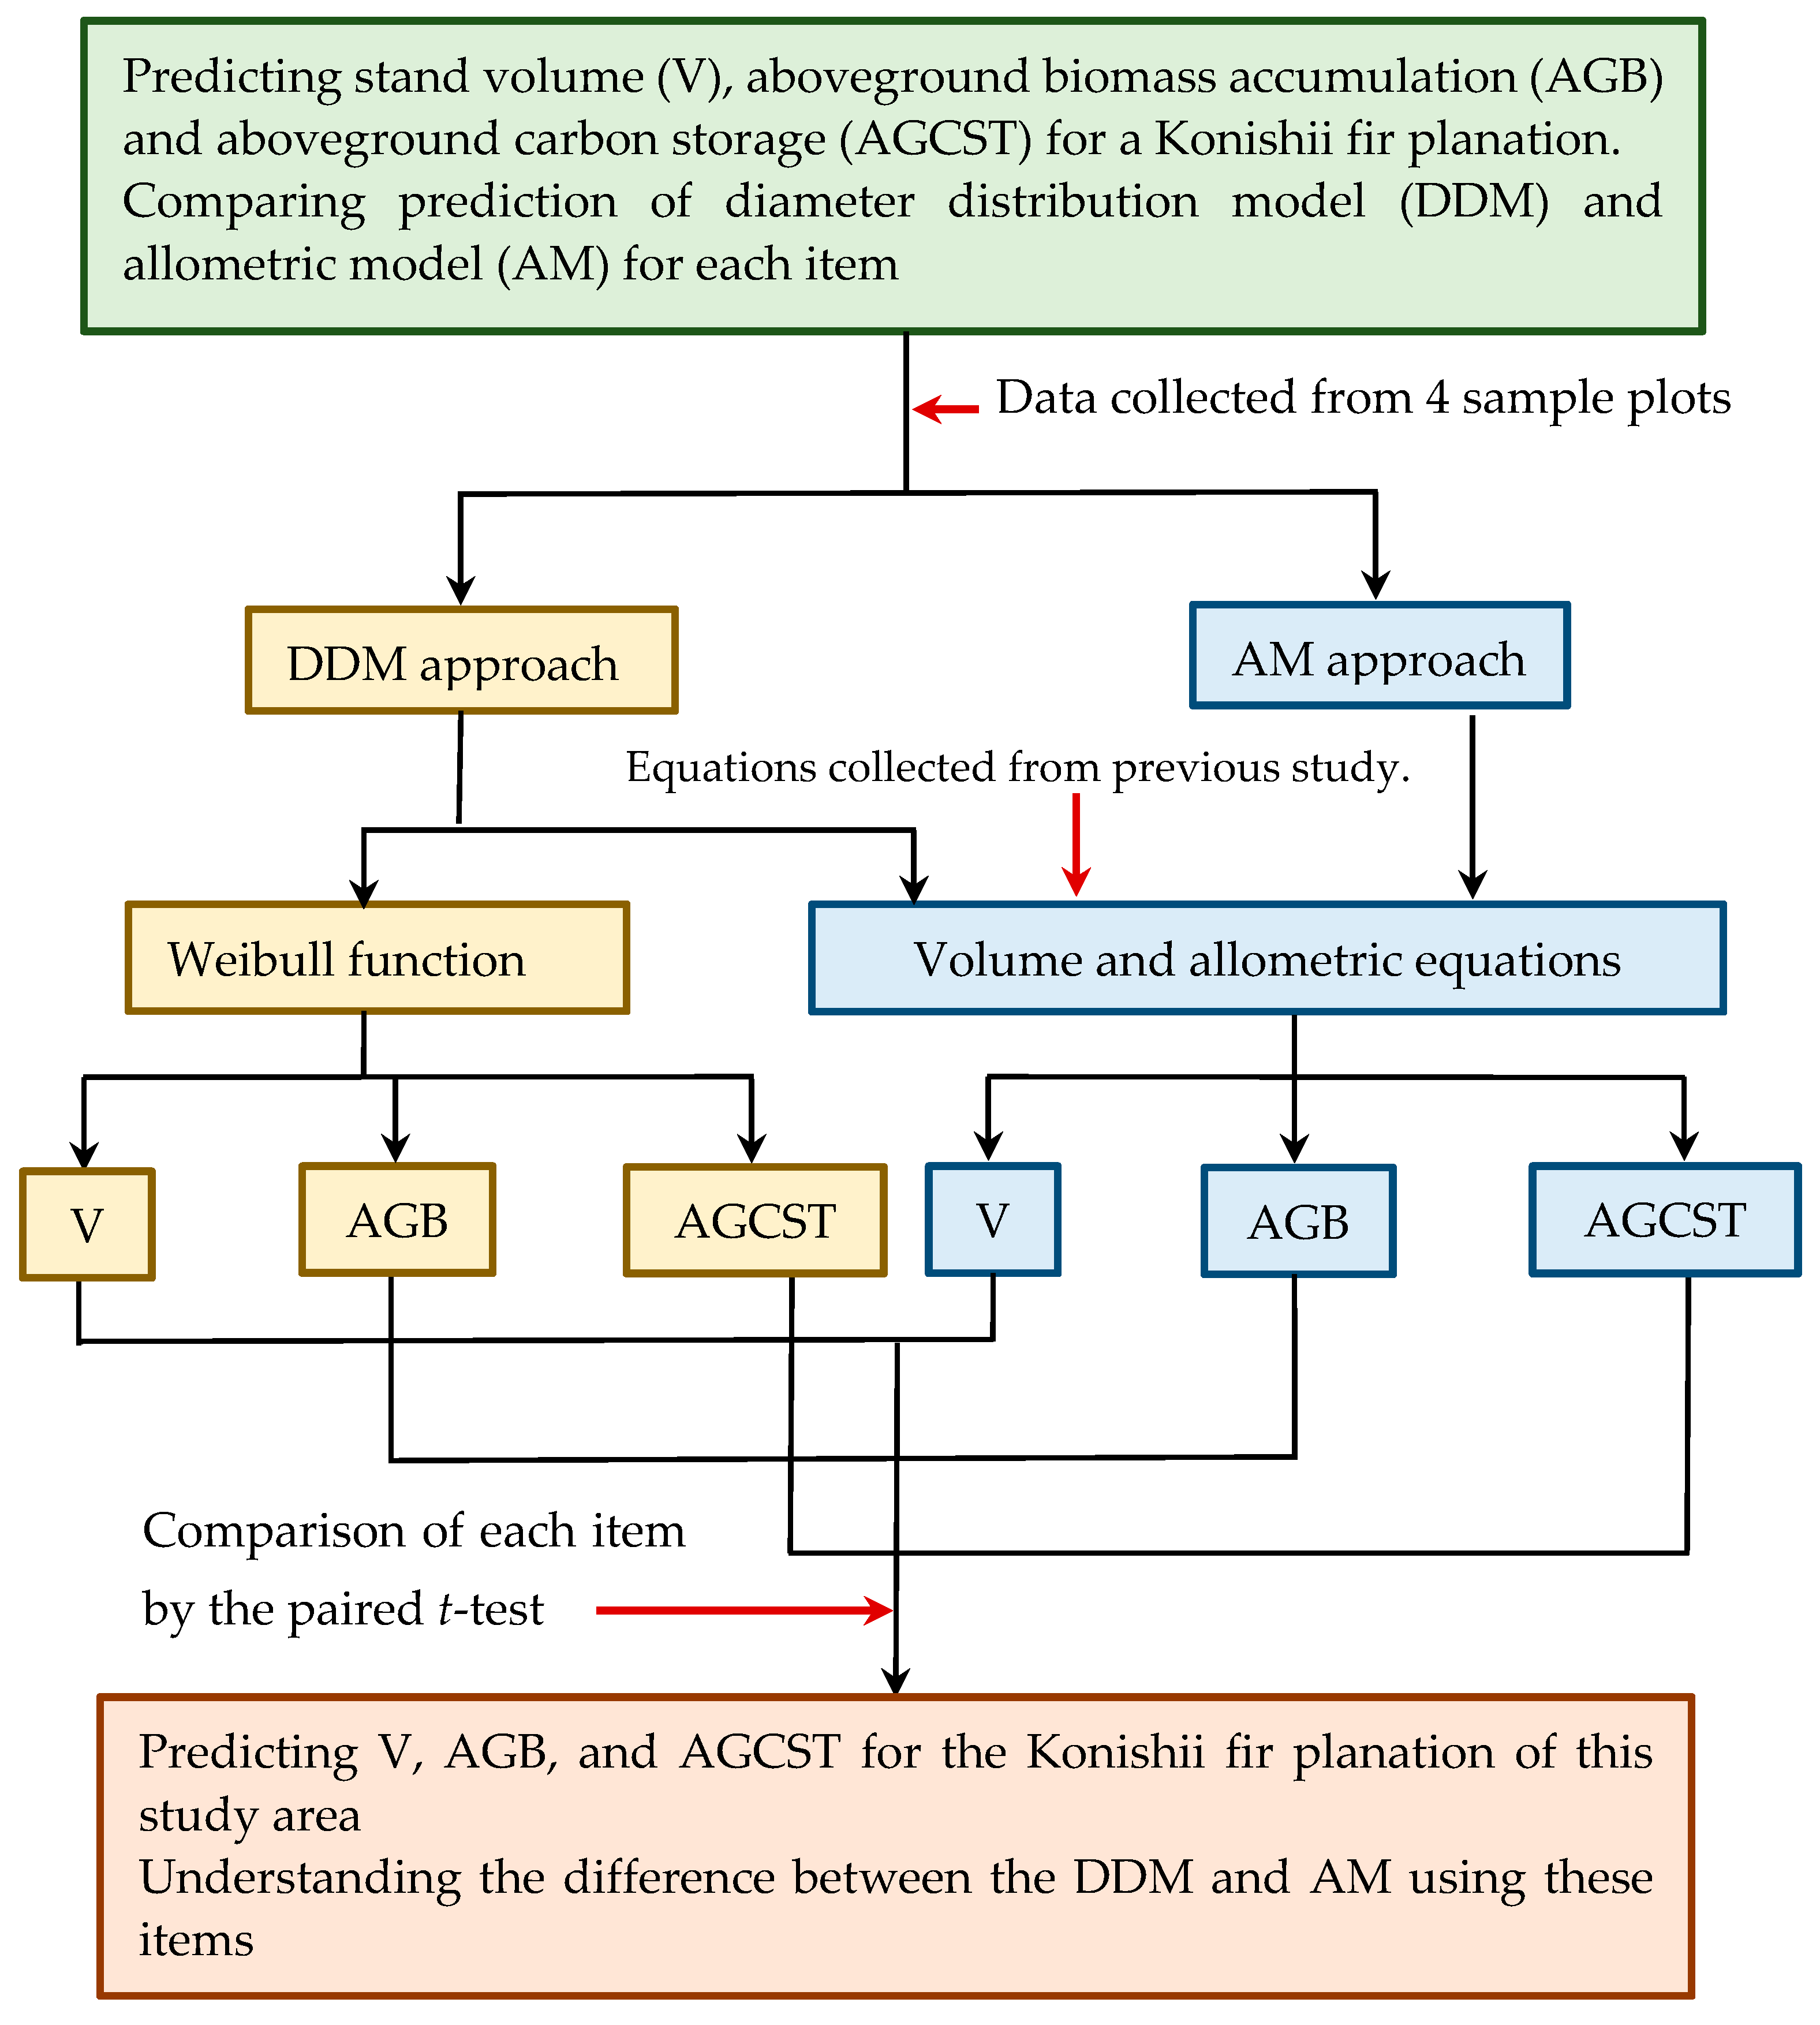
2.3.1. Research Framework

The flowchart of this study is presented in Figure 2.
The research framework was based on the study purpose, including predicting V, AGB, and AGCST for the Konishii fir plantation. We also compared these items by two models (DDM and AM) using the data collected from 4 sample plots. Both prediction models used the same allometric models; however, the DBH inputs in both cases were derived using different ways. The DDM used DBH derived from the Weibull function, while AM used the DBH directly obtained from the individual trees of plots to make predictions. After the predictions for these items were obtained, we compared the DDM and AM for each item by the paired t-test. The detailed stepwise method was presented in the below section.

2.3.2. Tree Height Equation

Tree height equation is an essential model for stands, especially at tree level. In order to build the relationship between DBH and H, a simple tree height equation was developed for this conifer based on the 92 sample trees. The tree height equation used in this study is shown in Equation (1) [17].
ln(H) = a+ bln(DBH),
where H is tree height, DBH is diameter at breast height, and a and b are parameters.

2.3.3. Diameter Distribution Model for Predicting Stand Volume, Aboveground Biomass Accumulation, and Aboveground Carbon Storage

The framework of DDM proposed by Hyink and Moser [20] was used in this study and is shown in Equation (2).
Y = N   l u g ( x ) f ( x ) d x ,
where Y represents yield per unit area given by g(x), N denotes the number of trees per unit area, x is the diameter at breast height (DBH), g(x) is yield attributes including functions of DBH, f(x) is the probability function, and l and u are the lower and upper DBH limit of each class separated by size.
Equation (2) consists of three parts: (1) tree number (N), (2) probability density function, and (3) yield attributes including functions. In this study, the number of trees per ha based on sampling plots (0.05 ha) was used to calculate N. The Weibull function was adopted as a probability density function. The relevant allometric equations cited from previous studies were employed to predict V, AGB, and AGCST.
The Weibull probability density function (PDF) and cumulative distribution function (CDF) are given in the following Equations (3) and (4) [22]:
f ( x ) = c b [ x a b ] c 1 e x p { [ x a b ] c } ,
F ( x ) = 1 e x p { [ x a b ] c } ,
where f(x) is a type of probability density function, F(x) is a type of cumulative distribution function, x is the diameter at breast height, and a, b, and c are parameters.
The Weibull function needs to determine the parameter a at the initial stage of the process [39]. We solved the parameter a based on an approach proposed by Zanakis [40] and then employed the least squared estimator (LSE) to predict the other two parameters. The Kolmogorov–Smirnov (K–S) test was used to examine the goodness-of-fit of the Weibull distribution at α = 0.05 level. For the detailed examination procedure, please refer to Law [41].
After quantifying the stand diameter distribution by the Weibull function, the theoretical tree number could be obtained for each DBH class. Integration of relevant models, the V, AGB, and AGCST can be predicted for each DBH class and whole stand.
The relevant equations used to predict V, AGB, and AGCST were taken from previous studies conducted on China fir studies in central Taiwan [16,42]. The detailed forms of these equations are shown in Table 1. Noticeably, the equations of Table 1 used in the DDM were according to the mean DBH of upper and lower diameter classes not based on individual trees.

2.3.4. Allometric Model for Predicting Stand Volume, Aboveground Biomass Accumulation, and Aboveground Carbon Storage

We used the equations of Table 1 to predict V, AGB, and AGCST for individual trees within each plot. The V, AGB, and AGCST were the summation results obtained from each individual tree for each plot. The plot data were used to scale out the stand-level analysis.

2.3.5. Comparing Stand Volume, Aboveground Biomass Accumulation, and Aboveground Carbon Storage between the Two Models

This study used two models for predicting V, AGB, and ABCST, respectively. The DDM is more complex than the AM because it contains quantifying diameter distribution and uses allometric models to predict V, AGB, and ABCST. Noticeably, the process of DDM cannot be continued when the diameter distribution fails to be quantified by the Weibull function. It indicates that using this approach to predict V, AGB, and ABCST is subjected to the diameter distribution quantified by the Weibull function [21]. If each of the predictions for V, AGB, and ABCST by DDM and AM is achieved, they could be compared by using paired sample t-test. The p-value for this study was kept at a 0.05 level of significance.

3. Results

3.1. Stand Characteristics

The stand characteristics are presented in Table 2. These characteristics are scaled with the minimum, maximum, mean, and standard deviations.
From Table 2, we found that each item of stand characteristic has a small standard deviation indicating uniformity among plots, as the plantation was pure and evenly -aged. The consistency among the plots was also promoted by the proximity among plots, as they share the same environmental, ephaptic, and topographic factors.

3.2. Tree Height Equation

A tree height equation with natural logarithm type (Equation (1)) was developed for this conifer based on the 92 sample trees. The result obtained for the tree height equation is: ln(H) = 2.2217 + 0.2893ln(DBH) (r = 0.527, F = 34.678, p < 0.001). This equation is suitable for predicting the tree height of the Konishii fir plantation in this study area.

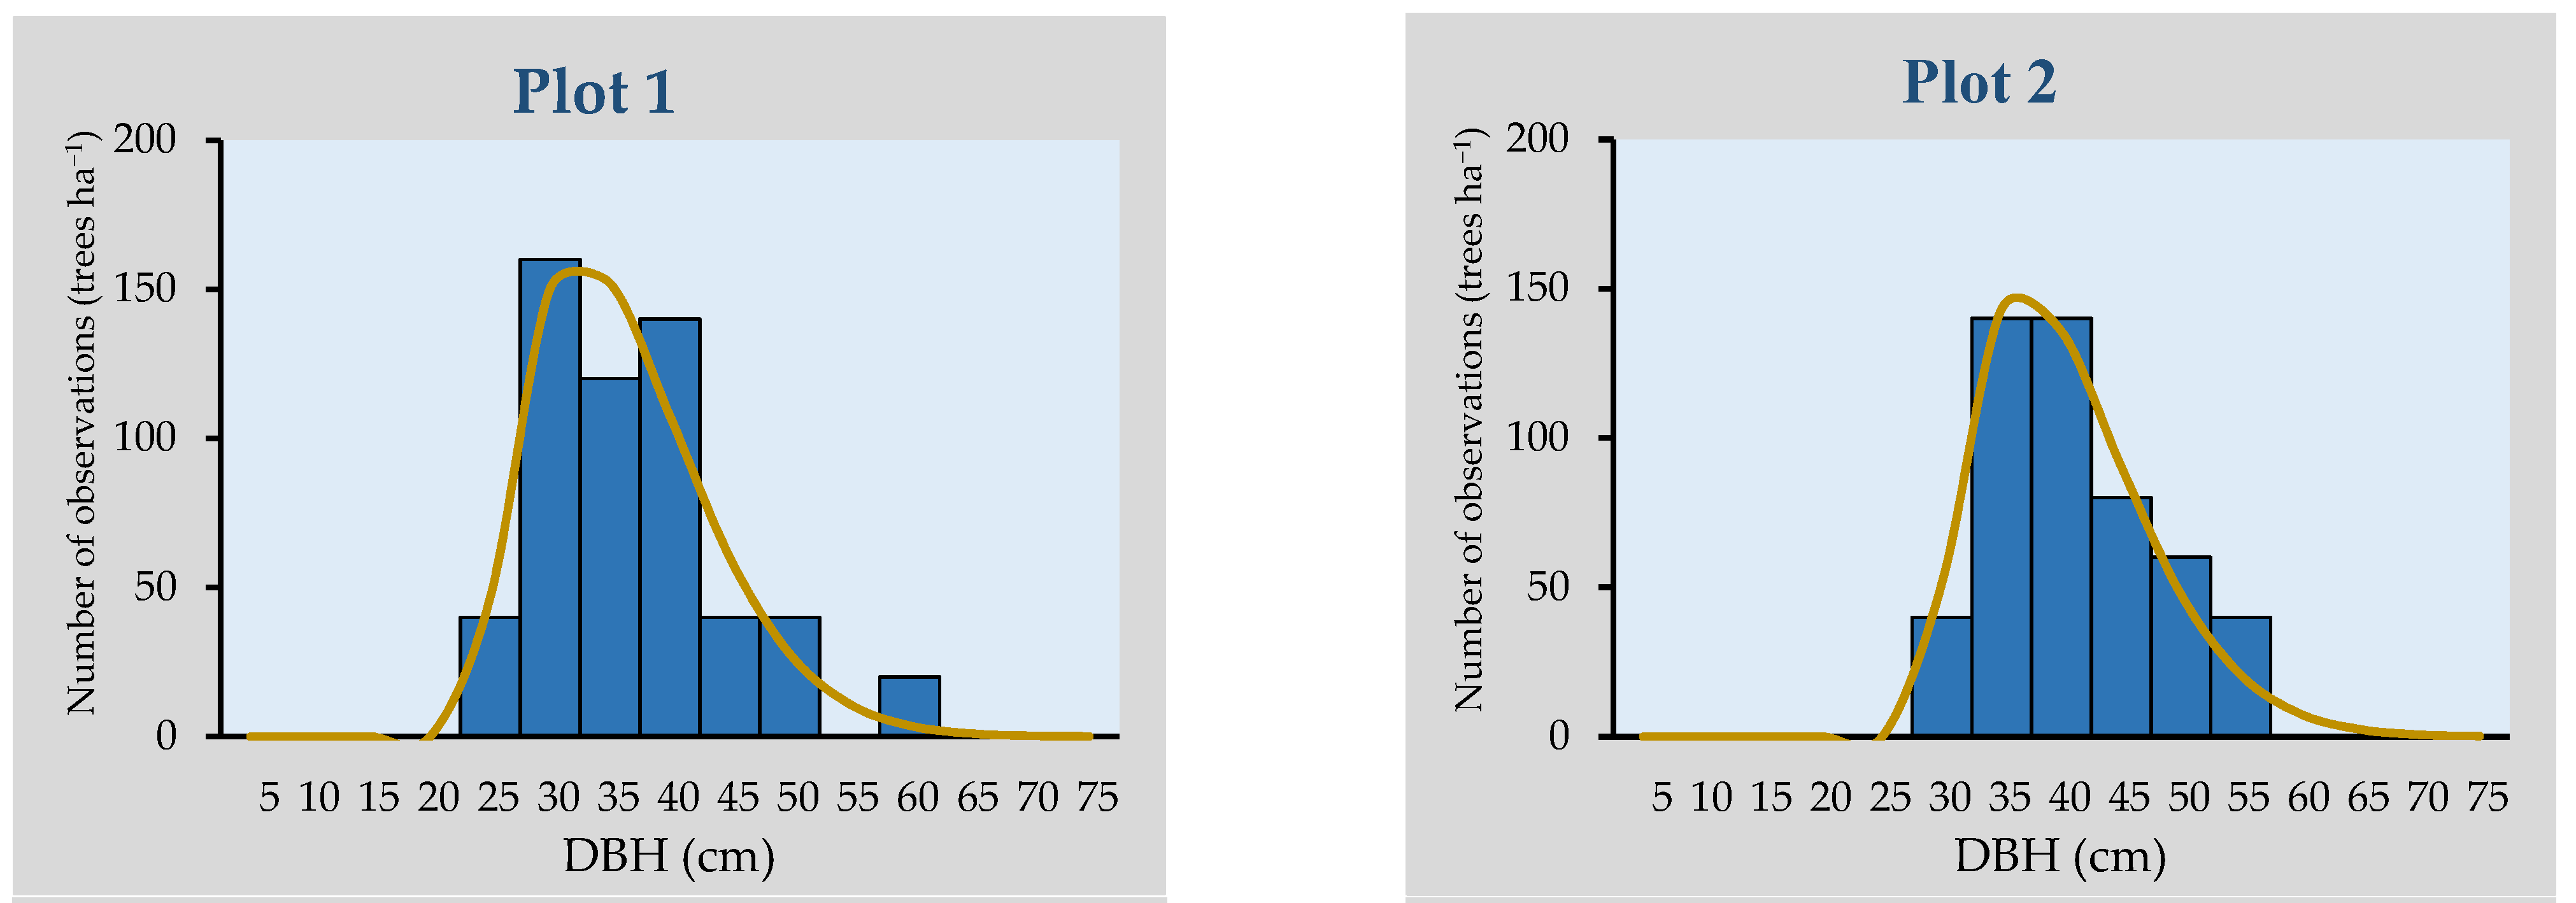
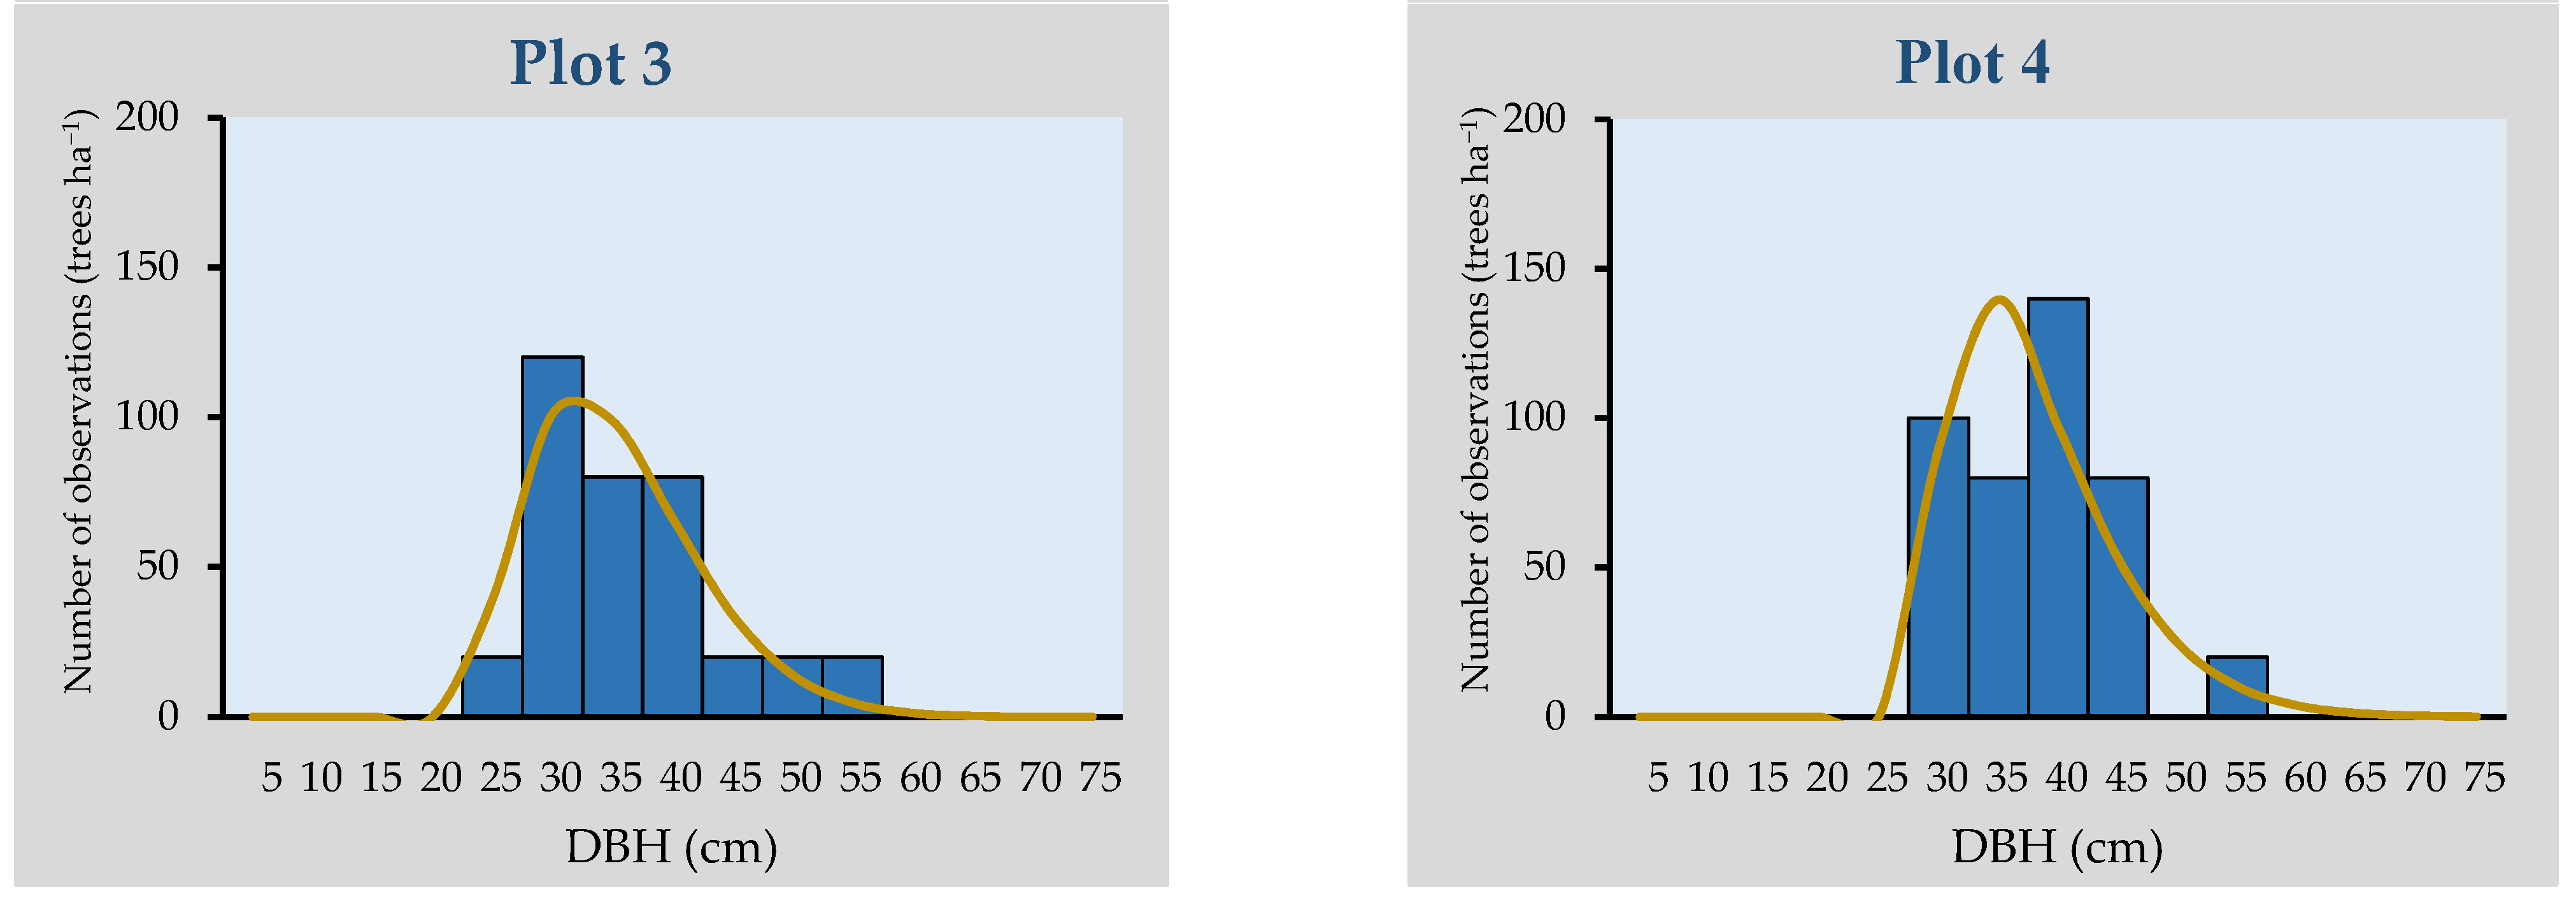
3.3. Quantifying Stand Diameter Distribution by Weibull Function

We employed the LSE to predict the Weibull function and examined it by the K–S test; the details are shown in Table 3.
The parameters a, b, and c were predicted to be 23.87 ± 2.87, 12.51 ± 1.37, and 1.66 ± 0.15, respectively (Table 3). The goodness of fit of the Weibull function was examined by the K–S test. Since we predicted the diameter distribution based on single plots, the K–S test also used to examine four plots, individually. The K–S test proposed by Law [41] was adopted to this study. This examination should calculate two values, that is the K–S and critical values. The former ( n D n ) is calculated from the tree numbers of the plot (n) and D n (the maximum value of the absolute difference between the cumulative distribution of observation and the Weibull function). The latter ( C 1 α ) is the critical value of the K–S test at α = 0.05. This critical value varies with numbers of trees in the plot [41], and for plots 1 to 4, the critical values were obtained as 0.846, 0.845, 0.838, and 0.843, respectively. Noticeably, if the n D n < C 1 α , the Weibull function could effectively be used to predict stand diameter distribution; else, the Weibulll is not suitable for predicting stand diameter distribution. The result of Table 3 showed that n D n < C 1 α for all plots, indicating the Weibull distribution is suitable for quantifying stand diameter distribution. We also displayed the observed data and predicted the curve for all plots in Figure 3. Figure 3 illustrates that the Weibull distribution follows the observation distributions for all plots.

3.4. Diameter Distribution Model

Since the Weibull function was suitable for predicting stand diameter distribution, it could be further integrated with the relevant models (Table 1) to predict V, AGB, and AGCST based on diameter class. The detailed results of the procedure of yield measurement using DDM are shown in Table 4.
Because the location parameter a of the Weibull function in all plots was higher than 20, the smallest diameter classes were in 20–25 cm. The N was calculated from the probability of the Weibull function and trees per ha. Tree height was calculated by the tree height equation built by this study based on the middle value of each DBH class. The V, AGB, and AGCST were predicted by the volume, aboveground biomass, and aboveground carbon storage equations of Table 1, respectively.
The yield distribution of V, AGB, and AGCST could be estimated for each DBH class, and a total of V, AGB and AGCST could be obtained from the DBH classes. For example, in plot 1, the V, AGB, and AGCST were calculated to be 600.83 m3 ha−1, 227.06 Mg ha−1 and 112.56 Mg ha−1, respectively. Likewise, the other sample plots followed the same procedure to obtain the yield distribution of V, AGB, and AGCST. The summarized values for each item of four plots are shown in Table 5.
The estimated values using the diameter distribution model for V, AGB, and CST for four plots were 538.43 ± 140.52 m3 ha−1, 203.25 ± 52.79 Mg ha−1, and 100.85 ± 26.30 Mg ha−1, respectively. Each of the items was calculated from Table 4 by summation of each diameter class obtained through the Weibull function of diameter distribution.

3.5. Allometric Model

We also used the AM to predict V, AGB, and AGCST, and the results obtained using the AM are shown in Table 6.
The predicted values using the allometric model for V, AGB, and CST were 555.90 ± 145.42 m3 ha−1, 209.09 ± 51.25 Mg ha−1, and 103.78 ± 25.51 Mg ha−1, respectively. The predictions are purely based on the allometric models for V, AGB, and AGCST and applied on individual tree basis.

3.6. Comparison of the Two Models

We used the paired sample t-test to compare the predictions of DDM and AM for each item, i.e., V, AGB, and AGCST. The result is shown in Table 7.
From Table 5 and Table 6, the results of DDM and AM comparison for all items were found to be consistent, and the predictions of both the methods are very close to each other. We also found a slightly larger mean value in AM for each item; as a result, a negative number was shown in the mean of D ¯ for each item by the paired sample t-test (Table 7). Nevertheless, there was no significant difference between the prediction of the DDM and the AM.
Overall, AM is one of the important models widely used for predicting V, AGB, and AGCST. This reliable approach was utilized to compare with the DDM in V, AGB, and AGCST. We found that these items showed a non-significant difference between the predictions of the two methods. It also confirmed that DDM was a reliable approach for predicting these items. However, it must be noted that the successful quantification of the diameter relies upon the diameter distribution function. Although DDM could provide more information for predicting V, AGB, and ABCST, this model is subjected to whether the diameter distribution could be quantified by the Weibull function. Noticeably, the process of DDM cannot be continued when the diameter distribution fails to be quantified by the Weibull function. Therefore, the diameter distribution function plays a key role in DDM.

4. Discussion

Assessment of carbon storage for various forests is an important work worldwide, because it helps understand their contribution to reducing global warming ([9,43]. The predictions of carbon storage capability for forests might vary with approaches [21]. Usually, predictions of CST based on the AMs are considered reliable for stand level [15,16,17]. The present study addressed Konishii fir, which is an important conifer of Taiwan with ecological and economic values [16,37]. The results showed the high potential of CST for this conifer. We also used the DDM to predict V, AGB, and AGCST, and the Weibull function was carried out to predict diameter distribution. The Weibull function plays a key role in the framework of DDM, because this model is subject to whether the diameter distribution could be quantified by the Weibull function [18]. If the diameter distribution fails to be quantified by the Weibull function, the process of DDM cannot be continued. It indicated that using DDM to predict V, AGB, and ABCST was subject to whether Weibull function could successfully predict the diameter distribution [18,21].
The Weibull function has been used widely in predicting diameter distribution for various types of forests and obtained satisfactory results [18,22,23,24,25,26,44,45,46]. Because it possesses many advantages, including the flexibility of its curve for characterizing different forest types, its parameters could be helpful to explain the stand structure through DBH distribution, and the interval of DBH classes could be easy to calculate [18,22,23]. We also found that the parameters of the Weibull function could be predicted by various approaches. Usually, assessment of those approaches is based on the goodness of fit test, such as the K–S test. The present study showed that the Weibull distribution was suitable for the Konishii fir plantation, because all the predictions passed the K–S test, indicating the DDM is applicable in this study.
Since AM is a model generally used in predicting V, AGB, and AGCST, we predicted these items based on DDM and compared them with the AM predictions. Each item was non-significantly different between DDM and AM, indicating similar results for both predictions. Similar results were also found in a bamboo study. Liu et al. [21] used these two models to predict AGCST for a Makino bamboo (Phyllostachys makinoi) plantation, and non-significant differences were shown between DDM and AM. Meanwhile, using DDM is advantageous as it can provide more yield information in diameter classes.
The China fir plantation is approximately 10% of all plantations in Taiwan, which has been planted in middle and low altitude areas [8]. Globally, China’s fir plantation has reached over 12 million ha [47,48]. Since Konishii fir was regarded as a variant of China fir in some research, we also compare the results of our study to that of China fir worldwide. The results are listed in Table 8.
The Konishii fir in this study has higher AGCST (100.85 Mg ha−1) compared to that of China fir in central and whole Taiwan [10,43] or various regions of China (Table 8). The mean AGCST (1.90 Mg ha−1 year−1) of this study was close to that of China fir in the whole of Taiwan; however, it was lower than that of China fir in various regions of China (Table 8). Usually, the rotation age of Konishii fir or China fir is approximately 30 years [10,43,49,50,51,52,53,54,55,56,57,58,59,60,61,62,63], but the stand age of Konishii fir in the present stand is more than 50 years. Therefore, higher AGCST was expected. Nevertheless, the present study focused on providing an approach to predict AGCST for a Konishii fir plantation. This additional information helps extend understanding relevant researches at the global level.

5. Conclusions

This study focused on predicting V, AGB, and AGCST or the Konishii fir plantation in central Taiwan. We used two models to predict these items, and the conclusions are as follows. The presented Weibull function was suitable for quantifying the diameter distribution of this plantation. The V, AGB, and AGCST were predicted to be 538.43 ± 140.52 m3 ha−1, 203.25 ± 52.79 Mg ha−1, and 100.85 ± 26.30 Mg ha−1 by DDM and 555.90 ± 145.42 m3 ha−1, 209.10 ± 51.25 Mg ha−1, and 103.78 ± 25.51 Mg ha−1 by AM, respectively. For each item (V, AGB, and ABCST), the differences were statistically non-significant between DDM and AM. We recommended DDM for yield prediction of the Konishii fir plantation, because it provides more yield information in diameter classes.

6. Patents

This section is not mandatory but may be added if there are patents resulting from the work reported in this manuscript.

Author Contributions

Conceptualization, T.-M.Y., M.H. and Z.-R.L.; methodology, M.H., T.-M.Y. and Z.-R.L.; software, M.H. and Z.-R.L.; validation, M.H., Z.-R.L. and T.-M.Y.; formal analysis, M.H., Z.-R.L. and T.-M.Y.; investigation, M.H. and Z.-R.L.; resources, C.-C.L., M.H. and Z.-R.L.; data curation, M.H.; writing—original draft preparation, M.H.; writing—review and editing, T.-M.Y., Z.-R.L. and C.-C.L.; visualization, M.H., Z.-R.L., T.-M.Y. and C.-C.L.; supervision, T.-M.Y.; project administration, M.H. and T.-M.Y. All authors have read and agreed to the published version of the manuscript.

Funding

This research received no external funding.

Acknowledgments

We thank the Huisun Experimental Forest Station, National Chung Hsing University, for their help with data collection and field measurements.

Conflicts of Interest

The authors declare no conflict of interest.

References

  1. FAO. Global Forest Resources Assessment: Main Report-Rome. 2020. Available online: https://doi.org/10.4060/ca9825en (accessed on 14 August 2021).
  2. Bauhus, J.; van der Meer, P.; Kanninen, M. Improved ecosystem services from plantations of the future. In Ecosystem Goods and Services from Plantation Forests, 1st ed.; Routledge: London, UK, 2010; pp. 205–227. [Google Scholar]
  3. Li, D.; Niu, S.; Luo, Y. Global patterns of the dynamics of soil carbon and nitrogen stocks following afforestation: A meta-analysis. New Phytol. 2012, 195, 172–181. [Google Scholar] [CrossRef] [PubMed]
  4. Allan, C.; Kerr, S. Examining patterns in and drivers of rural land use values. In Proceedings of the New Zealand Agricultural and Resource Economics Society Conference, Lincoln University, Canterbury, New Zealand, 28–30 August 2013. [Google Scholar] [CrossRef]
  5. International Panel on Climate Change (IPCC). Climate Change and Land: Summary for Policy Maker. 2019. Available online: https://www.ipcc.ch/srccl/ (accessed on 13 August 2021).
  6. Jarvis, P.G.; Kramer, P.J.; Kozlowski, T.T. Physiology of Woody Plants. J. Appl. Ecol. 1983, 20, 352. [Google Scholar] [CrossRef]
  7. Lamlom, S.; Savidge, R. A reassessment of carbon content in wood: Variation within and between 41 North American species. Biomass Bioenergy 2003, 25, 381–388. [Google Scholar] [CrossRef]
  8. Chung, J.-D.; Nigh, G.; Chien, C.-T.; Ying, C.C. Genetic Variation and Tree Improvement of Konishii fir (Cunninghamia lanceolata (Lamb.) Hook. var. konishii) in Taiwan. Silvae Genet. 2011, 60, 196–205. [Google Scholar] [CrossRef] [Green Version]
  9. Yen, T.-M.; Wang, C.-T. Assessing carbon storage and carbon sequestration for natural forests, man-made forests, and bamboo forests in Taiwan. Int. J. Sustain. Dev. World Ecol. 2013, 20, 455–460. [Google Scholar] [CrossRef]
  10. Yen, T.-M.; Huang, K.-L.; Li, L.-E.; Wang, C.-H. Assessing carbon sequestration in plantation forests of important conifers based on the system of permanent sample plots across Taiwan. J. Sustain. For. 2019, 39, 392–406. [Google Scholar] [CrossRef]
  11. Lin, K.C.; Wang, C.P.; Huang, C.M.; Horng, F.W.; Chiu, C.M. Estimates of biomass and carbon storage in two Taiwania plantations of Liukuei Experimental Forest. Taiwan J. For. Sci. 2003, 18, 85–94. Available online: https://eurekamag.com/research/003/754/003754817.php (accessed on 3 July 2021).
  12. Shih, C.-Y.; Yen, T.-M.; Wang, Y.-N. Comparison of various growth functions for predicting long-term stand development associated with different initial spacing in 64-year-old Japanese cedar (Cryptomeria japonica (L.f.) D. Don) plantations. Ann. For. Res. 2021, 64, 87–97. [Google Scholar] [CrossRef]
  13. Taiwan Forestry Bureau (TFB). Forest Resource Management. 2021. Available online: https://www.forest.gov.tw/EN/0002664 (accessed on 24 May 2021).
  14. Liu, Y.-H.; Yen, T.-M. Assessing aboveground carbon storage capacity in bamboo plantations with various species related to its affecting factors across Taiwan. For. Ecol. Manag. 2020, 481, 118745. [Google Scholar] [CrossRef]
  15. Nath, A.J.; Das, G.; Das, A.K. Above ground standing biomass and carbon storage in village bamboos in North East India. Biomass Bioenergy 2009, 33, 1188–1196. [Google Scholar] [CrossRef]
  16. Yen, T.; Ai, L.; Li, C.; Lee, J.; Huang, K. Aboveground carbon contents and storage of three major Taiwanese conifer species. Taiwan J. For. Sci. 2009, 24, 91–102. [Google Scholar]
  17. Li, L.E.; Lin, Y.J.; Yen, T.M. Using allometric models to predict the aboveground biomass of thorny bamboo (Bambusa stenostachya) and estimate its carbon storage. Taiwan J. For. Sci. 2016, 31, 37–47. [Google Scholar]
  18. Yen, T.-M.; Ji, Y.-J.; Lee, J.-S. Estimating biomass production and carbon storage for a fast-growing makino bamboo (Phyllostachys makinoi) plant based on the diameter distribution model. For. Ecol. Manag. 2010, 260, 339–344. [Google Scholar] [CrossRef]
  19. Strub, M.R.; Burkhart, H.E. A class-interval-free method for obtaining expected yields from diameter distributions. For. Sci. 1975, 21, 67–69. [Google Scholar] [CrossRef]
  20. Hyink, D.M.; Moser, J.W. A generalized framework for projecting forest yield and stand structure using diameter distributions. For. Sci. 1983, 29, 85–95. [Google Scholar] [CrossRef]
  21. Liu, Y.H.; Lin, Z.R.; Yen, T.M. Comparison of biomass prediction by various approaches for a makino bamboo (Phyllostachys makinoi Hayata) plantation. Q. J. Chin. For. 2019, 41, 203–215. [Google Scholar]
  22. Bailey, R.; Dell, T. Quantifying Diameter Distributions with the Weibull function. For. Sci. 1973, 19, 97–104. [Google Scholar] [CrossRef]
  23. Cao, Q.V. Use of the Weibull function to predict future diameter distributions from current plot data. In Proceedings of the 16th Biennal Silvicultural Research Conference, US Department of Agriculture Forest Service, Southern Research Station, Asheville, NC, USA, 4 May 2012; Volume 156, pp. 53–58. [Google Scholar]
  24. Russell, M.B.; Burkhart, H.E.; Amateis, R.L.; Prisley, S.P. Regional Locale and Its Influence on the Prediction of Loblolly Pine Diameter Distributions. South. J. Appl. For. 2012, 36, 198–203. [Google Scholar] [CrossRef] [Green Version]
  25. Huang, K.L.; Wang, C.H.; Yen, T.M.; Li, L.E. Evaluation of the Applicability of the Weibull Probability Density Function with Different Approaches for Diameter Distributions of Plantations of Four Conifer Species. Taiwan J. For. Sci. 2015, 30, 1–13. [Google Scholar]
  26. Diamantopoulou, M.J.; Özçelik, R.; Crecente-Campo, F.; Eler, Ü. Estimation of Weibull function parameters for modelling tree diameter distribution using least squares and artificial neural networks methods. Biosyst. Eng. 2015, 133, 33–45. [Google Scholar] [CrossRef]
  27. Nga, N.T.T.; Dung, N.A.; Chung, N.T.; Thai, T.H.; Hung, N.D. The distribution and some ecological characteristics, and essential oil of Cunninghamia konishii Hayata in Pu Hoat nature reserve, Nghe an province, Vietnam. Eng. Appl. Sci. Res. 2016, 43, 121–124. [Google Scholar]
  28. Kuo, P.C. The Precious 5 Conifers of Taiwan; Chinese Forestry Association: Taipei, Taiwan, 1995. [Google Scholar]
  29. Yang, J.C.; Lee, C.H.; Chiu, C.M. Genetic variation of wood density in Lunata fir tested in central Taiwan. Wood Fiber Sci. 2001, 33, 486–491. [Google Scholar]
  30. Zhou, L.; Shalom, A.-D.D.; Wu, P.; Li, S.; Jia, Y.; Ma, X. Litterfall production and nutrient return in different-aged Chinese fir (Cunninghamia lanceolata) plantations in South China. J. For. Res. 2015, 26, 79–89. [Google Scholar] [CrossRef]
  31. Su, Y.-C.; Hsu, K.-P.; Ho, C.-L. Composition, in vitro Cytotoxicity, Anti-mildew and Anti-wood-decay Fungal Activities of the Bark Essential Oil of Cunninghamia lanceolata var. konishii from Taiwan. Nat. Prod. Commun. 2018, 13. [Google Scholar] [CrossRef] [Green Version]
  32. Liu, T. Study on the photogepgraphy of the conifers and Taxads of Taiwan. Bull. Taiwan For. Res. Inst. 1966, 122, 1–33. [Google Scholar]
  33. NCHU. Experimental Stations and Forest Plantations. 2021. Available online: https://www.nchu.edu.tw/default/mid/685 (accessed on 27 May 2021).
  34. Lin, W.P. A Multi objective Planning System for Forest Resource Management in Taiwan: A Case Study on Hui-Sun Forest Station. Ph.D. Thesis, University of Hawaii at Manoa, Honolulu, HI, USA, 2003. [Google Scholar]
  35. Experimental Forest Management Office (EFMO). A Brief Introduction to The Experimental Forest, College of Agriculture and Natural Resource of National Chung Hsing University; Experimental Forest Management Office (EFMO), College of Agriculture and Natural Resource of National Chung Hsing University: Taichung, Taiwan, 2006; pp. 1–42. [Google Scholar]
  36. Chiu, C.M.; Suen, M.Y.; Tang, S.C.; Yu, C.R. Establishing Damaged Luanta-Fir (Cunninghamia Konishii) Plantations with Multistoried Forests- Growth of Six Kinds of Underplanting Hardwood Seedlings. Q. J. Chin. For. 2010, 43, 39–54. [Google Scholar] [CrossRef]
  37. Liu, Y.C. The clone bank and controlled pollination of Luanta-fir (Study on the sprouting vigor of the scion stools and the technique of the controlled pollination for inbreeding). Q. J. Chin. For. 1971, 5, 1–17. [Google Scholar]
  38. National Land Surveying and Mapping Center (NLSC). Taiwan MAP Service. Available online: http://maps.nlsc.gov.tw/ (accessed on 9 August 2021).
  39. Bailey, R.L. Weibull model for Pinus radiata diameter distribution. Stat. For. Res. 1974, 4, 51–59. [Google Scholar]
  40. Zanakis, S.H. A simulation study of some simple estimators for the three-parameter weibull distribution. J. Stat. Comput. Simul. 1979, 9, 101–116. [Google Scholar] [CrossRef]
  41. Law, A.M. Simulation Modeling and Analysis, 5th ed.; McGraw-Hill Education: New York, NY, USA, 2014. [Google Scholar]
  42. Yen, T.M.; Lee, J.S.; Huang, K.L.; Liu, C.C. Tree growth and biomass of a mature China-fir (Cunninghamia lanceolata) plantation. Q. J. Chin. For. 2004, 37, 157–168. [Google Scholar] [CrossRef] [Green Version]
  43. Yen, T.-M.; Lee, J.-S. Comparing aboveground carbon sequestration between moso bamboo (Phyllostachys heterocycla) and China fir (Cunninghamia lanceolata) forests based on the allometric model. For. Ecol. Manag. 2011, 261, 995–1002. [Google Scholar] [CrossRef]
  44. Cao, Q.V. Predictions of individual-tree and whole-stand attributes for loblolly pine plantations. For. Ecol. Manag. 2006, 236, 342–347. [Google Scholar] [CrossRef]
  45. Ajayi, S. Diameter Distribution for Gmelina Arborea (ROXB) Plantations in Ukpon River Forest Reserve, Cross River State, Nigeria. AFRREV STECH Int. J. Sci. Technol. 2013, 2, 64–82. [Google Scholar]
  46. Abino, A.C.; Kim, S.Y.; Lumbres, R.I.C.; Na Jang, M.; Youn, H.J.; Park, K.H.; Lee, Y.J. Performance of Weibull function as a diameter distribution model for Pinus thunbergii stands in the eastern coast of South Korea. J. Mt. Sci. 2016, 13, 822–830. [Google Scholar] [CrossRef]
  47. Food and Agriculture Organization (FAO). Global Forest Resource Assessment 2005. 2006. Available online: http://www.fao.org/forest-resources-assessment/past-assessments/fra-2005/en/ (accessed on 13 August 2021).
  48. West, P.W. Growing Plantation Forests, 1st ed.; Springer: Berlin/Heidelberg, Germany, 2006. [Google Scholar]
  49. Pan, Y.; Luo, T.; Birdsey, R.; Hom, J.; Melillo, J. New estimates of carbon storage and sequestration in China’s forests: Effects of age–class and method on inventory-based carbon estimation. Clim. Chang. 2004, 67, 211–236. [Google Scholar] [CrossRef]
  50. Yao, Y.; Piao, S.; Wang, T. Future biomass carbon sequestration capacity of Chinese forests. Sci. Bull. 2018, 63, 1108–1117. [Google Scholar] [CrossRef] [Green Version]
  51. Wang, Q.; Wang, S.; Zhang, J. Assessing the effects of vegetation types on carbon storage fifteen years after reforestation on a Chinese fir site. For. Ecol. Manag. 2009, 258, 1437–1441. [Google Scholar] [CrossRef]
  52. Chen, G.-S.; Yang, Z.-J.; Gao, R.; Xie, J.-S.; Guo, J.-F.; Huang, Z.-Q.; Yang, Y.-S. Carbon storage in a chronosequence of Chinese fir plantations in southern China. For. Ecol. Manag. 2012, 300, 68–76. [Google Scholar] [CrossRef]
  53. Zhao, M.; Xiang, W.; Peng, C.; Tian, D. Simulating age-related changes in carbon storage and allocation in a Chinese fir plantation growing in southern China using the 3-PG model. For. Ecol. Manag. 2009, 257, 1520–1531. [Google Scholar] [CrossRef]
  54. Saeed, S.; YuJun, S.; Beckline, M.; Chen, L.; Zhang, B.; Ahmad, A.; Mannan, A.; Khan, A.; Iqbal, A.; Saeed, S.; et al. Forest edge effect on biomass carbon along altitudinal gradients in Chinese Fir (Cunninghamia lanceolata): A study from Southeastern China. Carbon Manag. 2019, 10, 11–22. [Google Scholar] [CrossRef]
  55. Wei, H.D.; Liu, A.Q.; Ma, X.Q.; Lin, K.M. Effects of successive planting on carbon storage of Chinese fir forest. Chin. J. Ecol. Agric. 2006, 14, 36–39. Available online: http://ecoagri.ac.cn/article/id/2006310 (accessed on 13 August 2021).
  56. Wang, K.; Hu, D.; Deng, J.; Shangguan, Z.; Deng, L. Biomass carbon storages and carbon sequestration potentials of the Grain for Green Program-Covered Forests in China. Ecol. Evol. 2018, 8, 7451–7461. [Google Scholar] [CrossRef]
  57. Jiang, P.; Meng, C.; Zhou, G.; Xu, Q. Comparative Study of Carbon Storage in Different Forest Stands in Subtropical China. Bot. Rev. 2011, 77, 242–251. [Google Scholar] [CrossRef]
  58. Zhang, H.; Zhou, G.; Wang, Y.; Bai, S.; Sun, Z.; Berninger, F.; Bai, Y.; Penttinen, P. Thinning and species mixing in Chinese fir monocultures improve carbon sequestration in subtropical China. Eur. J. For. Res. 2019, 138, 433–443. [Google Scholar] [CrossRef]
  59. Cheng, X.; Yu, M.; Wang, G.G. Effects of Thinning on Soil Organic Carbon Fractions and Soil Properties in Cunninghamia lanceolata Stands in Eastern China. Forests 2017, 8, 198. [Google Scholar] [CrossRef] [Green Version]
  60. Tang, X.; Fehrmann, L.; Guan, F.; Forrester, D.I.; Guisasola, R.; Pérez-Cruzado, C.; Vor, T.; Lu, Y.; Álvarez-González, J.G.; Kleinn, C. A generalized algebraic difference approach allows an improved estimation of aboveground biomass dynamics of Cunninghamia lanceolata and Castanopsis sclerophylla forests. Ann. For. Sci. 2017, 74, 12. [Google Scholar] [CrossRef] [Green Version]
  61. Xie, X.; Cui, J.; Shi, W.; Liu, X.; Tao, X.; Wang, Q.; Xu, X. Biomass partition and carbon storage of Cunninghamia lanceolata chronosequence plantations in Dabie Mountains in East China. Dendrobiology 2016, 76, 165–174. [Google Scholar] [CrossRef]
  62. Tang, X.; Lu, Y.; Fehrmann, L.; Forrester, D.I.; Guisasola-Rodríguez, R.; Pérez-Cruzado, C.; Kleinn, C. Estimation of stand-level aboveground biomass dynamics using tree ring analysis in a Chinese fir plantation in Shitai County, Anhui Province, China. New For. 2015, 47, 319–332. [Google Scholar] [CrossRef]
  63. Kondo, T.; Yamada, H.; Otsuka, J.; Isoda, K.; Yamaguchi, S.; Ubukata, M. Growth of Cunninghamia lanceolata in Japan. For. Genet. Tree Breed. 2020, 9, 1–11. [Google Scholar] [CrossRef]
Figure 1. The study area and stand status (a) study site and plots (National Land Survey and Mapping Center, NLSC [38], (b) stand status of the Konishii fir at the survey period (2020/06/30 photo by Tian-Ming Yen).
Forests 12 01406 g001
Figure 2. The flowchart of model application to predict stand volume, aboveground biomass accumulation, and carbon storage capacity of Konishii fir (Cunninghamia konishii Hayata) plantation in central Taiwan.
Forests 12 01406 g002
Figure 3. The relationship between the observation (bar) and predicted curve (line) for all plots.
Forests 12 01406 g003aForests 12 01406 g003b
Table 1. The volume, aboveground biomass, and aboveground carbon storage equations used in this study.
ItemsEquationsSpecies and SiteReferences
VolumeV = (0.000033DBH1.9092 × H1.1170)−0.0122China fir in central TaiwanYen et al. [42]
Aboveground biomass AGB = 0.1502DBH2.2273China fir in central TaiwanYen et al. [42]
Aboveground carbon storageAGCST = 0.0681DBH2.2521China fir in central Taiwan Yen et al. [16]
V is volume, DBH is the diameter at breast height, H is tree height, AGB is aboveground biomass, and AGCST is aboveground carbon storage.
Table 2. Diameter at breast height (DBH), tree height, number of trees, basal area for the Konishii fir plantation of this study area based on the sample plots.
ItemsNumber of PlotsMinimumMaximumMeanStandard Deviation
Number of trees (trees ha−1)436056046088
DBH (cm)433.8538.2935.491.99
Tree height (m)425.2426.7225.840.69
Basal area (m2 ha−1)434.1859.4147.7711.39
Table 3. The parameters of the Weibull function are predicted by the least squared estimator and the result of the Kolmogorov–Smirnov (K–S) test.
ParametersK–S Test
abc n D n  1 C 1 α  2Result
121.8113.391.700.5140.846pass
226.5512.841.690.6970.845pass
321.0013.321.790.7430.838pass
426.1010.491.440.8240.843pass
Mean 23.87 ± 2.8712.51 ± 1.371.66 ± 0.150.695 ± 0.1310.843 ± 0.004
1 Dn is the maximum value of the absolute difference between the cumulative distribution of observation and the Weibull function, n is tree numbers of plots. 2 C 1 α is the critical value at α = 0.05 level.
Table 4. Prediction of stand volume (V), aboveground biomass accumulation (AGB), and aboveground carbon storage (AGCST) for all plots based on the diameter distribution model.
PlotDiameter Class
(cm)
Number of Trees
(trees ha−1)
Tree Height 1
(m)
V
(m3 ha−1)
AGB
(Mg ha−1)
AGCST
(Mg ha−1)
120 ≤ x< 2546.5722.7018.627.193.52
25 ≤ x < 30150.1724.0694.9936.2317.83
30 ≤ x < 35152.0325.25140.4653.2126.30
35 ≤ x < 40107.5026.32137.2051.7525.67
40 ≤ x < 4560.0327.29101.5638.1919.00
45 ≤ x < 5027.7428.1860.2422.6111.28
50 ≤ x < 5510.8729.0129.5411.075.54
55 ≤ x < 603.6729.7812.224.572.29
60 ≤ x < 651.0830.514.321.620.81
220 ≤ x < 2500.0000.0000.0000.0000.00
25 ≤ x < 3051.5324.0632.6012.436.12
30 ≤ x < 35143.2425.25132.3550.1424.78
35 ≤ x < 40135.6826.32173.1765.3232.40
40 ≤ x < 4590.4227.29152.9657.5328.62
45 ≤ x < 5047.5728.18103.3238.7719.35
50 ≤ x < 5520.6729.0156.2121.0610.53
55 ≤ x < 607.6029.7825.359.484.75
60 ≤ x < 652.4030.519.663.611.81
320 ≤ x< 2539.3722.7015.746.072.98
25 ≤ x < 30101.2624.0664.0524.4312.03
30 ≤ x < 3598.7625.2591.2534.5717.09
35 ≤ x < 4066.2526.3284.5631.8915.82
40 ≤ x < 4534.0227.2957.5621.6510.77
45 ≤ x < 5013.9728.1830.3311.385.68
50 ≤ x < 554.6929.0112.744.772.39
55 ≤ x < 601.3129.784.351.630.82
60 ≤ x < 650.3130.511.230.460.23
420 ≤ x < 2500.0000.0000.0000.0000.00
25 ≤ x < 3089.7324.0656.7621.6510.66
30 ≤ x < 35139.5725.25128.9648.8524.15
35 ≤ x < 4097.1426.32123.9846.7723.20
40 ≤ x < 4553.0627.2989.7533.7516.80
45 ≤ x < 5024.7128.1853.6820.1410.05
50 ≤ x < 5510.1729.0127.6610.365.18
55 ≤ x < 603.7829.7812.584.712.36
60 ≤ x < 651.2830.515.141.920.97
1 Tree height was predicted based on middle values of each DBH class by Equation (1).
Table 5. The stand volume (V), aboveground biomass accumulation (AGB), and aboveground carbon storage (AGCST) predicted by the diameter distribution model for the Konishii fir plantation.
ItemsNumber of PlotsMinimum MaximumMeanStandard Deviation
V (m3 ha−1)4362.15689.66538.43140.52
AGB (Mg ha−1)4136.99259.85203.2552.79
AGCST (Mg ha−1)467.86129.13100.8526.30
Table 6. The stand volume (V), aboveground biomass accumulation (AGB), and aboveground carbon storage (AGCST) predicted by the allometric model for the Konishii fir plantation.
ItemsNumber of PlotsMinimum MaximumMeanStandard Deviation
V (m3 ha−1)4390.44712.12555.90145.42
AGB (Mg ha−1)4148.48263.16209.1051.25
AGCST (Mg ha−1)473.64130.78103.7825.51
Table 7. The stand volume (V), aboveground biomass accumulation (AGB), and aboveground carbon storage (AGCST) predicted by the DDM (diameter distribution model) and AM (allometric model) and using the paired sample t-test to compare each item by two models for the Konishii fir plantation, where D ¯ is the distance between each item predicted by DDM and AM (using DDM–AM).
Items Mean   of   D ¯ SD   of   D ¯ t-Valuep-Value
V (m3 ha−1)−17.4723.48−1.4880.233
AGB (Mg ha−1)−5.846.28−1.8600.160
AGCST (Mg ha−1)−2.933.17−1.8530.161
Table 8. Stand volume (V), aboveground biomass accumulation (AGB), and aboveground carbon storage (AGCST) for the Konishii fir or Chinese fir plantations collected from publication papers at various regions compared to our study.
SiteConifersV (m3 ha−1)AGB (Mg ha−1)AGCST
(Mg ha−1)
Mean AGCST
(Mg ha−1 year−1)
References
Central TaiwanKonishii fir538.43203.25100.851.90This study
Whole TaiwanChina fir234.8-44.61.79Yen et al. [10]
Central TaiwanChina fir--99.53.35Yen and Lee. [43]
Whole China 845.5 117.91 Pan et al. [49]
Whole China 28.93.49Yao et al. [50]
South ChinaChina fir 55.229.6 Wang et al. [51]
South ChinaChina fir 184.1 1 Chen et al. [52]
South ChinaChina fir 123.4759.842.85Zhao et al. [53]
Southeastern ChinaChina fir 419.78209.89 Saeed et al. [54]
Southeastern ChinaChina fir 95.813.23Wei et al. [55]
Southwest China 51.458.58Wang et al. [56]
Eastern ChinaChina fir 73.58 120.902.63 2Jiang et al. [57]
Eastern China 52.663.29Zhang et al. [58]
Eastern China 522.8194.76 Cheng et al. [59]
Eastern China 200.178.036.02.12Tang et al. [60]
Eastern China 213.68112.442.25Xie et al. [61]
Central ChinaChina fir 108.10 Tang et al. [62]
South JapanChina fir495 Kondo et al. [63]
Central JapanChina fir354 Kondo et al. [63]
1 total tree (including needle, twigs, branches, stem, bark and roots). 2 total stand (including Shrub-storey, Herb-storey, and Forest floor).
Publisher’s Note: MDPI stays neutral with regard to jurisdictional claims in published maps and institutional affiliations.

