Protocol

ρ-MtreeRing: A Graphical User Interface for X-ray Microdensity Analysis

by
Miguel García-Hidalgo
1,*,
Ángel M. García-Pedrero
2,3,
Cristina Caetano-Sánchez
4,
Marcos Gómez-España
2,
Mario Lillo-Saavedra
5 and
José Miguel Olano
1,*
1
EiFAB-iuFOR, Campus Duques de Soria, University of Valladolid, 42004 Soria, Spain
2
Department of Computer Architecture and Technology, Universidad Politécnica de Madrid, 28660 Madrid, Spain
3
Center for Biomedical Technology, Universidad Politécnica de Madrid, 28223 Madrid, Spain
4
Department of Biology, University of Cadiz-IVAGRO, 11510 Cádiz, Spain
5
Faculty of Agricultural Engineering, University of Concepción, Chillán 3812120, Chile
*
Authors to whom correspondence should be addressed.
Forests 2021, 12(10), 1405; https://doi.org/10.3390/f12101405
Submission received: 13 September 2021 / Revised: 4 October 2021 / Accepted: 12 October 2021 / Published: 15 October 2021
(This article belongs to the Section Wood Science and Forest Products)

Abstract

:
Wood microdensitometry provides an integrated measurement of inter and intra-annual changes in wood anatomy and lignification. Although it can be acquired through a wide array of techniques, X-ray-based techniques are still the standard. Conversion of a grayscale X-ray image to density and annual ring boundaries delimitation is performed through image analysis software. Proprietary software has dominated these applications, albeit Free Open Source Software (FOSS) has been developed recently. We present ρ -MtreeRing, a user-friendly FOSS that streamlines the entire microdensitometry analysis process through a graphical user interface based on Shiny R Software without any programming knowledge. We compared the results of this program with the most widely used commercial software (WinDendro), showing the validity of the results. ρ -MtreeRing can be personalized and developed by the microdensitometry research community.

1. Introduction

Xylem cell formation involves sequential processes of cell division, expansion and lignification [1]. The dynamics of these processes are affected by intrinsic and environmental factors leading to differences in xylem structure. Dendrochronology aims at extracting this environmental information from annual ring features. Ring width has been historically the main proxy, since it can be easily measured and checked for quality control through cross-dating. Ring width data basically depends on the cell division process with a minor expansion effect [2]. Wood quantitative anatomy is more effective since it can isolate information from the different xylem development phases, with the ability to extract intra-annual variability [3]. Despite ongoing improvements in lab and computer techniques [4,5], xylem quantitative anatomy is still highly work intensive, and does not capture lignification processes, particularly in the complex xylem of angiosperms [6,7].
Wood microdensitometry synthetizes xylem anatomy properties [8]. In contrast to ring-width and quantitative anatomy, densitometry also captures lignification. The strong link between maximum density and summer temperature in cold and temperate environments has dominated the applications of densitometry [9], albeit maximum density is also a good proxy to reconstruct defoliation events [10,11,12]. The applications of minimum density have been historically neglected despite its high potential to reconstruct spring conditions [13,14,15]. Moreover, studies in microdensitometry are strongly biased to gymnosperms despite the vast potential of this technique in angiosperms.
Although densitometry can be acquired by a wide array of techniques (reviewed in [9]), X-ray-based techniques are still the standard. These techniques produce a grayscale image where density profiles can be extracted from. Digital output is becoming common thanks to recent techniques, although film digitalization is still the standard. Once the gray values are obtained, ring boundaries have to be identified to extract meaningful values for each ring of the core. This step is commonly performed either manually or using a mathematical algorithm to detect the density drop associated with late and earlywood transitions between consecutive years [16,17]. However, this is not always straightforward, particularly in cores with density fluctuations or angiosperms with diffuse xylem, where the density drop is not so sharp and thus requires expert supervision.

Available Software

Acquisition of density profiles has been commonly performed by using proprietary software such as WinDENDRO™ [18], LignoVision™ (Rinntech®) or CooRecorder™ [19]. These commercial tools developed for dendrochronological studies present valuable graphical and statistical options and support by a private company who keeps the program stable. However, many labs could not bear costs mainly for the two first software and, in addition, proprietary licenses avoid customization through code modification by the user. Proprietary software hampers covering specific needs and requires the software upgrade by the proprietary company or the use of third software to fill up this lack, e.g., exporting data in a certain format.
Recently, some Open Source Software (OSS) have been released for dendrometry tasks [20,21,22,23]. OSS lacks the feasibility and support of the commercial one but shows high potential for the scientific community because of its result reproducibility, cooperative and shared knowledge, and the possibility of code modification by community members to cope with the specific requirements of each lab or research objective. Moreover, most of those are released as Free Open Source Software (FOSS), removing economic barriers of access. Thus, among other programming languages, R [24], with a GNU license, appears as one of the most used languages for scientific OSS due to its simplicity as an interpreted language, its possibility of implementation through a graphical user interface, (GUI) making it easier to use, and its availability for the most used operating systems.
Microdensity profile analysis can be approached by the R package xRing [21]. This software offers multiple options in a sequential pipeline, including density calibration, automatic ring detection, user correction and density data exportation. However, it lacks a GUI for the whole process, resulting a critical limitation for those researchers unfamiliar with programming. An adequate GUI for the entire analysis process could help to ease and speed the process of microdensity profiles extraction up. Furthermore, algorithms for ring auto-detection perform weakly for angiosperms with diffuse porous wood due to their wood features and the associated time-consuming process of manual correction, which can be reduced using a graphical effective tool.
There is a trend of measuring wood rings using digital images [19,25,26,27,28]. Recently, Shi et al. [23] developed MtreeRing, a friendly user interface, for dendrometric studies from RGB or grayscale images with ring detection algorithms, which can be customized according to sample characteristics. In addition, the whole process can be carried through a Shiny [29] interface, removing entry barriers for people without programming abilities. However, its use is limited to ring width measurements without options for densitometry analysis or saving the project to reopen it later on. In order to fill this gap, we have developed ρ -MtreeRing, combining the strengths of MtreeRing GUI and microdensity methods. Thus, the entire densitometry analysis process from X-ray image loading, density calibration, automatic ring detection and correction and data exportation can be reached using a GUI, enabling its implementation in a user-friendly software, which saves time at various steps of the process and can be used by any layman in programming matters. In this manuscript, we present ρ -MtreeRing and compare its results with the most widely used commercial software WinDENDRO™.

2. Materials and Methods

2.1. Software Description

The ρ -MtreeRing interface is based on MtreeRing [30], built using the Shiny package, and therefore inherits most of its functionality. The Shiny package provides a server that allows interaction between the R framework and a web browser (e.g., Chrome, Firefox, Safari) to display the graphical interface. This interface is almost entirely written in R, with small parts in Javascript and CSS. ρ -MtreeRing code is available through GitHub (https://github.com/CambiumRG/rhoMtreeRing) (accessed on 2 August 2021). The main new features of the ρ -MtreeRing interface are described in the subsequent sections.

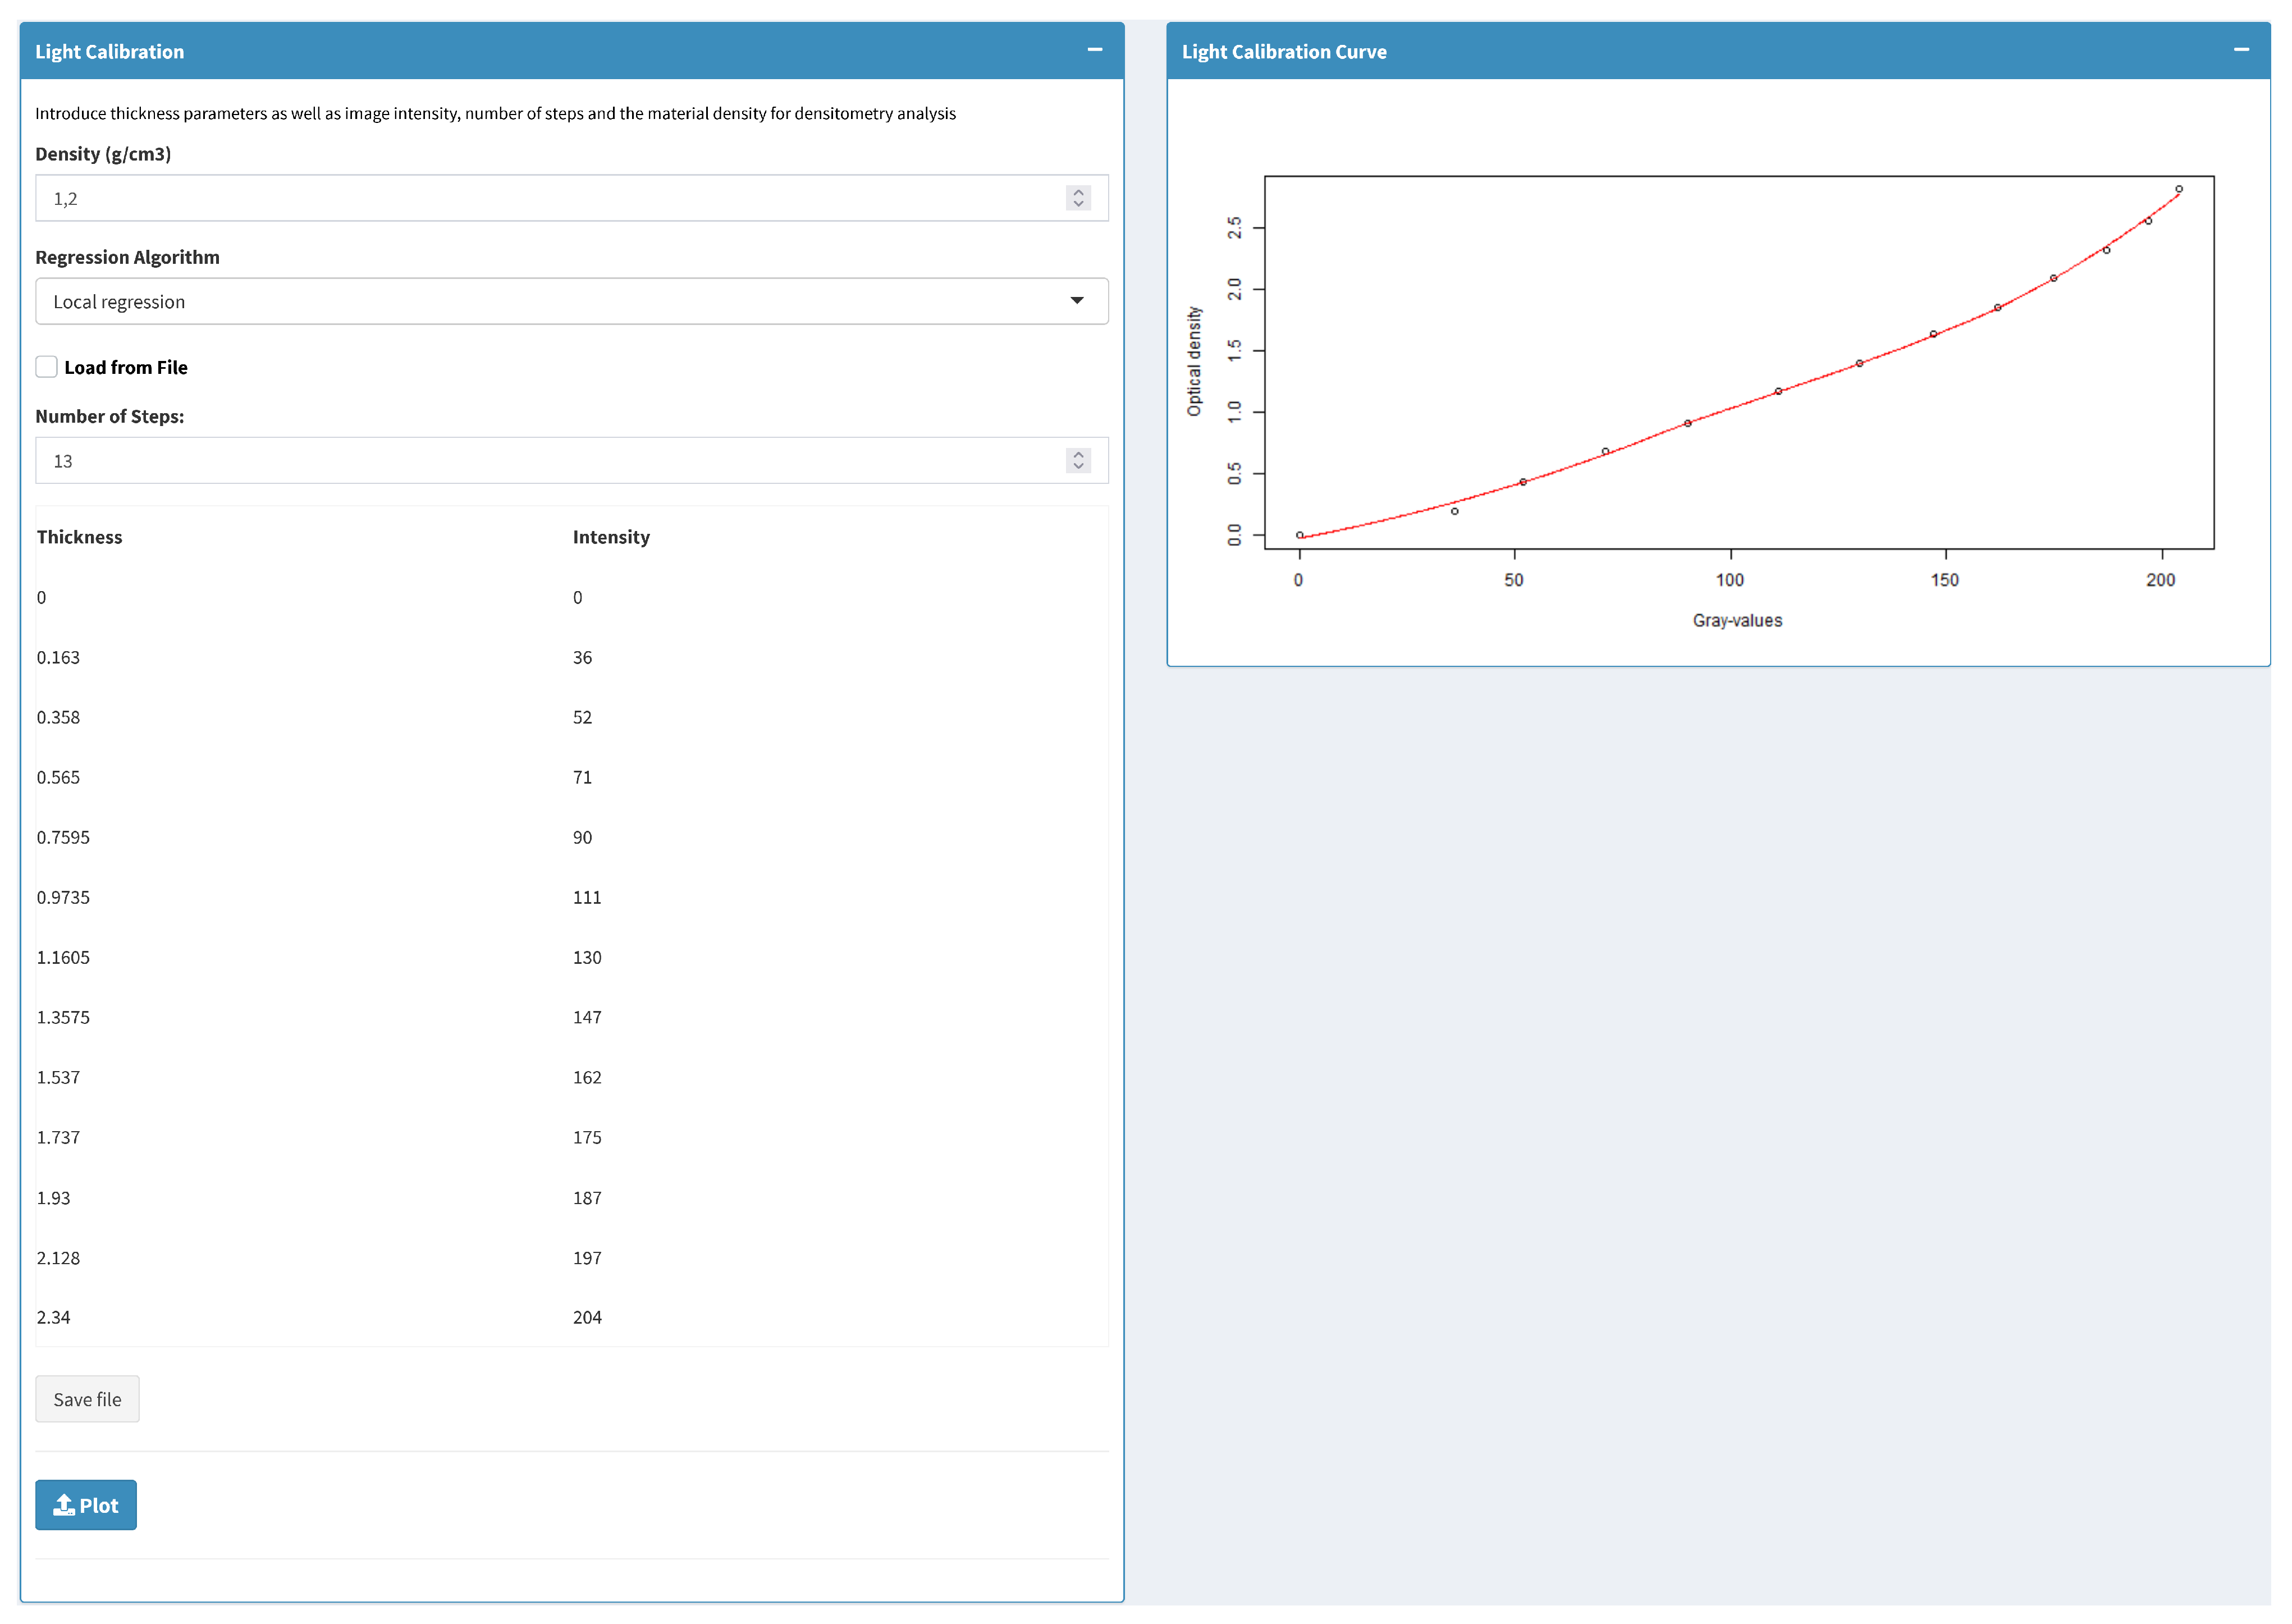
2.1.1. Light Calibration

High-resolution X-ray, the most used technique for wood density [31], outputs a grayscale digital image or a radiographic film, which is usually digitalized into 256 levels in 8 bit images but sometimes in 16 bit. Thereafter, light calibration correlates the grayscale values from the stepped calibration wedge, captured simultaneously with the sample, with its known density and thickness values.
Reference data from a stepped calibration wedge can be entered by hand or loaded from a text file at the ρ -MtreeRing first section, Data Loading. Afterward, the user selects the most suitable regression method, Local Regression or Cubic Smoothing Spline, to visualize the Light Calibration, i.e., the curve that relates each gray value in the image to the optical density of the calibration wedge, Figure 1.

2.1.2. Sample Info

The analysis of concrete elements from digital images needs to link digital features with real features, e.g., the number of pixels and known distance. Thus, ρ -MtreeRing requires spatial dot density from the image at the scanning process to measure the ring width and the sample thickness for wood density calculation. Therefore, in the Analysis section, the user completes Sample Info with those concrete values in dots per inch and millimeters, respectively.

2.1.3. Density Profile

Density values are obtained from the path set by the user and converted into density values according to the Light Calibration Curve. The user sets a path with customized length and width according to the characteristics of the sample. Moreover, contiguous segments can be settled orthogonally to ring growth to prevent blurring, and dummy values can be used in case fiber tilt is recommended.
After length delimitation, the path width value can be adjusted and the density value extraction varies accordingly. Thus, wider path widths minimize the effect of outliers on density values but increase computing costs. In the case of inclined paths, the software internally adjusts the image to extract the density value of the pixels perpendicular to the marked path line. As a user-friendly interface, ρ -MtreeRing simultaneously shows the obtained density profile and the real image of the sample, including zooming options to check the extraction process robustness, Figure 2.

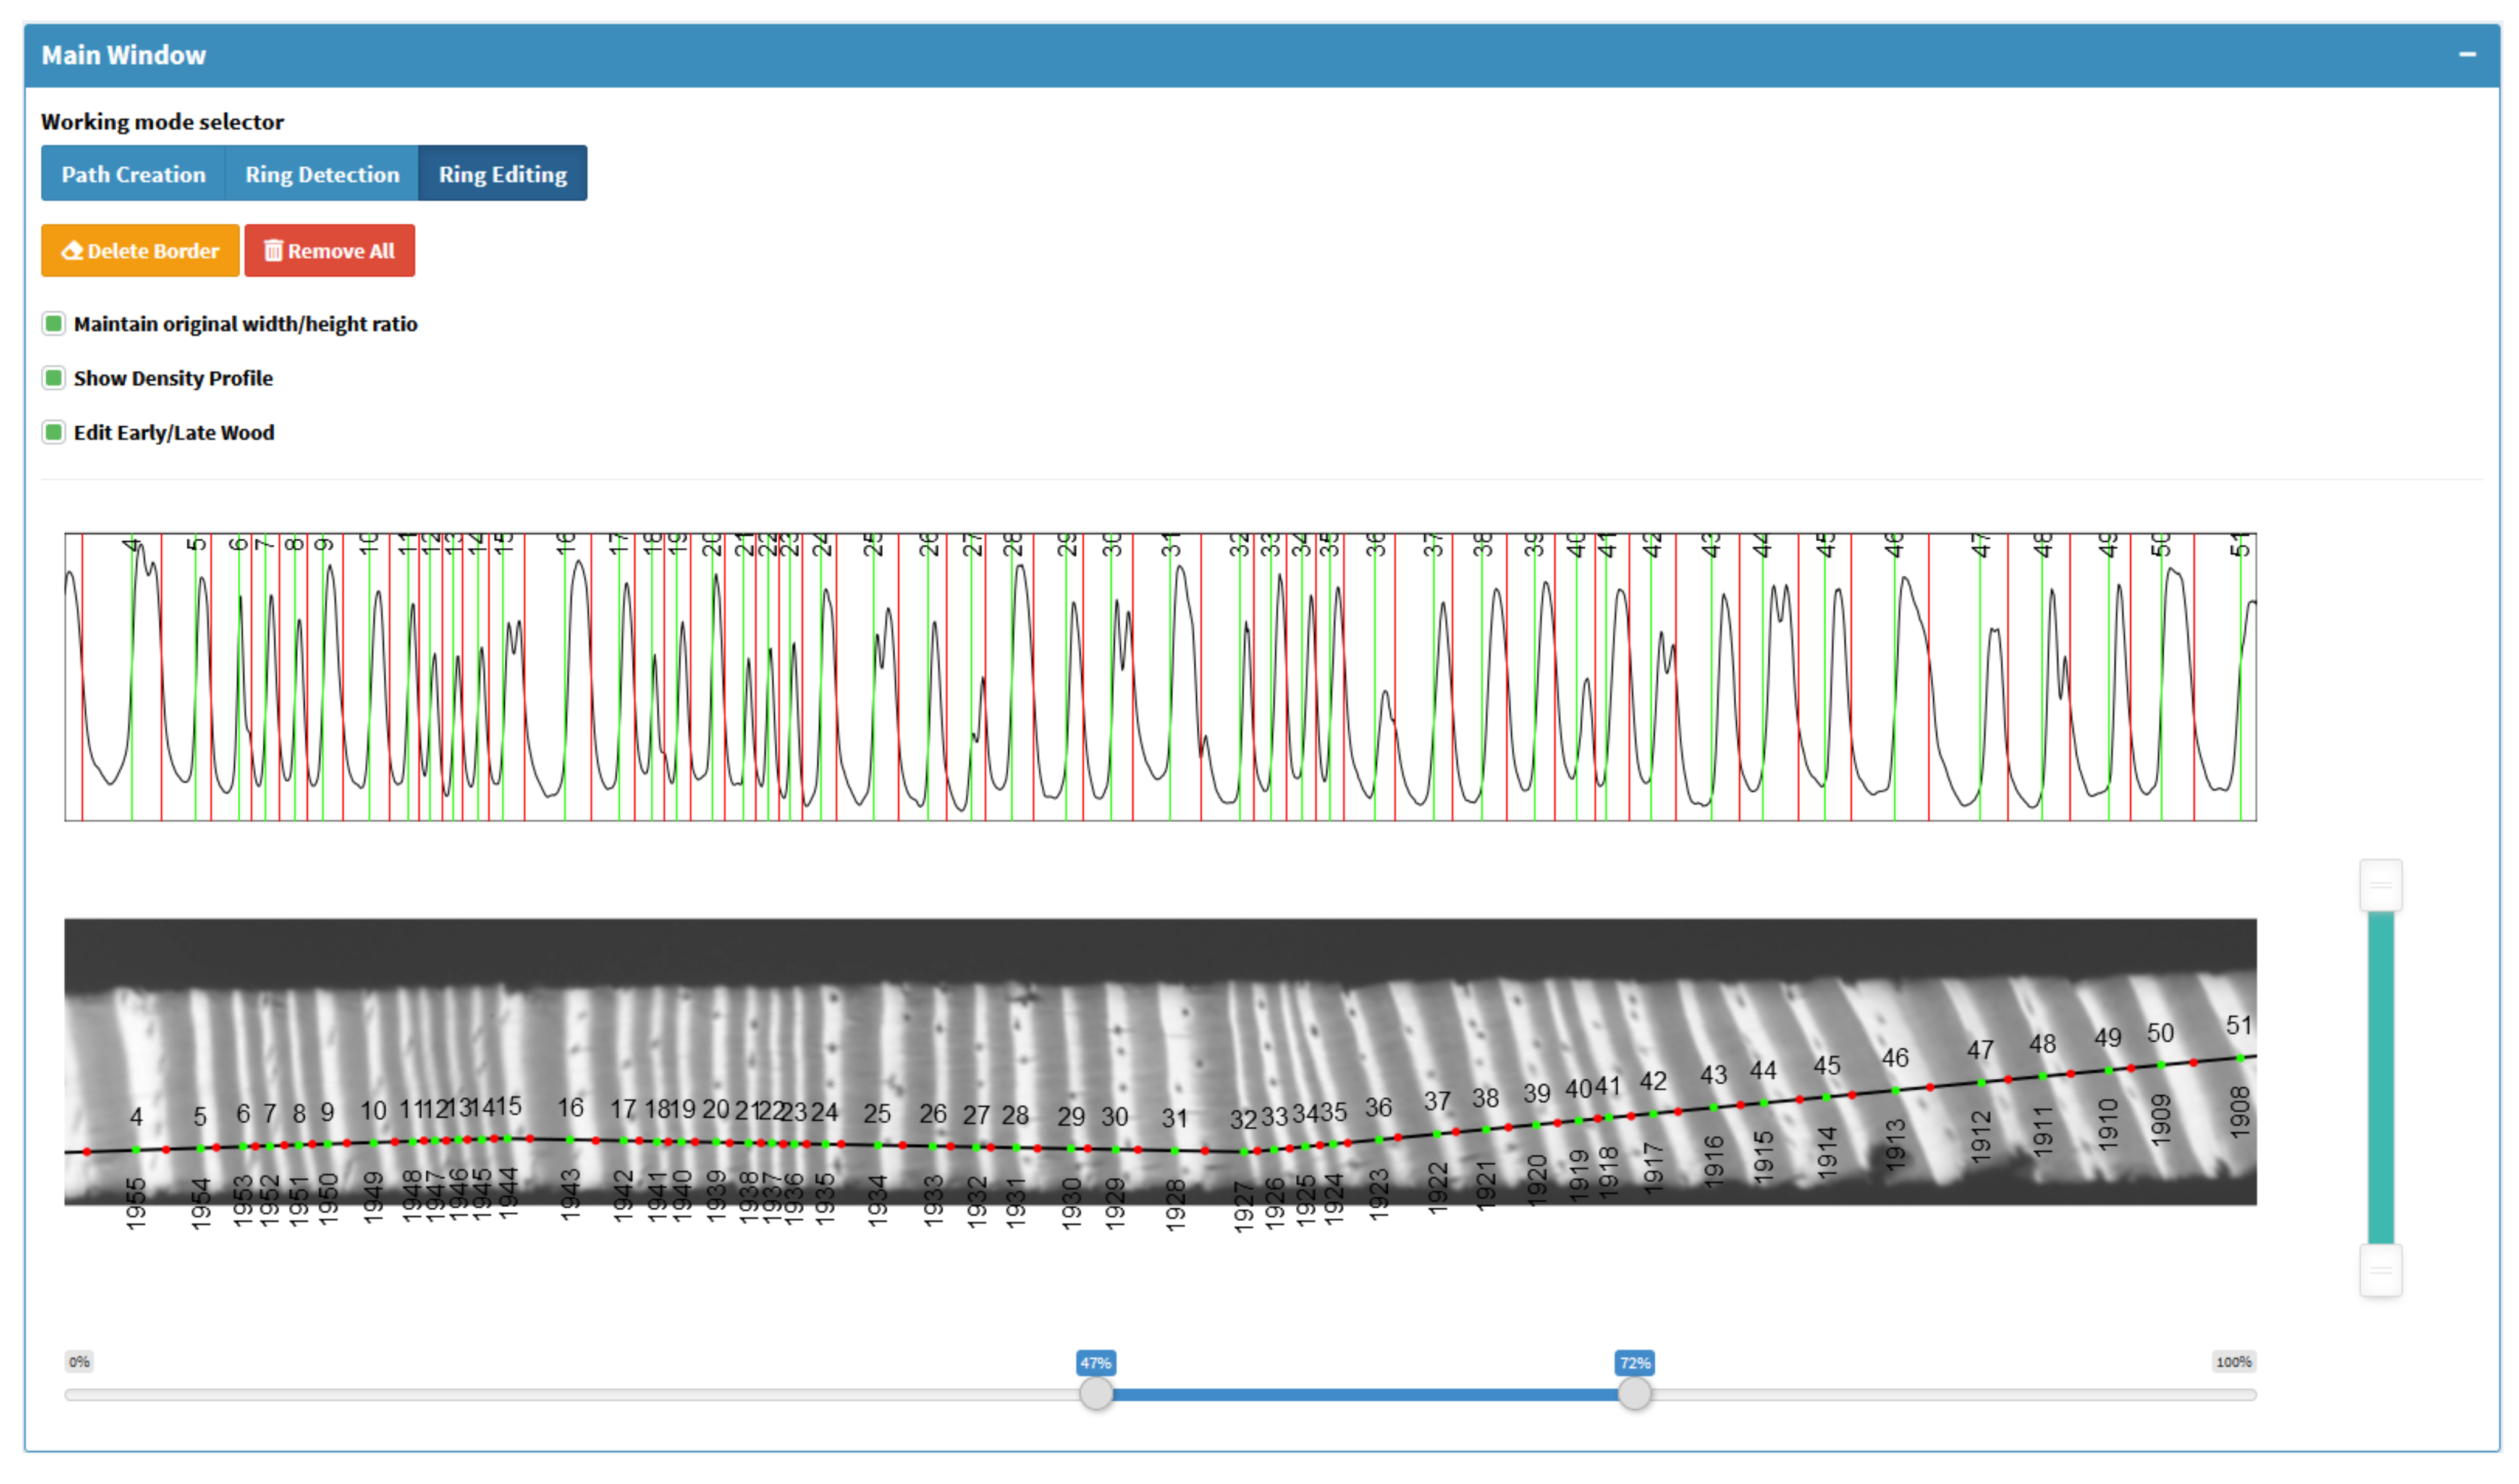
2.1.4. Ring Detection and Editing

The wood microdensity value is relevant at an inter-annual level, which depends on ring border segmentation. In the density profile, ring borders are commonly detected by a steep drop in the transition from latewood to earlywood of the most recent year [21]. ρ -MtreeRing allows automatic ring detection using the same detection algorithms as MtreeRing, which are two classic image processing methods such as watershed, and Canny edge detector, as well as measuRing linear detector [25]. However, to detect the rings with these methods in X-ray images, it is necessary to apply a pre-processing step consisting of the inversion of the gray values of the image, i.e., light pixels are mapped to dark, and dark pixels are mapped to light.
However, ring differentiation is never an easy task, mainly when transitions between late and earlywood density are not sharp enough to be detected. Once the automatic detection is launched in ρ -MtreeRing, ring borders are shown as dots in the real image and, in parallel, as division lines in the density profile. This simultaneous view enables the researcher to check if ring borders were properly detected or not at a glance. Additionally, the user can check and correct, if necessary, that automatic detection, adjusting ring limits on the sample image through an interactive mode with the mouse cursor.

2.1.5. Early and Latewood

Wood density information is meaningful not only at the inter-annual perspective but also in its intra-annual variations. For these studies, early and latewood must be discerned. Therefore, ρ -MtreeRing incorporates automatic identification and correction options for early-latewood based on the ring detection methods (watershed, Canny edge and measuRing). Thus, the user can select different methods for ring or early-latewood identification, Figure 2.

2.1.6. Exporting Results

Once the ring or early-latewood borders are set, the researcher can incorporate Optional Sample Information in the Results section related to location, species or lead researcher, inter alia. This kind of information associated with the specimen origin is, as an afterthought, compiled with the Sample Info required for the density analysis.
ρ -MtreeRing collects data of the microdensity analysis on an eight-column dataset according to the features of year, x and y position of the ring border, ring width, mean density value, intra-annual density standard deviation, and the maximum and minimum density. In the case of intra-annual studies, earlywood and latewood features are incorporated. It should be noted that the maximum and minimum density values exported correspond, respectively, to the average of 5% of the pixels with the highest and lowest density values in the region under analysis (e.g., earlywood, latewood). This is intended to reduce the effect of possible spurious pixels that could produce unusual density values. Meanwhile, the number of rows is equal to the number of years detected. All these values can be exported in a Comma Separated Values (CSV) format file or in Excel (XLSX) and, using dplR [32], Ring Width Length (RWL) files, which both include Sample Info for dendrochronological analysis.
Project exportation in R Data Format (RDS) allows to reopen the complete project in ρ -MtreeRing further on from the Data Loading section and modify the analysis at any of its steps.

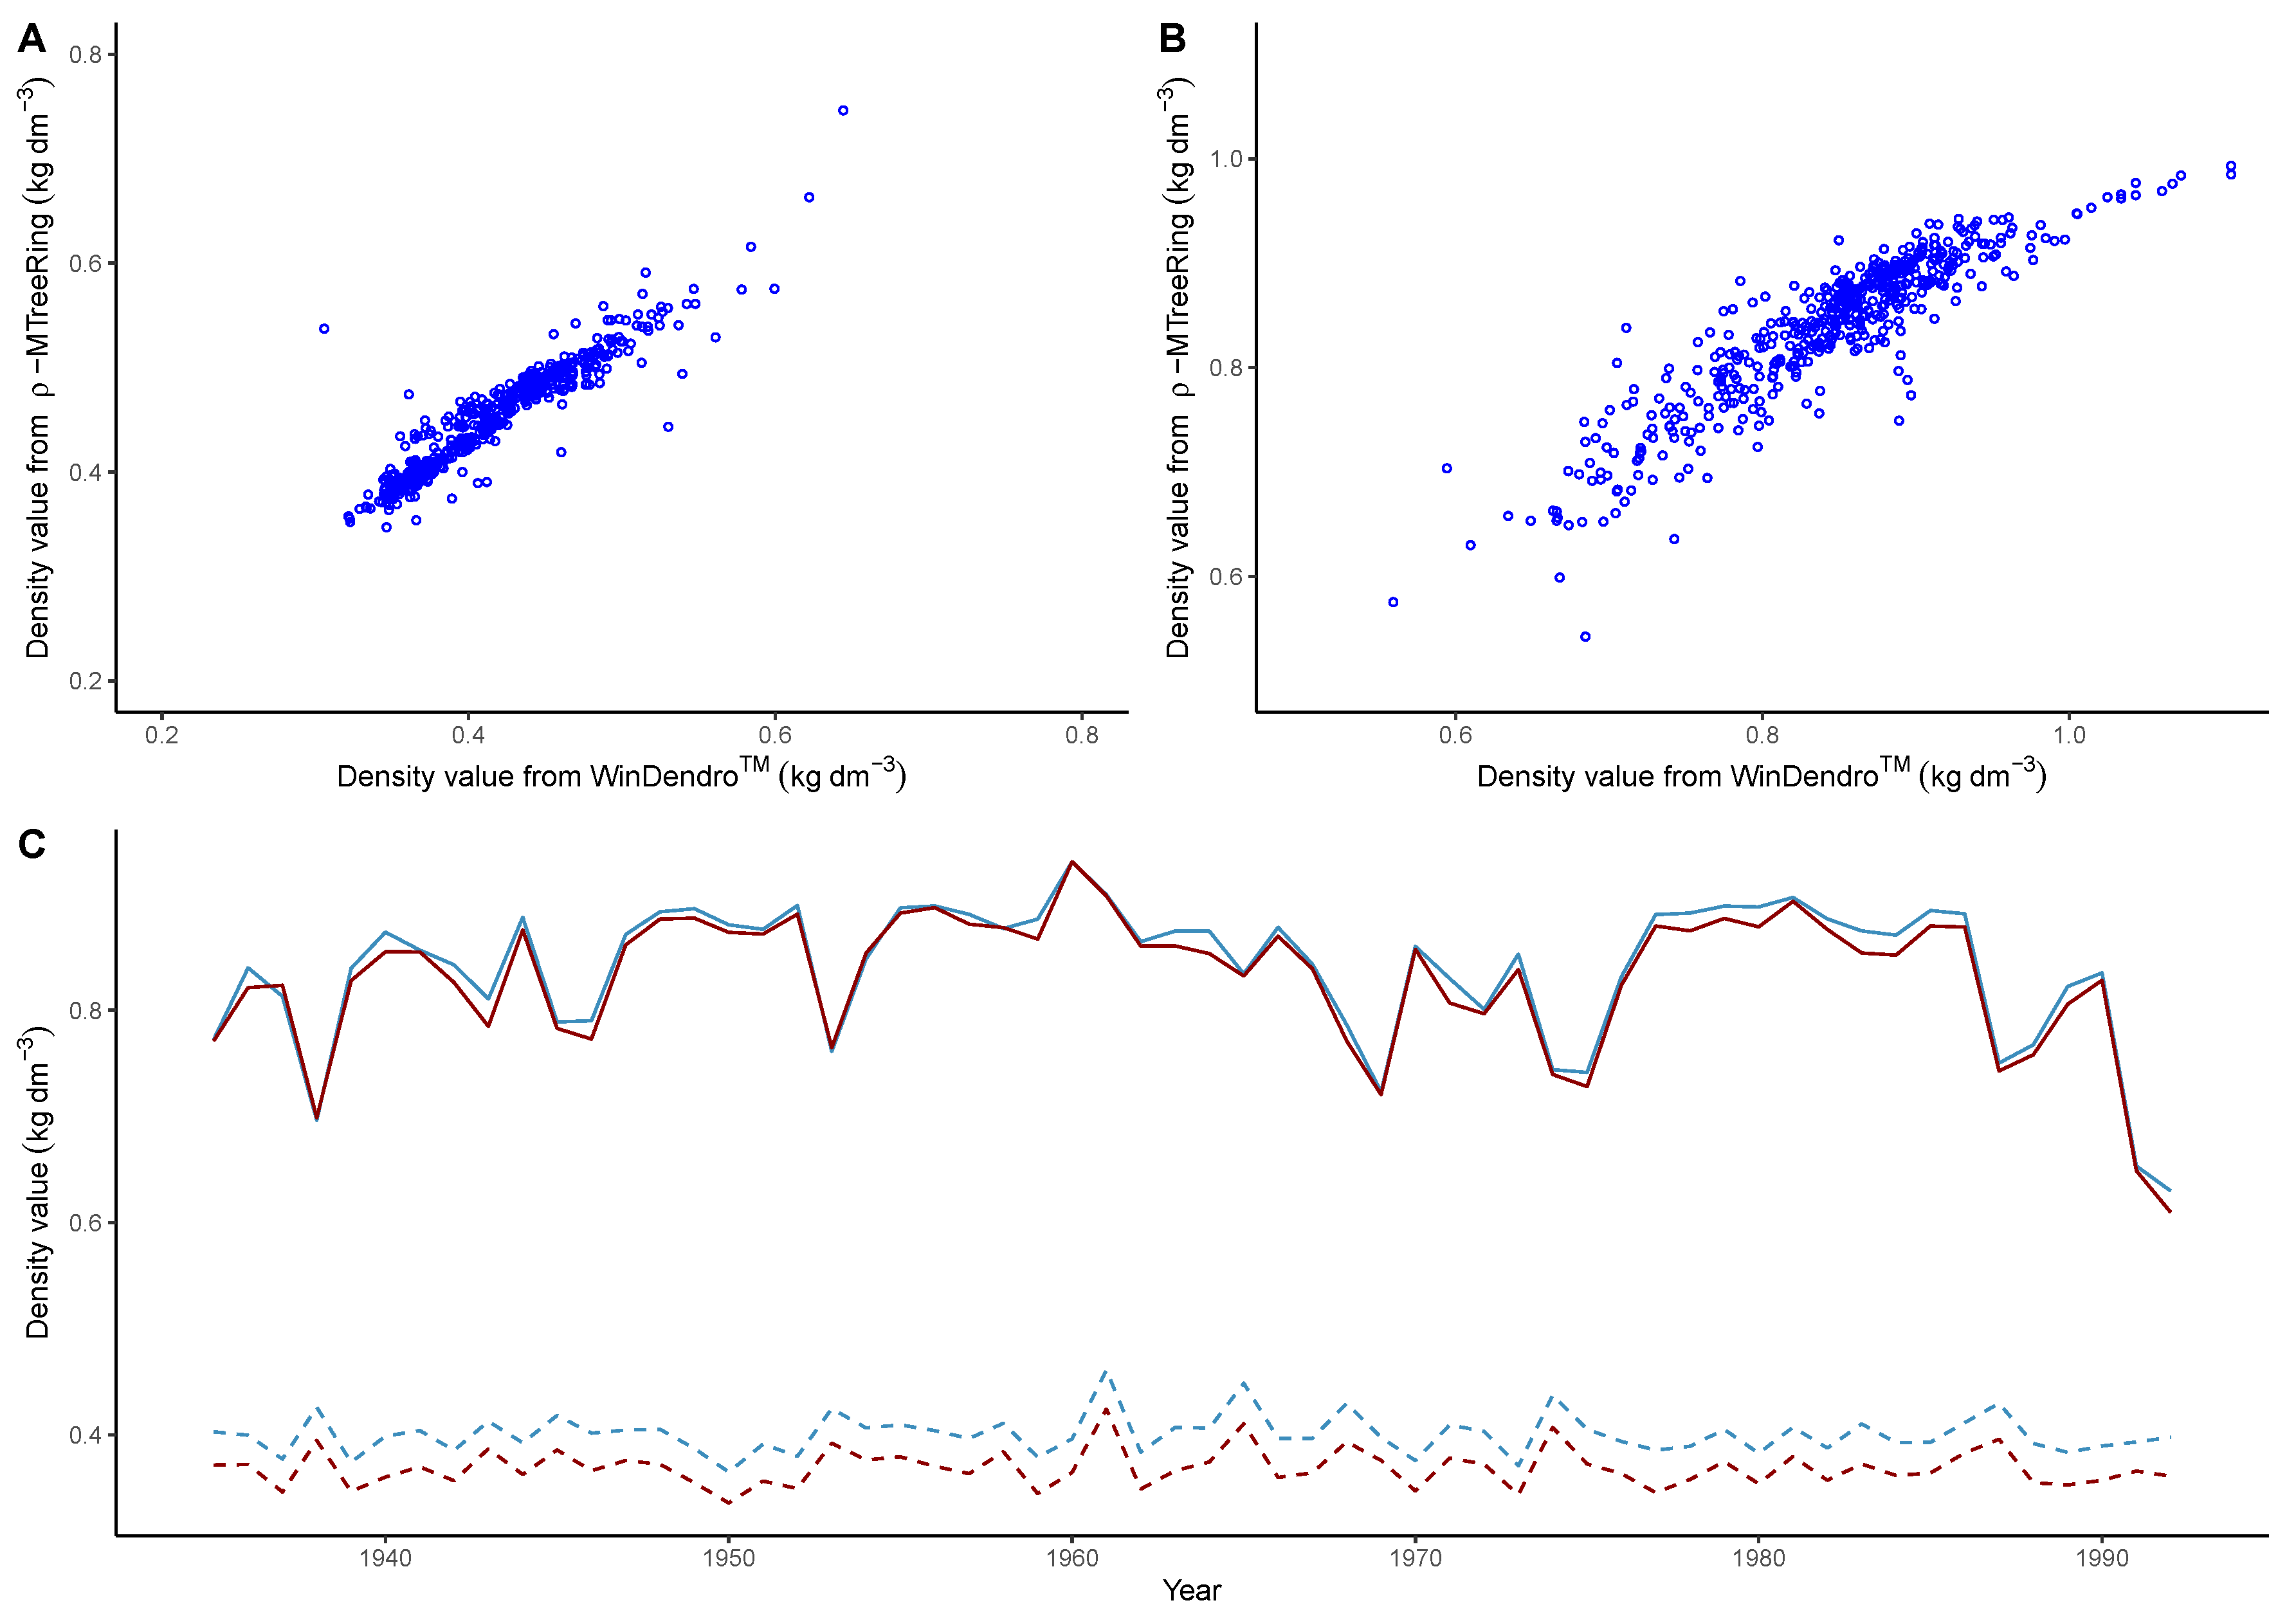
2.2. Comparison with Commercial Software

The ρ -MtreeRing effectiveness was checked based on WinDENDRO™ results. This is a widely used proprietary software, considered a robust tool for microdensity studies [33,34]. Wood cores were collected at breast height with a Pressler borer from six Austrian pines (Pinus nigra Arn.) in Sierra de Cazorla (Jaén, Spain) in the framework of a research project evaluating the variability in the climate response of this species. Pinus nigra is a circummediteranean mountain species with a remarkable longevity with strong potential for microdensity analysis [35]. Increment cores were air dried and sawed obtaining uniform cross-sections of 2 mm thickness. Furthermore, cross-sections were resin-extracted with a 72-h penthane bath and air dried before the X-ray film was obtained, according to Polge [16] procedures. Finally, X-ray films were scanned at 1000 dpi, obtaining digital images for further software analysis.
Individual images were analyzed independently with ρ -MtreeRing, according to the user manual (Supplementary Materials) at the Botany Lab of the University of Valladolid (Soria, Spain), and WinDENDRO™ at INRA GENOBOIS (Orleans, France), where the two density parameters were calculated at the ring level using routines written in R [24]. The calibration parameters selected were following standard procedures for each software, “spline” in WinDENDRO™ and “local regression” in ρ -MtreeRing. Two ring level density parameters were calculated: minimum ring density (Dmin, kg·dm−3), and maximum ring density (Dmax, kg·dm−3).

3. Results and Discussion

We analyzed a total of 529 rings from the six cores, obtaining minimum and maximum density values for each ring. The values obtained by ρ -MtreeRing and WinDENDRO™ were highly correlated for both parameters (maximum density r = 0.966, p < 0.0001; minimum density r = 0.962, p < 0.001), Figure 3A,B. Slight differences can be attributed to small disagreements in ring delimitation.
The curve value comparison in Figure 3C attests to subtle variations of density measurements between the ρ -MtreeRing and WinDENDRO™ output. Since minimum density value extraction is close to the lowest calibration limit, Figure 1, by extracting the mean of the 5% lowest values in each ring, ρ -MtreeRing minimizes the effect of extreme values. This results in slightly large minimum density values in ρ -MtreeRing, although it matches the same trajectory as the WinDENDRO™ output, Figure 3C. Maximum density results are extracted essentially from latewood. The wood samples present homogeneous and sufficient latewood that reflects robust density values in the light calibration curve, Figure 1. Consequently, the maximum density output is less sensitive to outliers, and both software outputs are almost identical, Figure 3C. Therefore, ρ -MtreeRing fulfills the same performance as WinDENDRO™.

4. Conclusions

ρ -MtreeRing is a user-friendly software for microdensitometry analyses from X-ray images. This free tool includes density calibration, rings, early and latewood detection, the editing process, data importation and exportation in different formats. Its friendly interface for the whole microdensity extraction process and the simultaneous display of the density profile and the original sample image streamlines the ring limit supervision and data extraction against other available software. Furthermore, ρ -MtreeRing has been tested through 80 hours of density profile extraction for bug detection resulting in a stable and reliable software. The software, as well as a complete manual (Supplementary Materials) with sample material, is provided on GitHub (https://github.com/CambiumRG/rhoMtreeRing) (accessed on 17 September 2021). As a GUI, ρ -MtreeRing allows its standard use by researchers not trained in programming; meanwhile, as a FOSS, it shatters economic barriers for this kind of tool and sets the scene for its evolution or customization according to different lab-specific requirements.

Supplementary Materials

The ρ -MtreeRing User Manual is available online at https://www.mdpi.com/article/10.3390/f1010000/s1.

Author Contributions

M.G.-H., Á.M.G.-P. and J.M.O. conceived the project; Á.M.G.-P., M.G.-E. and M.L.-S. developed the program; C.C.-S. obtained and processed the data used. M.G.-H., Á.M.G.-P. and J.M.O. wrote the manuscript draft. All authors have read and agreed to the published version of the manuscript.

Funding

This project was funded by Junta de Castilla y León, project OUTBREAK (VA171P20), the Spanish Ministry of Science, Innovation and Universities, grant number CGL2017-87309-P (MGH PRE2018-084106) and project PROWARM (PID2020-118444GA-I00). A. Garcia-Pedrero acknowledges the support of the UPM through Project RP200060107. M. Lillo-Saavedra thanks the support of CRHIAM (ANID/FONDAP/15130015).

Informed Consent Statement

Not applicable.

Data Availability Statement

The data presented in this study are available on request from the corresponding authors.

Acknowledgments

We thank Vicente Rozas, Maria A. García-López, Ana I. García-Cervigón and Gabriel Sangüesa-Barreda for checking the tool functions and their proposals for improvements. We appreciate the work of the developers of MtreeRing, XRing and dplR for their promotion of the free software that served as a basis for this work. We thank the three anonymous reviewers for their constructive comments on the previous of the manuscript.

Conflicts of Interest

The authors declare no conflict of interest.

Abbreviations

The following abbreviations are used in this manuscript:
FOSSFree Open Source Software
GUIGraphical User Interface
OSSOpen Source Software

References

  1. Cuny, H.E.; Rathgeber, C.B.; Frank, D.; Fonti, P.; Mäkinen, H.; Prislan, P.; Rossi, S.; Del Castillo, E.M.; Campelo, F.; Vavrčík, H.; et al. Woody biomass production lags stem-girth increase by over one month in coniferous forests. Nat. Plants 2015, 1, 1–6. [Google Scholar] [CrossRef] [PubMed]
  2. Olano, J.M.; Eugenio, M.; García-Cervigón, A.I.; Folch, M.; Rozas, V. Quantitative tracheid anatomy reveals a complex environmental control of wood structure in continental Mediterranean climate. Int. J. Plant Sci. 2012, 173, 137–149. [Google Scholar] [CrossRef] [Green Version]
  3. Fonti, P.; von Arx, G.; García-González, I.; Eilmann, B.; Sass-Klaassen, U.; Gärtner, H.; Eckstein, D. Studying global change through investigation of the plastic responses of xylem anatomy in tree rings. New Phytol. 2010, 185, 42–53. [Google Scholar] [CrossRef]
  4. Gärtner, H.; Schweingruber, F. Microscopic Preparation Techniques for Plant Stem Analysis; Verlag Kessel: Remagen, Germany, 2013. [Google Scholar]
  5. von Arx, G.; Carrer, M. ROXAS–A new tool to build centuries-long tracheid-lumen chronologies in conifers. Dendrochronologia 2014, 32, 290–293. [Google Scholar] [CrossRef]
  6. Zanne, A.; Westoby, M.; Falster, D.; Ackerly, D.; Loarie, S.; Arnold, S.; Coomes, D. Angiosperm wood structure: Global patterns in vessel anatomy and their relation to wood density and potential conductivity. Am. J. Bot. 2010, 97, 207–215. [Google Scholar] [CrossRef] [Green Version]
  7. von Arx, G.; Crivellaro, A.; Prendin, A.; Cufar, K.; Carrer, M. Quantitative Wood Anatomy—Practical Guidelines. Front. Plant Sci. 2016, 7, 781. [Google Scholar] [CrossRef] [PubMed] [Green Version]
  8. Björklund, J.; Seftigen, K.; Schweingruber, F.; Fonti, P.; von Arx, G.; Bryukhanova, M.V.; Cuny, H.E.; Carrer, M.; Castagneri, D.; Frank, D.C. Cell size and wall dimensions drive distinct variability of earlywood and latewood density in Northern Hemisphere conifers. New Phytol. 2017, 216, 728–740. [Google Scholar] [CrossRef] [Green Version]
  9. Björklund, J.; von Arx, G.; Nievergelt, D.; Wilson, R.; Van den Bulcke, J.; Günther, B.; Loader, N.; Rydval, M.; Fonti, P.; Scharnweber, T.; et al. Scientific merits and analytical challenges of tree-ring densitometry. Rev. Geophys. 2019, 57, 1224–1264. [Google Scholar] [CrossRef] [Green Version]
  10. Briffa, K.R.; Osborn, T.J.; Schweingruber, F. Large-scale temperature inferences from tree rings: A review. Glob. Planet. Chang. 2004, 40, 11–26. [Google Scholar] [CrossRef]
  11. Esper, J.; Büntgen, U.; Frank, D.C.; Nievergelt, D.; Liebhold, A. 1200 years of regular outbreaks in alpine insects. Proc. R. Soc. B Biol. Sci. 2007, 274, 671–679. [Google Scholar] [CrossRef] [Green Version]
  12. Arbellay, E.; Jarvis, I.; Chavardès, R.D.; Daniels, L.D.; Stoffel, M. Tree-ring proxies of larch bud moth defoliation: Latewood width and blue intensity are more precise than tree-ring width. Tree Physiol. 2018, 38, 1237–1245. [Google Scholar] [CrossRef] [PubMed] [Green Version]
  13. Cleaveland, M.K. Climatic Response of Densitometric Properties in Semiarid Site Tree Rings. In Tree-Ring Bulletin; Tree-Ring Society: Loveland, CO, USA, 1986. [Google Scholar]
  14. Camarero, J.J.; Rozas, V.; Olano, J.M. Minimum wood density of Juniperus thurifera is a robust proxy of spring water availability in a continental Mediterranean climate. J. Biogeogr. 2014, 41, 1105–1114. [Google Scholar] [CrossRef]
  15. Camarero, J.; Hevia, A. Links between climate, drought and minimum wood density in conifers. IAWA J. 2020, 41, 1–20. [Google Scholar] [CrossRef]
  16. Polge, H. The Use of X-ray Densitometric Methods in Dendrochronology. Tree-Ring Bulletin 1970. Available online: http://lfccsandclimatechange.pbworks.com/w/file/fetch/119858952/1%20X-%20Ray%20Densiometric%20method%20in%20Dendro.pdf (accessed on 12 September 2021).
  17. Schweingruber, F.H.; Fritts, H.C.; Bräker, O.U.; Drew, L.G.; Schär, E. The X-ray Technique as Applied to Dendroclimatology. In Tree-Ring Bulletin; Tree-Ring Society: Loveland, CO, USA, 1978. [Google Scholar]
  18. Instruments, R. WinDendro for tRee-Ring, Stem, Wood Density Analysis and Measurement. 2007. Available online: https://regentinstruments.com/assets/windendro_about.html (accessed on 10 August 2021).
  19. Larsson, L. CooRecorder and Cdendro programs of the CooRecorder. Cdendro Package Version 2014. Available online: https://www.cybis.se/forfun/dendro/prgintro/index.htm (accessed on 25 July 2021).
  20. Jevšenak, J.; Levanič, T. dendroTools: R package for studying linear and nonlinear responses between tree-rings and daily environmental data. Dendrochronologia 2018, 48, 32–39. [Google Scholar] [CrossRef] [Green Version]
  21. Campelo, F.; Mayer, K.; Grabner, M. xRing—An R package to identify and measure tree-ring features using X-ray microdensity profiles. Dendrochronologia 2019, 53, 17–21. [Google Scholar] [CrossRef]
  22. Campelo, F.; García-González, I.; Nabais, C. detrendeR—A graphical user interface to process and visualize tree-ring data using R. Dendrochronologia 2012, 30, 57–60. [Google Scholar] [CrossRef]
  23. Shi, J.; Xiang, W.; Liu, Q.; Shah, S. MtreeRing: An R package with graphical user interface for automatic measurement of tree ring widths using image processing techniques. Dendrochronologia 2019, 58, 125644. [Google Scholar] [CrossRef]
  24. R Core Team. R: A Language and Environment for Statistical Computing; R Foundation for Statistical Computing: Vienna, Austria, 2020. [Google Scholar]
  25. Lara, W.; Bravo, F.; Sierra, C. measuRing: An R package to measure tree-ring widths from scanned images. Dendrochronologia 2015, 34, 43–50. [Google Scholar] [CrossRef]
  26. Russ, J.C. The Image Processing Handbook; Scanning, New York and Baden Baden then Mahwah; CRC Press: Boca Raton, FL, USA, 1997; Volume 19, p. 60. [Google Scholar]
  27. Latte, N.; Beeckman, H.; Bauwens, S.; Bonnet, S.; Lejeune, P. A novel procedure to measure shrinkage-free tree-rings from very large wood samples combining photogrammetry, high-resolution image processing, and GIS tools. Dendrochronologia 2015, 34, 24–28. [Google Scholar] [CrossRef]
  28. Rigozo, N.R.; Nordemann, D.J.; Echer, E.; Vieira, L.E.A.; Prestes, A. An interactive method for digital tree-ring width measurement. Geofis. Int. 2004, 43, 281–285. [Google Scholar]
  29. Chang, W.; Cheng, J.; Allaire, J.; Xie, Y.; McPherson, J. Shiny: Web application framework for R. R Package Version 2017, 1. Available online: https://shiny.rstudio.com/ (accessed on 6 September 2021).
  30. Shi, J.; Xiang, W. MtreeRing: A Shiny Application for Automatic Measurements of Tree-Ring Widths on Digital Images. R Package Version 1.4.2. 2019. Available online: https://docs.ropensci.org/MtreeRing/ (accessed on 7 July 2021).
  31. Jacquin, P.; Longuetaud, F.; Leban, J.M.; Mothe, F. X-ray microdensitometry of wood: A review of existing principles and devices. Dendrochronologia 2017, 42, 42–50. [Google Scholar] [CrossRef]
  32. Bunn, A.G. A dendrochronology program library in R (dplR). Dendrochronologia 2008, 26, 115–124. [Google Scholar] [CrossRef]
  33. Reinig, F.; Gärtner, H.; Crivellaro, A.; Nievergelt, D.; Pauly, M.; Schweingruber, F.; Sookdeo, A.; Wacker, L.; Büntgen, U. Introducing anatomical techniques to subfossil wood. Dendrochronologia 2018, 52, 146–151. [Google Scholar] [CrossRef]
  34. Alves, A.; Hevia, A.; Simões, R.; Majada, J.; Alia, R.; Rodrigues, J. Improving spatial synchronization between X-ray and near-infrared spectra information to predict wood density profiles. Wood Sci. Technol. 2020, 54, 1151–1164. [Google Scholar] [CrossRef]
  35. Sangüesa-Barreda, G.; Esper, J.; Büntgen, U.; Camarero, J.J.; Di Filippo, A.; Baliva, M.; Piovesan, G. Climate–human interactions contributed to historical forest recruitment dynamics in Mediterranean subalpine ecosystems. Glob. Chang. Biol. 2020, 26, 4988–4997. [Google Scholar] [CrossRef] [PubMed]
Figure 1. Light Calibration configuration. On the left, density and gray values from stepped calibration wedge and selection of the regression mode. On the right, graphic representation of known density data and its local regression curve.
Forests 12 01405 g001
Figure 2. Working screen of ρ -MtreeRing. Full X-ray image and density profile can be visualized simultaneously with zooming options (below and right bars). Ring limits are shown with red dots and early-latewood transition in green. Limits can be deleted and located using the Ring Editing function.
Forests 12 01405 g002
Figure 3. Comparative results of WinDENDRO™ and ρ -MtreeRing. (A) Value comparison for minimum density (r = 0.962) and (B) for maximum density (r = 0.966). (C) Comparison of maximum (solid line) and minimum (dashed line) density values extracted from one of the measured series using WinDENDRO™ (red) and ρ -MtreeRing (blue) with a path of 8-pixel width.
Forests 12 01405 g003
Publisher’s Note: MDPI stays neutral with regard to jurisdictional claims in published maps and institutional affiliations.

