Article

Influence of Soil Properties on P Pools and Its Effect on Forest Productivity in Mediterranean Calcareous Soils

by
Ruth C. Martín-Sanz
1,2,*,
Valentín Pando
1,3,
Teresa Bueis
1 and
María-Belén Turrión
1,4
1
Sustainable Forest Management Research Institute (UVa-INIA), 34004, Palencia, Spain
2
Forest Research Centre (INIA, CSIC), Crta. La Coruña, km 7.5, 28040, Madrid, Spain
3
Departamento de Estadística e Investigación Operativa, E.T.S. Ingenierías Agrarias, Universidad de Valladolid, 34004, Palencia, Spain
4
Departamento de Ciencias Agroforestales, E.T.S. Ingenierías Agrarias, Universidad de Valladolid, 34004, Palencia, Spain
*
Author to whom correspondence should be addressed.
Forests 2021, 12(10), 1398; https://doi.org/10.3390/f12101398
Submission received: 24 August 2021 / Revised: 23 September 2021 / Accepted: 4 October 2021 / Published: 14 October 2021
(This article belongs to the Special Issue Forest Soil Properties and Nutrient Dynamics under a Semiarid Climate)

Abstract

:
Although soil phosphorus is essential for vegetation growth it is not always found in labile forms, hampering its absorption by plants, and is limited in forest ecosystems. This study explores soil P state and availability in calcareous soils, determining which processes affect its different pools and which soil parameters influence forest productivity of a Mediterranean pine species. We used a sequential fractionation method to determine P fractions in the soil according to their lability and their organic or inorganic nature. Those fractions were related to different soil and climatic parameters and to the site index in 32 Pinus halepensis plots of the National Spanish Forest Inventory. Soil texture, carbonates content, water retention capacity and organic matter substantially affected P fractions in the calcareous soils studied. Membrane extractable P was mainly influenced by organic matter-related parameters while the predominant P fraction in these soils, the primary P, was linked to the carbonates content. The biological mineralization processes played a key role in the soil P cycle. Total P, carbonates content, soil texture and water availability drove forest productivity in the studied plots.

1. Introduction

Phosphorus is essential for life as it is involved in many vital processes in organisms [1]. Soil available P is usually low in terrestrial ecosystems [2] and is considered one of the most limiting nutrients for plant growth and thus, for forest productivity ([3,4] among others). Although there is abundant total P in the soil, it is not always found in available forms due to its low solubility, strongly dependent on the pH of the soil, its slow diffusion, and its high fixation in soils, hindering its absorption by plants.
During decomposition of plant residues, microorganisms release P via mineralization, and capture P via immobilization, controlling the transformations of this element between organic and inorganic forms and forming a biological subcycle in the general cycle of soil P [5,6]. On the other hand, precipitation–dissolution and adsorption–desorption processes control the abiotic transfer of P between the solid phase and the soil solution [5,7].
Organic matter is key for soil structure and for the regulation of nutrients quantity and cycles [8], thus playing a major role in the availability of P in forest soils. Organic matter is a direct source of P organic forms that are transformed into available P forms for vegetation through the mineralization and the release of microbial biomass [3,9]. Soil microbial activities produce different enzymes, including phosphatase, which can substantially affect the transformation of P organic forms into inorganic or more labile and soluble P forms.
Rainfall and temperature highly affect the mineralization and immobilization rates in the soil, as well as soil moisture which is also key for phosphatases production and for microorganisms’ survival [10,11,12]. The mineralization–immobilization processes and the different P pools are also influenced by soil pH in contrasting ways [11,13,14,15]. Additionally, the parent material, the pedogenesis and the resulting soil type (order), as well as soil texture, affect the fractionation, transformations and distribution of P [11,16,17].
Numerous studies have indicated that current climate change leads to an increase in N depositions and an increase in summer droughts causing nutritional imbalances and P deficiencies in ecosystems, making these changes more pronounced in the Mediterranean areas [18,19,20]. For this reason, and although general processes involved in the biochemistry and availability of P are well known, it is necessary to clarify which soil parameters mostly affect each process both in specific ecosystems, mainly in Mediterranean ones, and in different types of soil [21].
Pinus halepensis Mill. has a wide natural distribution throughout the Mediterranean region, thus inhabiting a wide variety of bioclimates [22]. Due to its high tolerance to drought stress and its low nutrient demand, this species has been extensively used in afforestation targeting ecological restoration and soil erosion reduction.
Some studies found that forest productivity of P. halepensis in natural stands and plantations under different environmental conditions was closely related to the availability of water [23,24] and the amount of organic matter or elements such as nitrogen, magnesium, or potassium [25]. However, these studies did not consider the availability and state of soil phosphorus as a factor that can affect forest productivity. On the other hand, P bioavailability is regulated by the interaction between different P fractions [26,27] and progresses over time in such a way that the available P at a given time may be low, but in the long term, all soil P might become labile [28]. Thus, in soils poor in P, plants can obtain P in more recalcitrant forms through various strategies [15,29] such as through the exudation of organic anions and phosphatases from the roots that increase desorption, solubilization, or mineralization of P from sources of low availability in the soil, among other mechanisms [30,31,32]. Consequently, determining the dynamics and bioavailability of P requires the separation and identification of the different pools of P in the soil [26,27]. For this, we used the sequential fractionation method of P from [33] modified by [34]. This method is widely used for characterizing forms of P differing in their availability for plants and microorganisms and participating in short and long-term transformations in the soil [1,17,27]. Therefore, the procedure enables distinguishing between soil Porg associated with humic and organic compounds that are easily mineralized by microbes and soil Ping retained by chemisorption [35].
Our objectives were (1) to evaluate soil P status and availability in calcareous soils under Mediterranean pine plantations, (2) to assess which soil processes are affecting the different soil P pools and which are driving P availability, and (3) to determine which soil parameters are influencing forest productivity of the studied stands and whether soil P availability is leading this productivity. We hypothesized that (1) there is a relationship between the membrane extractable P in the studied soils and other labile or non-labile P fractions, (2) soil parameters related to organic matter and carbonates content are the most determining factors for P availability in the calcareous soils studied, and (3) forest productivity in the P. halepensis plantations studied is mainly related to P availability and organic matter-related parameters.

2. Materials and Methods

2.1. Study Area

This study was carried out with soils sampled in 32 plots belonging to the Spanish National Forest Inventory (SNFI) and located in pure P. halepensis plantations. These stands are in the Castilla y León region (northern half of Spain; Table S1). The main characteristics of these plots are presented in Table 1. Lithology was composed of limestone and marl. Soils showed basic pH (from 8 to 8.9) with clay–loam texture and were classified as Calcixerepts within the Inceptisol order.

2.2. Soil Sampling

The first 10 cm of mineral topsoil were sampled in the 32 P. halepensis plots [36] following the method of [37]. Only those first 10 cm of soil were sampled as this layer is the fertile soil and the environmental changes are more strongly reflected there. At each plot, four points located 5 m from the center of the plot were sampled (in N, S, E, and W directions). This sampling method allows obtaining representative samples which reflect the soil variability. At each of these points, one disturbed soil mineral sample was taken. The four disturbed samples from each plot were lumped together to attain a composite mineral soil sample per plot (for more details on soil sampling see [36]. Disturbed soil mineral samples were air-dried and sieved (2 mm) before laboratory analyses (done in duplicate).

2.3. Phosphorus Fractionation

Phosphorus sequential fractionation was carried out following the method developed by [33] and modified by [34]. This fractionation was designed to remove progressively less available P with each subsequent soil extraction. It is useful to separate plant-available or labile forms of P from several refractory P pools in soils (Figure 1). Furthermore, with this procedure, the organic and inorganic P fractions can be differentiated, which is key to understanding the P cycle in forest soils. The first fraction extracted with anion exchange membranes (PAEM) corresponds to the readily exchangeable inorganic P and that which is easily dissolved from solid phases in the soil [34,38]. Then, sequential extractions were carried out on the residue of this first extraction with progressively stronger extractants. The following extraction was performed with 0.5 M NaHCO3, to determine the highly labile P adsorbed in the soil exchange complex, which can be easily transformed into available forms [39,40]. Using basic extractants such as NaHCO3 or NaOH, used in the next step of the fractionation, implies the extraction of organic and inorganic forms of P. The moderately labile P strongly retained by chemisorption [40], was determined by the extraction with 0.1 M NaOH. This P fraction is thought to be associated with the surface of amorphous and some crystalline Al and Fe minerals and is probably available in the mid-term. Aliquots of NaHCO3 and NaOH extracts were acidified to precipitate extracted organic matter, and inorganic P was determined in each of the supernatants. Total P of these extracts was determined after digestion with sulfuric acid and persulfate in an autoclave at 120 °C [41]. Organic P in each extract was calculated as the difference between total and inorganic P. Moreover, for determining the highly and moderately labile P fractions, active carbon was needed to remove the humic substances before determining the inorganic P of each fraction. The inorganic primary P (PHCl1M) was extracted with 1 M HCl. This fraction has low solubility and might be formed by the inorganic P included in Ca primary minerals [7,40]. Finally, the procedure extracts the most recalcitrant fractions which are the stable and the residual P. These fractions are derived from non-alkali-extractable organic debris [34]. On one hand, the stable P (PHClconc) was obtained by the extraction with concentrated HCl at 90 °C in a water bath and corresponds with P bound in the interior of Fe and Al minerals and apatite [34]. On the other hand, the residual P (PHClO4) was extracted with HClO4 and digested at 230 °C and represents the most stable form of P that is available only in the long term [42]. For P determination in the extracts obtained, the method by [43] modified by [44] was applied, using an ultraviolet/visible spectrophotometer Thermo Genesys 20. Analytical determinations were performed in duplicate on all soil samples.

2.4. Soil Parameters

The studied soils have been characterized by the analysis of a high amount of physical, chemical, and biochemical soil parameters (see [12,25,45], for more information on the analyses). We extracted soil parameter data for this study from two databases in [46,47]. We discarded some soil parameters because they were obtained as ratios of other selected parameters, thus providing redundant information, such as the ratio of total organic carbon to total nitrogen or the available soil water (the quotient of field capacity and permanent wilting point). We also discarded the sand and silt content according to international criteria (ISSS) since we used USDA criteria because the particle size considered in this second criterion has greater ecological significance. Considering that the high number of soil parameters selected (32 parameters) and the number of plots studied (n = 32) can greatly hinder the statistical study, the soil parameters were clustered into five groups related (1) to soil physical fertility, (2) chemical fertility, (3) soil organic matter, (4) soil composition and (5) soil enzymatic activity (Table 2 and Table S2).

2.5. Forest Productivity

Forest productivity was estimated using the site index (dominant height at a reference age) which is strongly correlated with wood production [48]. We used the site index estimated by [25] for the same Pinus halepensis plots studied here.
Although our objective was to study the effect of soil P availability and status on forest productivity of the studied stands, we also included all the soil parameters studied in this work and some climatic variables, since they are usually important in explaining site indexes. Climatic variables were selected based on previous studies of forest productivity of this species and other similar species [24,36] indicating as climatic variables that most affect forest productivity those related to water availability. For this reason, the Lang index [49], and the annual water index following Thornthwaite [50] have been included in this analysis (data obtained from [47]). Both indexes classify the area as arid/sub-humid.

2.6. Statistical Analysis

To determine the relationships between P fractions, Spearman’s correlation coefficients (achieved with the Hmisc package in R software; [51]) were calculated, and principal component analysis (PCA) was performed (in R: prcomp). To evaluate the relationships between P fractions and groups of soil parameters we used Spearman’s correlation coefficients and canonical correlation analysis (CCA), performed using CCA and CCP packages in R [52,53]. Therefore, canonical correlation analyses were used to explore the joint association between P fractions and soil parameters related to (a) physical fertility, (b) chemical fertility, (c) soil composition, (d) organic matter and (e) soil enzymatic activity. Kaiser’s Measure of Sampling Adequacy (in R: KMO; psych package; [54]) was calculated to test whether the sample size was adequate or not for CCA [50]. This test varies from 0 to 1 and indicates the degree to which each variable in a set is predicted without error by the other variables. Lastly, we used general partial least squares regression (PLS; in R: plsr from the pls package; [55]) to study the relationship between site index, P fractions, soil parameters and climatic variables. PLS is a multivariate statistical technique that combines principal component analysis (PCA) and multiple linear regression which allows us to explain both the variability of the matrix of independent variables and the vector of the dependent variable. PLS is particularly useful when the number of predictor variables is greater than the number of observations and when there are many highly related explanatory variables [56]. Before performing all the analyses, the studied variables were tested for linearity, outliers, and normality (in R: shapiro.test), and those variables not normally distributed were transformed (Table S2). Statistical analyses were performed with R software [57].

3. Results

3.1. Soil Phosphorus Fractionation

The studied soils showed a mean total P content of 289 mg/kg, varying between 116 and 611 mg/kg. Organic P represented around 12% of the Ptotal (Table 3). As expected, the primary P fraction was the biggest fraction in the soils studied followed by the stable P fraction (Table 3). The primary P includes P forms in primary Ca minerals, accounting for 47% of total P. Stable P accounted for more than 27% of total P. The smallest P fraction in these soils was the membrane extractable P or readily exchangeable P fraction that accounted for 1.2% of total P.
In the principal component analysis of P fractions, three principal components accounted for 74% of total variance. The first principal component was mainly positively correlated to the organic highly labile P fraction, the second principal component was positively correlated to the stable P fraction and the third principal component was positively correlated to the primary forms of P Figure 2 and Table S3).
According to the Spearman’s correlations among all P fractions, the membrane extractable P was positively correlated to the inorganic highly labile P (Spearman rho = 0.47, p = 0.007) and to the organic moderately labile P (rho = 0.54, p = 0.001). The organic highly labile fraction was significantly correlated with the organic moderately labile P (and with the stable P fraction (rho = 0.39; p = 0.027). The highest positive significant correlations were found between the inorganic moderately labile P and the primary P forms (rho = 0.60, p < 0.000) and between the stable and the residual P forms (rho = 0.69, p < 0.000). Besides, total P was only significantly related to the inorganic moderately labile P, the primary P and the stable P (rho = 0.44, p = 0.012, rho = 0.82, p < 0.000 and rho = 0.49, p = 0.005, respectively).

3.2. Relationship between P Fractions and Soil Parameters

3.2.1. P Fractions and Soil Composition Parameters

In the canonical correlation analysis performed on P fractions in relation to soil composition parameters, we firstly included six parameters (see Table 2), but the Kaiser’s Measure of Sampling Adequacy (MSA) was 0.40 and thus, this analysis was not considered statistically acceptable. Therefore, we decided to eliminate one parameter related to soil texture (i.e., clay, silt, or sand content). Clay content was highly correlated to silt content (r = −0.66, p < 0.000), while it was not significantly correlated to sand content (r = 0.06, p = 0.732). Silt and sand contents were also highly significantly correlated (r = −0.74, p < 0.001). Thus, we decided to keep in the analysis the clay percentage and we checked the individual MSA for silt content and the individual MSA for sand content trying to discard one of these two variables. As the MSA of sand was higher than that of silt (0.39 and 0.38, respectively) we discarded silt content in the analysis. Clay and sand contents give good information about soil texture. The Kaiser’s Measure of Sampling Adequacy without silt content (MSA = 0.60) indicated that the analysis was statistically acceptable. So, this CCA was performed using five soil parameters related to soil composition: percentage of clay, percentage of sand according to USDA criteria, carbonates, active carbonates, and gypsum content. Two canonical dimensions were significant (Wilk’s lambda; p < 0.001 and p = 0.002, apiece) and presented correlations of 0.87 and 0.81, respectively. The first canonical dimension was mainly influenced by the sand content (r = 0.97) and the primary P (r = −0.91). The second canonical dimension was negatively correlated to carbonates (r = −0.77), active carbonates content (r = -0.69) and the inorganic highly labile P (r = −0.54) and was positively correlated to the residual P (r = 0.54, Figure 3 and Table S4).
Clay content was positively correlated with the residual P but negatively with the membrane extractable P (Table 4). Sand content was highly negatively correlated with the primary P and the inorganic moderately labile P, and carbonates content was negatively correlated with residual P (Table 4).

3.2.2. P Fractions and Soil Physical Fertility Parameters

The first canonical dimension in the canonical correlation analysis of P fractions and physical fertility-related parameters was significant according to Wilk’s lambda test (p < 0.001) with a canonical correlation of 0.89. Kaiser’s Measure of Sampling Adequacy (MSA) was 0.63 and, therefore, this analysis was considered statistically acceptable. The first canonical dimension was negatively correlated to field capacity, permanent wilting point, soil porosity, and to all P fractions, and it was just positively related to bulk density (Figure 4 and Table S5).
Strong positive correlations between primary P forms and field capacity and permanent wilting point were found (Table 5). The inorganic moderately labile P fraction and the membrane extractable P were also positively correlated with the previously referred soil parameters. Porosity only showed significant correlations with the inorganic highly labile P fraction and was the parameter least correlated with the first canonical root in the CCA. Bulk density was significantly and negatively related to the membrane extractable P and to the inorganic highly labile fraction, respectively.

3.2.3. P Fractions and Soil Chemical Fertility Parameters

The canonical correlation analysis (CCA) between the P fractions and soil chemical fertility-related parameters produced two canonical dimensions that captured significant relationships between the two data sets (r = 0.95, p < 0.001 and r = 0.92, p = 0.011, respectively). Kaiser’s Measure of Sampling Adequacy (MSA) was 0.61 and, therefore, this analysis was considered statistically acceptable. For the chemical fertility-related parameters, the first canonical dimension was most strongly influenced by the reciprocal cation exchange capacity (1/CEC; r = 0.81) and the second canonical dimension by the available manganese (r = −0.72), followed by the reciprocal of the available iron (1/Fe; r = 0.62) and the exchangeable magnesium (r = 0.61). For the P fractions, the first dimension was mainly correlated to the membrane extractable P (r = −0.63) and to the organic highly labile P (r = −0.59), and for the second dimension, the primary forms of P were dominant (r = 0.87; Figure 5 and Table S6).
According to the Spearman’s correlations between P fractions and soil parameters related to chemical fertility (Table 6), the most labile P forms were positively correlated with the cation exchange capacity and with the amount of available manganese. Moreover, the readily exchangeable P extracted with membranes was also positively correlated with the exchangeable potassium. Organic highly labile P fraction was also positively correlated with the amount of available zinc and iron, as was the residual P. Organic moderately labile P was also positively related to the cation exchange capacity, available zinc and exchangeable potassium. Inorganic moderately labile P was negatively correlated with the available manganese and positively with the exchangeable magnesium, as the primary P fraction that was also positively related to pH and negatively to available iron.

3.2.4. P Fractions and Organic Matter Parameters

A biplot of the first two dimensions of the CCA analysis based on P fractions and soil organic matter variables is shown in Figure 6. The explained correlations are 0.92 (p < 0.001) and 0.81 (p = 0.041) for the first and the second canonical correlation, respectively. Kaiser’s Measure of Sampling Adequacy (MSA) was 0.78 and thus, this analysis was considered statistically acceptable. The first canonical dimension (Figure 6 and Table S7) was negatively correlated with all the organic matter-related parameters considered, as well as with all P fractions except to the inorganic moderately labile P and with the primary P, two fractions strongly related to each other. The second canonical dimension was mainly negatively influenced by the easily oxidizable C and the microbial biomass N, and positively by the most recalcitrant P forms (stable and residual P).
We found strong correlations between the membrane exchangeable P and all organic matter-related parameters (Table 7). These correlations were all positive. The stable and residual P forms were just positively correlated to total nitrogen, but the primary P form did not show any significant correlation.

3.2.5. P Fractions and Soil Enzymatic Activity

The first canonical dimension in the canonical correlation analysis based on P fractions and soil enzymatic activity–related variables was significant (Wilk’s lambda test; p < 0.001) and its canonical correlation was 0.93. Kaiser’s Measure of Sampling Adequacy (MSA) was 0.65 and, therefore, this analysis was considered statistically acceptable. The canonical dimension was negatively influenced by all the soil enzymatic activity parameters (Figure 7 and Table S8). Besides, most of the phosphorus fractions were negatively correlated with the first canonical dimension except the inorganic moderately labile P and the primary P.
As expected, strong significant correlations were found between soil parameters related to enzyme activity and the most labile and plant-available phosphorus fractions (Table 8). The primary, stable and residual P fractions did not show significant correlations with these soil parameters, as well as the inorganic moderately labile P fraction (highly related to the primary P).

3.3. Relationship between Forest Productivity, Soil P Fractions and Soil Parameters

In order to study the importance of the soil parameters considered in the productivity of P. halepensis stands a PLS analysis was performed. The PLS analysis included the site index as the response variable and all the soil parameters, all the phosphorus fractions and two climatic variables related to water availability as predictive variables. The PLS resulted in the selection of two components that explained 67.5% of the variation of the site index (Table S9). These results showed that the first component was mostly related to the composition of the soil (carbonates, active carbonates and soil texture explained 87.8% of the component variance). Soil pH and the permanent wilting point (PWP) were also important variables in this component as well as the primary P fraction (Table S10). Component 1 only used 11.4% of information from predictors and was able to predict 35.9% of site index variability. The second component of the PLS was associated with variables related to soil water (and soil chemical fertility (25.2% of the component variance; Table S10). Although climatic variables did not explain a high percentage of the variation in any of the two components, they did substantially improve the site index variation explained by the model (67.5% compared to 47.7% without the climatic variables), remaining also the results regarding to the most influential variables in each component (data not shown).

4. Discussion

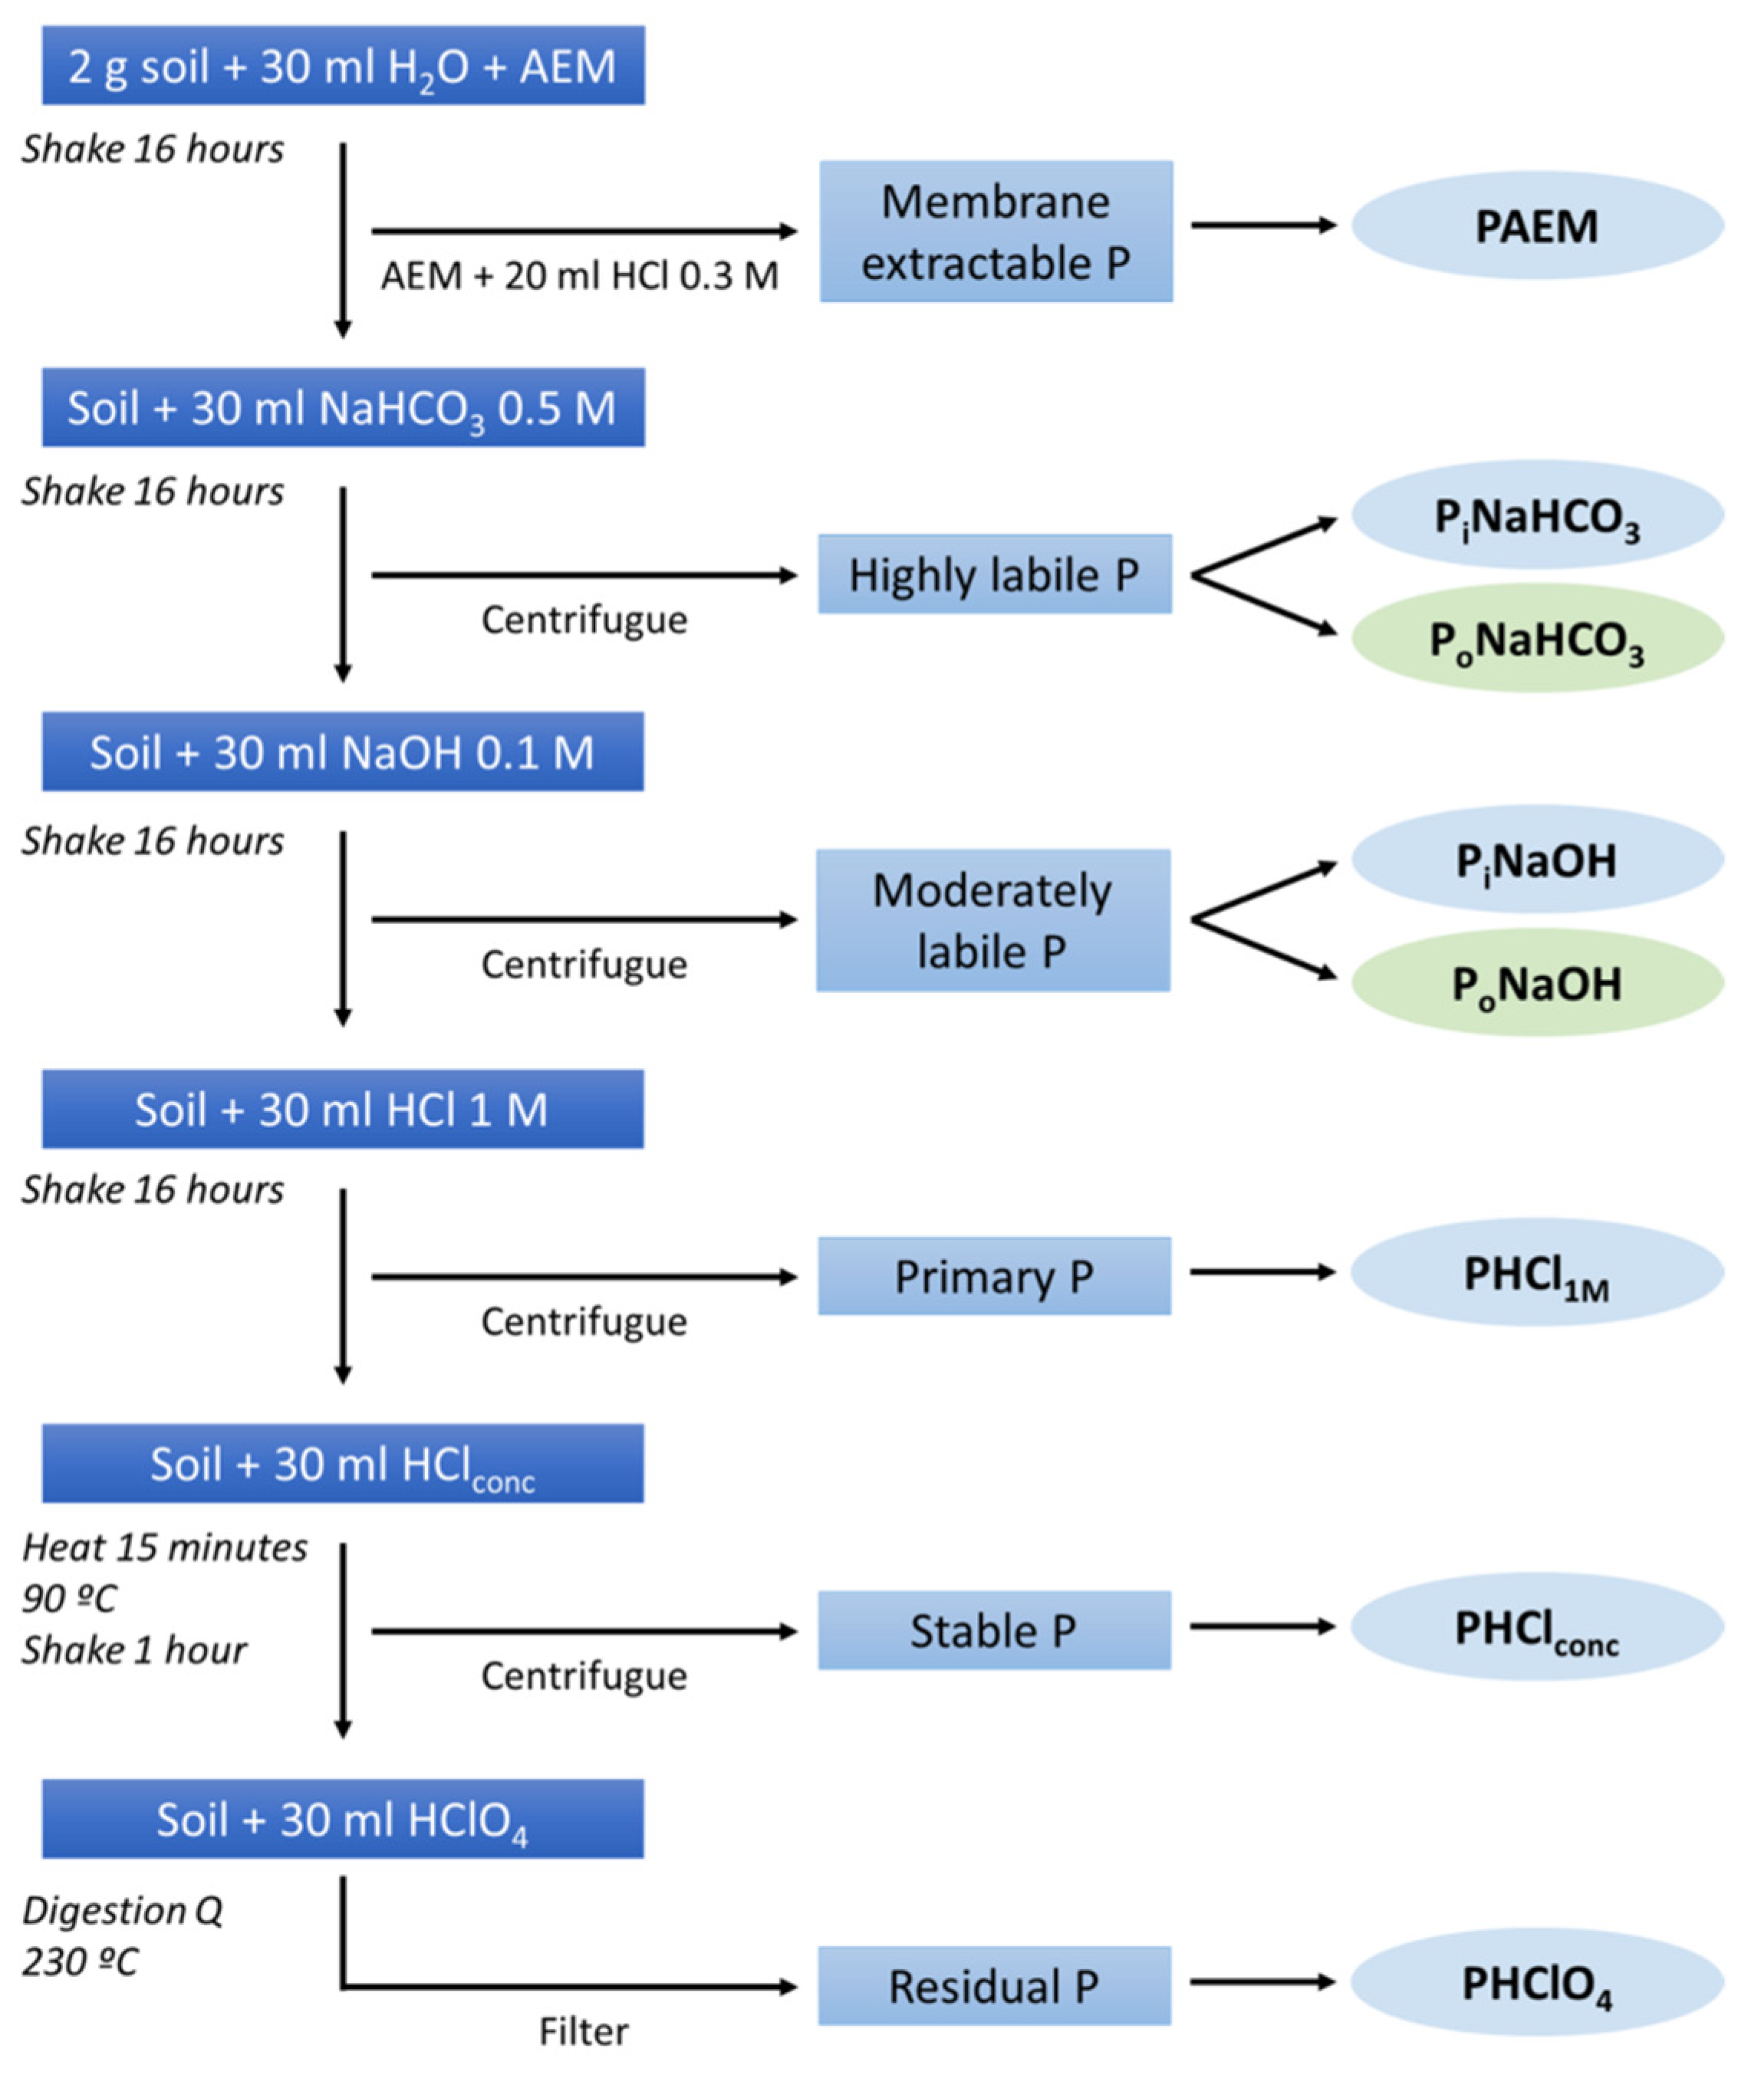
4.1. Soil Phosphorus Status and Availability

Membrane extractable P was the lowest fraction in the studied soils. As expected, we found positive correlations between membrane extractable P and highly labile inorganic P since this fraction includes easily interchangeable P compounds and simulates the action of plant roots in dissolving P minerals [39,40]. Thus, these results indicated that the highly labile inorganic P fraction in the studied soils could act as a source of available P in the short term. However, and unlike other studies (such as [16]), we did not find significant correlations between the most available P and highly labile organic P, even when this fraction is considered a very active fraction of soil organic P [58]. Organic P concentration calculated as the sum of PoNaHCO3 and PoNaOH, represented around 12% of the total P, following previous results in other studies in inceptisols or in Mediterranean forest soils [42,59]. The most refractory forms of P (PHClconc and PHClO4) were positively correlated with the highly labile organic P fraction, corroborating that the most stable and residual fractions may even be sources of available P in the long term [60].
Primary and stable fractions were the predominant forms of P in the soils studied as observed in other calcareous soils [1,61], among others). Primary P was just correlated with the moderately labile inorganic P and with total P, indicating that in these calcareous soils total P is mostly formed by the P included in Ca minerals. The relationship between primary and moderately labile inorganic P deserves an in-depth study to understand its significance in P dynamics in limestone soils with high carbonates content. Few studies have indicated that 1M HCl extraction removes not only Ca-P but also Fe and Al-related P forms [62,63,64], which could explain this correlation. In fact, Fe, Al, and Mn are sometimes more significant in controlling P solubility in calcareous soils than free lime [65]. However, this possible Ca-P miss quantification by sequential chemical extraction methods is soil-specific (depending on soil properties) and several studies have shown that in calcareous soils the Ca-P and organic P fractions extracted with sequential methods are comparable and consistent with those extracted using other novel methods such as synchrotron X-ray absorption near-edge structure (XANES) spectroscopy (59,63], among others). Total P concentration in the studied soils was low, but in the range found on forest soils [1,17,27] and was also alike to that found in limestone soils of northwestern Spain [61] and in inceptisol-type soils [42].
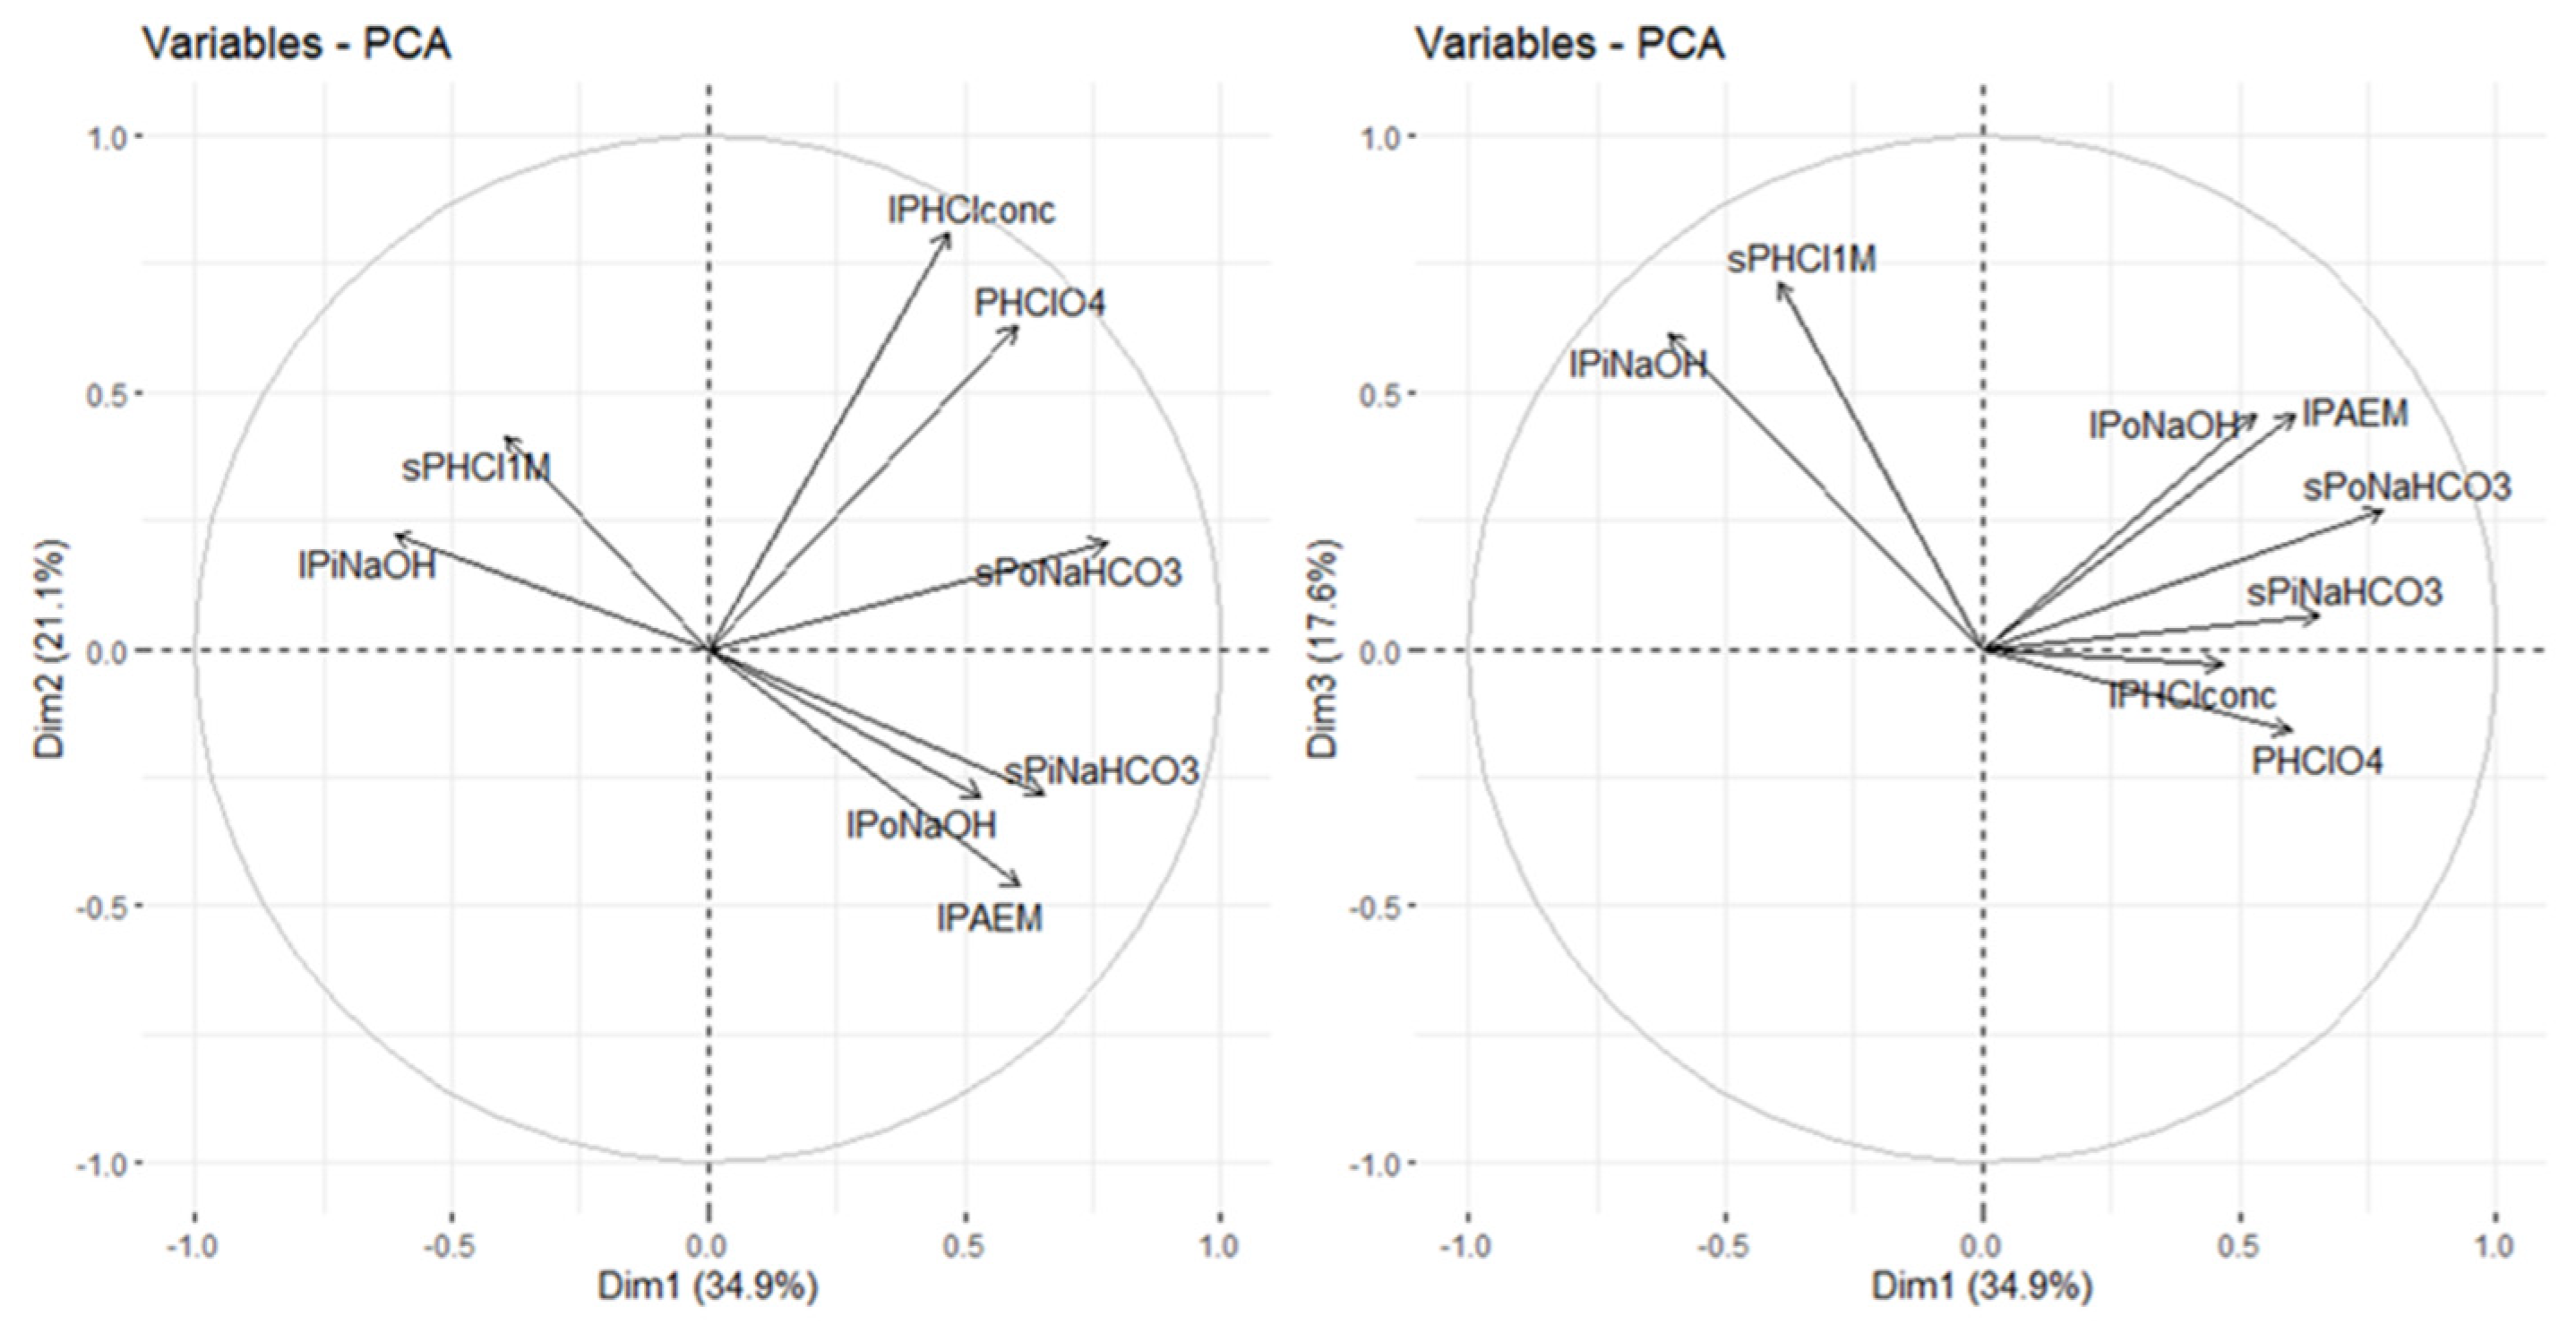
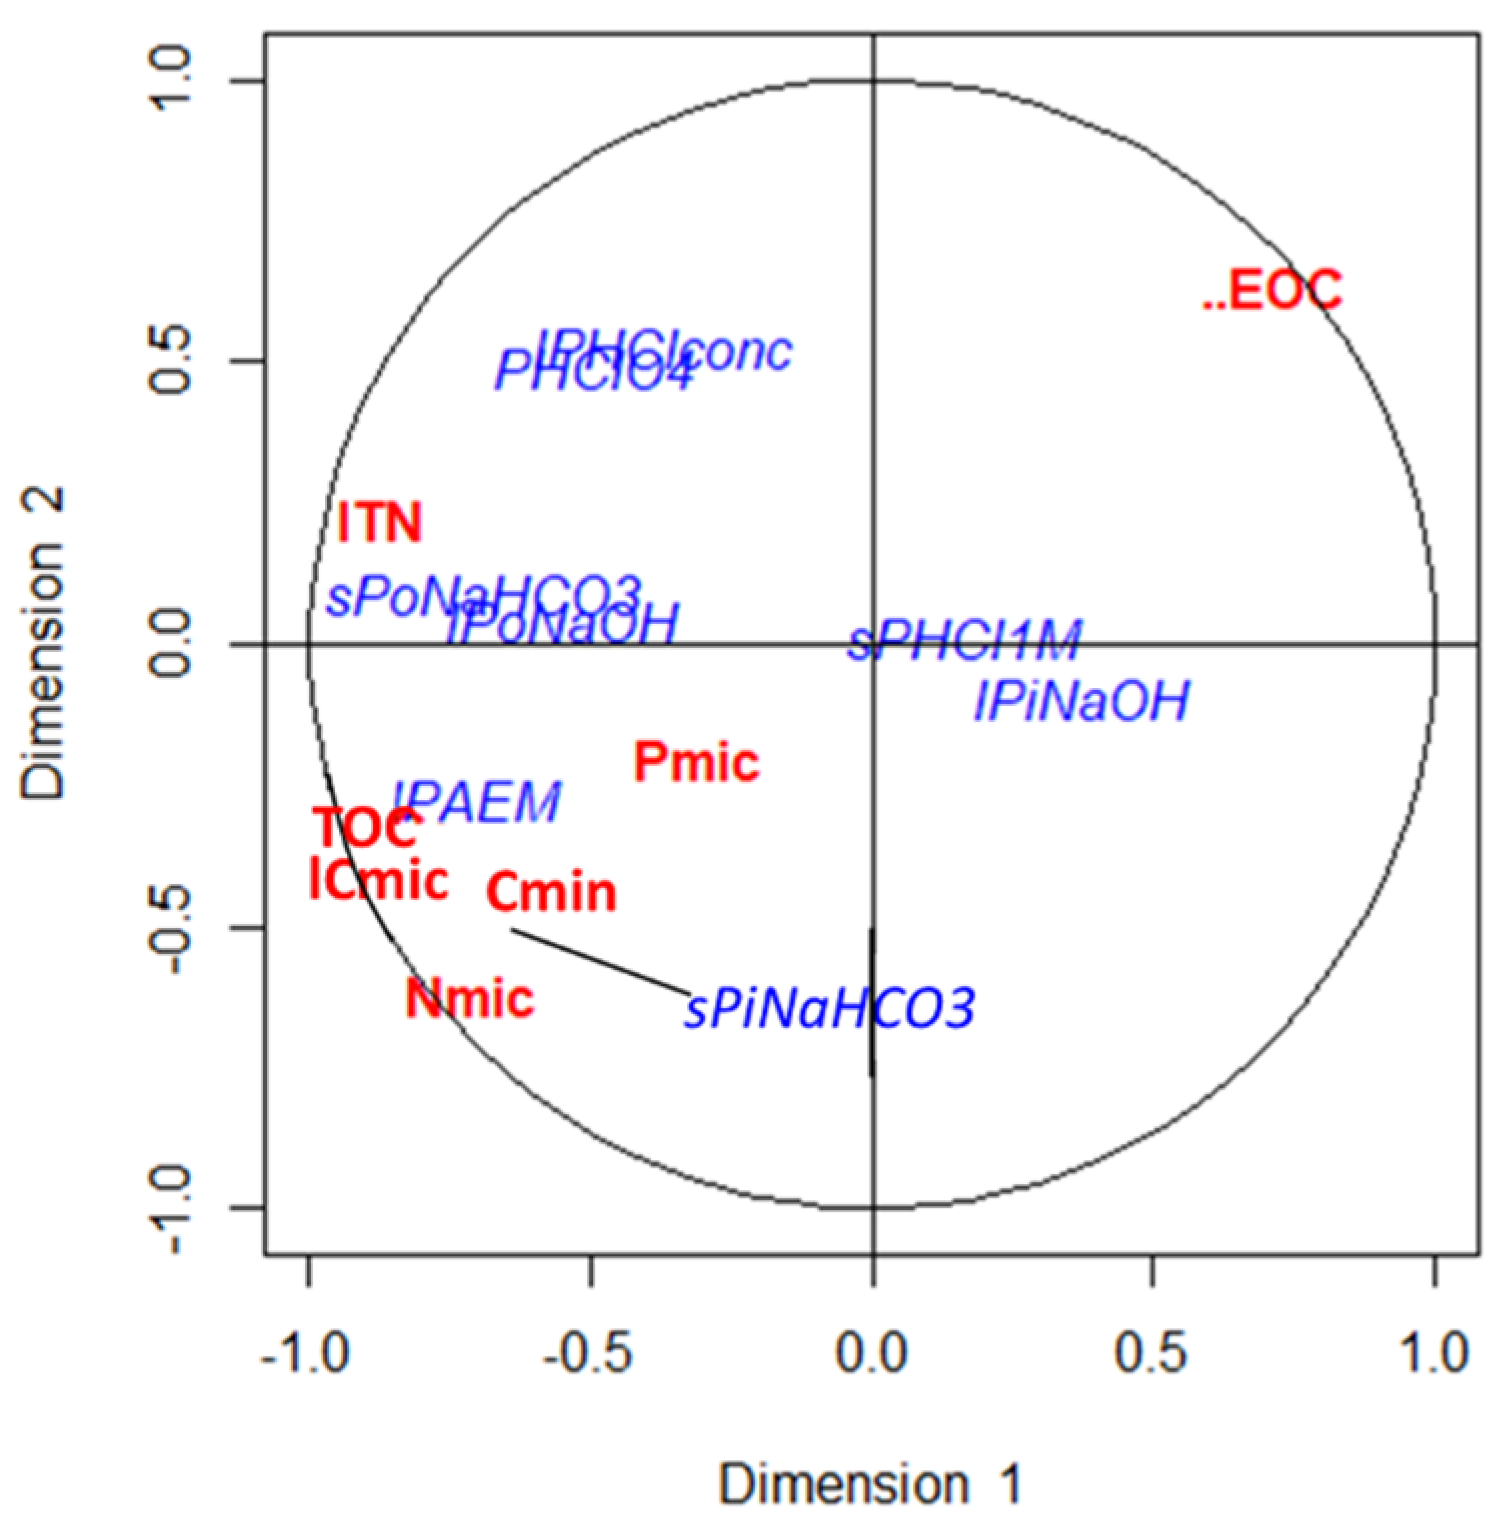
The principal component analysis allowed us to differentiate three pools of P according to their lability (see, for example, [60,66]). A first pool related to the first axis of the PCA corresponding to both organic and inorganic labile fractions, that is, the short-term available P fractions. The second PCA was associated with the P forms extracted in the last steps of fractionation, which are the most stable forms and available in the very long term. Finally, in the third axis, the medium-term-available forms appeared, which represent a greater proportion of the total P in these soils and are mainly inorganic forms of P extracted with NaOH and 1M HCl.

4.2. Relationship between P Fractions and Soil Parameters

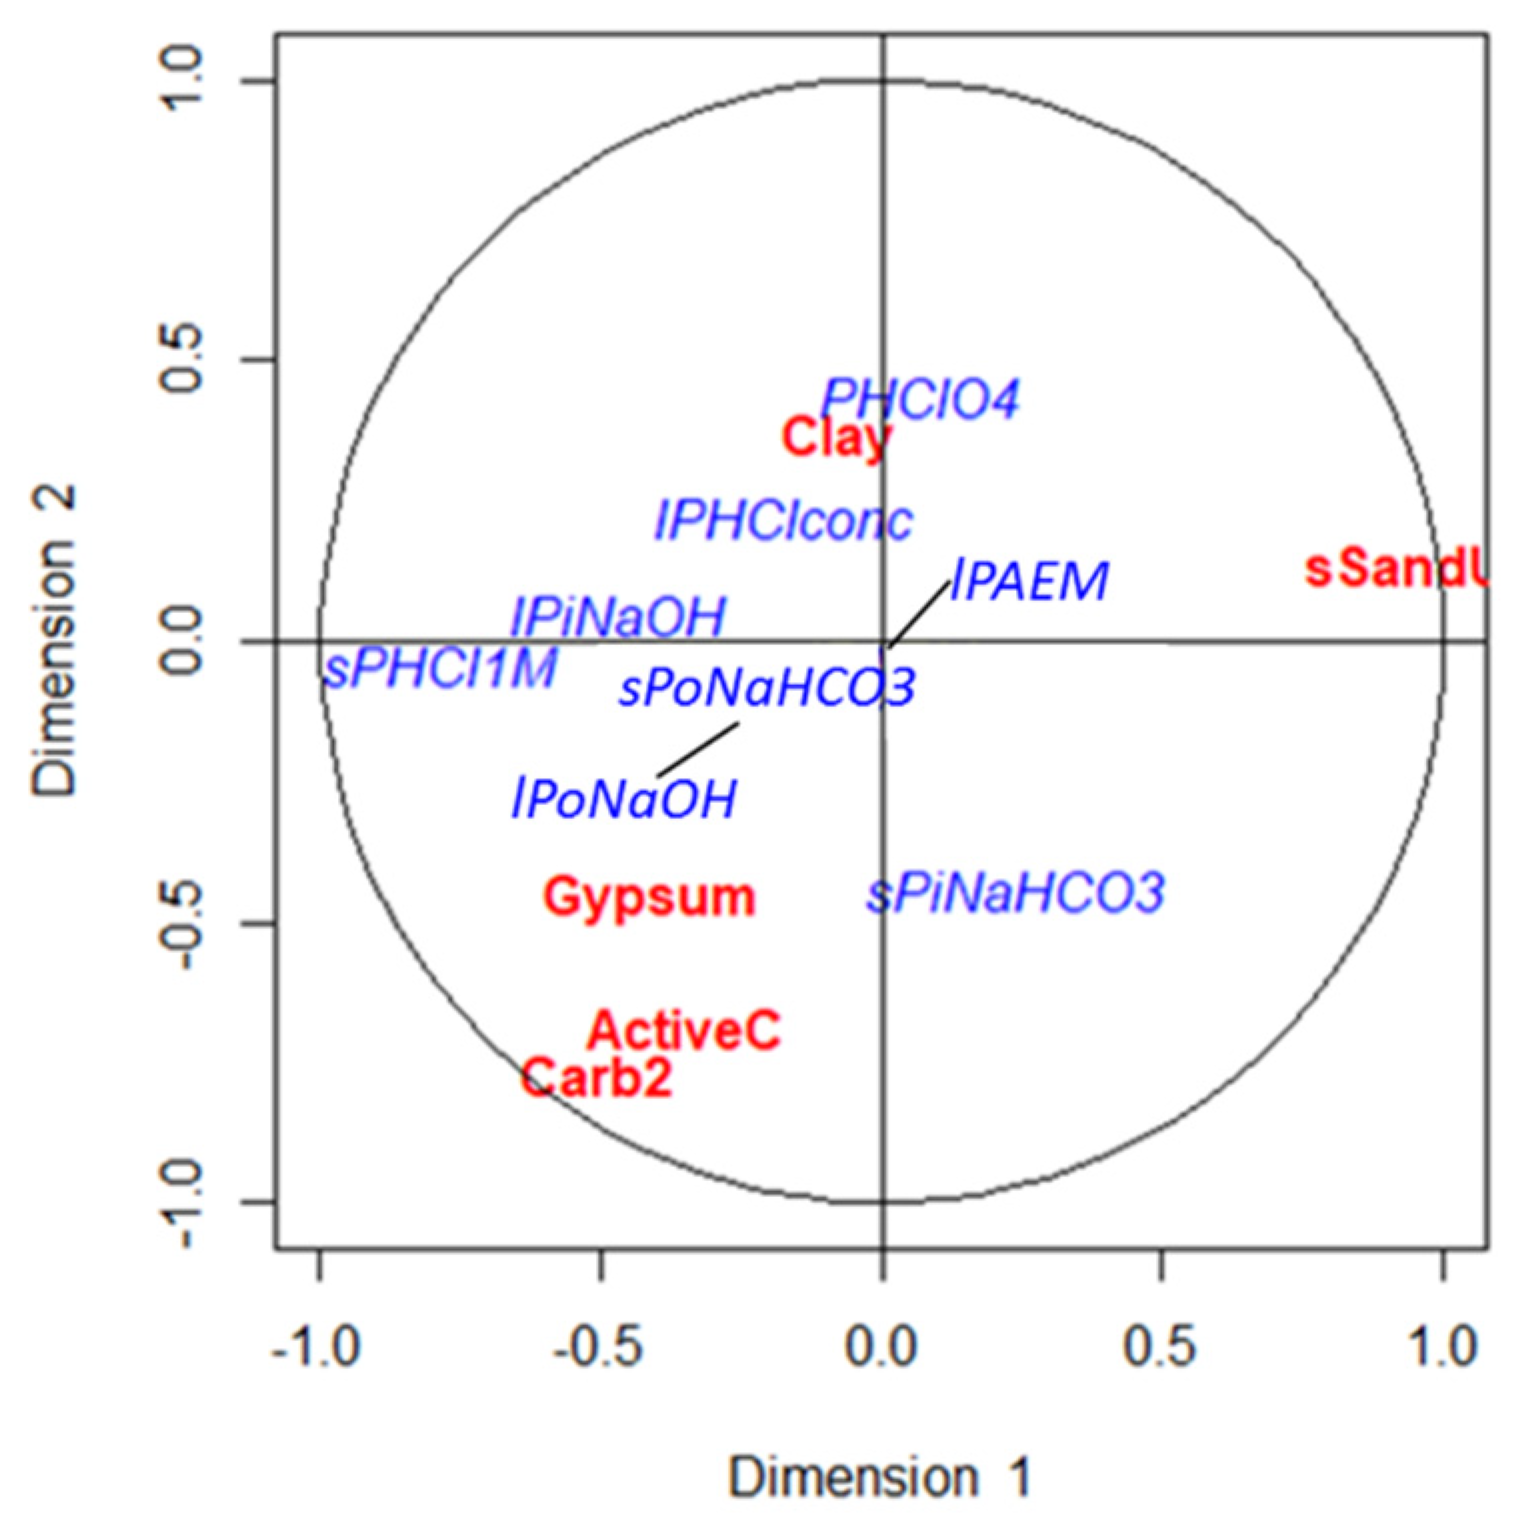
Specific characteristics of each soil determine the solubility and bioavailability of nutrients, and soil properties affect differently to the diverse soil P forms ([17,59], among others). Therefore, soil processes involved in the availability and stability of soil P will vary in soils with unlike characteristics and in different ecosystems. Our results showed that the organic fractions and the P available forms might be affected by organic matter and microbiological activity, while the P fractions linked to Ca seem to be influenced by the composition of the soil, mainly by its sand and carbonates content.
The highly significant correlations of the parameters related to the composition of the soil were established with the most stable fractions of P. Although important, the direct effect of texture on the distribution of P pools in forest soils has been little studied [17,67]. Strong negative correlations were found between sand content and primary P, a fraction that represents the total P content in the studied soils. The negative influence of sand content on primary P and total P concentrations has been previously demonstrated in soils from very different climatic areas around the world [17,35]. This influence could be interpreted as the reduction of surfaces to which phosphorus can bind, such as the surfaces of the clay–humic complex and, in the specific case of limestone soils, the lower content of active limestone, a material with the size of silt and clay which shows great chemical activity in the soil and is often a better predictor of P behavior than the soil total lime content [65].
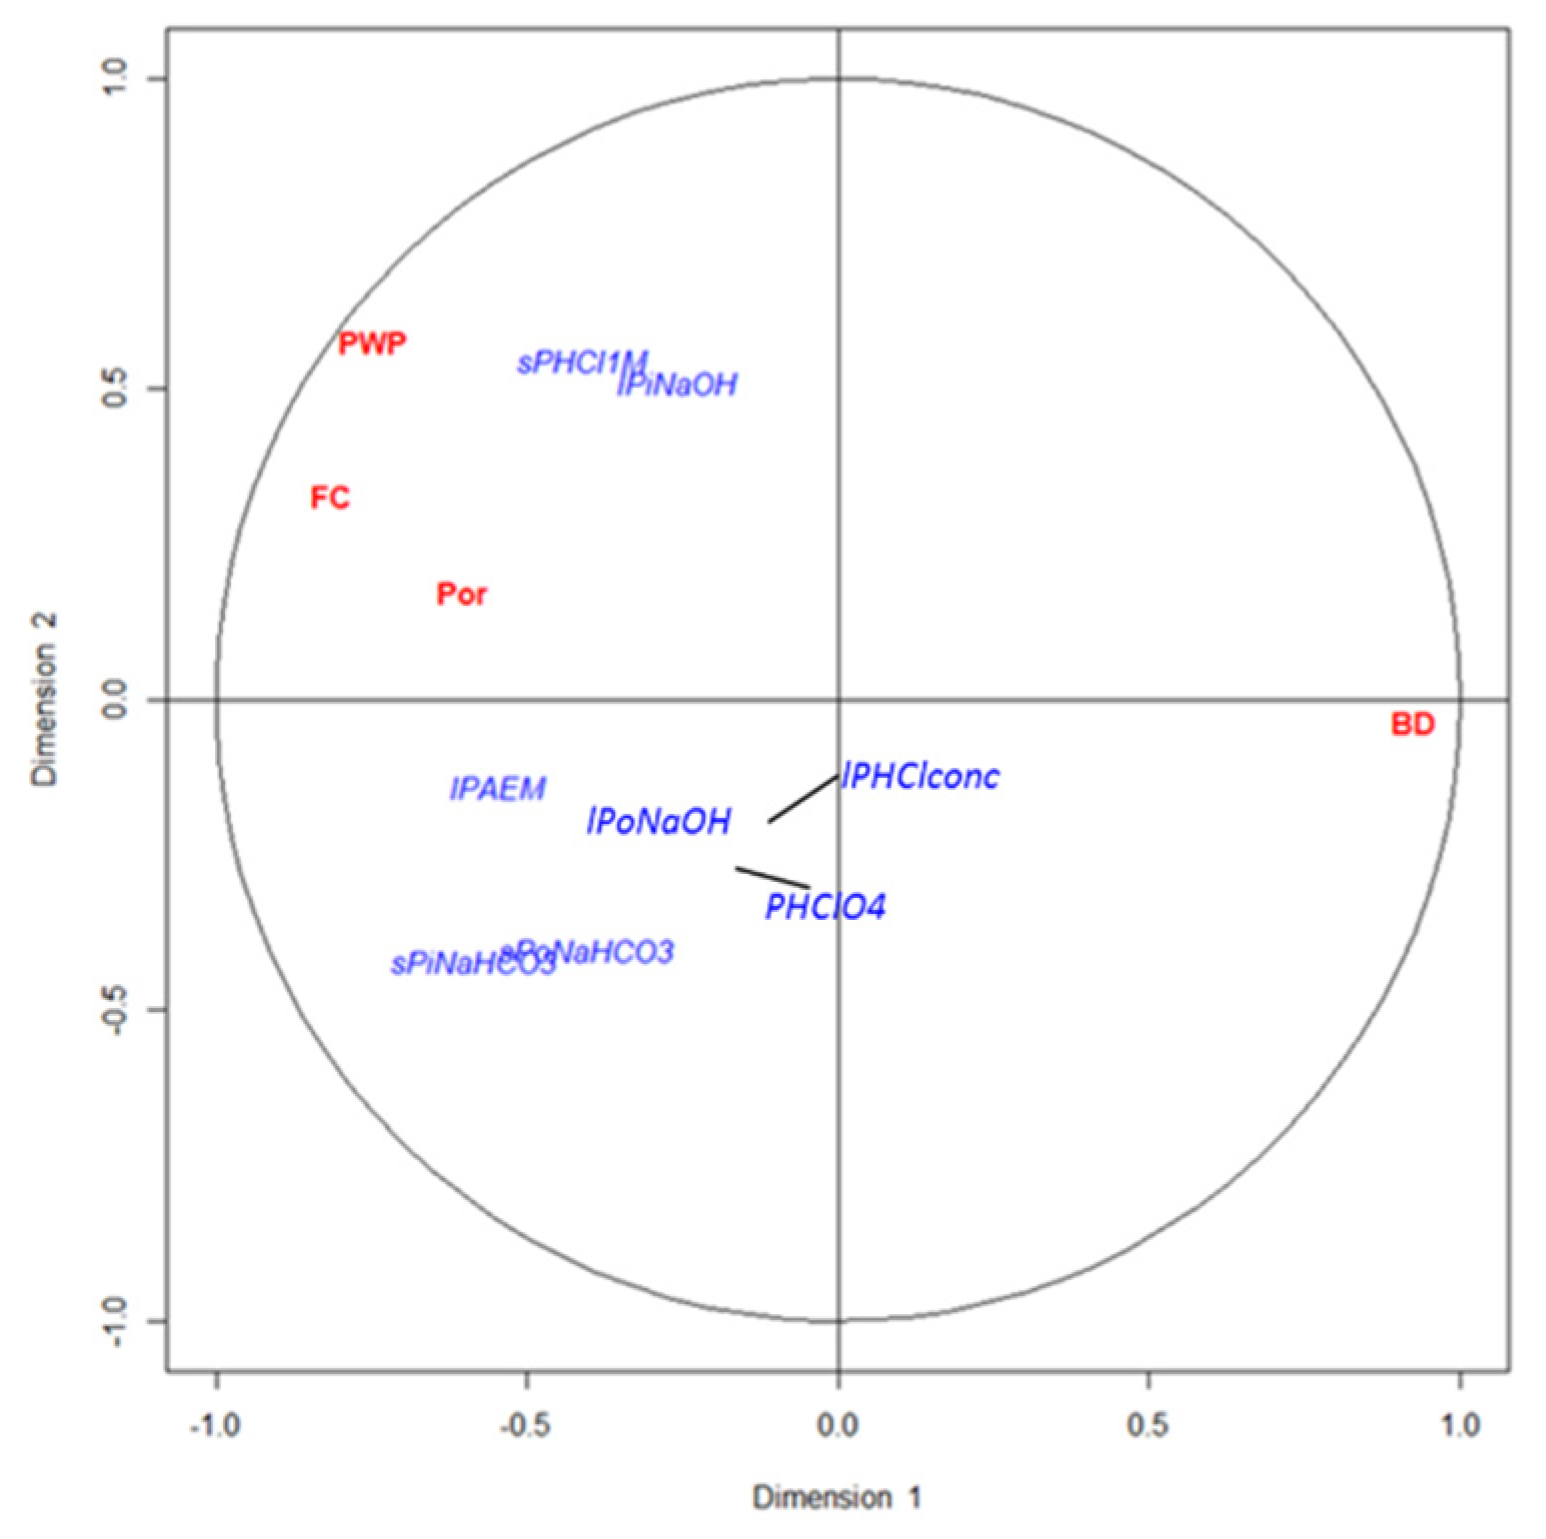
Soil aeration and water retention capacity are important factors affecting P dynamics because they play important roles in the mineralization and immobilization of this element [11]. However, the significance of these factors in the P cycle remains uncertain. In the present study the effect of soil aeration in P fractions has been considered through bulk density and porosity. Our results indicated that labile P fractions were reduced with increased soil bulk density, i.e., with reduced soil aeration. Lower soil aeration might imply lower soil microbial activities and subsequently reduced mineralization processes. However, contradictory results have been reported in this matter, with higher mineralization rates seen both in good aeration conditions and in bad conditions [10]. The reason why bulk density greatly affects the soil P available forms may be, on the one hand, to the content of organic matter, since the higher the organic matter, the lower the bulk density. On the other hand, it may be due to aspects related to the textural class.
As expected, parameters related to soil water retention were positively correlated with the available and labile P, since soil moisture is essential for soil microorganisms’ survival and for phosphatases production [11,68], thus increasing the labile P fractions. However, whether the soil has more or less water depends not only on its retention capacity but also, and more importantly, on the amount of water that reaches the soil, that is, on rainfall. In this study we did not consider climatic or physiographic variables, we cannot determine either the availability of water or the actual aeration level of the soils studied. Therefore, that the studied soils show high field capacity does not imply that they have enough water for the microorganisms to carry out their activities and consequently, increase the amount of labile P in the soil. In fact, the studied plots are under a Mediterranean climate where annual precipitation is low (less than 500 mm) and the summer drought is intense and long-lasting. Consequently, in the studied plots as in other forest systems, the scarcity of precipitation and low soil moisture, together with a low water retention capacity, can greatly reduce the enzymatic activities in the soil, and so reducing the mineralization of P [45,68].
Phosphorus mineralization rates as well as its solubility, fixation, and concentration of its different pools are influenced by soil pH ([14,15], among others). However, unlike previous studies, our results did not show a strong effect of pH on P pools, which is probably due to the low pH variation among the studied soils (range 8.0–8.9).
The different phosphorus fractions, mainly labile P, were positively related to cation exchange capacity and the amount of exchangeable potassium, which could be explained by the strong relationship of these parameters with the quantity and quality of soil organic matter. The short-term availability of P to vegetation is strongly influenced by biochemical processes that affect organic matter, while its long-term status is generally determined by geochemical transformations [26,27]. In addition, primary P was negatively related to assimilable iron and manganese since when carbonates or active carbonates content in the soil increase, the amount of assimilable Fe and Mn decreases, while primary P bounded in Ca-minerals increases [66].
As expected, the most labile fractions of P both inorganic (PAEM and PiNaHCO3) and organic P (PoNaHCO3) were highly correlated with soil parameters related to organic matter and enzymatic activity. This indicates that in the soils studied the biological cycle of P has great importance in the availability of this element. The availability of P from organic forms may be due to two possible causes: (1) The first is the general mineralization of soil organic matter which is regulated by the energy demand of microorganisms [69]. Results from CCA and Spearman’s correlations completed with the group of organic matter-related parameters showed the relevance of this biological P mineralization in the studied soils, following previous results [45]. (2) The second possible cause of the release of P from organic forms could be the specific release of P due to the action of particular enzymes involved (acid phosphatase and, especially in the studied soils, alkaline phosphatase [70]) which is governed by the specific need for available P. In general, it is considered that the lower the availability of P in the soil, the higher the activity of phosphatase (either acid or alkaline, depending on the soil pH), since this enzyme is released when available P levels are limiting. In the calcareous soils studied, alkaline phosphatase did not show any correlation with assimilable forms of phosphorus. Moreover, it neither showed high relevance in the first canonical axis of the CCA performed with the group of enzyme activity-related parameters. The absence of importance in the CCA and of correlation between the available P forms and alkaline phosphatase could explain that in these calcareous soils the concentration of assimilable P, although low, may be sufficient to satisfy the demand of the vegetation and soil microorganisms, unlike what was found in acid soils in northern Spain [46]. The rest of the enzymes considered in this study (without phosphatase activity) showed highly significant correlations with the labile forms of P, both in the Spearman correlations and in the CCA. The fluorescein diacetate hydrolysis reaction (FDA), which showed a higher weight in the corresponding canonical dimension, reflects all the hydrolytic activity in the soil [71] and is commonly used as an indicator of the general microbial activity in the soil [72]. Furthermore, all the enzymes were related to each other and to the microbiological parameters Cmic, Cmin, Nmic. Microbial populations, besides participating in the mineralization and solubilization of soil P, are also a reserve of organic P that is released when microorganisms die [3,9]. Our results showed that the microbial biomass of C, N and P were significantly correlated with the most labile phosphorus and the microbial biomass C also correlated with organic P. The microbial biomass P in our study represented 2.7% of the total P. The positive correlation found between microbial biomass P and membrane extractable P is consonant with previous studies [58,59] and with the fact that microbial biomass regulates soil P availability through the release of its P content. Therefore, all these results might indicate that the biological mineralization of P in these soils plays a more important role in P liberation than the biochemical mineralization.
Although in the studied soils, organic forms of P represented a low percentage of total P compared to other studies [17,73], a strong influence of total soil carbon (TOC) and easily oxidizable carbon (EOC) on the distribution of P could be expected. Following previous studies, we found a positive correlation between organic P, available P and highly labile inorganic P with soil organic C ([59,67], among others), since these soluble and labile forms of P come from the mineralization of organic matter [21]. The positive relationship between inorganic P and easily oxidizable carbon may be because the organic matter could act as a source of labile inorganic P in the studied soils [74]. In addition, CCA results showed that the first canonical factor was highly correlated with TOC and the second canonical factor with EOC, indicating that these two parameters might be good predictors of labile P.

4.3. Relationship between Forest Productivity, Soil P Fractions and Soil Parameters

Using globally the large set of soil parameters considered in this work (including the different forms of soil P) we explained around 67% of the variance of the site index calculated by [25] for the P. halepensis stands studied. Our results indicated that site index in the studied plots was conditioned by parameters related to soil texture and carbonate content as well as to the primary P, which is the P pool that mostly represents the total P in these plots. Soil water retention-related parameters also explained much of the site index variance in the studied plots. These results are in line with those obtained by other authors for P. halepensis since this species growth (associated with its site index and productivity) is mainly driven by soil water availability considering both its supply and its retention in the soil [23,24]. Surprisingly, climatic variables included in the model which were related to water supply did not influence the site index as much as have been expected. This may be since in these plots, soil composition parameters, mainly the high presence of Ca, largely modulates trees growth. However, the inclusion of climatic variables did considerably improve site index variance explanation. In addition, soil chemical fertility related to the supply of macronutrients was also important in explaining site index. This may be due to high availability of macronutrients as K and Mg could favor resistance to drought since trees with a good supply of these nutrients reduce water loss through transpiration [24,75]. The availability of micronutrients did not affect the forest productivity of these plots while in agricultural soils this factor is one of the most important for crops’ growth [76]. Generally, organic matter decomposition affects the productivity of ecosystems, particularly in nutrient-poor forests such as Mediterranean forests [77]. However, the parameters related to organic matter did not seem to influence the site index of the studied plots. This could be due to the release of nutrients from plant litter depends not only on the activity of the microorganisms but also and mainly, on the litter quality and on environmental factors. In our case, the quality of the litter is the same in all the plots: same species of Pinus with the same chemical composition in needles, same strategies for the conservation of nutrients in their tissues, and same decomposition rates [78]. Furthermore, the plots are in areas with very similar environmental conditions so environmental factors would not make great differences in the nutrient release process between plots either.

5. Conclusions

In the calcareous soils studied, biological mineralization processes played a key role in the P cycle, and therefore, the parameters related to soil organic matter and enzymatic activity mainly promoted the availability of that element. However, the main fraction in these soils (primary P) was linked to the carbonates content and could act as a source of available P in the medium term. The P available concentration, although low, may be sufficient to satisfy the demands of the vegetation and microorganisms in these soils. The site index of Pinus halepensis in the studied plots was not affected by the soil available P, indicating that this species growth and thus its productivity, is not so limited by soil nutrients and other soil parameters, but by water availability, normally scarce throughout its circum-Mediterranean distribution. Advancing in the knowledge about the internal dynamics of forest soils and their relationship with forest productivity is key to providing outstanding information to sustainable forest management.

Supplementary Materials

The following are available online at https://www.mdpi.com/article/10.3390/f12101398/s1, Table S1: Location of the 32 Pinus halepensis plots studied (UTM Projection in meters; Datum ED50) and soil textural class at each plot. Table S2: Description, units and transformations of phosphorus fractions and the soil parameters used in this study and clustered into five groups (soil parameters extracted from [46,47]). Variables’ transformations were done when necessary to achieve normality. Double-line separates P fractions from soil parameters and dashed-line separates each soil parameters group. Table S3: Results from the Principal Component Analysis applied to phosphorus fractions data from 32 Pinus halepensis plots studied. Variables with loadings > |0.70| in bold case. Table S4: Factor loadings (simple correlations between each canonical factor and the variables) of canonical correlation analysis performed on P fractions in relation to soil composition parameters. Variables with higher importance in each component in bold case. Table S5: Factor loadings (simple correlations between each canonical factor and the variables) of canonical correlation analysis performed on P fractions in relation to soil physical fertility parameters. Variables with higher importance in the first component in bold case. Table S6: Factor loadings (simple correlations between each canonical factor and the variables) of canonical correlation analysis performed on P fractions in relation to soil chemical fertility parameters. Variables with higher importance in each component in bold case. Table S7: Factor loadings (simple correlations between each canonical factor and the variables) of canonical correlation analysis performed on P fractions in relation to soil organic matter parameters. Variables with higher importance in each component in bold case. Table S8: Factor loadings (simple correlations between each canonical factor and the variables) of canonical correlation analysis performed on P fractions in relation to soil enzymatic activity parameters. Variables with higher importance in the first component in bold case. Table S9: Variance explained by each component and accumulated variance of the matrix of independent variables (X) and the vector of dependent variable (Y). Selected components in bold case. Table S10: Weight of each variable within each component of the PLS model. Variables with weight > 10% in bold case.

Author Contributions

Conceptualization, M.-B.T.; methodology, M.-B.T. and R.C.M.-S.; formal analysis, R.C.M.-S. and V.P.; resources, R.C.M.-S., M.-B.T. and T.B.; writing—original draft preparation, R.C.M.-S. and M.-B.T.; writing—review and editing, R.C.M.-S. and M.-B.T.; supervision, M.-B.T., V.P. and T.B.; funding acquisition, M.-B.T. and R.C.M.-S. All authors have read and agreed to the published version of the manuscript.

Funding

This research was funded by Junta de Castilla y León, project number VA096G19 “Ecosystem services of soils under mixed forest stands versus pure stands. Effect of stand type on soil fertility, water retention and carbon sequestration”. R.C.M.-S. was supported by the Youth Guarantee EU initiative (job contract).

Institutional Review Board Statement

Not Applicable.

Informed Consent Statement

Not Applicable.

Data Availability Statement

The data presented in this study are available on request from the corresponding author.

Acknowledgments

The authors are grateful to Carmen Blanco and Juan Carlos Arranz for their advice in laboratory analysis.

Conflicts of Interest

The authors declare no conflict of interest.

References

  1. Alt, F.; Oelmann, Y.; Herold, N.; Schrumpf, M.; Wilcke, W. Phosphorus partitioning in grassland and forest soils of Germany as related to land-use type, management intensity, and land use-related pH. J. Plant Nutr. Soil Sci. 2011, 174, 195–209. [Google Scholar] [CrossRef]
  2. Vitousek, P.M. Literfall, nutrient cycling, and nutrient limitation in tropical forest. Ecol. Lett. 1984, 65, 285–298. [Google Scholar] [CrossRef]
  3. Achat, D.L.; Bakker, M.R.; Zeller, B.; Pellerin, S.; Bienaimé, S.; Morel, C. Long-term organic phosphorus mineralization in Spodosols under forests and its relation to carbon and nitrogen mineralization. Soil Biol. Biochem. 2010, 42, 1479–1490. [Google Scholar] [CrossRef]
  4. Jonard, M.; Augusto, L.; Morel, C.; Achat, D.L.; Saur, E. Forest floor contribution to phosphorus nutrition: Experimental data. Ann. For. Sci. 2009, 66, 510. [Google Scholar] [CrossRef] [Green Version]
  5. Walbridge, M.R. Phosphorus availability in acid organic soils of the lower North Carolina Coastal Plain. Ecology 1991, 72, 2083–2100. [Google Scholar] [CrossRef]
  6. Jalali, M.; Ranjbar, F. Rates of decomposition and phosphorus release from organic residues related to residue composition. J. Plant Nutr. Soil Sci. 2009, 172, 353–359. [Google Scholar] [CrossRef]
  7. Shen, J.; Yuan, L.; Zhang, J.; Li, H.; Bai, Z.; Chen, X.; Zhang, W.; Zhang, F. Phosphorus dynamics: From soil to plant. Plant Physiol. 2011, 156, 997–1005. [Google Scholar] [CrossRef] [Green Version]
  8. Tate, K.R. The biological transformation of P in soil. In Biological Processes and Soil Fertility; Springer: Dordrecht, The Netherlands, 1984; pp. 245–256. [Google Scholar]
  9. Nannipieri, P.; Kandeler, E.; Ruggiero, P. Enzyme activities and microbiological and biochemical processes in soil. Enzymes in the Environment; Marcel Dekker: New York, NY, USA, 2002; pp. 1–33. [Google Scholar]
  10. Brannon, C.A.; Sommers, L.E. Stability and mineralization of organic phosphorus incorporated into model humic polymers. Soil Biol. Biochem. 1985, 17, 221–227. [Google Scholar] [CrossRef]
  11. Arenberg, M.R.; Arai, Y. Uncertainties in Soil Physicochemical Factors Controlling Phosphorus Mineralization and Immobilization Processes. Adv. Agron. 2019, 154, 153–200. [Google Scholar] [CrossRef]
  12. Bueis, T.; Turrión, M.B.; Bravo, F. Stand and environmental data from Pinus halepensis Mill. and Pinus sylvestris L. plantations in Spain. Ann. For. Sci. 2019, 76, 1–6. [Google Scholar] [CrossRef] [Green Version]
  13. Harrison, A. Soil Organic Phosphorus—A Review of World Literature; CAB International: Wallingford, UK, 1987. [Google Scholar]
  14. Turner, B.L.; Blackwell, M.S.A. Isolating the influence of pH on the amounts and forms of soil organic phosphorus. Eur. J. Soil Sci. 2013, 64, 249–259. [Google Scholar] [CrossRef]
  15. Hinsinger, P. Bioavailability of soil inorganic P in the rhizosphere as affected by root-induced chemical changes: A review. Plant Soil 2001, 237, 173–195. [Google Scholar] [CrossRef]
  16. Tiessen, H.; Stewart, J.W.B.; Cole, C.V. Pathways of Phosphorus Transformations in Soils of Differing Pedogenesis. Soil Sci. Soc. Am. J. 1984, 48, 853–858. [Google Scholar] [CrossRef]
  17. Niederberger, J.; Kohler, M.; Bauhus, J. Distribution of phosphorus fractions with different plant availability in German forest soils and their relationship with common soil properties and foliar P contents. Soil 2019, 5, 189–204. [Google Scholar] [CrossRef] [Green Version]
  18. Dirks, I.; Köhler, J.; Rachmilevitch, S.; Meier, I.C. The Phosphorus Economy of Mediterranean Oak Saplings under Global Change. Front. Plant Sci. 2019, 10, 405. [Google Scholar] [CrossRef] [PubMed] [Green Version]
  19. Sardans, J.; Peñuelas, J. Tree growth changes with climate and forest type are associated with relative allocation of nutrients, especially phosphorus, to leaves and wood. Glob. Ecol. Biogeogr. 2013, 22, 494–507. [Google Scholar] [CrossRef]
  20. Lelieveld, J.; Hadjinicolaou, P.; Kostopoulou, E.; Chenoweth, J.; El Maayar, M.; Giannakopoulos, C.; Hannides, C.; Lange, M.A.; Tanarhte, M.; Tyrlis, E.; et al. Climate change and impacts in the eastern Mediterranean and the Middle East. Clim. Chang. 2012, 114, 667–687. [Google Scholar] [CrossRef] [Green Version]
  21. Hou, E.; Chen, C.; Wen, D.; Liu, X. Relationships of phosphorus fractions to organic carbon content in surface soils in mature subtropical forests, Dinghushan, China. Soil Res. 2014, 52, 55–63. [Google Scholar] [CrossRef] [Green Version]
  22. Fady, B.; Semerci, H.; Vendramin, G.G. EUFORGEN Tecnical Guidelines for Genetic Conservation and Use for Aleppo Pine (Pinus halepensis) and Brutia Pines (Pinus brutia); Biodiversity International: Rome, Italy, 2003; p. 6. [Google Scholar]
  23. Aguirre, A.; del Río, M.; Condés, S. Productivity estimations for monospecific and mixed pine forests along the Iberian Peninsula aridity gradient. Forests 2019, 10, 430. [Google Scholar] [CrossRef] [Green Version]
  24. Del Río, M.; Rodríguez-Alonso, J.; Bravo-Oviedo, A.; Ruíz-Peinado, R.; Cañellas, I.; Gutiérrez, E. Aleppo pine vulnerability to climate stress is independent of site productivity of forest stands in southeastern spain. Trees 2014, 28, 1209–1224. [Google Scholar] [CrossRef]
  25. Bueis, T.; Bravo, F.; Pando, V.; Turrión, M.B. Site factors as predictors for Pinus halepensis Mill. productivity in Spanish plantations. Ann. For. Sci. 2017, 74, 6. [Google Scholar] [CrossRef] [Green Version]
  26. Hou, E.; Chen, C.; Kuang, Y.; Zhang, Y.; Heenan, M.; Wen, D. A structural equation model analysis of phosphorus transformations in global unfertilized and uncultivated soils. Glob. Biogeochem. Cycles 2016, 30, 1300–1309. [Google Scholar] [CrossRef] [Green Version]
  27. Costa, M.G.; Gama-Rodrigues, A.C.; de Moraes Gonçalves, J.L.; Gama-Rodrigues, E.F.; da Silva Sales, M.V.; Aleixo, S. Labile and non-labile fractions of phosphorus and its transformations in soil under Eucalyptus plantations, Brazil. Forests 2016, 7, 1–15. [Google Scholar] [CrossRef] [Green Version]
  28. Guo, F.; Yost, R.S. Partitioning soil phosphorus into three discrete pools of differing availability. Soil Sci. 1998, 163, 822–832. [Google Scholar] [CrossRef]
  29. De Schrijver, A.; Vesterdal, L.; Hansen, K.; De Frenne, P.; Augusto, L.; Achat, D.L.; Staelens, J.; Baeten, L.; De Keersmaeker, L.; De Neve, S.; et al. Four decades of post-agricultural forest development have caused major redistributions of soil phosphorus fractions. Oecologia 2012, 169, 221–234. [Google Scholar] [CrossRef]
  30. Richardson, A.E.; Lynch, J.P.; Ryan, P.R.; Delhaize, E.; Smith, F.A.; Smith, S.E.; Harvey, P.R.; Ryan, M.H.; Veneklaas, E.J.; Lambers, H.; et al. Plant and microbial strategies to improve the phosphorus efficiency of agriculture. Plant Soil 2011, 349, 121–156. [Google Scholar] [CrossRef]
  31. Guppy, C.N.; Menzies, N.W.; Moody, P.W.; Blamey, F.P.C. Competitive sorption reactions between phosphorus and organic matter in soil: A review. Aust. J. Soil 2005, 43, 189–202. [Google Scholar] [CrossRef]
  32. Lambers, H.; Brundrett, M.C.; Raven, J.A.; Hopper, S.D. Plant mineral nutrition in ancient landscapes: High plant species diversity on infertile soils is linked to functional diversity for nutritional strategies. Plant Soil 2010, 334, 11–31. [Google Scholar] [CrossRef]
  33. Hedley, M.J.; Stewart, J.W.B.; Chauhan, B.S. Changes in Inorganic and Organic Soil Phosphorus Fractions Induced by Cultivation Practices and by Laboratory Incubations. Soil Sci. Soc. Am. J. 1982, 46, 970–976. [Google Scholar] [CrossRef]
  34. Tiessen, H.; Moir, J. Characterization ofavailable P by sequential extraction. In Soil Sampling and Methods of Analysis; Carter, M.R., Ed.; Lewis Publishers: Boca Raton, FL, USA, 1993. [Google Scholar]
  35. Cross, A.F.; Schlesinger, W.H. Biological and geochemical controls on phosphorus fractions in semiarid soils. Biogeochemistry 2001, 52, 155–172. [Google Scholar] [CrossRef]
  36. Bueis, T.; Bravo, F.; Pando, V.; Turrión, M.B. Relationship between environmental parameters and Pinus sylvestris L. site index in forest plantations in northern Spain acidic plateau. iForest 2016, 9, 394–401. [Google Scholar] [CrossRef] [Green Version]
  37. Jokela, E.J.; White, E.H.; Berglund, J.V. Predicting Norway Spruce Growth From Soil and Topographic Properties in New York. Soil Sci. Soc. Am. J. 1988, 52, 809–815. [Google Scholar] [CrossRef]
  38. Turrión, M.-B.; Schneider, K.; Gallardo, J.F. Soil P availability along a catena located at the Sierra de Gata Mountains, Western Central Spain. For. Ecol. Manag. 2008, 255, 3254–3262. [Google Scholar] [CrossRef]
  39. Schoenau, J.J.; Huang, W.Z. Anion-exchange membrane, water, and sodium bicarbonate extractions as soil tests for phosphorus. Commun. Soil Sci. Plant Anal. 1991, 22, 465–492. [Google Scholar] [CrossRef]
  40. Turrion, M.B.; Gallardo, J.F.; Gonzalez, M.I. Distribution of P Forms in Natural and Fertilized Forest Soils of the Central Western Spain: Plant Response to Superphosphate Fertilization. Arid Soil Res. Rehabil. 2000, 14, 159–173. [Google Scholar] [CrossRef]
  41. Greenberg, A.E. Standard Methods for the Examination of Water and Wastewater; APHA/AWNA/WPCF: Washington, DC, USA, 1980. [Google Scholar]
  42. Cross, A.F.; Schlesinger, W.H. A literature review and evaluation of the Hedley fractionation: Applications to the biogeochemical cycle of soil phosphorus in natural ecosystems. Geoderma 1995, 64, 197–214. [Google Scholar] [CrossRef]
  43. Murphy, J.; Riley, J.P. A modified single solution method for the determination of phosphate in natural waters. Anal. Chim. Acta 1962, 27, 31–36. [Google Scholar] [CrossRef]
  44. Watanabe, F.S.; Olsen, S.R. Test of an ascorbic acid method for determining phosphorus in water and NaHCO3 extracts from soil. Soil Sci. Soc. Am. J. 1965, 29, 677–678. [Google Scholar] [CrossRef]
  45. Bueis, T.; Turrión, M.B.; Bravo, F.; Pando, V.; Muscolo, A. Factors determining enzyme activities in soils under Pinus halepensis and Pinus sylvestris plantations in Spain: A basis for establishing sustainable forest management strategies. Ann. For. Sci. 2018, 75, 1–13. [Google Scholar] [CrossRef] [Green Version]
  46. Bueis, T.; Bravo, F.; Pando, V.; Turrión, M.B. Database of site factors in Pinus halepensis Mill. plantations in Spain [Dataset] 2016. Available online: https://zenodo.org/record/198522#.YWf3AxxRVPY (accessed on 1 June 2021). [CrossRef]
  47. Bueis, T.; Turrión, M.B.; Bravo, F.; Pando, V.; Muscolo, A. Dataset of soil, climatic and stand variables in Pinus sylvestris and Pinus halepensis plantations in Spain [Dataset] 2017. Available online: https://zenodo.org/record/1294607#.YWf3KRxRVPY (accessed on 1 June 2021). [CrossRef]
  48. Skovsgaard, J.P.; Vanclay, J.K. Forest site productivity: A review of the evolution of dendrometric concepts for even-aged stands. Forestry 2008, 81, 13–31. [Google Scholar] [CrossRef] [Green Version]
  49. Lang, R. Versuch einer exakten Klassifikation der Boden in klimatischer und geologischer Hinsicht. Internationale Mitteilungen für Bodenkunde 1915, 5, 312–346. [Google Scholar]
  50. Thornthwaite, C. A rational approach to the classification of climate. Geogr. Rev. 1949, 38, 55–94. [Google Scholar] [CrossRef]
  51. Harrell, F.E.; Dupont, C. Hmisc: Harrell Miscellaneous. R package version 4.1-1. R Found. Stat. 2018. Comput. Available online: https://CRAN.R-project.org/package=Hmisc (accessed on 10 June 2021).
  52. González, I.; Déjean, S.; Martin, P.; Baccini, A. CCA: An R package to extend canonical correlation analysis. J. Stat. Softw. 2008, 23, 1–14. [Google Scholar] [CrossRef] [Green Version]
  53. Menzel, U. CCP: Significance Tests for Canonical Correlation Analysis (CCA). (R Package Version 1.1, 2012). Available online: https://CRAN.R-project.org/package=CCP (accessed on 10 June 2021).
  54. Revelle, W. Psych: Procedures for Personality and Psychological Research; Northwestern University: Evanston, IL, USA, 2017. [Google Scholar]
  55. Wehrens, R.; Mevik, B.H. The pls package: Principal component and partial least squares regression in R. J. Stat. Softw. 2007, 18, 1–24. [Google Scholar]
  56. Kassambara, A. Machine Learning Essentials: Practical Guide in R.; CreateSpace: Scotts Valley, CA, USA, 2018; STHDA; Available online: http://www.sthada.com (accessed on 10 June 2021).
  57. R Core Team. R: A Language and Environment for Statistical Computing; R Core Team: Vienna, Autria, 2020. [Google Scholar]
  58. Zamuner, E.C.; Picone, L.I.; Echeverria, H.E. Organic and inorganic phosphorus in Mollisol soil under different tillage practices. Soil Tillage Res. 2008, 99, 131–138. [Google Scholar] [CrossRef]
  59. Bueis, T.; Bravo, F.; Pando, V.; Kissi, Y.A.; Turrión, M.B. Phosphorus availability in relation to soil properties and forest productivity in Pinus sylvestris L. plantations. Ann. For. Sci. 2019, 76, 1–13. [Google Scholar] [CrossRef]
  60. Richter, D.D.; Lee Allen, H.; Li, J.; Markewitz, D.; Raikes, J. Bioavailability of slowly cycling soil phosphorus: Major restructuring of soil P fractions over four decades in an aggrading forest. Oecologia 2006, 150, 259–271. [Google Scholar] [CrossRef]
  61. Trasar-Cepeda, M.C.; Carballas, T.; Gil-Sotres, F.; de Blas, E. Liming and the phosphatase activity and mineralization of phosphorus in an andic soil. Soil Biol. Biochem. 1991, 23, 209–215. [Google Scholar] [CrossRef]
  62. Gu, C.; Dam, T.; Hart, S.C.; Turner, B.L.; Chadwick, O.A.; Berhe, A.A.; Hu, Y.; Zhu, M. Quantifying uncertainties in sequential chemical extraction of soil phosphorus using XANES spectroscopy. Environ. Sci. Technol. 2020, 54, 2257–2267. [Google Scholar] [CrossRef] [PubMed]
  63. Barrow, N.J.; Sen, A.; Roy, N.; Debnath, A. The soil phosphate fractionation fallacy. Plant Soil 2021, 459, 1–11. [Google Scholar] [CrossRef]
  64. Gu, C.; Margenot, A.J. Navigating limitations and opportunities of soil phosphorus fractionation. Plant Soil 2021, 459, 13–17. [Google Scholar] [CrossRef]
  65. Taalab, A.S.; Ageeb, G.W.; Siam, H.S.; Mahmoud, S.A. Some Characteristics of Calcareous soils. A review. Middle East J. Agric. Res. 2019, 1, 96–105. [Google Scholar]
  66. Turrión, M.B.; Bueis, T.; Lafuente, F.; López, O.; San José, E.; Eleftheriadis, A.; Mulas, R. Effects on soil phosphorus dynamics of municipal solid waste compost addition to a burnt and unburnt forest soil. Sci. Total Environ. 2018, 642, 374–382. [Google Scholar] [CrossRef] [PubMed]
  67. Zederer, D.P.; Talkner, U. Organic P in temperate forest mineral soils as affected by humus form and mineralogical characteristics and its relationship to the foliar P content of European beech. Geoderma 2018, 325, 162–171. [Google Scholar] [CrossRef]
  68. Criquet, S.; Ferre, E.; Farnet, A.M.; Le Petit, J. Annual dynamics of phosphatase activities in an evergreen oak litter: Influence of biotic and abiotic factors. Soil Biol. Biochem. 2004, 36, 1111–1118. [Google Scholar] [CrossRef]
  69. Bhattacharyya, P.N.; Jha, D.K. Plant growth-promoting rhizobacteria (PGPR): Emergence in agriculture. World J. Microbiol. Biotechnol. 2012, 28, 1327–1350. [Google Scholar] [CrossRef]
  70. Sharma, S.B.; Sayyed, R.Z.; Trivedi, M.H.; Gobi, T.A. Phosphate Solubilizing Microbes: Sustainable Approach for Managing Phosphorus Deficiency in Agricultural Soils. SpringerPlus 2013, 2, 1–14. [Google Scholar] [CrossRef] [Green Version]
  71. Alef, K.; Nannipieri, P. Methods in Applied Soil Microbiology and Biochemistry; Academic Press: London, UK, 1995. [Google Scholar]
  72. Bandick, A.K.; Dick, R.P. Field management effects on soil enzyme activities. Soil Biol. Biochem. 1999, 31, 1471–1479. [Google Scholar] [CrossRef]
  73. Turner, B.L. Resource partitioning for soil phosphorus: A hypothesis. J. Ecol. 2008, 96, 698–702. [Google Scholar] [CrossRef]
  74. Condron, L.M.; Turner, B.L.; Cade-Menun, B.J. Chemistry and dynamics of soil organic phosphorus. Agric. Environ. 2005, 46, 87–121. [Google Scholar] [CrossRef] [Green Version]
  75. Bradbury, I.K.; Malcolm, D.C. The effect of phosphorus and potassium on transpiration, leaf diffusive resistance and water- use efficiency in Sitka spruce (Picea sitchensis) seedlings. J. Appl. Ecol. 1977, 14, 631–641. [Google Scholar] [CrossRef]
  76. Lindsay, W.L.; Norvell, W.A. Development of a DTPA Soil Test for Zinc, Iron, Manganese, and Copper. Soil Sci. Soc. Am. J. 1978, 42, 421–428. [Google Scholar] [CrossRef]
  77. Muscolo, A.; Sidari, M.; Mercurio, R. Influence of gap size on organic matter decomposition, microbial biomass and nutrient cycle in Calabrian pine (Pinus laricio, Poiret) stands. For. Ecol. Manag. 2007, 242, 412–418. [Google Scholar] [CrossRef]
  78. Carrasco, B.; Cabaneiro, A.; Fernandez, I. Exploring potential pine litter biodegradability as a natural tool for low-carbon forestry. For. Ecol. Manag. 2017, 401, 166–176. [Google Scholar] [CrossRef]
Figure 1. Scheme of the sequential phosphorus extraction procedure used in this study (modified from [43]). AEM: anion exchange membrane; Pi: inorganic P; Po: organic P; HClconc: concentrated HCl. Organic P fractions are indicated with green color.
Forests 12 01398 g001
Figure 2. Variables plot for the first (Dim1), second (Dim2) and third (Dim3) components of the Principal Component Analysis based on the soil P fractions.
Forests 12 01398 g002
Figure 3. Variables plot for the first and second canonical dimensions of the Canonical Correlation Analysis performed to the P fractions and the soil composition parameters. Abbreviations for soil parameters as in Table S2.
Forests 12 01398 g003
Figure 4. Variables plot for the first and second canonical dimensions of the Canonical Correlation Analysis performed to the P fractions and the physical fertility-related parameters. Abbreviations for soil parameters as in Table S2.
Forests 12 01398 g004
Figure 5. Variables plot for the first canonical dimension of the Canonical Correlation Analysis performed to the P fractions and the chemical fertility-related parameters. Abbreviations for soil parameters as in Table S2.
Forests 12 01398 g005
Figure 6. Variables plot for the first canonical dimension of the Canonical Correlation Analysis performed to the P fractions and the soil parameters related to organic matter. Abbreviations for soil parameters as in Table S2.
Forests 12 01398 g006
Figure 7. Variables plot for the first canonical dimension of the Canonical Correlation Analysis performed to the P fractions and the soil enzymatic activity parameters. Abbreviations for soil parameters as in Table S2.
Forests 12 01398 g007
Table 1. Main stands characteristics; extracted from [25].
ParameterMeanSD 1MinMax
Elevation (m.a.s.l)821.434.9769915
Latitude (º)41.80.241.342.2
Longitude (º)−4.70.3−5.2−4.1
Slope (%)25.513.9055
Total precipitation (mm)456.127.6405548
Mean annual temperature (ºC)11.70.51112
Age (years)53.84.34561
Stocking (trees/ha)859.5428.7293.61711.8
Dominant height (m)8.61.75.512
Mean height (m)7.11.64.611.2
Quadratic mean diameter (cm)16.33.610.326.2
Basal area (m2/ha)15.85.59.132
Site index (height at 80 years age in meters)10.92.26.815
1 SD: standard deviation.
Table 2. Soil parameters used in this study and clustered into five groups (extracted from [46,47]).
GroupSoil Parameter and UnitsMeanSD 1MinMax
Soil compositionClay (%)22.410.04.543.2
SiltUS (%)53.218.513.388.6
SandUS (%)24.414.71.361.1
Carbonates (%)54.319.51.479.1
ActiveC (%)1.60.80.03.2
Gypsum (%)25.310.68.950.6
Physical fertilityBD (g/cm3)1.10.20.81.4
Porosity (%)46.16.037.158.7
FC (%)23.44.815.031.9
PWP (%)15.15.44.026.6
Chemical fertilitypH8.40.28.08.9
CEC (cmol+/kg soil)21.04.814.738.4
Fe (mg/kg soil)7.84.63.226.7
Cu (mg/kg soil)0.50.20.21.6
Mn (mg/kg soil)16.06.57.032.8
Zn (mg/kg soil)0.60.30.21.5
K (cmol+/kg soil)0.80.20.51.4
Mg (cmol+/kg soil)3.11.90.67.6
Na (cmol+/kg soil)0.10.00.00.2
Organic matterEOC (%)1.70.80.94.3
TN (%)0.10.10.00.4
TOC (%)2.11.10.25.1
Cmic (mg/kg soil)209.782.596.0445.3
Cmin (mg/kg soil week)34.211.717.362.4
Nmic (mg/kg soil)26.911.610.450.1
Pmic (mg/kg soil)7.74.31.417.2
Enzymatic activityFDA (µg/g*h)20.48.85.438.2
DHA (µg/g*h)9.44.91.923.5
Ure (µg N/g*h)76.842.017.9196.6
Cat (ml O2/3min*g)1.20.60.53.7
AlkP (µg/g*h)5.93.00.212.6
AcP (µg/g*h)4.62.40.710.3
1 SD: standard deviation. See explanation of parameters’ abbreviations in Table S2.
Table 3. Phosphorus fractions (mg·kg−1) in the studied soils.
P FractionMeanSD 1MinMax% of PTotal
PAEM3.41.91.010.61.2
PiNaHCO36.92.81.615.22.4
PoNaHCO35.53.60.215.61.9
PiNaOH11.49.53.246.93.9
PoNaOH30.520.28.6120.810.5
PHCl1M137.094.33.7387.147.3
PHClconc78.644.418.9235.527.2
PHClO416.15.66.532.05.6
PTotal289.4120.8116.8611.6100
1 SD: standard deviation.
Table 4. Spearman’s correlations between P fractions and soil composition parameters (“-” means not significant). Significance: *** p < 0.001, ** p < 0.01, * p < 0.05.
PAEMPiNaHCO3PoNaHCO3PiNaOHPoNaOHPHCl1MPHClconcPHClO4
Clay−0.40 *------0.42 *
SiltUS-----0.54 **-−0.35 *
SandUS---−0.52 **-−0.81 ***--
ActiveC--------
Gypsum-0.39 *0.46 **-0.48 **---
Carbonates-------−0.62 ***
Table 5. Spearman’s correlations between P fractions and soil physical fertility-related parameters (“-” means not significant). Significance: *** p < 0.001, ** p < 0.01, * p < 0.05.
PAEMPiNaHCO3PoNaHCO3PiNaOHPoNaOHPHCl1MPHClconcPHClO4
BD−0.36 *−0.58 **------
Porosity-0.37 *------
PWP0.36 *--0.45 *0.38 *0.49 **--
FC---0.44 *-0.49 **--
Table 6. Spearman’s correlations between P fractions and soil chemical fertility-related parameters (“-” means not significant). Significance: *** p < 0.001, ** p < 0.01, * p < 0.05.
PAEMPiNaHCO3PoNaHCO3PiNaOHPoNaOHPHCl1MPHClconcPHClO4
pH-----0.48 **--
CEC0.55 **0.53 **0.36 *-0.45 *---
Fe--0.40 *--−0.40 *-0.49 **
Cu--------
Zn--0.52 **-0.44 *---
Mn0.43 *0.52 **-−0.43 *-−0.55 **--
Mg---0.48 **-0.61 ***--
K0.54 **---0.39 *---
Na--------
Table 7. Spearman’s correlations between P fractions and soil parameters related to organic matter (“-” means not significant). Significance: *** p < 0.001, ** p < 0.01, * p < 0.05.
PAEMPiNaHCO3PoNaHCO3PiNaOHPoNaOHPHCl1MPHClconcPHClO4
TOC0.54 **0.64 ***0.40 *-0.45 *---
EOC0.73 ***0.70 ***--0.45 *---
TN0.60 ***-0.49 **-0.51 **-0.36 *0.49 **
Cmic0.51 **0.62 ***0.43 *-0.50 **---
Cmin0.46 **0.61 ***------
Nmic0.59 ***0.74 ***--0.40 *---
Pmic0.36 *-------
Table 8. Spearman’s correlations between P fractions and soil enzymatic activity parameters (“-” means not significant). Significance: *** p < 0.001, ** p < 0.01, * p < 0.05.
PAEMPiNaHCO3PoNaHCO3PiNaOHPoNaOHPHCl1MPHClconcPHClO4
FDA0.43 *0.69 ***0.41 *-----
DHA0.55 **0.51 **0.40 *-0.44 *---
Urease0.47 **0.76 ***--0.41 **---
Catalase0.77 ***0.54 **0.38 *-0.36 *---
AlkP----0.36 *---
AcP0.46 **-------
Publisher’s Note: MDPI stays neutral with regard to jurisdictional claims in published maps and institutional affiliations.

