Article

Effect of Environmental Factors on Soil Nutrient Loss under Conditions of Mining Disturbance in a Coalfield

1
Faculty of Geographical Science, Beijing Normal University, Beijing 100875, China
2
State Key Laboratory of Earth Surface Processes and Resources Ecology, Beijing Normal University, Beijing 100875, China
3
State Key Laboratory of Biogeology and Environmental Geology, China University of Geosciences, Beijing 100083, China
4
MOE Key Laboratory of Groundwater Circulation and Environmental Evolution, China University of Geosciences, Beijing 100083, China
5
SpaceWill Info. Co., Ltd., Beijing 100089, China
6
Rays Computational Intelligence Lab (RCIL), Beijing Inteliway Environmental Sci. & Tech. Ltd., Beijing 100085, China
*
Author to whom correspondence should be addressed.
Forests 2021, 12(10), 1370; https://doi.org/10.3390/f12101370
Submission received: 3 August 2021 / Revised: 26 August 2021 / Accepted: 3 October 2021 / Published: 9 October 2021
(This article belongs to the Special Issue Forest Soil Properties and Nutrient Dynamics under a Semiarid Climate)

Abstract

:
Underground coal mining can result in land deformation (e.g., land subsidence and ground fissures), and may consequently change the soil nutrients. Soil organic matter (SOM), total nitrogen (TN), and available phosphorus (AP) are critical indicators of soil fertility and eco-restoration in mining areas. In this study, soil samples (depth: 0–20 cm) were collected twice from 20 sampling points in pre-mining and post-mining in the No.12 panel of Caojiatan coalfield, in the Loess Plateau of China. SOM, TN, and AP in soil samples were measured, and the nutrient loss was evaluated. Ten environmental factors affecting soil nutrient loss were identified from a 5-m resolution digital elevation map (DEM). The paired t-test was utilized to evaluate the differences between SOM, TN, and AP in pre-mining and post-mining soil. The mechanisms of the effects of environmental factors on soil nutrient loss were revealed based on multiple linear regression, redundancy analysis (RDA), and the random forest algorithm (RF). Ordinary kriging and RF were utilized to predict and optimize the spatial distribution of the soil nutrient loss. The results showed that significant differences existed between the SOM, TN, and AP in the pre-mining and post-mining soil. The model established by RF provided a higher accuracy in terms of fitting the correlation between soil nutrient loss and environmental factors compared to the model established by multiple linear regression, and the feature importance obtained by RF showed that profile curvature, distance to working panel margin, and surface roughness were the most significant factors affecting the loss of SOM, TN, and AP, respectively. This study provides a theoretical reference for eco-restoration, as well as soil and water conservation, in subsided lands in coalfields.

1. Introduction

Coal is the most abundant fossil fuel in many countries, including Australia, India, Indonesia, the United Kingdom, and South Africa [1,2]. Coal is also the dominant fuel for power generation, industrial production, and residential consumption in many developing countries [3,4]. Although large-scale and high-intensity exploitation of coal resources has promoted economic development, it extensively damages the ecosystem and causes severe environmental problems, such as heavy metal pollution, soil erosion, and land degradation [5,6,7,8,9,10]. China is the largest producer and consumer of coal in the world, and coal accounts for about 70% of its primary energy [11]. More than 90% of coal in China is obtained through underground mining, and this mode of resource extraction causes significant destruction to the ecological system and land environment [12,13,14]: the root system and environment of microbes is destroyed, the soil material and soil nutrients are lost or reduced, the cycling of the soil nutrients is less efficient, the availability of soil microelements is reduced, and the ecological balance is destroyed [15,16,17]. Generally, this destruction is not self-healing under the conditions of mining disturbance [18].
With the advance of the working face and the exploitation of a coal seam, the initial stress in the rock mass changes and is redistributed, and land deformation (e.g., subsidence, ground fissures) may occur in coal mine areas [19,20,21]. The subsidence is more disturbed in the marginal area zone (e.g., area adjacent to the working panel) than in the central part of the working panel [22,23]. These cracks cannot be naturally closed, and consequently the soil fertility severely deteriorates [24]. Soil organic matter (SOM), total nitrogen (TN), and available phosphorus (AP) are the important limiting factors for plant growth in arid and semiarid ecosystems [25,26,27]. However, mining activities cause a loss of the litter layer in the topsoil, which is an integral storage and exchange site of nutrients and is enriched with soil microelements [16]. Due to the loss of litter layers and organic matter, the nutrient-holding capacity of the soil is drastically reduced [28]. Coal mining subsidence can also accelerate soil erosion and underground leakage, which leads to a serious nitrogen loss in the soil [29]. The additional slope caused by subsidence can aggravate nutrient loss and thus reduce the availability of soil nutrients [30]. AP is significantly correlated with soil microbes, and the decrease of AP can induce a drastic decline of the soil microbe community [31]. Although studies have reported that the soil nutrients in the subsidence area are often significantly lower than in unmined areas, only a few studies have focused on a comparison between the soil nutrients in pre-mining soil and post-mining soil [32,33,34,35]. Such a comparison could quantitatively assess the effect of mining disturbance on soil nutrient loss, and provide a better understanding of soil fertility degradation in the topsoil.
The soil nutrient loss in the topsoil is also controlled by various environmental factors under the conditions of mining disturbance, including topography, vegetation, hydrology, and other human activities [10,28]. Topography affects the nutrient loss by providing a higher erosive power along the slope, and aggravating the formation of ephemeral gullies on the edge of the land subsidence area [36,37]. These ephemeral gullies are likely to develop in areas with irregular surface geometry, and abrupt changes of steepness and curvature [38]. The subsidence area thus provides a favorable environment for the occurrence of ephemeral gullies, and these topography factors affect the soil nutrient loss [39]. Hydrology factors, such as the topography wetness index (TWI) and drainage density, can reflect the soil water content, flow regime, flow energy, and flow discharge, which also affect the soil nutrients [15,40]. The vegetation coverage also significantly affects the soil nutrient loss, as the shear resistance ability and the anchoring effect provided by the root system can protect the soil particles from ground fissures [41]. The distance to the working panel margin may indicate the extent of the destruction from mining to the topsoil, as the ground fissures and subsidence are not self-healing in the area adjacent to the working panel margin, which allows the soil nutrients to be constantly lost [10]. The effects of these environmental factors on the soil nutrient loss have not been comprehensively discussed in previous studies.
The variation characteristics of soil nutrients and their relationships with environmental factors are complex and generally non-linear. Thus, traditional multiple linear regression analysis, path analysis, and other regression methods cannot accurately reveal the effect of these environmental factors on soil nutrient loss [10]. Recently, machine learning has shown potential in regression and classification. Random forest (RF) is a powerful algorithm in regression due to its unique out-of-bags technique to calculate the error [42]. Numerous case studies on soil mapping have proven the robust performance and accurate prediction of the random forest algorithm, incorporating it with helpful environmental factors; RF could thus improve the macro-spatial pattern of soil nutrient loss and provide dependable results for unmeasured points.
The coalfield in the Loess Plateau of China is well known for its fragile ecosystem. Uneven land subsidence and ground fissures have occurred in the coal mine areas with the advance of the working faces, and these land deformations have destroyed plant root systems and caused severe soil nutrient loss [43]. The collapsible soil in the study area has poor structure, low mechanical strength, and weak tensile deformation resistance, and the vertical cracks in the soil layer have a high degree of development and form a weak surface to block the movement and deformation transmission in the soil layer [10]. The cracks expand to form a stretched ground fissure under the action of mining tensile stress. Thus, the objective of this study was to: i) quantitatively assess the soil nutrient loss occurring due to mining disturbance, ii) evaluate the impact of each environmental factor on the soil nutrient loss, and iii) obtain the optimized spatial distribution of soil nutrients.

2. Materials and Methods
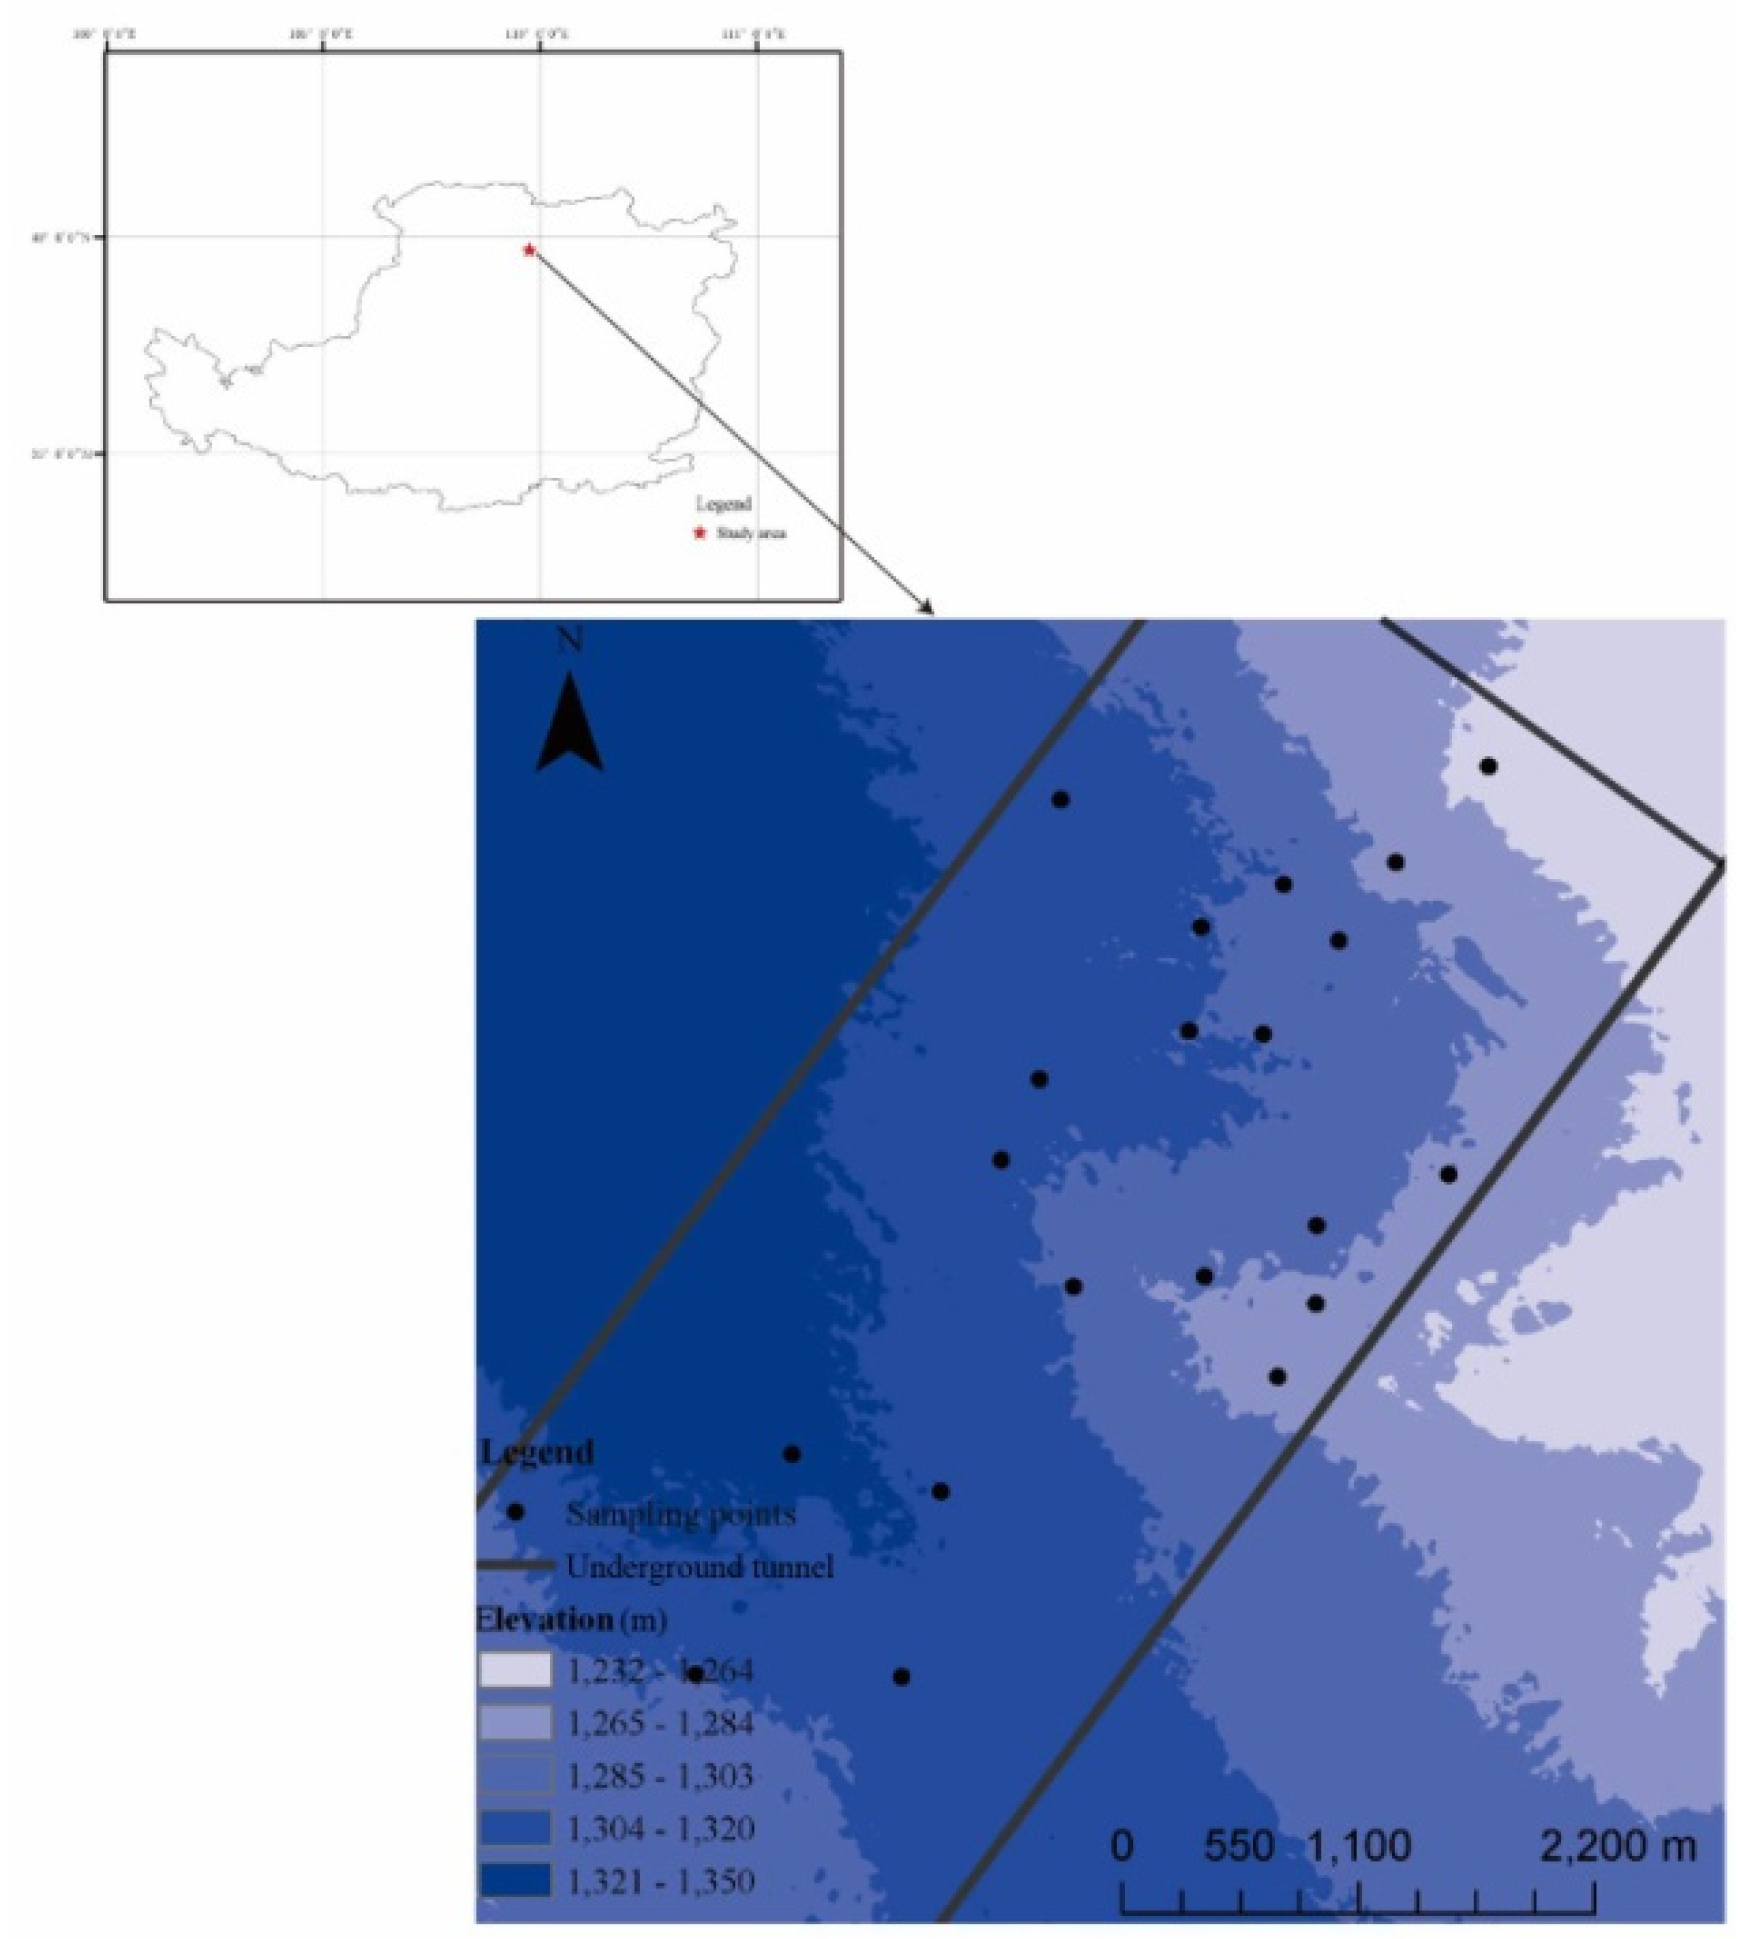
2.1. Study Area

The Caojiatan coalfield (109°52′26.79″–109°56′48.61″ E, 38°39′41.98″–38°36′11.97″ N) is located in the north of Yulin City, Shaanxi Province, China. Elevations range from 1023 to 1350 m. The area has a typical semi-arid continental monsoon climate. The mean annual precipitation is 447 mm, of which 70% falls in July, August, and September. The average annual temperature is 9.7 °C. The Caojiatan coalfield is located at the southern margin of the Maowusu Desert, and more than 70% of it is desert [44]. The soil parent material is sandstone (J2z). The soil has a typical loamy sand texture, and the topsoil is basically covered by aeolian sand. The main landforms are desert bottomland and dunes. Currently, the main land-use types in the coalfield are industrial square, grassland, shrubland, wasteland, and arable land [45]. The dominant species of grass communities are Bothriochloa ischaemum (Linn.) Keng, Artemisia sacrorum, and Artemisia giraldii Pamp. The dominant species of the shrub communities are Hippophae rhamnoides Linn., Caragana korshinskii Kom., and Sophora viciifolia [10,45].

2.2. Soil Sampling and Lab Analysis

Soil samples were collected twice from 20 sampling points in pre-mining and post-mining in the No.12 panel of the coalfield. For the first sampling period, twenty soil samples were collected in April of 2019, using a soil auger, at a depth of 0–20 cm, in the pre-mining soil prior to mining disturbance (Figure 1). Sampling was performed using the five-point sampling method, in which soil was collected from five points within a 50 m radius and combined to generate a mixed sample. The soil samples were air-dried and sieved through a 2 mm sieve prior to the chemical and physical analyses. The second sampling period was in October of 2019, post-mining. To ensure comparability with the first set of sampled data, the sampling points and processes were the same. Land deformation (e.g., ground fissures, uneven subsidence, ephemeral gullies) was found in the post-mining topsoil for all 20 sampling points. The land use type of the 20 sampling points was shrubland, and the shrub community was Caragana korshinskii Kom.
Three soil fertility indicators were chosen to evaluate the fundamental properties in the pre- and post-mining soil. Our analytical items included soil organic matter, total nitrogen, and available phosphorous. Soil organic matter was measured using a K2Cr2O7 heating method, TN was measured using a semi-micro Kjeldahl method, and AP via alkaline hydrolysis NaHCO3-extraction with Mo–Sb–Vc-colormetry [10]. We measured each sample three times, and the mean value of each indicator was taken as the analysis value. All of the aforementioned properties were analyzed at the laboratory of the Chinese Academy of Agricultural Sciences. The soil nutrient loss was calculated using the following formula:
D (SOM, TN, AP) = Post mining soil (SOM, TN, AP) − Pre mining   soil (SOM, TN, AP)
where D (SOM, TN, AP) is the decreased value of SOM, TN, and AP. Post-mining soil (SOM, TN, AP) is the nutrients under the second sampling and pre-mining soil (SOM, TN, AP) is the nutrients under the first sampling.
A K-S test was performed to check the normality assumption and the paired t-test was utilized to evaluate the difference between soil nutrients in pre-mining and post-mining soil. The ordinary kriging coupled with RF were utilized to demonstrate the macro pattern of the DSOM, DTN, and DAP.

2.3. Extraction of Environmental Factors

A total of 10 environmental factors that could potentially affect the nutrient loss were considered. They were relief amplitude, slope gradient, variation of slope gradient, profile curvature, plan curvature, topography wetness index, drainage density, distance to working panel margin, surface roughness, and the normalized difference vegetation index. A digital elevation model (DEM) with a 5-m resolution was applied to extract the slope gradient, variation of slope gradient, curvature, and drainage. The stream network was determined from DEM using a stream threshold of 400. The DEM was conducted by Resources Satellite Three (ZY-3), the first civil high-resolution stereoscopic Earth mapping satellite of China. It carries three high-resolution panchromatic cameras and an infrared multispectral scanner. The relief amplitude (Formula (1)), TWI (Formula (2)), and surface roughness (Formula (3)) were calculated as below [46]:
R e l i e f   a m p l i t u d e = h m a x h m i n
T W I = L N ( A S / tan S )
S u r f a c e   r o u g h n e s s = 1 / cos ( S * π / 180 )
where hmax is the maximum elevation value of all pixels in the neighborhood, and hmin is the minimum elevation value of all pixels in the neighborhood. AS is the specific catchment area in square kilometers, and S is the local slope gradient in degrees.
The working panel was delineated using the coordinates provided by the Xi’an Research Institute of China Coal Technology and Engineering Group, and the distance to mining was calculated using the Euclidean distance. All of the aforementioned environmental factors were calculated and extracted using ArcGIS 10.2. The Normalized Difference Vegetation Index (NDVI) was computed from Sentinel 2 (4 January 2019, 10 m resolution), by ENVI 5.3 software.

2.4. RDA and Multiple Linear Regression

Redundancy analysis (RDA) is a sorting method that combines regression analysis and principal component analysis. By analyzing the correlation between the dependent variable and the independent variables, the reasons for the variation of the dependent variables can be assessed [47]. This method uses the nutrient loss as the dependent variable and the environmental variables as the independent variables to establish a linear regression model to describe the proportion of the dependent variable variation caused by each independent variable. A higher proportion represents a more significant correlation [48].
The multiple linear regression can be expressed as follows (4):
D ( S O M , T N , A P ) = a 1 x 1 + a 2 x 2 + a 10 x 10
where a1,…, a10 are the partial correlation coefficients and x1,…, x10 are the environmental factors. The standardized regressive coefficient calculated based on the partial correlation coefficient demonstrates the effect of the environmental factors on soil nutrient loss.

2.5. Random Forest Regression Trees

A random forest (RF) regression was used to model the non-linear correlation between nutrient loss and environmental factors under mining disturbance [49]. The machine learning algorithm requires a large dataset to obtain an optimized and stable model, avoiding underfitting. However, the powerful predicting ability of RF allows it to acquire an optimized model with a small dataset. The RF algorithm uses a bootstrapping method based on regression tree analysis to predict a continuous response variable. It fits a collection of decision tree models to the dataset. Each tree, trained using different bootstrap samples of the training data, acts as a regression function on its own, and the final output given by the regression corresponds to the average of the individual tree outputs [50]. The samples that are not in the bootstrap sample are called out-of-bag (OOB) samples; they are used to test the accuracy of the decision trees and estimate the overall model’s misclassification error and variable importance [50]. The OOB ensures that each decision tree in the RF is a relatively accurate classification model; thus, the ensemble of these trees achieves a higher accuracy than the normally utilized BRT method. Hence, OOB is able to strictly control errors. Due to its cross-validation capability, RF regression provides realistic prediction error estimates during the training process, which gives it a powerful generalization ability to predict the unmeasured value [51]. Other advantages of RF include its minimized risk of overfitting, the possibility of including categorical along with continuous explanatory variables, and the small number of model parameters that need to be specified compared to other modeling approaches [50]. RF also provides several metrics to aid in interpretation: for instance, it automatically computes a variable importance score that assesses the contribution of individual predictors to the final model.
After the optimized model was established based on RF, it also provided a powerful prediction ability to simulate soil nutrient loss in other unmeasured points. The kriging was utilized to predict the spatial distribution of soil nutrient loss, and RF was subsequently utilized to predict the other 20 unmeasured subsided points. These 20 unmeasured points were added to the observation points into kriging as measured points, to optimize the macro-spatial pattern of nutrient loss. The RF model was evaluated using mean absolute error (MAE) (Formula (5)), root mean squared error (RMSE) (Formula (6)) and mean squared error (MSE) (Formula (7)) as follows:
M A E = 1 n x L | y L s L |
R M S E = x L ( y L s L ) 2 n
M S E = 1 n x L ( y L s L ) 2
These three parameters combined with the mean error (ME), root mean square standardized error (RMSSE), and average squared error (ASE) were utilized to inaugurate the appropriate kriging model presentation. The formulae of ME, RMSSE, and ASE can be found in a previous study [10].

3. Results

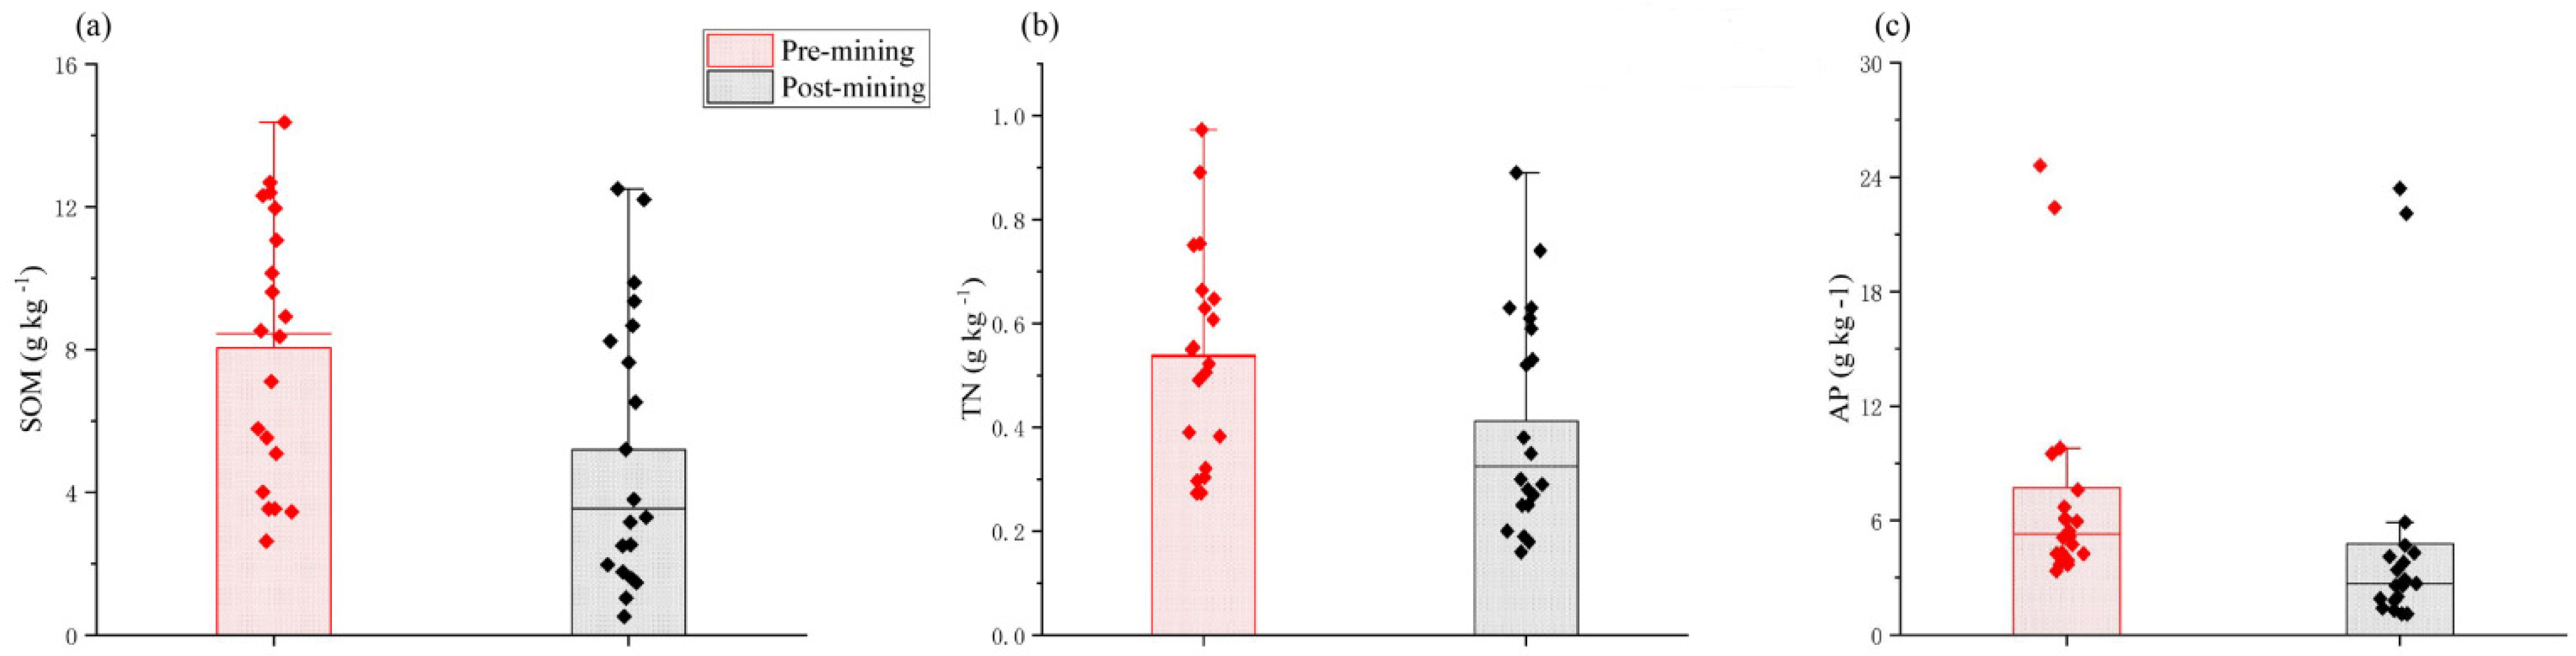
3.1. Comparison between SOM, TN, and AP in Pre- and Post-Mining Soil

Comparisons of SOM, TN, and AP in the pre-mining and post-mining soil were shown in Figure 2. In the pre-mining period, SOM, TN, and AP varied from 2.6 to 14.4 g kg−1, 0.273 to 0.891 g kg−1, and 3.4 to 32.5 mg kg−1, with an average of 8.05 g kg−1, 0.539 g kg−1, and 7.73 mg kg−1, respectively. In the post-mining soil, SOM, TN, and AP varied from 0.5 to 12.5 g kg−1, 0.182 to 0.890 g kg−1, and 1.1 to 23.4 mg kg−1, with an average of 5.2 g kg−1, 0.412 g kg−1, and 4.8 mg kg−1, respectively. The variation of the three soil nutrient indexes is shown in Table 1. SOM, TN, and AP decreased in the post-mining soil in the range of 0.1 to 7.1 g kg−1, 0.001 to 0.364 g kg−1, and 0.1 to 9.1 mg kg−1, with an average of 2.9 g kg−1, 0.127 g kg−1, and 2.9 mg kg−1, respectively. The data of the samples satisfied the normality assumption, with the p values of SOM, TN, AP, DSOM, DTN, and DAP all above 0.05 (p > 0.05). The paired t-test was conducted to evaluate the differences between SOM, TN, and AP in the pre-mining and post-mining soil (Table 1). The t values of SOM, TN, and AP were 3.338, 4.539, and 4.742, with p < 0.005, p < 0.001, and p < 0.001, respectively. The average decrease of SOM, TN, and AP compared to the pre-mining soil were 35.49%, 23.56%, and 38.06%, respectively. The results of the t-tests demonstrated a significant difference between the three soil nutrient indexes in the pre-mining and post-mining soil. We found that the soil nutrients dramatically decreased due to mining activities.
As shown in Figure 3, the liner regression correlating SOM and TN in the pre-mining and post-mining soil was fitted. The value of R square was 0.54 in the linear fitting of SOM and TN in the pre-mining soil, while it reached to 0.95 in the linear fitting of SOM and TN in the post-mining soil, demonstrating that mining activities enhanced the correlation between SOM and TN. The correlation between SOM and AP, and TN and AP, in both pre-mining soil and post-mining soil, was not significant.

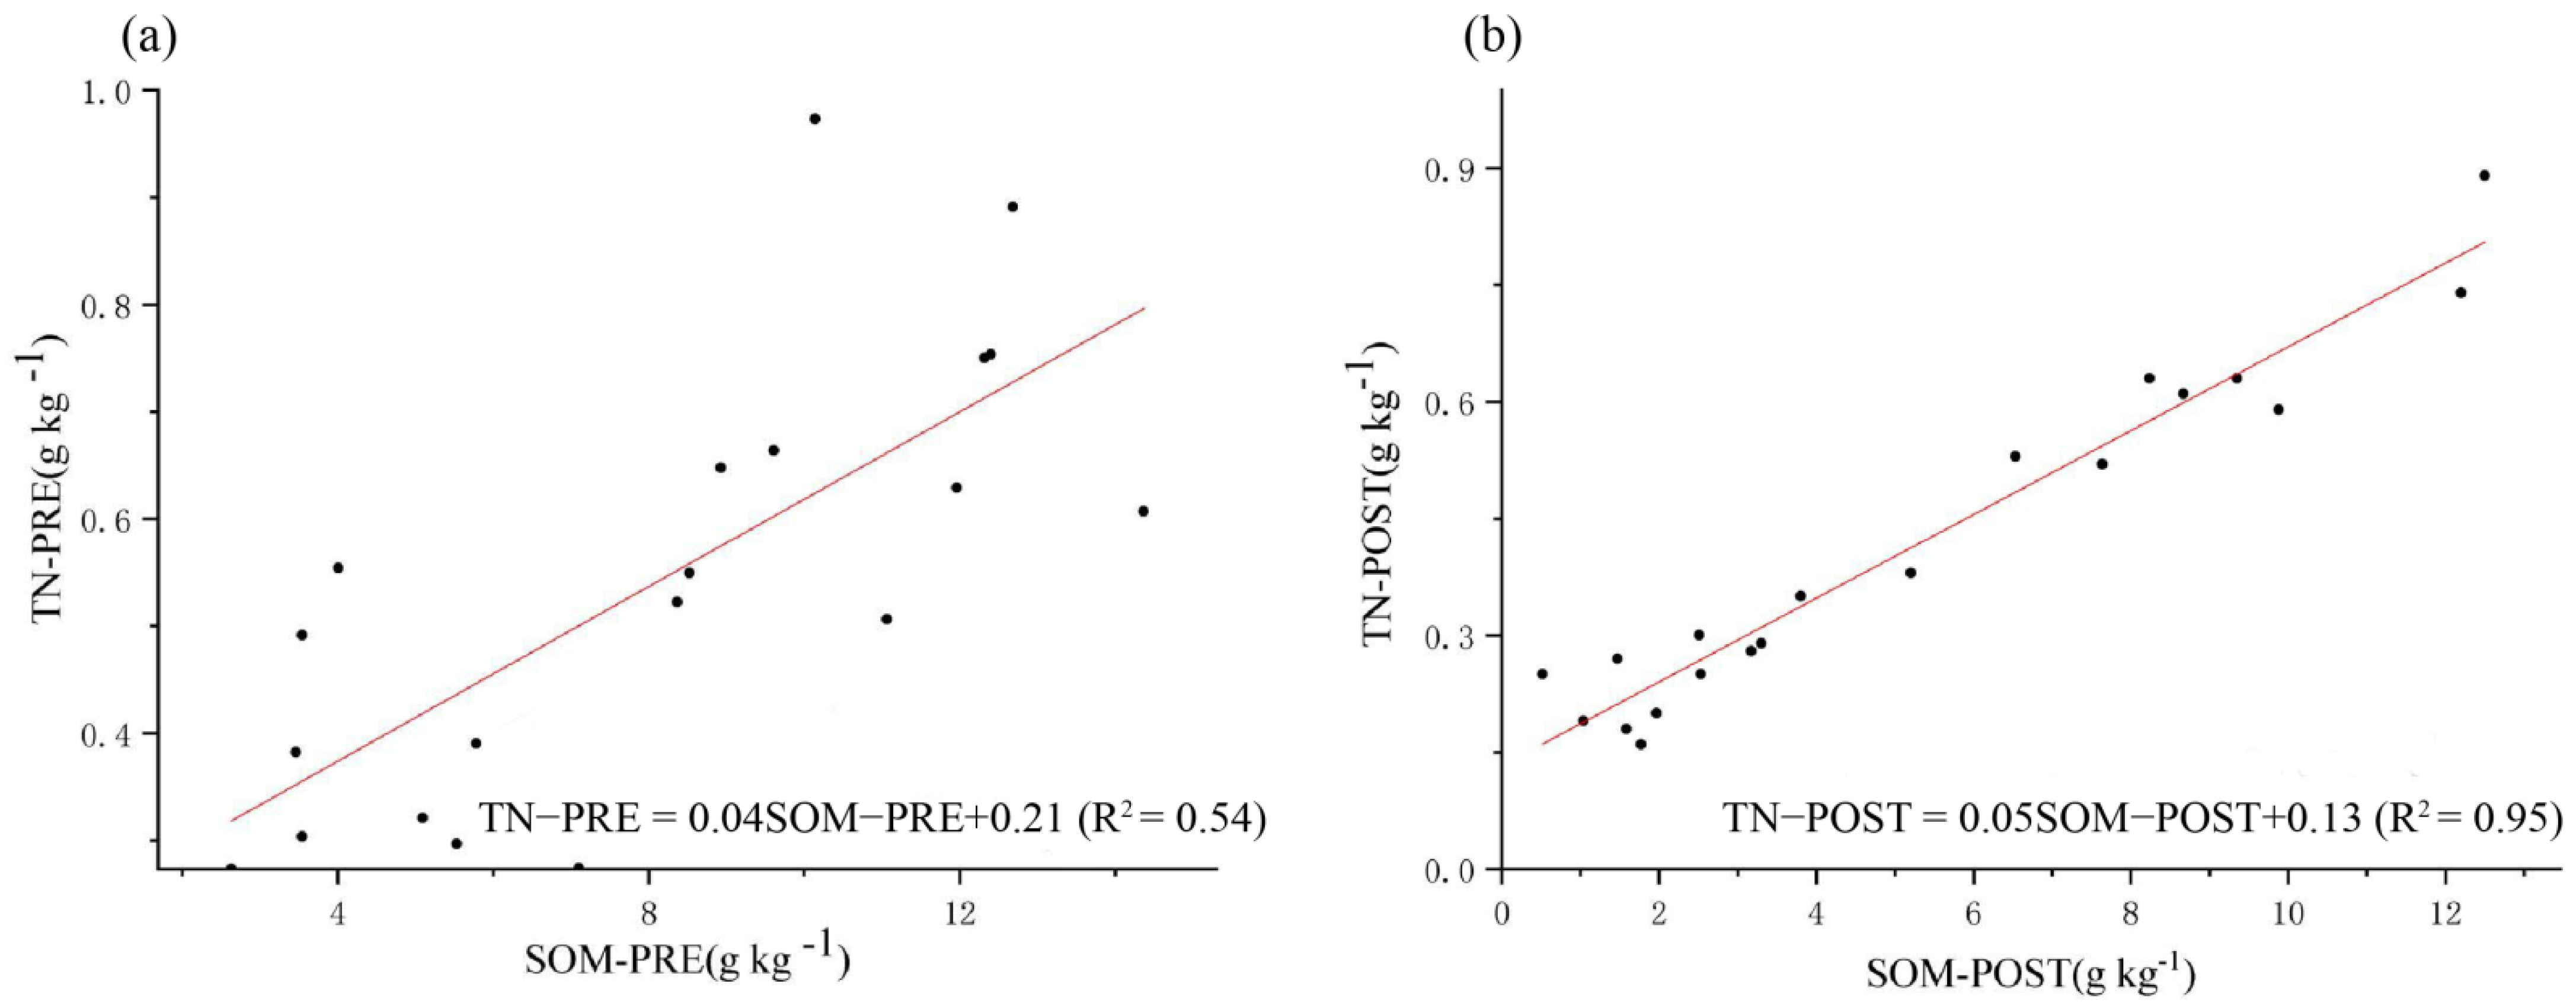
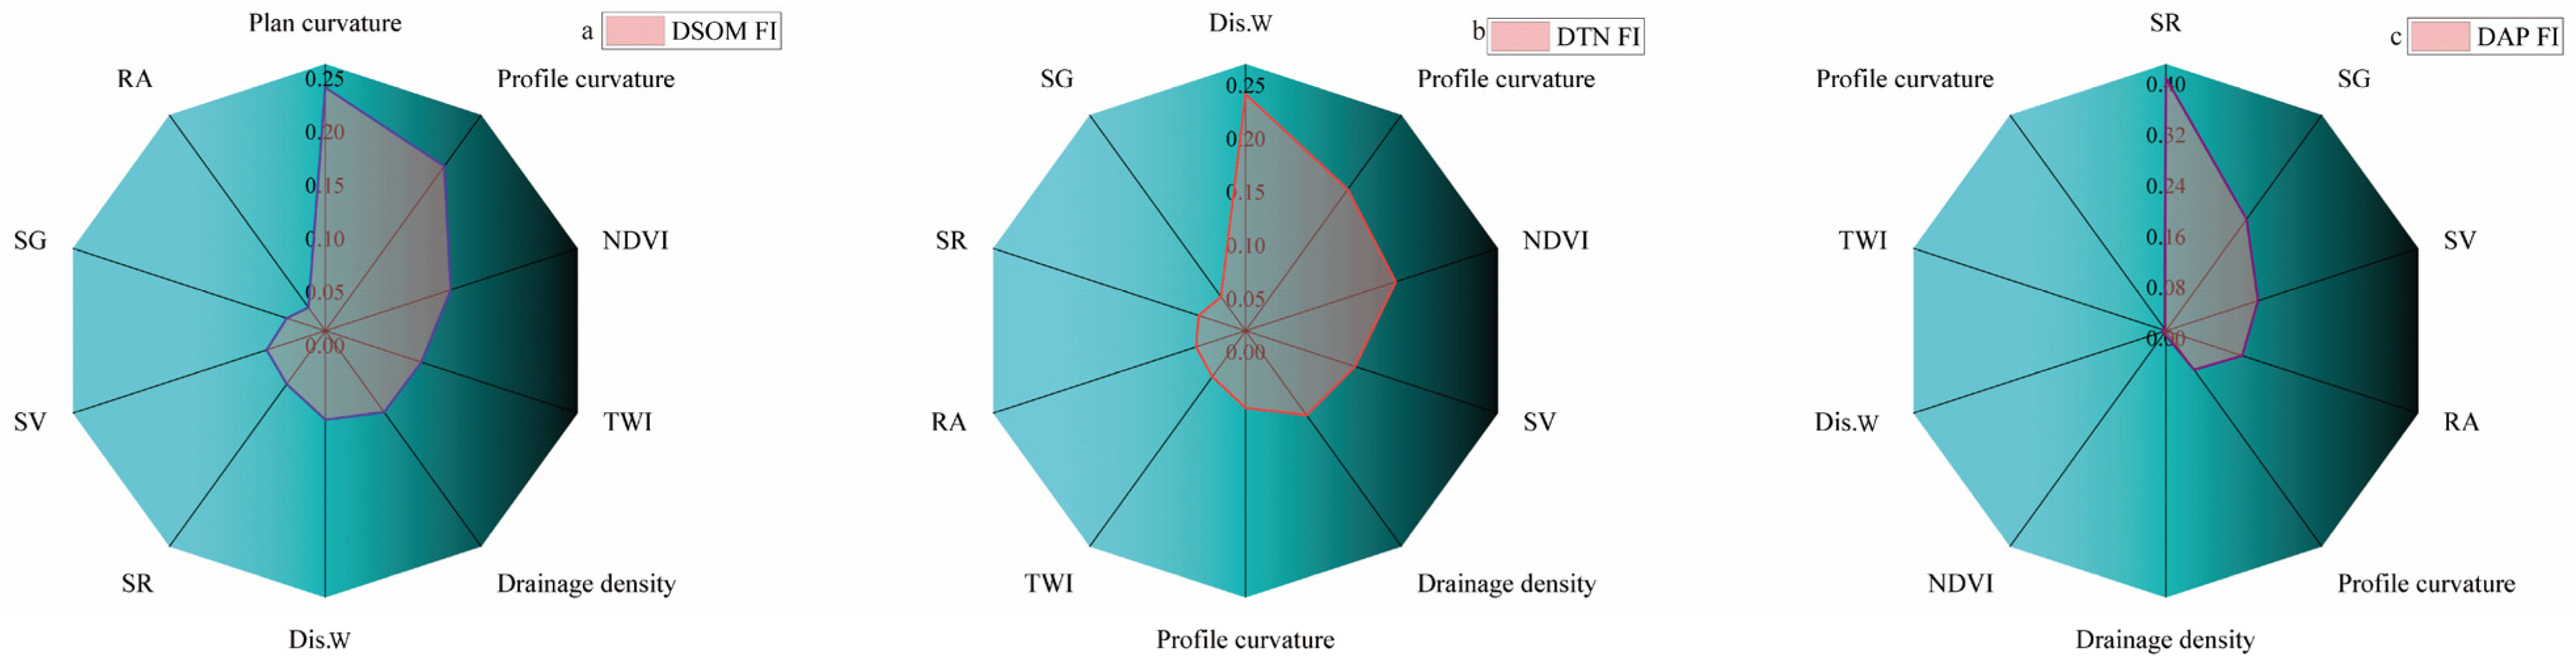
3.2. The Relationship between the Decrease of Soil Nutrients and Environmental Factors

The correlation between environmental factors and soil nutrient loss is shown in Table 2 and Table 3, using RDA. For SOM, the total contribution was 15.7%, and surface roughness, distance to working panel margin, drainage density, and relief amplitude contributed 21.0%, 18.9%, 17.6%, and 16.6%, respectively. These four environmental factors contributed significantly to the total explanation (p < 0.05) of DSOM. For TN, the total increased to 19.0%, and profile curvature, relief amplitude, and surface roughness contributed 47.6%, 15.8%, and 14.6%, respectively. These three factors significantly contributed to the total explanation of DTN. In terms of AP, the total contribution reached 44.8%, and relief amplitude, profile curvature, and distance to mining contributed 47.8%, 13.3%, and 12.4%, respectively. These three factors significantly contributed to the total explanation of DAP.
Among the three predictors, the DAP model showed the most powerful predicting function, with the highest total explanation. The DSOM model showed the lowest total explanation, demonstrating that the environmental factors were not significant in terms of predicting the decreased value of SOM. Among the environmental factors, distance to working panel margin and drainage density were significantly correlated with DSOM and DAP, while they scarcely contributed to DTN. Profile curvature was significantly correlated with DAP and DTN, while it scarcely contributed to DSOM. Surface roughness was significantly correlated with DSOM and DTN, while it scarcely contributed to DAP. Relief amplitude was significantly correlated with all soil nutrients, while NDVI and TWI scarcely contributed to any of the predictors.
The results of the multiple linear regression correlations with environmental factors and DSOM, DTN and DAP are shown below (Formulas (8)–(10)):
DSOM = 1.034 × relief   amplitude 0.14 × slope   gradient 0.045 × slope   variation 0.841 × plan   curvature 0.027 × profile   curvature + 1.816 NDVI + 0.008 × TWI + 0.007 × distance   to   working   plane 0.228 × drainage   density 0.039 × surface   roughness 8.014 ( R 2 = 0.16 )
The standardized coefficients showed that relief amplitude (−0.35) and distance to working panel margin (0.33) significantly affected DSOM, followed by drainage density (−0.264) and surface roughness (−0.253).
DTN = 0.298 × relief   amplitude 0.052 × slope   gradient 0.008 × slope   variation 0.024 × plan   curvature 0.025 × profile   curvature + 0.193 × NDVI + 0.014 × TWI 0.0008 × distance   to   mining + 0.002 × drainage   density 0.008 × surface   roughness 0.424 ( R 2 = 0.20 )
The standardized coefficients showed that relief amplitude (−1.748) and slope gradient (−1.364) significantly affected DTN, followed by slope variation (−0.647) and surface roughness (−0.432).
DAP = 6.210 × relief   amplitude 1.194 × slope   gradient 0.083 × slope   variation 0.872 × plan   curvature 0.578 × profile   curvature + 9.417 × NDVI 0.354 × TWI + 0.009 × distance   to   mining + 0.267 × drainage   density 0.026 × surface   roughness 3.674 ( R 2 = 0.56 )
The standardized coefficients showed that relief amplitude (−1.646) and slope gradient (−1.410) significantly affected DAP, followed by distance to working panel margin (0.328) and slope variation (−0.298).

3.3. Modelling DSOM, DTN, and DAP Using Random Forest

The multiple linear regression between DSOM, DTN, and DAP with the environmental factors showed a relatively low value of R square, demonstrating that the correlations may be better fitted using a non-linear algorithm. The result of feature importance conducted by random forest is shown in Figure 4. The MAE, MSE, and RMSE values in the model correlated with DSOM and environmental factors were 0.072, 0.013, and 0.112, respectively. The feature importance showed that plan curvature (0.228) was the most significant factor affecting DSOM, followed by profile curvature (0.191), NDVI (0.124), TWI (0.095), drainage density (0.094), distance to working panel margin (0.083), surface roughness (0.062), slope variation (0.058), slope gradient (0.038), and relief amplitude (0.027). In terms of the DTN model, the MAE, MSE, and RMSE were 0.093, 0.032, and 0.181, respectively. The feature importance showed that distance to working panel margin (0.222) was the most significant factor affecting DTN, followed by profile curvature (0.164), NDVI (0.149), slope variation (0.108), drainage density (0.098), plan curvature (0.072), TWI (0.053), relief amplitude (0.049), surface roughness (0.046), and slope gradient (0.039). As for the DAP model, the MAE, MSE, and RMSE were 0.05, 0.004, and 0.065, respectively. The feature importance showed that surface roughness (0.398) was the most significant factor affecting DAP, followed by slope gradient (0.217), slope variation (0.153), relief amplitude (0.127), profile curvature (0.076), drainage density (0.008), NDVI (0.006), distance to working panel margin (0.006), TWI (0.005), and plan curvature (0.003). The results showed that random forest had a higher accuracy in terms of predicting DSOM, DTN, and DAP. Thus, the feature importance could be a more reliable index to analyze the influence of environmental factors on soil nutrient decrease, compared to the standardized coefficients.

3.4. Predicting the Spatial Distribution of DSOM, DTN, and DAP by Combining Random Forest and Kriging

The sampling points were relatively deficient in the present study. Thus, random forest was utilized to predict the correlation of DSOM, DTN, and DAP with environmental factors, using 20 further mining disturbance points. These points were added to the study area with all environmental factors extracted. The tendency of the spatial distribution was smooth with the addition of the 20 points predicted by random forest (Figure 5). SOM decreased drastically in the north-east of the study area, adjacent to the working panel margin, and the decline slowed away from the working panel margin. The SOM decreased least in the north-west of the study area. TN decreased drastically in the northern and eastern area, except for the south-west corner of the study area, and this result was reversed from that of SOM. TN also decreased by the least in the middle and south-west corner of the study area. In terms of AP, the spatial distribution was homogeneous, with the greatest decline occurring in the middle and south-east of the study area, and the smallest decline in the west of the study area.
The accuracy of kriging interpolation was validated by 10-cross validation (Table 4). With ME and MSE close to 0, RMSE close to ASE, and RMSSE close to 1, the interpolation was perceived as accurate. The ME of DSOM, DTN, and DAP using 20 points and 40 points was 0.504 and 0.053, −0.051 and −0.002, and −0.094 and −0.025, respectively. The MSE of DSOM, DTN, and DAP using 20 and 40 points was 0.146 and 0.029, −0.620 and −0.020, and −0.041 and −0.010, respectively. The RMSSE of DSOM, DTN, and DAP using 40 points were all closer to 1 than those using 20 points. Thus, the kriging combined with random forest provided an optimized spatial pattern of soil nutrient decline.

4. Discussion

4.1. Effects of Mining Disturbance on Soil Nutrient Loss

As shown in Table 2 and Figure 2, the three measured soil nutrients declined significantly in the post-mining soil, demonstrating severe destruction of the topsoil and soil nutrient loss under conditions of mining activity. With the implementation of the “Grain for Green” project, the soil nutrients increased in the study area with the treatment of a covering of caragana microphylla due to its nitrogen fixation capacity, litter residue, and root system, which protect the soil aggregates from soil erosion [45,52]. However, the soil nutrients drastically decreased in the post-mining soil, demonstrating that the root system, as well as the soil aggregates, were destroyed by underground mining. Surface deformation may significantly alter the soil texture in the topsoil, as clay and silt particles may be entrained through the cracks and sustain vertical loss. These particles are enriched with soil nutrients, and their loss directly causes soil nutrient decline in post-mining soil. Due to the loss of these finer particles, nutrient-holding capacity is also drastically reduced [53,54].
The soil microbial community is essential for the accumulation and decomposition of SOM, and microbes are responsible for decomposition of plant litter and animal residues [28]. They also contribute to the decomposition of organic matter that produces slimes and gums, which aid in the formation of soil structures and humus [28]. Previous studies have shown that the diversity and richness of the bacterial community drastically decrease with mining disturbance, which affects the stability of the soil aggregates and leads to the decrease of SOM and TN [27,35]. The loss of these soil nutrients induced by mining disturbance may directly affect the richness and diversity of the bacteria, thus affecting the mineralization of organic N and p, and dissolution of inorganic N and P. Meanwhile, surface subsidence and ground fissures can alter the soil physical properties (e.g., porosity, soil bulk density). With an increase of soil porosity, the SOM loss can be aggravated [24,55]. SOM is the major source of N and P; with the decrease of SOM, the aggregation and the availability of nutrients could drastically decline, which may lead to a decrease of TN and AP in post-mining soil [3,10]. The R2 values of the correlation of TN and SOM were 0.54 and 0.95 in the pre- and post-mining soil, respectively, and an increased correlation could be induced by the loss of the inorganic form N. Plant and microbial N uptake is likely less in post-mining soil. Due to the cracks and increased infiltration, inorganic N is potentially susceptible to greater losses from leaching, volatilization, and conversion to gaseous forms than organic forms of N [10,28]. With the development of ground fissures, surface runoff may gather though these tunnels, while the runoff stored by topsoil may decrease. Ground fissures also promote the evaporation of soil moisture [15]. As a result, soil moisture in areas exposed to mining disturbance, especially areas with ground fissures, is likely to decrease. AP is related to the soil moisture, and with the decrease of soil moisture, AP drastically decreases. AP loss can generally be attributed to low primary productivity and high nutrient immobilization by calcium and magnesium [15]. Meanwhile, cracks, which result in the leakage of soil water, increase the effective flow path of water and promote soil water movement to the bottom layers of the soil, which further induces the loss of AP [2,10]. SOM, TN, and AP are the dominant factors for the development of soil bacteria communities.

4.2. Effects of Environmental Factors on Soil Nutrient Loss

Based on the results of the linear regression and random forest, plan curvature was the most significant factor and was negatively correlated with DSOM, demonstrating that a convex surface is related to divergence of the flow across the topsoil surface, and can aggravate the SOM loss under the conditions of mining disturbance. Ground fissures and subsidence in the topsoil can aggravate the SOM loss with divergence of the flow, as the cracks increase the potential of preferential flow and thus aggravate the damage to the humus layer in the topsoil [2]. Divergence of flow also contributes to the formation of ephemeral gullies, which generate the incision of overland flow into the cracks, and thus aggravate soil erosion and SOM loss [56]. Soil materials are voided by slumping of these unstable gullies and cracks, and are subsequently transported by the flowing runoff in both the vertical and horizontal directions [56]. SOM decreases slightly under a convergence of the flow, demonstrating that the accumulation of runoff could alleviate the SOM loss in the topsoil. Previous studies have demonstrated that convergence of the flow may cause less tensile stress compared to divergence of the flow, which may prevent the development of ground fissures [57]. Convergence of the flow could also contribute to the accumulation of SOM in the center of the subsidence, which would also alleviate the SOM loss. Profile curvature contributes significantly to the decrease of the SOM, suggesting that accelerated flow could aggravate the loss of SOM, and decelerated flow could alleviate the loss of SOM. The erosive power of accelerated flow could increase and thus aggravate the destruction of soil aggregates, and lead to SOM loss [58].
The distance to working panel margin significantly affected TN loss, with a negative correlation. Ground fissures occurred on the edge of the working panel due to tensile stress, and these are not able to spontaneously recover [10]. Ground fissures in the middle part of the working panel first expand and then compress, and may eventually recover though self-healing [21]. Thus, N-fixing bacteria could prevent TN loss in the middle part of the working panel; these bacteria are susceptible to mining disturbance, and their community and abundance also drastically decrease at the edge of the working panel [59]. Profile curvature also contributed significantly to TN loss, as accelerated flow aggravates the leaching of TN. NDVI significantly contributed to both SOM and TN loss, with a positive correlation, demonstrating that plants and their root systems can increase the nutrient-holding capacity and prevent soil erosion under uneven subsidence.
Surface roughness and slope gradient significantly affect AP loss, with a negative correlation. With elevating surface roughness, the soil erosion is aggravated, increasing AP loss. The availability of P is limited in the study area. Thus, the AP in the topsoil is susceptible to ground fissures, and can be eroded through cracks [10]. The uneven subsidence, which induces an additional slope, can also aggravate AP loss. With an elevated slope gradient, AP loss is aggravated as the clay and silt particles in which P is enriched are transported and eroded.
The standardized coefficient of relief amplitude was greatest in the linear regression. However, it barely affected DSOM, DTN, and DAP in the RF model. Meanwhile, the standardized coefficient of NDVI was low in the linear regression; it significantly affected DSOM and DTN in the RF model. Thus, it could be inferred that the intricate non-linear regressions among the nutrient loss and environmental factors could be better simulated using a machine learning algorithm.

4.3. Optimized Spatial Distribution Modelling Based on RF

By comparing the results of the kriging interpolation, we inferred that RF contributed to the improved accuracy of the macro-spatial pattern, with a smooth distribution and tendency. By using ordinary kriging, the nutrient loss at the unmeasured points was predicted only by the semi-variance. With the addition of predicted values using RF, the correlation with the soil nutrient loss and environmental factors achieved a higher accuracy and well-distributed measured points, which significantly enhanced the performance of the interpolation of DSOM, DTN, and DTN.

5. Conclusions

This study analyzed the effects of environmental factors on soil nutrient loss in topsoil under land deformation (e.g., land subsidence and ground fissures) in the Caojiatan coalfield. Significant differences were found between SOM, TN, and AP in pre-mining soil and post-mining soil. The soil nutrients at 20 measured points all decreased after the mining disturbance, demonstrating severe destruction of the soil fertility caused by mining activities. The results of RDA analysis demonstrated that the distance to working panel margin, profile curvature, and relief amplitude significantly contributed to the decrease of SOM, TN, and AP. Multiple linear regression demonstrated that relief amplitude was the most dominant factor affecting the decrease of SOM, TN, and AP. The results of RF showed that plan curvature, distance to working panel margin, and surface roughness were the most significant factors affecting DSOM, DTN, and DAP. Mining disturbance caused loss of the litter layer and microbes, which affected the availability of soil nutrients and nutrient-holding capacity in the topsoil. Inorganic N is potentially subject to greater losses from leaching, volatilization, and conversion to gaseous forms than organic forms of N. Meanwhile, the profile curvature contributed to the formation of ephemeral gullies, and thus aggravated SOM loss. The distance to working panel margin contributed to the formation of fissures, and thus aggravated TN loss. The surface roughness contributed to aggravating the soil erosion intensity and AP loss. RF predicted the soil nutrients at unmeasured points, and thus optimized the macro-spatial pattern of DSOM, DTN, and DAP.

Author Contributions

Investigation, Z.W.; Writing–original draft, Z.W.; Writing–review & editing, G.W.; Data curation, C.W.; Methodology, M.L.; Software, X.W. and T.R. All authors have read and agreed to the published version of the manuscript.

Funding

This work is supported by the National Natural Science Foundation of China (42030705; 41272269).

Data Availability Statement

Not applicable.

Acknowledgments

We thank Lingyu Bai’s team at the Chinese Academy of Agricultural Sciences for laboratory sample testing. We also thank Fu Liao from CUGB for valuable discussion.

Conflicts of Interest

The authors declare no conflict of interest.

References

  1. Saygin, D.; Kempener, R.; Wagner, N.; Ayuso, M.; Gielen, D. The implications for renewable energy innovation of doubling the share of renewables in the global energy mix between 2010 and 2030. Energies 2015, 8, 5828–5865. [Google Scholar] [CrossRef]
  2. Jing, Z.R.; Wang, J.M.; Zhu, Y.C.; Feng, Y. Effects of land subsidence resulted from coal mining on soil nutrient distributions in a loess area of China. J. Clean. Prod. 2018, 177, 350–361. [Google Scholar] [CrossRef]
  3. Yang, D.; Bian, Z.; Lei, S. Impact on soil physical qualities by the subsidence of coal mining: A case study in western China. Environ. Earth Sci. 2016, 75, 652. [Google Scholar]
  4. Yuan, J.H. The future of coal in China. Resour. Conserv. Recycl. 2018, 129, 290–292. [Google Scholar] [CrossRef]
  5. Topp, W.; Thelen, K.; Kappes, H. Soil dumping techniques and afforestation drive ground-dwelling beetle assemblages in a 25-year-old open-cast mining reclamation area. Ecol. Eng. 2010, 36, 751–756. [Google Scholar] [CrossRef]
  6. Neshat, A.; Pradhan, B.; Dadras, M. Groundwater vulnerability assessment using an improved drastic method in GIS. Resour. Conserv. Recycl. 2014, 86, 74–86. [Google Scholar] [CrossRef]
  7. Qian, T.N.; Bagan, H.; Kinoshita, T.; Yamagata, Y. Spatial-temporal analyses of surface coal mining dominated land degradation in Holingol, Inner Mongolia. IEEE J. Sel. Top. Appl. Earth Obs. Remote Sens. 2014, 7, 1675–1687. [Google Scholar] [CrossRef]
  8. Liu, Y.; Lei, S.; Chen, X. Assessment of heavy metal pollution and human health risk in urban soils of a coal mining city in East China. Hum. Ecol. Risk Assess. 2016, 22, 1359–1374. [Google Scholar] [CrossRef]
  9. Liu, D.; Quan, Y.; Ren, Z.; Wu, G. Assessment of heavy metal contamination in soil associated with Chinese coal-fired power plants: A case study in Xilingol, Inner Mongolia. Int. J. Sustain. Dev. World Ecol. 2017, 24, 439–443. [Google Scholar] [CrossRef]
  10. Wang, Z.G.; Wang, G.C.; Ren, T.Y.; Wang, H.B.; Xu, Q.Y.; Zhang, G.H. Assessment of soil fertility degradation affected by mining disturbance and land use in a coalfield via machine learning. Ecol. Indic. 2021, 125, 107608. [Google Scholar] [CrossRef]
  11. Qiao, H.; Chen, S.; Dong, X.; Dong, K. Has China′s coal consumption actually reached its peak? National and regional analysis considering cross-sectional dependence and heterogeneity. Energy Econ. 2019, 84, 104509. [Google Scholar] [CrossRef]
  12. Bi, Y.L.; Xie, L.L.; Wang, J.; Zhang, Y.X.; Wang, K. Impact of host plants, slope position and subsidence on arbuscular mycorrhizal fungal communities in the coal mining area of north-central China. J. Arid Environ. 2018, 163, 68–76. [Google Scholar] [CrossRef]
  13. Burke, R.A.; Fritz, K.M.; Barton, C.D.; Johnson, B.R.; Fulton, S.; Hardy, D.; Word, D.A.; Jack, J.D. Impacts of mountaintop removal and valley fill coal mining on c and n processing in terrestrial soils and headwater streams. Water Air Soil Pollut. 2014, 225, 2081. [Google Scholar] [CrossRef]
  14. Gong, Y.; Hu, Z.; McSweeney, K. Reclaiming subsidized land: An evaluation of coal gangue interlayers. Adv. Mater. Sci. Eng. 2020, 2020, 5740659. [Google Scholar] [CrossRef] [Green Version]
  15. Mi, J.X.; Liu, R.; Zhang, S.L.; Hou, H.; Yang, Y.; Chen, F.; Zhang, L. Vegetation patterns on a landslide after five years of natural restoration in the Loess Plateau mining area in China. Ecol. Eng. 2019, 136, 46–54. [Google Scholar] [CrossRef]
  16. Wang, Z.G.; Wang, G.C.; Zhang, Y.G.; Wang, R.X. Quantification of the effect of soil erosion factors on soil nutrients at a small watershed in the Loess Plateau, Northwest China. J. Soils Sediments 2019, 20, 745–755. [Google Scholar] [CrossRef]
  17. He, T.T.; Xiao, W.; Zhao, Y.L.; Deng, X.Y.; Hu, Z.Q. Identification of waterlogging in eastern China induced by mining subsidence: A case study of Google Earth engine time-series analysis applied to the Huainan Coal Field. Remote Sens. Environ. 2020, 242, 111742. [Google Scholar] [CrossRef]
  18. Zhao, D.W.; Wu, K.; Bai, Z.H.; Hu, Z.Q.; Li, L.; Xu, Y.K.; Diao, X.P. Formation and development mechanism of ground crack caused by coal mining: Effects of overlying key strata. Bull. Eng. Geol. Environ. 2019, 78, 1025–1044. [Google Scholar]
  19. Peng, J.B.; Wang, F.; Cheng, Y.; Lu, Q. Characteristics and mechanism of Sanyuan ground fissures in the Weihe Basin, China. Eng. Geol. 2018, 247, 48–57. [Google Scholar] [CrossRef]
  20. Peng, J.B.; Sun, X.H.; Lu, Q.Z.; Meng, L.C.; He, H.Q.; Qiao, J.W.; Wang, F.Y. Characteristics and mechanisms for origin of earth fissures in Fenwei basin, China. Eng. Geol. 2020, 266, 105445. [Google Scholar] [CrossRef]
  21. Jia, Z.J.; Peng, J.B.; Lu, Q.Z.; Meng, L.C.; Qiao, J.W.; Wang, F.Y.; Zhao, J.Y. Characteristics and genesis mechanism of ground fissures in Taiyuan basin, northern China. Eng. Geol. 2020, 275, 105783. [Google Scholar] [CrossRef]
  22. Rong, Y.; Hu, Z.Q.; Wu, Y.J.; Yuan, Y.M. Physical and Chemical Properties of Soil at Different Mining Subsidence Areas in Windy and Sandy Regions. Land Reclamation in Ecological Fragile Areas; CRC Press: Boca Raton, FL, USA, 2017; pp. 349–355. [Google Scholar]
  23. Guo, J.; Zhang, Y.X.; Huang, H.; Yang, F. Deciphering soil bacterial community structure in subsidence area caused by underground coal mining in arid and semiarid area. Appl. Soil Ecol. 2021, 163, 103916. [Google Scholar] [CrossRef]
  24. Jing, Z.R.; Wang, J.M.; Wang, R.G.; Wang, P. Using multi-fractal analysis to characterize the variability of soil physical properties in subsided land in coal-mined area. Geoderma 2020, 361, 114054. [Google Scholar] [CrossRef]
  25. Chen, Z.; Li, Y.J.; Deng, N.R.; Tang, Z.H.; Fan, L.; Wu, L.Q. Effect of coal mining subsidence on soil physical properties of rice field in mountain region of Southwest China. Trans. Chin. Soc. Agric. Eng. 2014, 30, 276–285. [Google Scholar]
  26. Neumann, D.; Heuer, A.; Hemkemeyer, M.; Martens, R.; Tebbe, C.C. Importance of soil organic matter for the diversity of microorganisms involved in the degradation of organic pollutants. ISME J. 2014, 8, 1289–1300. [Google Scholar] [CrossRef] [PubMed]
  27. Sun, J.H.; Yang, L.; Wei, J.; Quan, J.; Yang, X.T. The responses of soil bacterial communities and enzyme activities to the edaphic properties of coal mining areas in Central China. PLoS ONE 2020, 15, e0231198. [Google Scholar] [CrossRef] [PubMed]
  28. Maiti, S.K. Ecorestoration of the Coalmine Degraded Lands; Springer Science & Business Media: Berlin/Heidelberg, Germany, 2012. [Google Scholar]
  29. Janssens, M.; Pohlan, J.; Mulindabigwa, V.; Sonwa, D.; Deng, Z.; Torrico, J.C.; Callado, S.; Jende, O. Relative importance of soil organic matter, soil litter and litter fall in the tropics. Acta Hortic. 2015, 1076, 85–95. [Google Scholar] [CrossRef]
  30. Hu, Z.Q.; Xiao, W. Optimization of concurrent mining and reclamation plans for single coal seam: A case study in northern Anhui. China Environ. Earth Sci. 2013, 68, 1247–1254. [Google Scholar] [CrossRef]
  31. Osorio, N.W.; Habte, M. Phosphate desorption from the surface of soil mineral particles by a phosphate-solubilizing fungus. Biol. Fertil. Soils 2013, 49, 481–486. [Google Scholar] [CrossRef]
  32. Shi, P.L.; Zhang, Y.X.; Hu, Z.Q.; Ma, K.; Wang, H.; Chai, T.Y. The response of soil bacterial communities to mining subsidence in the west China aeolian sand area. Appl. Soil. Eco. 2017, 121, 1–10. [Google Scholar] [CrossRef]
  33. Zhen, Q.; Ma, W.M.; Li, M.M.; He, H.H.; Zhang, X.C.; Wang, Y. Effects of vegetation and physicochemical properties on solute transport in reclaimed soil at an opencast coal mine site on the Loess Plateau, China. CATENA 2017, 148, 17–25. [Google Scholar] [CrossRef]
  34. Feng, Y.; Wang, J.; Bai, Z.; Reading, L. Effects of surface coal mining and land reclamation on soil properties: A review. Earth Sci. Rev. 2019, 191, 12–25. [Google Scholar] [CrossRef]
  35. Ma, K.; Zhang, Y.; Ruan, M.; Guo, J.; Chai, T. Land subsidence in a coal mining area reduced soil fertility and led to soil degradation in arid and semi-arid regions. Int. J. Env. Res. Public Health 2019, 16, 3929. [Google Scholar] [CrossRef] [PubMed] [Green Version]
  36. Yang, S.T.; Guan, Y.B.; Zhao, C.S.; Zhang Cb Bai, J.; Chen, K. Determining the influence of catchment area on intensity of gully erosion using high-resolution aerial imagery: A 40-year case study from the Loess Plateau, northern China. Geoderma 2019, 347, 90–102. [Google Scholar] [CrossRef]
  37. Guan, Y.B.; Yang, S.T.; Zhao, C.S.; Lou, H.Z.; Chen, K.; Zhang, C.B.; Wu, B.W. Monitoring long-term gully erosion and topographic thresholds in the marginal zone of the Chinese Loess Plateau. Soil Tillage Res. 2021, 205, 104800. [Google Scholar] [CrossRef]
  38. Gomez-Gutierrez, Á.; Conoscenti, C.; Angileri, S.E.; Rotigliano, E.; Schnabel, S. Using topographical attributes to evaluate gully erosion proneness (susceptibility) in two editerranean basins: Advantages and limitations. Nat. Hazards 2015, 79, 291–314. [Google Scholar] [CrossRef]
  39. Reed, M.; Kite, S. Peripheral gully and landslide erosion on an extreme anthropogenic landscape produced by mountaintop removal coal mining. Earth Surf. Process. Landf. 2020, 45, 4867. [Google Scholar] [CrossRef]
  40. Wang, Y.C.; Bian, Z.F.; Lei, S.G.; Zhang, Y. Investigating spatial and temporal variations of soil moisture content in an arid mining area using an improved thermal inertia model. J. Arid. Land 2017, 9, 712–726. [Google Scholar] [CrossRef]
  41. Song, Z.S.; Seitz, S.; Li, J.; Goebes, P.; Schmidt, K.; Kuhn, P.; Shi, X.Z.; Scholten, T. Tree diversity reduced soil erosion by affecting tree canopy and biological soil crust development in a subtropical forest experiment. For. Ecol. Manag. 2019, 444, 69–77. [Google Scholar] [CrossRef]
  42. Chagas, C.D.S.; Junior, W.D.C.; Bhering, S.B.; Filho, B.C. Spatial prediction of soil surface texture in a semiarid region using random forest and multiple linear regressions. CATENA 2016, 139, 232–240. [Google Scholar] [CrossRef]
  43. Lechner, A.M.; Baumgartl, T.; Matthew, P.; Glenn, V. The impact of underground longwall mining on prime agricultural land: A review and research agenda. Land Degrad. Dev. 2016, 27, 1650–1663. [Google Scholar] [CrossRef]
  44. Qu, S.; Shi, Z.M.; Wang, G.C.; Han, J.Q. Application of multiple approaches to investigate hydraulic connection in multiple aquifers system in coalfield. J. Hydrol. 2020, 595, 125673. [Google Scholar] [CrossRef]
  45. Zhang, B.J.; Zhang, G.H.; Yang, H.Y.; Wang, H.; Li, N.N. Soil erodibility affected by vegetation restoration on steep gully slopes on the Loess Plateau of China. Soil Res. 2018, 56, 712–723. [Google Scholar] [CrossRef]
  46. Roy, J.; Saha, S. GIS-based gully erosion susceptibility evaluation using frequency ratio, cosine amplitude and logistic regression ensembled with fuzzy logic in hinglo river basin, India. Remote Sens. Appl. Soc. Environ. 2019, 15, 100247. [Google Scholar] [CrossRef]
  47. Kadel, S.; Persico, M.; Thibodeau, J.; Lainé, C.; Bazinet, L. Use of redundancy analysis and multivariate regression models to select the significant membrane properties affecting peptide migration during electrodialysis with filtration membranes. Sep. Purif. Technol. 2019, 221, 114–125. [Google Scholar] [CrossRef]
  48. Cheng, Y.; Li, P.; Xu, G.; Li, Z.; Gao, H.; Zhao, B.; Wang, T.; Wang, F.; Cheng, S. Effects of soil erosion and land use on spatial distribution of soil total phosphorus in a small watershed on the Loess Plateau, China. Soil Tillage Res. 2018, 184, 142–152. [Google Scholar] [CrossRef]
  49. Breiman, L. Random forests. Mach. Learn. 2001, 45, 5–32. [Google Scholar] [CrossRef] [Green Version]
  50. Arabameri, A.; Yamani, M.; Pradhan, B.; Melesse, A.; Shirani, K.; Bui, D.T. Novel ensembles of COPRAS multi-criteria decision-making with logistic regression, boosted regression tree, and random forest for spatial prediction of gully erosion susceptibility. Sci. Total Environ. 2019, 688, 903–916. [Google Scholar] [CrossRef]
  51. Garosi, Y.; Sheklabadi, M.; Pourghasemi, H.R.; Besalatpour, A.A.; Conoscenti, C.; Van Oost, K. Comparison of differences in resolution and sources of controlling factors for gully erosion susceptibility mapping. Geoderma 2018, 330, 65–78. [Google Scholar] [CrossRef]
  52. Wang, H.; Zhang, G.H. Temporal variation in soil erodibility indices for five typical land use types on the Loess Plateau of China. Geoderma 2020, 381, 114695. [Google Scholar] [CrossRef]
  53. Zhang, T.H.; Yong-Zhong, S.U.; Jian-Yuan, C.U.I.; Zhang, Z.H.; Chang, X.X. A leguminous shrub (Caragana microphylla) in semiarid sandy soils of north China. Pedosphere 2006, 16, 319–325. [Google Scholar] [CrossRef]
  54. Yao, Y.; Shao, M.; Fu, X.; Wang, X.; Wei, X. Effect of grassland afforestation on soil N mineralization and its response to soil texture and slope position. Agric. Ecosyst. Environ. 2019, 276, 64–72. [Google Scholar] [CrossRef]
  55. Frouz, J.; Prach, K.; Pizl, V.; Hanel, L.; Stary, J.; Tajovsky, K.; Materna, J.; Balik, V.; Kalcik, J.; Rehounkova, K. Interactions between soil development, vegetation and soil fauna during spontaneous succession in post mining sites. Eur. J. Soil Biol. 2008, 44, 109–121. [Google Scholar] [CrossRef]
  56. Garosi, Y.; Sheklabadi, M.; Conoscenti, C.; Pourghasemi, H.R.; Oost, K. Assessing the performance of GIS-based machine learning models with different accuracy measures for determining susceptibility to gully erosion. Sci. Total Environ. 2019, 664, 1117–1132. [Google Scholar] [CrossRef] [PubMed]
  57. Peng, J.B.; Xu, J.S.; Ma, R.Y.; Wang, F.Y. Characteristic and mechanism of the Longyao ground fissures on North China Plain, China. Eng. Geol. 2016, 214, 136–146. [Google Scholar] [CrossRef]
  58. Arabameri, A.; Pradhan, B.; Bui, D.T. Spatial modelling of gully erosion in the Ardib River Watershed using three statistical-based techniques. CATENA 2020, 190, 104545. [Google Scholar] [CrossRef]
  59. Nuraini, Y.; Arfarita, N.; Siswanto, B. Isolation and characteristic of nitrogen-fixing bacteria and phosphate-solubilizing bacteria from soil high in mercury in tailings and compost areas of artisanal gold mine. Agrivita 2015, 37, 1–7. [Google Scholar] [CrossRef] [Green Version]
Figure 1. Study area and sampling points.
Forests 12 01370 g001
Figure 2. SOM (a), TN (b), and AP (c) content in pre-mining soil and post-mining soil.
Forests 12 01370 g002
Figure 3. The linear regression fitted between (a) SOM in pre-mining soil and TN in pre-mining soil, and (b) SOM in post-mining soil and TN in post-mining soil.
Forests 12 01370 g003
Figure 4. Feature importance of each environmental factor on DSOM (a), DTN (b), and DAP (c), RA, relief amplitude; SG, slope gradient; SV, variation of slope gradient; SR, surface roughness; Dis.W, distance to working panel margin; TWI, topology wetness index.
Forests 12 01370 g004
Figure 5. Spatial distribution of DSOM (a), DTN (b), and DAP (c) based on kriging using 20 measured points and 20 unmeasured points predicted by random forest.
Forests 12 01370 g005
Table 1. Comparison between SOM, TN, and AP in pre-mining and post-mining soil using the paired t-test.
MeanStd. DeviationStd. Error Mean95% Confidence Interval of the DifferencetSig. (2-Tailed)
LowerUpper
SOM PRE-SOM POST2.347 3.144 0.703 0.875 3.818 3.338 0.003
TN PRE-TN POST0.127 0.125 0.028 0.068 0.186 4.539 0.000
AP PRE-AP POST2.938 2.771 0.620 1.641 4.234 4.742 0.000
Note: std.deviation: standard deviation; SOM PRE, TN PRE, AP PRE: SOM, TN, and AP in pre-mining soil; SOM POST, TN POST, AP POST: SOM, TN, and AP in post-mining soil.
Table 2. Soil nutrients loss after mining disturbance.
IDDSOMDTNDAP
CJT-1−3.287−0.019−0.1
CJT-2−5.862−0.126−1.75
CJT-3−3.02−0.241−1.7
CJT-4−4.756−0.234−9.1
CJT-5−0.095−0.023−2.6
CJT-6−0.793−0.343−0.2
CJT-7−2.036−0.354−1.45
CJT-8−0.181−0.001−1
CJT-9−0.116−0.01−0.05
CJT-10−0.686−0.018−6.2
CJT-11−7.1−0.364−4.75
CJT-12−4.563−0.172−1.85
CJT-13−2.072−0.034−2.6
CJT-14−4.484−0.017−1.25
CJT-15−4.488−0.107−7.8
CJT-16−4.011−0.23−7.7
CJT-17−0.157−0.092−1.55
CJT-18−1.921−0.041−2.75
CJT-19−1.994−0.02−0.3
CJT-20−5.511−0.094−4.1
Note: D (SOM, TN, AP) = Post-mining soil (SOM, TN, AP) − Pre-mining soil (SOM, TN, AP).
Table 3. The explanations of environmental factors on soil nutrients loss based on RDA.
Soil NutrientsDis.to MarginSlopeSlope VariationPlan CurvatureProfile CurvatureDensityRoughnessRelief AmplitudeNDVITWITotal Explanation
DSOM2.90.10.92.00.72.73.32.60.40.115.7
DTN0.21.71.60.29.00.22.83.00.20.119.0
DAP5.52.61.71.25.93.90.621.41.01.044.8
Note: Dis. to mining: distance to working panel margin; Slope: slope gradient; Density: drainage density; Roughness: surface roughness.
Table 4. The validation of the Kriging interpolation using 20 and 40 points.
20 Points-SOM40 Points-SOM20 Points-TN40 Points-TN20 Points-AP40 Points-AP
ME0.5040.053−0.051−0.002−0.094−0.025
RMSE2.3511.5560.1120.0652.8962.244
MSE0.146 0.029 −0.620−0.020−0.041−0.010
RMSSE1.0810.9850.9040.9870.8640.975
ASE2.2051.5640.1280.0692.9862.250
Note: 20 points-soil nutrients, using 20 points as measured points; 40 points-soil nutrients, using 20 original points and 20 RF predicted points as measured points. ME, mean error; RMSE, root mean square error; MSE, mean square error; RMSSE, root mean standard square error; ASE, average sampling error.
Publisher’s Note: MDPI stays neutral with regard to jurisdictional claims in published maps and institutional affiliations.

