Article

Characteristics and Driving Factors of Rhizosphere Bacterial Communities of Chinese Fir Provenances

1
College of Forestry, Fujian Agriculture and Forestry University, Fuzhou 350002, China
2
State Forestry Administration Engineering Research Center of Chinese Fir, Fuzhou 350002, China
3
Xinyang Institute of Forestry Sciences, Xinyang 464000, China
4
Bangor College China, a Joint Unit of Bangor University and Central South University of Forestry and Technology, Changsha 410004, China
*
Author to whom correspondence should be addressed.
Forests 2021, 12(10), 1362; https://doi.org/10.3390/f12101362
Submission received: 30 July 2021 / Revised: 28 September 2021 / Accepted: 3 October 2021 / Published: 8 October 2021
(This article belongs to the Section Forest Ecophysiology and Biology)

Abstract

:
Rhizosphere bacteria affect the diversity of soil functions, playing important roles in the growth and expansion of Chinese fir. Understanding the driving factors of rhizosphere bacterial distribution is imperative when comparing bacterial diversity and composition under different Chinese fir provenances. We investigated the growth of Chinese fir belts and the effects of climate, geographic location, and soil nutrients. Using 16S rDNA next-generation sequencing analysis, the bacterial communities of 16 Chinese fir provenances were compared. The bacterial compositionsof Dechang, Junlian, Shangrao, Zhenxiong, Yangxin, Xinyang, Luotian, and Tianmushan provenances weredistinct from others. Generally, higher-latitude provenances showed more biomarkers (LDA = 2). Rhizosphere bacterial α-diversity was the highest in Hunan Youxian and lowest in Henan Xinyang (p < 0.05). From south to north, bacterial α-diversity initially increased and then decreased. From east to west in the middle belt, bacterial α-diversity followed a “W” trend, with the eastern middle belt having the highest values, especially near Hunan, Fujian, and Zhejiang provinces. Amongst environmental factors, soil nutrient content (Mg, P and K) and stoichiometric ratio (Ca/Mg, K/Ca and N/P), along with precipitationrate primarily controlled rhizosphere bacterial diversity. Soil pH had a significant impact on the relative abundance of rhizosphere soil bacteria. Our findings offer insight into the evolution of Chinese fir and provide a scientific basis for soil microbial community improvement of Chinese fir provenances.

1. Introduction

Chinese fir (Cunninghamia lanceolata (Lamb.) Hook.), an important timber species in south China, is widely distributed within 101°30′–121°53′ E and 21°41′–34°03′ N. Under different environmental conditions, various types of Chinese fir were identified [1,2,3,4]: C. unica, C. lanceolata var. Luotian, C. lanceolata (Lamb.) Hook. cv. Zhaotongensis, and Chenshan red-heart Chinese fir. By studying their different characteristics, we can determine well-grown Chinese fir provenances [5]. One way is to correlate Chinese fir characteristics and their geographical location [6]. In addition, some studies have applied modern molecular technology to cluster the genetic diversity of different Chinese fir provenances, such as sequence-related amplified polymorphism [7]. Other studies show that the evolution of plant traits may be related to soil microorganisms [8,9]. The diversity of soil bacteria affects the multiple functions of soil [10]. In a complex and dynamic environment, plants transmit signals through the rhizosphere [11,12] and assemble health-promoting microbiomes to adapt to biotic stress [13]. Thus, rhizosphere microorganisms, as the second genome of plants, have received extensive attention. As 99% of bacteria cannot be cultured under a restricted range of media and cultivation conditions [14], there are few reports on the differences between rhizosphere bacterial communities amongst different Chinese fir provenances, which limits the prediction of bacterial diversity and the development of ecological theory.
In recent years, next-generation sequencing has become an important method for microbial ecology research [15], especially in characterizing soil bacterial community and its driving factors [16]. According to a study of the global soil bacterial community, soil bacteria are the most diverse in temperate zones, and environmental factors have a stronger influence on the bacterial community than geographical location [17]. In the southern hemisphere, soil bacterial diversity decreases with increasing latitude, whereas the opposite is true in the northern hemisphere [18]. The distribution of soil bacteria may be affected by a variety of environmental factors. Soil diversity and fertility can indicate the characteristics of the rhizosphere bacterial communities [19,20,21]. Soil pH is related to a number of other soil properties including soil moisture deficit, soil organic C content, and soil C:N ratio; the differences in bacterial community composition across ecosystems can largely be explained by differences in soil pH alone. Therefore, soil pH is a key factor driving bacterial diversity [22]. Annual average temperature and precipitation, which correlate with the abundance of some bacteria, such as Gemmatimonadetes, affect the altitude distribution of soil bacteria [23]; other studies suggest that vegetation type and soil carbon content, which can regulate the composition of the bacterial community and influence the metabolism of carbon-fixing bacteria, are globally important factors for soil bacterial diversity [24]. Therefore, large-scale soil microbial biogeography has become a research hotspot.
Chinese fir is one of the important timber tree species of south China, and rhizosphere soil bacteria are important for Chinese fir management. However, to date, most studies on soil bacterial communities in Chinese fir plantations have focused on management measures [25,26,27], development stage [28], seasons [29,30], or the effects of climate change and nitrogen deposition [31]. There is a scarcity of studies focusing on the comparison of bacterial community diversity and its driving factors, or on the composition of the rhizosphere under different Chinese fir provenances on a large scale. In this experiment, we utilized 16S DNA high-throughput sequencing to characterize the rhizosphere bacterial communities of 16 Chinese fir provenances in 11 provinces of China. The objective was to determine the geographical distribution of the rhizosphere bacteria of Chinese fir and to understand the effect of different environmental factors so as to provide a basis for using the rhizosphere bacterial community to improve production. We hypothesized that (1) some rhizosphere bacteria of Chinese fir may change with geographical gradients, (2) that the central production area, which has well-grown Chinese fir plantations, may have higher bacterial diversity and (3) that soil nutrients may be an essential factor driving the distribution of soil rhizosphere bacteria.

2. Method and Materials
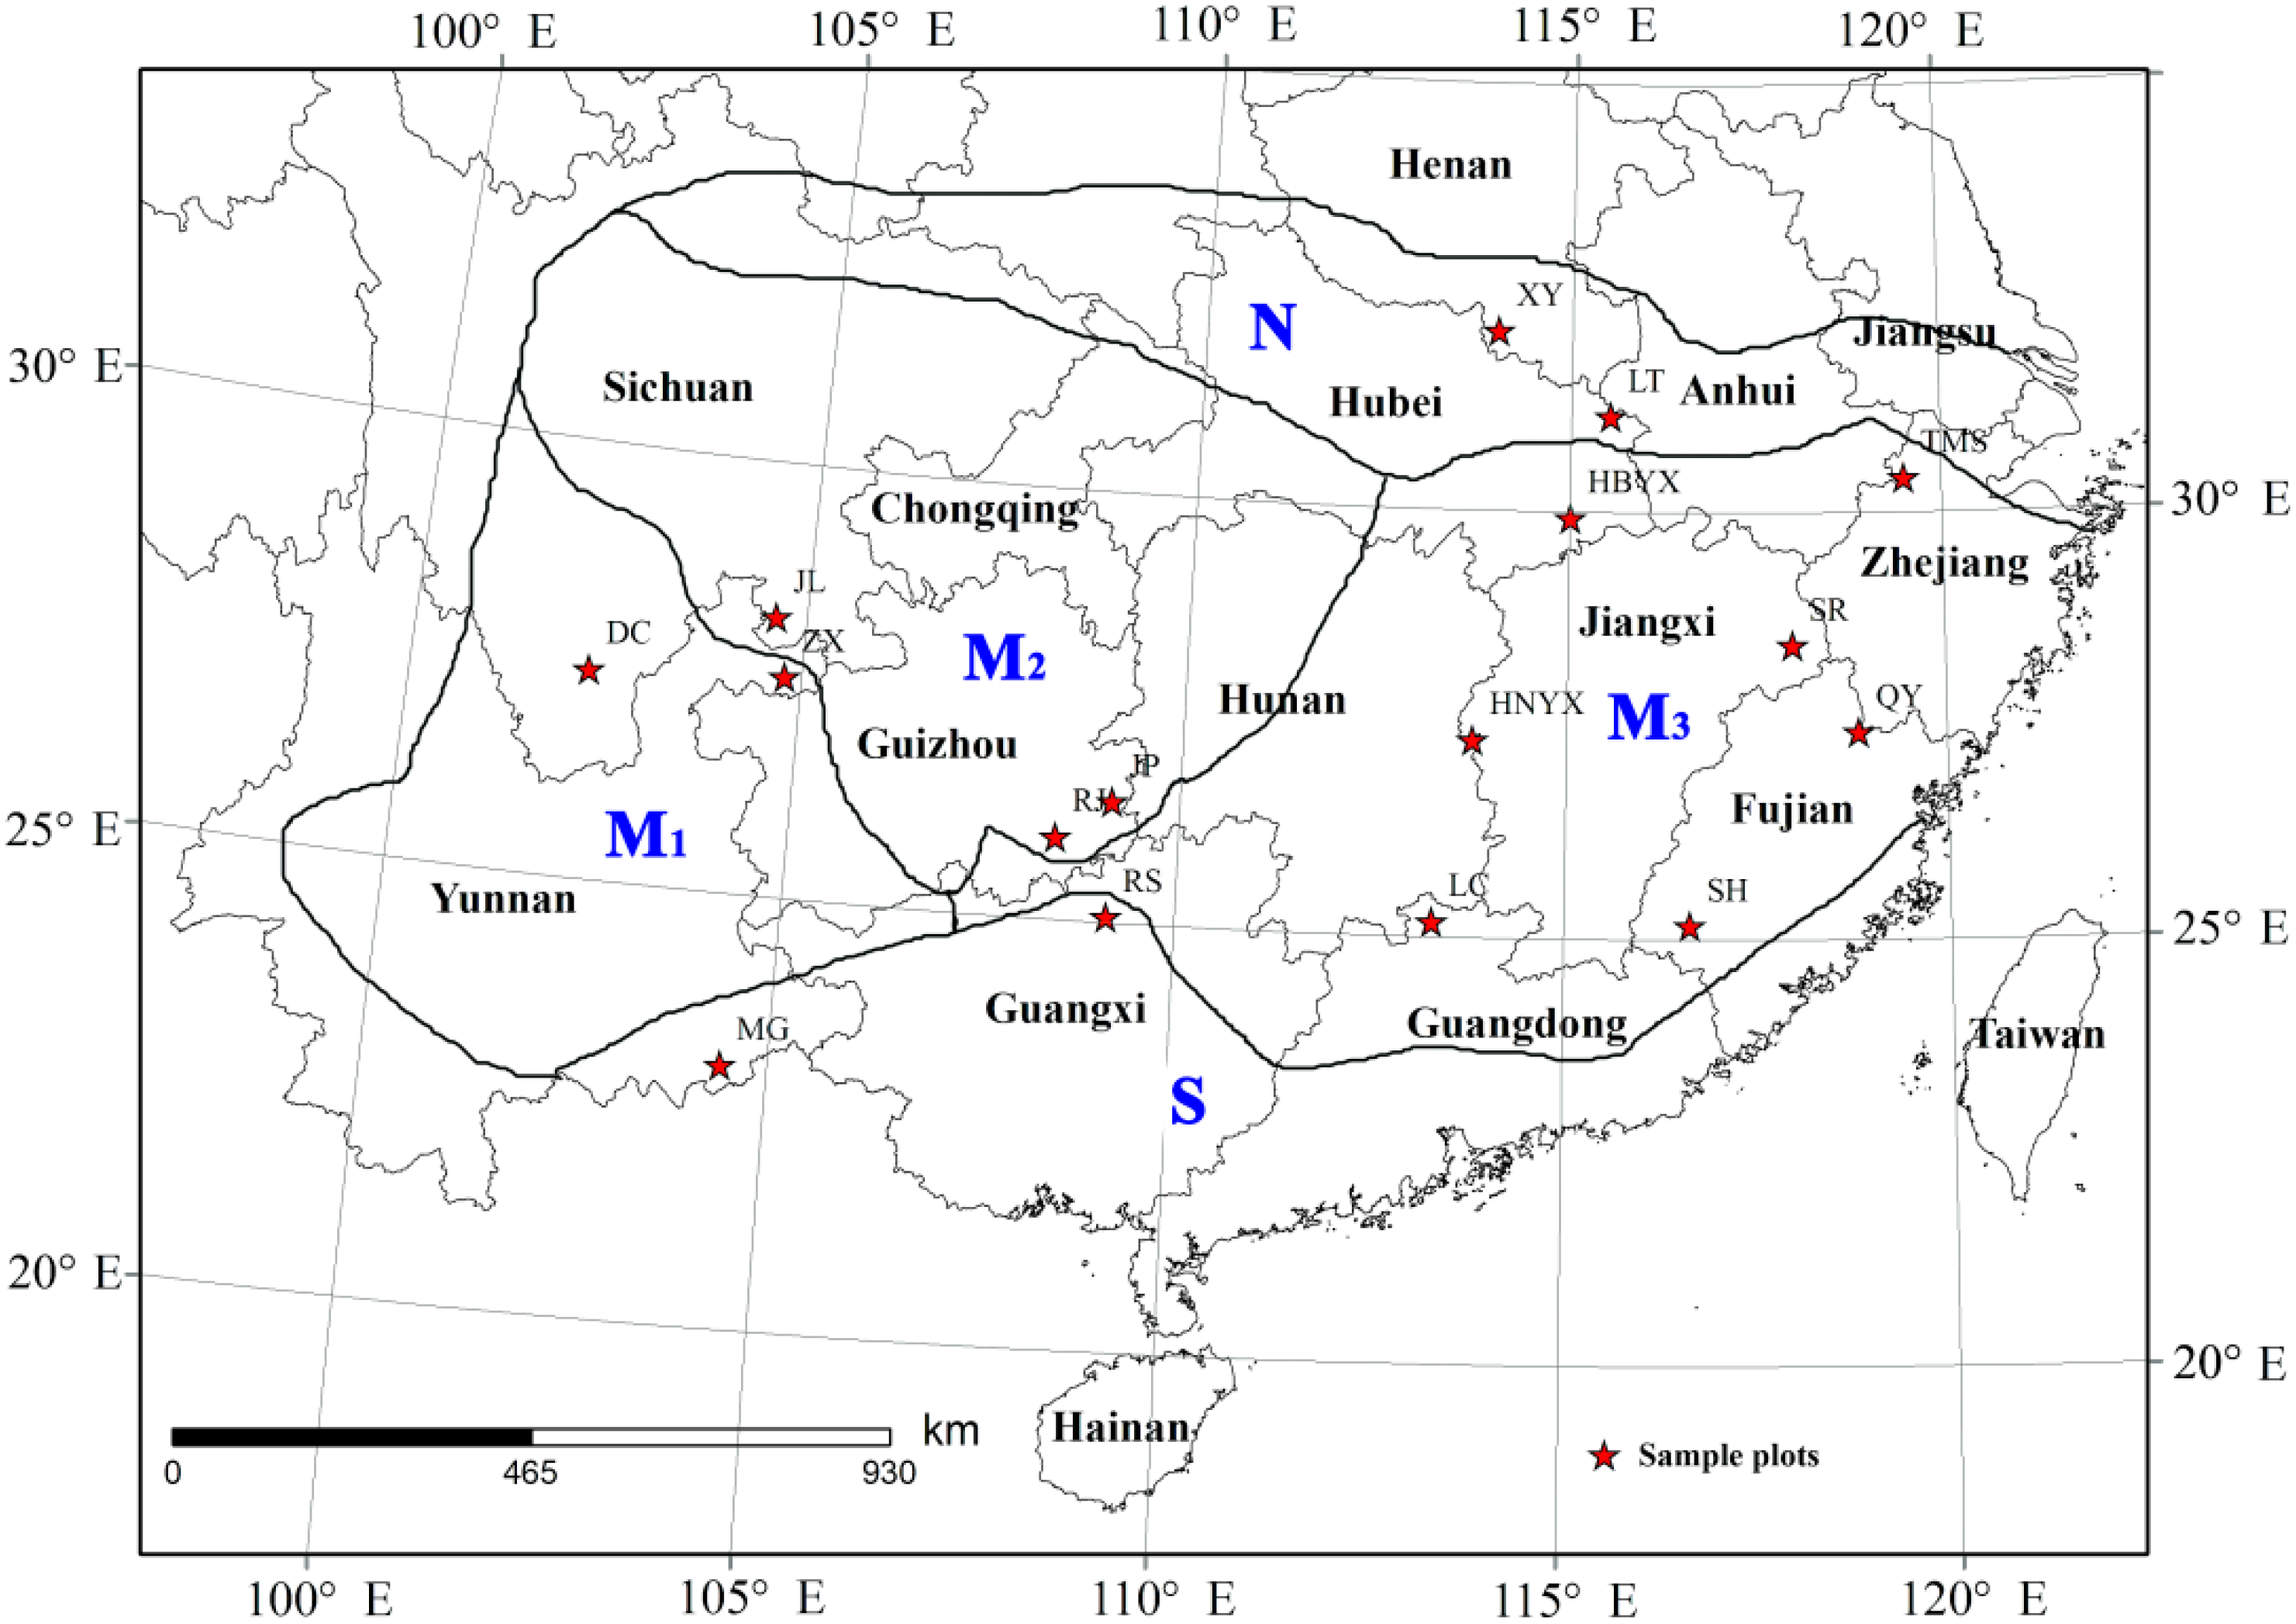
2.1. Study Site

The natural Chinese fir provenances in China were distributed within 102°17′–119°30′ E and 23°2′–32°5′ N. The Chinese fir provenances were divided into five blocks, and at least two local Chinese fir provenances were selected for each block. Finally, the study was carried out in 16 provenances, located within 11 provinces of China; there were a total of 48 plots (Figure 1). The study area has a humid subtropical climate, with an annual average temperature of 11.3–19.8 °Cand precipitation of 1050–1813 mm. The stands were located at an altitude of 137–1735 m with an average slope of approximately 25°. The growth of Chinese fir in every sample plot was investigated (Table 1), and the soil at 0–40 cm depth in different Chinese fir plantations was analyzed. The range of soil pH was 4.00–4.75, while that of total C content was 5.50–37.24 g/kg, total N content was 0.34–3.03 g/kg, total P content was 0.03–0.42 g/kg, total K content was 7.45–41.35 g/kg, total Ca content was 0.25–6.24 g/kg, and total Mg content was 0.64–9.18 g/kg. The vegetation type was mainly Chinese fir. The soil types were mainly red soil, yellow soil and yellow-brown soil.

2.2. Sample Collection

Three 20 m × 20 m plots were set for each provenance. The growth of all Chinese fir trees in 48 plots was measured using a ruler. Five soil profiles were collected at the center and four corners 1 m away from the boundary of each plot. Finally, 1 kg of mixed soil samples at 0–40 cm depth was obtained to determine soil pH and nutrient content. For uniform random sampling, we divided the air-dried soil samples to 20 g per quarter. The samples were then sieved in a 0.149 mm mesh for better digestion and analysis. The total C and N concentrations were determined using an Element Analyzer (VARIO MAX CN, Hanau, Germany), whereas the total P, K, Ca, and Mg concentrations were measured using inductively coupled plasma optical emission spectrometry (PerkinElmer, Richmond, CA, USA). The pH of each soil sample was measured in 1:2.5 mixtures of soil and deionized water using a pH meter (PHS-3C, Lei-ci, Shanghai, China). The annual average precipitation and temperature were gathered from the China Meteorological Administration. Geographic coordinates and altitude were gathered using handheld Magellan GPS (eXplorist310, ThalesNavigation, Paris, France).
Three trees with average diameter breast height were selected for each plot. Five main lateral roots in different directions were found along the average tree base. The surrounding deciduous layer was removed. The covering soil was excavated with a soil knife, and the fine root system was gently removed. Only rhizosphere soils [32] attached to roots were collected into a sterile bag and three bags of mixed rhizosphere soil samples were gathered from three plots for each provenance. The rhizosphere soil samples were stored in an ice-bag incubatorand then transferred to a −20 °C freezer for storage. The rhizosphere soil samples were immediately transported to the laboratory. After being sieved through a 2.0 mm mesh, all rhizosphere soil samples were stored in an ultra-low temperature freezer at −80 °C for DNA extraction. The rhizosphere soil samples of 16 provenances of Chinese fir were collected from September to November 2019.

2.3. Sequencing and Analysis of Soil Bacterial Community

Soil microbial DNA was extracted using HiPure soil DNA Kits (Magen, Guangzhou, China) following the manufacturer’s protocols; the DNA integrity was detected using Nanodrop (Thermo Scientific, Waltham, MA, USA) [33]. The 16S rDNA target region of the ribosomal RNA gene was amplified through polymerase chain reaction (PCR). Primers 341F (5′-CCTACGGGNGGCWGCAG-3′) and 806R (5′-GGACTACHVGGGTATCTAAT-3′) were used to amplify the V3-V4 hypervariable region of the 16S rDNA gene of the bacteria with the following reaction procedure: 94 °C for 2 min, 98 °C for 10 s, 62 °C for 30 s, 68 °C for 30 s (30 cycles), and a final extension at 68 °C for 5 min. AMPure XP Beads (Beckman Agency, Muskogee, OK, USA) were used to purify the amplified products, and the ABI StepOnePlus Real-Time PCR System (Life Technologies, Carlsbad, CA, USA) was used to quantify the products. The products were sequenced using Illumina Novaseq 6000.

2.4. BioinformaticsAnalysis

FASTP (version 0.18.0) [34] was used to further filter raw reads. Paired-end clean reads were merged as raw tags using FLASH [35] (version with a minimum overlap of 10bp and mismatch error rates of 2%). Noisy sequences of raw tags were filtered using the QIIME(version 1.9.1) [36] pipeline to obtain high-quality clean tags. Clean tags were searched against the database (version r20110519, http://drive5.com/uchime/uchime_download.html; accessed on 24 July 2020) to perform reference-based chimaera checking using the UCHIME algorithm [37]. Using UPARSE software (version 9.2.64) [38], effective tags were clustered into operational taxonomic units (OTUs) of ≥97% similarity. The tag sequence with the highest abundance was selected as a representative within each cluster.

2.5. Data Analysis

Shannon, Simpson, Chao1, and ACE indices, and rarefaction curves were calculated in the QIIME software (version 1.9.1). One-way variance analysis with the least significant difference (p < 0.05) was used to test the significance utilizing the SPSS Statistics (version 19.0) software. Origin (version 2018) was used to create point-line graphs. The LEfSe software was used for linear discriminant analysis effect size (LEfSe) analysis. Based on the distance algorithm, the R “vegan” package was used for principal coordinate analysis; the “Pheatmap” package was used for creating heatmaps. Groups were derived from hierarchical clustering. Using Canoco (version 5.0), redundancy analysis determined the degree and relationship between different environmental factors and bacterial diversity.

3. Results

3.1. Quality Analysis of Sample Sequencing

A total of 4,807,304 16S rRNA v3-v4 effective sequences were identified from the rhizosphere soil samples in the 16 Chinese fir provenances. All effective rates of the sequencing data were more than 91% and had an average of 92.96% (±0.52), indicating reliable data. Based on ≥97% similarity, taxa tags were clustered into 125,081 (average: 2194) OTUs ranging from 1329 to 3072 per sample. When the number of bacteria sequenced reached 68,400, the rarefaction curve of each sample flattened, and the sequencing depth generally covered most species in the sample, which could better reflect the bacterial community structure and diversity (Figure 2).

3.2. Analysis of the Rhizosphere Soil Bacterial Community Compositionunder Different Chinese Fir Provenances

A total of 36 phyla, 96 classes, 189 orders, 276 families and 431 genera of known bacteria were identified in rhizosphere soil under different Chinese fir provenances. Planctomycetes, Verrucomicrobia, Acidobacteria, Chloroflexi, Proteobacteria, Actinobacteria, Gemmatimonadetes, Patescibacteria, Firmicutes and Rokubacteria were the main phyla of bacteria, and the average relative abundance reached 90%–96%. Planctomycetes were the dominant bacteria amongst all samples. With increasing latitude, the relative abundance of Planctomycetes decreased (Figure 3a). The dominant bacteria of MG and RS in the southern belt were Planctomycetes (Singulisphaera), Verrucomicrobia (Candidatus_Udaeobacter and Candidatus_Xiphinematobacter), Acidobacteria, Proteobacteria and Acidothermus. The dominant bacteria in other belts were Planctomycetes (Singulisphaera), Verrucomicrobia (Candidatus_Udaeobacter and Candidatus_Xiphinematobacter), Acidobacteria (Candidatus_Solibacter), Chloroflexi (1921-2 and HSB_OF53-F07), Proteobacteria (Acidibacter and Burkholderia-Caballeronia-Paraburkholderia), and Actinobacteria (Acidothermus) (Figure 3a,b). Based on Bray distances, at the phylum level, most provenances were distributed in the origin, except for DC, JL, SR, ZX, HBYX, and XY (Figure 3c). At the genus level, most provenances were distributed below axis-1, except for DC, JL, LT, TMS, SR, and ZX (Figure 3d). Based on a cluster analysis of bacterial abundance, the Chinese fir provenances were clustered into three groups: north (N), middle (M1, M2 and M3), and south (S). In the middle belt, M3 and M2 clustered together, and M1 was separate (Figure 3e). The northern belt was dominated by Actinobacteria (Conexibacter); the western middle belt was dominated by Verrucomicrobia (Candidatus_Udaeobacter) and Chloroflexi (HSB_OF53-F07); the central middle belt was dominated by Proteobacteria (Burkholderia-Caballeronia-Paraburkholderia), Acidobacteria (Candidatus_Solibacter), Chloroflexi (G12-WMSP1), and Planctomycetes (Aquisphaera); the easternmiddle belt was dominated by Chloroflexi (1921-2 and FCPS473); and the southern belt was dominated by Verrucomicrobia (Chthoniobacter and ADurbBin063-1), Proteobacteria (Roseiarcus and Pajaroellobacter), Acidobacteria (Bryobacter and Candidatus_Koribacter), Planctomycetes (Gemmata and Singulisphaera), and Actinobacteria (Acidothermus) (Figure 3e,f).

3.3. Analysis of Biomarkers in the Rhizosphere of Chinese Fir Provenances

LEfSe analysis showed that the biomarkers were primarily distributed in the higher latitudes and that the number of biomarkers at a higher latitude was greater than that at lower latitudes (Figure 4). The provenances and corresponding bacteria of relatively higher abundance were as follows: LT: Entotheonellaeota, Subgroup_6, Chloroflexales, Microtrichales, Rhizobiales_Incertae_Sedis, Pirellula, Gitt_GS_136, Amb_16S_1323 and AT_s3_28; XY: Gemmatimonadetes, Thermoleophilia, Roseiarcus, SC_I_84 and Subgroup_13; JL: Xanthomonadales, Betaproteobacteriales and Saccharimonadia; ZX: Dependentiae, KF_JG30_C25 and Simkaniaceae. HNYX: BD7_11 and Phycisphaera; TMS: Salinisphaerales and Subgroup_25. The biomarkers in HBYX, MG, RJ, RS, SH, and SR were Eel_36e1D6, Candidatus_Nomurabacteria, Candidatus_Solibacter, Beijerinckiaceae, Aquisphaera, and Ktedonobacteria, respectively.

3.4. α-Diversity Analysis of Bacterial Community in Rhizosphere Soil

The α-diversity was described based on the Chao1, ACE, Shannon, and Simpson indices. Species richness was measured using the Chao1 and ACE indices, and species diversity was measured through the Shannon and Simpson indices. We found a significant difference in bacteria α-diversity in Chinese fir provenances. Based on the Shannon and Simpson indices, the diversity of rhizosphere bacteria in HNYX was the highest, whereas that in XY was the lowest. The Chao1 and ACE indices identified the order of bacterial abundance as follows: HNYX > LT > TMS > LC > DC > QY > SH > MG > HBYX > JP > RJ > RS > JL > SR > ZX > XY.
From south to north, bacterial diversity and richness fluctuated (Figure 5a). In general, the bacterial diversity and richness of Chinese fir provenances in the middle belt were slightly higher than those in the northern and southern belts, but without significant differences (Figure 5c). From west to east, the diversity and richness in the middle belt initially increased and then followed a “W” trend. The diversity and richness of rhizosphere bacteria near Hunan, Fujian, and Zhejiang provinces were higher than those in other provinces (Figure 5b). Generally, the bacterial diversity in the eastern middle belt was the highest, whereas that in the western middle belt was significantly lower than that in the eastern and central middle belts. The bacterial richness in the eastern middle belt was the highest, followed by the western middle belt, and then the central middle belt (Figure 5d).

3.5. Correlation Analysis of Rhizosphere Bacterial Community Composition and α-Diversity with Environmental Factors

The cumulative explanatory degree of soil, climate, and geographical factors to rhizosphere bacteria α-diversity was 70.20%. Moreover, soil factors (Mg, P, Ca/Mg, K, K/Ca, and N/P) and annual average precipitation were the main factors, which significantly affected α-diversity indices (Table 2).
At the phylum level, axis-1 and axis-2 explained 60.45% of the variance in the bacterial relative abundance amongst provenances (Figure 6a). Soil factors had significant effects on the relative abundance of most phyla, such as Planctomycetes, Acidobacteria, Proteobacteria, Patescibacteria, Firmicutes and Rokubacteria. Some phyla had a strong association with geographical factors and climate, such as Planctomycetes, Actinobacteria and Gemmatimonadetes, Verrucomicrobia and Chloroflexi had no significant relationship with soil, climate or geographical factors. At the genus level, axis-1 and axis-2 explained 60.79% of the variance in bacterial relative abundance amongst provenances (Figure 6b). Most bacterial genera, such as Candidatus_Udaeobacter, HSB_OF53-F07, Acidibacter, Aquisphaera, and Burkholderia-Caballeronia-Paraburkholderia, were influenced significantly by soil factors. Some genera, such as Candidatus_Xiphinematobacter and 1921-2, had a strong association with geographical factors and climate.

4. Discussion

4.1. Geographical Distribution of Rhizosphere Soil Bacteria

The distribution of the soil microbial community on a large scale has been widely investigated [39]. However, the rhizosphere bacterial community in Chinese fir provenances is still poorly constrained. This study shows the spatial distribution of the rhizosphere bacteria of the provenances. Proteobacteria, Acidobacteria, Actinobacteria, Verrucomicrobia, Chloroflexi, Planctomycetes, Gemmatimonadetes, and Firmicutes are widespread in the rhizosphere soil of Chinese fir, which is consistent with a previous study [40]. Owing to different environmental conditions, varying bacterial communities were identified (Figure 3e). Only a few bacteria showed marked geographical distribution in relative abundance. For example, owing to the significant effects of latitude, precipitation and temperature (Figure 6a), the relative abundance of Planctomycetes decreased with increasing latitude. The Chinese fir provenances in the northern margin have many more biomarkers (Figure 4), e.g., Entotheonellaeota, Chloroflexales, Gitt_GS_136, AT_s3_28, and Gemmatimonadetes, which may play a major role in the geographical expansion of Chinese fir. This may be due to the active involvement of rhizosphere bacteria in the interaction between plants and the environment, such as soil organic matter transformation [41] and anammox [42], producing plant growth hormones [43,44] and improving plant viability [13,45,46]. Thus, rhizosphere bacteria and plants coevolved [47]. Furthermore, we found no significant change in bacterial α-diversity with latitude, which is consistent with the study of Delgado-Baquerizo [18]. This may be due to soil nutrient distribution, which may have stronger effects than latitude. Rhizosphere soil bacterial diversity and richness in Hunan, Fujian, and Zhejiang provinces, which are consideredthe central production area with well-grown Chinese fir plantations, are relatively high. This indicates that rhizosphere soil bacterial diversity and richness may be important factors affecting the distribution of the central production area. The rhizosphere soil bacterial communities in the central production area warrant further study, and biomarkers should be further ascertained in terms of their functional relationship withChinese fir.

4.2. Driving Factors of the Geographical Distribution of Rhizosphere Bacteria

Understanding the driving factors of bacteria in the Chinese fir rhizosphere is significant for developing and utilizingbacterial resources and for improving the adaptability and growth characteristics of Chinese fir. Environmental factors such as soil nutrients and precipitation significantly affect the diversity of the rhizosphere bacterial community in Chinese fir (Table 2), which is consistent with the findings of other studies [17,48]. The reason why soil nutrients have a stronger impact on bacterial diversity than latitude may be because soil nutrients and precipitation are directly related to bacterial metabolism and the living environment. Moreover, changes in soil nutrients and precipitation with latitude are not always systematic. Soil pH had a significant influence on the relative abundance of the most active rhizosphere soil bacteria but this cannot always explain the differencesin relative abundance (Figure 6). Other studies also agree that soil pH is the key factor affecting the soil microbial community [49,50]. However, in addition to environmental factors, other studies have found that biological factors are closely related to the rhizosphere bacterial community. The carbon source for soil bacterial activity is primarily litter and root exudates [51]. Therefore, the interaction between the surface and underground plant parts is considered the main factor affecting the large-scale diversity of rhizosphere bacteria [52,53]. In addition, plant roots can regulate the diversity and relative abundance of rhizosphere soil bacteria and maintain their health through rhizosphere recruitment [54,55]. Other studies have shown that a high C/N ratio of soil can induce fungi that produce antibiotics that can control the relative abundance of the bacterial community [17]. The relationship between biological factors (such as types of Chinese fir provenances and fungi) and the rhizosphere bacterial community should be further studied in the future.

5. Conclusions

The rhizosphere bacterial compositions of Dechang, Junlian, Shangrao, Zhenxiong, Yangxin, Xinyang, Luotian, and Tianmushan provenances weresignificantly different from other provenances. Based on the relative abundance of bacteria, the easternand central middle belts clustered together but were separated from the western middle belt. The biomarkers of Chinese fir provenances were primarily distributed in northern marginal areas. The α-diversity of rhizosphere bacteria was significantly different, and the diversity and richness of bacteria near Hunan, Fujian, and Zhejiang provinces were relatively high. Hunan Youxian had the highest α-diversity, whereas Henan Xinyang had the lowest. The diversity and richness of bacteria in the middle belt increased from south to north and were slightly higher than those in the southern and northern belts. From east to west, the diversity and richness of bacteria in the middle belt followed a “W” trend, and the diversity and richness of bacteria in the eastern middle belt were the highest. Soil properties and precipitation rate were the main driving factors of rhizosphere soil bacterial diversity, and soil pH had a strong influence on the relative abundance of rhizosphere soil bacteria. In the future, large-scale rhizosphere fungal communities of Chinese fir provenances should be analyzed. Understanding the correlation between growth traits (such as wood properties) of Chinese fir provenances and rhizosphere bacteria and fungi may be useful to improve the production of Chinese fir. The effects of types of Chinese fir provenances on rhizosphere microorganisms also need to be further analyzed.

Author Contributions

Y.Y. and X.M. conceived and designed the study; Y.Y., B.L., Z.H. and H.Z. conducted the field and lab experiments; Y.Y., B.L., X.W. and Z.H. collected and analyzed the data and drafted the manuscript; T.H.F., P.W., M.L. and X.M. edited the English version of the manuscript. All authors have read and agreed to the published version of the manuscript.

Funding

This study was funded by the National Natural Science Foundation of China (31971674), Science and Technology Major Project of Fujian Province, China (2018NZ0001-1), and the Key Project of Natural Science Foundation of Fujian Province (2020J02029).

Institutional Review Board Statement

Not applicable.

Informed Consent Statement

Not applicable.

Data Availability Statement

All the data is presented in the manuscript.

Conflicts of Interest

The authors declare no conflict of interest.

References

  1. Guo, J.; Guo, X.; Xiao, F.; Xiong, C.; Yin, Y. Influences of provenance and rotation age on heartwood ratio, stem diameter and radial variation in tracheid dimension of Cunninghamia lanceolata. Eur. J. Wood Wood Prod. 2018, 76, 669–677. [Google Scholar] [CrossRef]
  2. Xu, Y.; Du, C.; Huang, G.; Li, Z.; Xu, X.; Zheng, J.; Wu, C. Morphological characteristics of tree crowns of Cunninghamia lanceolata var. Luotian. J. For. Res. 2020, 31, 837–856. [Google Scholar] [CrossRef] [Green Version]
  3. Chen, Y.; Nguyen, T.H.N.; Qin, J.; Jiao, Y.; Li, Z.; Ding, S.; Lu, Y.; Liu, Q.; Luo, Z.-B. Phosphorus assimilation of Chinese fir from two provenances during acclimation to changing phosphorus availability. Environ. Exp. Botany. 2018, 153, 21–34. [Google Scholar] [CrossRef]
  4. Li, K.P.; Wei, Z.C.; Huang, K.Y.; Dong, L.J.; Huang, H.F.; Chen, Q.; Dai, J.; Tan, W.J. Research on Variation Pattern of Wood Properties of Red-heart Chinese Fir Plus Trees, a Featured Provenance from Rongshui of Guangxi. For. Res. 2017, 30, 424–429. [Google Scholar] [CrossRef]
  5. Wu, P.F.; Tigabu, M.; Ma, X.Q.; Oden, P.C.; He, Y.L.; Yu, X.T.; He, Z.Y. Variations in biomass, nutrient contents and nutrient use efficiency among Chinese fir provenances. Silvae Genet. 2011, 60, 95–105. [Google Scholar] [CrossRef] [Green Version]
  6. Wu, H.B.; Duan, A.G.; Zhang, J.G.; Sun, J.J. Effect of Long-term Selection of Chinese fir (Cunninghamia lanceolata (Lamb.)Hook) Provenances. For. Res. 2019, 32, 9–17. [Google Scholar] [CrossRef]
  7. Zheng, H.; Duan, H.; Hu, D.; Li, Y.; Hao, Y. Genotypic variation of Cunninghamia lanceolata revealed by phenotypic traits and SRAP markers. Dendrobiology 2015, 74, 85–94. [Google Scholar] [CrossRef] [Green Version]
  8. Zhang, J.; Liu, Y.-X.; Zhang, N.; Hu, B.; Jin, T.; Xu, H.; Qin, Y.; Yan, P.; Zhang, X.; Guo, X.; et al. NRT1.1B is associated with root microbiota composition and nitrogen use in field-grown rice. Nat. Biotechnol. 2019, 37, 676–684. [Google Scholar] [CrossRef]
  9. Bakker, P.A.H.M.; Pieterse, C.M.J.; de Jonge, R.; Berendsen, R.L. The Soil-Borne Legacy. Cell 2018, 172, 1178–1180. [Google Scholar] [CrossRef] [Green Version]
  10. Gaiero, J.R.; McCall, C.A.; Thompson, K.A.; Day, N.J.; Best, A.S.; Dunfield, K.E. Inside the root microbiome: Bacterial root endophytes and plant growth promotion. Am. J. Bot. 2013, 100, 1738–1750. [Google Scholar] [CrossRef] [Green Version]
  11. Wu, H.; Haig, T.; Pratley, J.; Lemerle, D.; An, M. Allelochemicals in Wheat (Triticum aestivum L.):  Cultivar Difference in the Exudation of Phenolic Acids. J. Agric. Food Chem. 2001, 49, 3742–3745. [Google Scholar] [CrossRef]
  12. Singh, G.; Mukerji, K.G. Root Exudates as Determinant of Rhizospheric Microbial Biodiversity. In Microbial Activity in the Rhizoshere; Springer: Berlin/Heidelberg, Germany, 2006; pp. 39–53. [Google Scholar] [CrossRef]
  13. Rolfe, S.A.; Griffiths, J.; Ton, J. Crying out for help with root exudates: Adaptive mechanisms by which stressed plants assemble health-promoting soil microbiomes. Curr. Opin. Microbiol. 2019, 49, 73–82. [Google Scholar] [CrossRef]
  14. Pham, V.H.T.; Kim, J. Cultivation of unculturable soil bacteria. Trends Biotechnol. 2012, 30, 475–484. [Google Scholar] [CrossRef] [PubMed]
  15. Wu, Y.; Ke, X.; Hernández, M.; Wang, B.; Dumont, M.G.; Jia, Z.; Conrad, R. Autotrophic Growth of Bacterial and Archaeal Ammonia Oxidizers in Freshwater Sediment Microcosms Incubated at Different Temperatures. Appl. Environ. Microbiol. 2013, 79, 3076–3084. [Google Scholar] [CrossRef] [PubMed] [Green Version]
  16. Połka, J.; Rebecchi, A.; Pisacane, V.; Morelli, L.; Puglisi, E. Bacterial diversity in typical Italian salami at different ripening stages as revealed by high-throughput sequencing of 16S rRNA amplicons. Food Microbiol. 2015, 46, 342–356. [Google Scholar] [CrossRef] [PubMed]
  17. Bahram, M.; Hildebrand, F.; Forslund, S.K.; Anderson, J.L.; Soudzilovskaia, N.A.; Bodegom, P.M.; Bengtsson-Palme, J.; Anslan, S.; Coelho, L.P.; Harend, H.; et al. Structure and function of the global topsoil microbiome. Nature 2018, 560, 233–237. [Google Scholar] [CrossRef]
  18. Delgado-Baquerizo, M.; Maestre, F.T.; Reich, P.B.; Trivedi, P.; Osanai, Y.; Liu, Y.R.; Hamonts, K.; Jeffries, T.C.; Singh, B.K. Carbon content and climate variability drive global soil bacterial diversity patterns. Ecol. Monogr. 2016, 86, 373–390. [Google Scholar] [CrossRef]
  19. Wan, X.; Huang, Z.; He, Z.; Yu, Z.; Wang, M.; Davis, M.R.; Yang, Y. Soil C:N ratio is the major determinant of soil microbial community structure in subtropical coniferous and broadleaf forest plantations. Plant Soil 2015, 387, 103–116. [Google Scholar] [CrossRef]
  20. Bulgarelli, D.; Garrido-Oter, R.; Munch, P.C.; Weiman, A.; Droge, J.; Pan, Y.; McHardy, A.C.; Schulze-Lefert, P. Structure and function of the bacterial root microbiota in wild and domesticated barley. Cell Host Microbe 2015, 17, 392–403. [Google Scholar] [CrossRef] [Green Version]
  21. Jaiswal, S.K.; Mohammed, M.; Dakora, F.D. Microbial community structure in the rhizosphere of the orphan legume Kersting’s groundnut [Macrotyloma geocarpum (Harms) Marechal & Baudet]. Mol. Biol. Rep. 2019, 46, 4471–4481. [Google Scholar] [CrossRef]
  22. Fierer, N.; Jackson, R.B. The Diversity and Biogeography of Soil Bacterial Communities. Proc. Natl. Acad. Sci. USA 2006, 103, 626–631. [Google Scholar] [CrossRef] [PubMed] [Green Version]
  23. Singh, D.; Lee-Cruz, L.; Kim, W.-S.; Kerfahi, D.; Chun, J.-H.; Adams, J.M. Strong elevational trends in soil bacterial community composition on Mt. Halla, South Korea. Soil Biol. Biochem. 2014, 68, 140–149. [Google Scholar] [CrossRef]
  24. Delgado-Baquerizo, M. Obscure soil microbes and where to find them. ISME J. 2019, 13, 2120–2124. [Google Scholar] [CrossRef] [PubMed] [Green Version]
  25. Fei, Y.-C.; Wu, Q.-Z.; Lu, J.; Ji, C.-S.; Zheng, H.; Cao, S.-J.; Lin, K.-M.; Cao, G.-Q. Effects of Undergrowth Vegetation Management Measures on the Soil Bacterial Community Structure of Large Diameter Timber Plantation of Cunninghamia Lanceolata. Chin. J. Appl. Ecol. 2020, 31, 407–416. [Google Scholar] [CrossRef]
  26. Cheng, X.; Xing, W.; Yuan, H.; Yu, M. Long-Term Thinning Does not Significantly Affect Soil Water-Stable Aggregates and Diversity of Bacteria and Fungi in Chinese Fir (Cunninghamia lanceolata) Plantations in Eastern China. Forests 2018, 9, 687. [Google Scholar] [CrossRef] [Green Version]
  27. Wu, Z.; Li, J.; Zheng, J.; Liu, J.; Liu, S.; Lin, W.; Wu, C. Soil microbial community structure and catabolic activity are significantly degenerated in successive rotations of Chinese fir plantations. Sci. Rep. 2017, 7, 6691–6697. [Google Scholar] [CrossRef] [PubMed] [Green Version]
  28. Cao, J.; Zheng, Y.; Yang, Y. Phylogenetic Structure of Soil Bacterial Communities along Age Sequence of Subtropical Cunninghamia Lanceolata Plantations. Sustainability 2020, 12, 1864. [Google Scholar] [CrossRef] [Green Version]
  29. Lei, X.; Shen, F.; Lei, X.; Liu, W.; Duan, H.; Fan, H.; Wu, J. Assessing influence of simulated canopy nitrogen deposition and under-story removal on soil microbial community structure in a Cunninghamia lanceolata plantation. Biodivers. Sci. 2018, 26, 962–971. [Google Scholar] [CrossRef]
  30. Wu, Z.-Y.; Lin, W.-X.; Li, J.-J.; Liu, J.-F.; Li, B.-L.; Wu, L.-K.; Fang, C.-X.; Zhang, Z.-X. Effects of seasonal variations on soil microbial community composition of two typical zonal vegetation types in the Wuyi Mountains. J. Mt. Sci. 2016, 13, 1056–1065. [Google Scholar] [CrossRef]
  31. Xie, L.; Zhang, Q.; Cao, J.; Liu, X.; Xiong, D.; Kong, Q.; Yang, Y. Effects of Warming and Nitrogen Addition on the Soil Bacterial Community in a Subtropical Chinese Fir Plantation. Forests 2019, 10, 861. [Google Scholar] [CrossRef] [Green Version]
  32. Riley, D.; Barber, S.A. Bicarbonate Accumulation and pH Changes at the Soybean (Glycine max (L.) Merr.) Root-Soil Interface. Soil Sci. Soc. Am. J. 1969, 63, 905–908. [Google Scholar] [CrossRef]
  33. Wang, Q.; Wang, C.; Yu, W.; Turak, A.; Chen, D.; Huang, Y.; Ao, J.; Jiang, Y.; Huang, Z. Effects of Nitrogen and Phosphorus Inputs on Soil Bacterial Abundance, Diversity, and Community Composition in Chinese Fir Plantations. Front. Microbiol. 2018, 9, 1543. [Google Scholar] [CrossRef]
  34. Chen, S.; Zhou, Y.; Chen, Y.; Gu, J. fastp: An ultra-fast all-in-one FASTQ preprocessor. Bioinformatics 2018, 34, 884–890. [Google Scholar] [CrossRef] [PubMed]
  35. Magoč, T.; Salzberg, S.L. FLASH: Fast length adjustment of short reads to improve genome assemblies. Bioinformatics 2011, 27, 2957–2963. [Google Scholar] [CrossRef] [PubMed]
  36. Caporaso, J.G.; Kuczynski, J.; Stombaugh, J.; Bittinger, K.; Bushman, F.D.; Costello, E.K.; Fierer, N.; Peña, A.G.; Goodrich, J.K.; Gordon, J.I.; et al. QIIME allows analysis of high-throughput community sequencing data. Nat. Methods 2010, 7, 335–336. [Google Scholar] [CrossRef] [PubMed] [Green Version]
  37. Edgar, R.C.; Haas, B.J.; Clemente, J.C.; Quince, C.; Knight, R. UCHIME improves sensitivity and speed of chimera detection. Bioinformatics 2011, 27, 2194–2200. [Google Scholar] [CrossRef] [PubMed] [Green Version]
  38. Edgar, R.C. UPARSE: Highly accurate OTU sequences from microbial amplicon reads. Nat. Methods 2013, 10, 996–998. [Google Scholar] [CrossRef] [PubMed]
  39. Delgado-Baquerizo, M.; Maestre, F.T.; Reich, P.B.; Jeffries, T.C.; Gaitan, J.J.; Encinar, D.; Berdugo, M.; Campbell, C.D.; Singh, B.K. Microbial diversity drives multifunctionality in terrestrial ecosystems. Nat. Commun. 2016, 7, 10541. [Google Scholar] [CrossRef] [Green Version]
  40. Janssen, P.H. Identifying the dominant soil bacterial taxa in libraries of 16S rRNA and 16S rRNA genes. Appl. Environ. Microbiol. 2006, 72, 1719–1728. [Google Scholar] [CrossRef] [Green Version]
  41. Fierer, N.; Bradford, M.A.; Jackson, R.B. Toward an Ecological Classification of Soil Bacteria. Ecology 2007, 88, 1354–1364. [Google Scholar] [CrossRef]
  42. van Niftrik, L.; Geerts, W.J.C.; van Donselaar, E.G.; Humbel, B.M.; Webb, R.I.; Harhangi, H.R.; den Camp, H.J.M.O.; Fuerst, J.A.; Verkleij, A.J.; Jetten, M.S.M.; et al. Cell division ring, a new cell division protein and vertical inheritance of a bacterial organelle in anammox planctomycetes. Mol. Microbiol. 2009, 73, 1009–1019. [Google Scholar] [CrossRef]
  43. Brown, M.E. Seed and Root Bacterization. Annu. Rev. Phytopathol. 1974, 12, 181–197. [Google Scholar] [CrossRef]
  44. Mayak, S.; Tirosh, T.; Glick, B.R. Plant growth-promoting bacteria confer resistance in tomato plants to salt stress. Plant Physiol. Biochem. 2004, 42, 565–572. [Google Scholar] [CrossRef]
  45. Getzke, F.; Thiergart, T.; Hacquard, S. Contribution of bacterial-fungal balance to plant and animal health. Curr. Opin. Microbiol. 2019, 49, 66–72. [Google Scholar] [CrossRef]
  46. Hu, L.; Robert, C.; Cadot, S.; Zhang, X.; Ye, M.; Li, B.; Manzo, D.; Chervet, N.; Steinger, T.; Van Der Heijden, M.G.A.; et al. Root exudate metabolites drive plant-soil feedbacks on growth and defense by shaping the rhizosphere microbiota. Nat. Commun. 2018, 9, 2713–2738. [Google Scholar] [CrossRef] [PubMed] [Green Version]
  47. Cordovez, V.; Dini-Andreote, F.; Carrión, V.J.; Raaijmakers, J.M. Ecology and Evolution of Plant Microbiomes. Annu. Rev. Microbiol. 2019, 73, 69–88. [Google Scholar] [CrossRef] [PubMed]
  48. Dick, R.P.; Rasmussen, P.E.; Kerle, E.A. Influence of long-term residue management on soil enzyme activities in relation to soil chemical properties of a wheat-fallow system. Biol. Fertil. Soils 1988, 6, 159–164. [Google Scholar] [CrossRef]
  49. Xia, Z.; Bai, E.; Wang, Q.; Gao, D.; Zhou, J.; Jiang, P.; Wu, J. Biogeographic Distribution Patterns of Bacteria in Typical Chinese Forest Soils. Front. Microbiol. 2016, 7, 1106. [Google Scholar] [CrossRef] [PubMed] [Green Version]
  50. Kim, S.; Axelsson, E.P.; Girona, M.M.; Senior, J.K. Continuous-cover forestry maintains soil fungal communities in Norway spruce dominated boreal forests. For. Ecol. Manag. 2021, 480, 118659. [Google Scholar] [CrossRef]
  51. Bach, L.H.; Grytnes, J.-A.; Halvorsen, R.; Ohlson, M. Tree influence on soil microbial community structure. Soil Biol. Biochem. 2010, 42, 1934–1943. [Google Scholar] [CrossRef]
  52. Yang, T.; Tedersoo, L.; Soltis, P.S.; Soltis, D.E.; Gilbert, J.A.; Sun, M.; Shi, Y.; Wang, H.; Li, Y.; Zhang, J.; et al. Phylogenetic imprint of woody plants on the soil mycobiome in natural mountain forests of eastern China. ISME J. 2019, 13, 686–697. [Google Scholar] [CrossRef] [PubMed] [Green Version]
  53. Ramirez, K.S.; Snoek, L.B.; Koorem, K.; Geisen, S.; Bloem, L.J.; ten Hooven, F.; Kostenko, O.; Krigas, N.; Manrubia, M.; Caković, D.; et al. Range-expansion effects on the belowground plant microbiome. Nat. Ecol. Evol. 2019, 3, 604–611. [Google Scholar] [CrossRef] [PubMed]
  54. Yi, H.-S.; Yang, J.W.; Ghim, S.-Y.; Ryu, C.-M. A cry for help from leaf to root: Aboveground insect feeding leads to the recruitment of rhizosphere microbes for plant self-protection against subsequent diverse attacks. Plant Signal. Behav. 2011, 6, 1192–1194. [Google Scholar] [CrossRef] [PubMed] [Green Version]
  55. Mendes, R.; Kruijt, M.; de Bruijn, I.; Dekkers, E.; van der Voort, M.; Schneider, J.H.M.; Piceno, Y.M.; DeSantis, T.Z.; Andersen, G.L.; Bakker, P.A.H.M.; et al. Deciphering the Rhizosphere Microbiome for Disease-Suppressive Bacteria. Science 2011, 332, 1097–1100. [Google Scholar] [CrossRef]
Figure 1. Natural distribution of Chinese fir and the location of sample plots. N, northern belt; M1, western middle belt; M2, central middle belt; M3, eastern middle belt; S, southern belt. MG, Yunnan Maguan; RS, Guangxi Rongshui; SH, Fujian Shanghang; LC, Guangdong Lechang; RJ, Guizhou Rongjiang; JP, Guizhou Jinping; HNYX, Hunan Youxian; DC, Sichuan Dechang; QY, Zhejiang Qingyuan; ZX, Yunnan Zhenxiong; JL, Sichuan Junlian; SR, Jiangxi Shangrao; HBYX, Hubei Yangxin; TMS, Zhejiang Tianmushan; LT, Hubei Luotian; XY, Henan Xinyang.
Forests 12 01362 g001
Figure 2. Rarefaction curves of bacteria established based on 97% similarity.
Forests 12 01362 g002
Figure 3. Ten most abundant phyla (a) and genera (b) amongst different Chinese fir provenances. Principal coordinate analysis of Bray distances amongst various samples at phylum (c) and genus (d) levels. Bacterial phylum and genus compositions of rhizosphere soil under different Chinese fir provenances. (e) Heat map showing the distribution of the 20 most abundant genera. (f) Distribution of the 10 most abundant phyla. N, northern belt; M1, western middle belt; M2, central middle belt; M3, eastern middle belt; S, southern belt.
Forests 12 01362 g003aForests 12 01362 g003bForests 12 01362 g003c
Figure 4. Linear discriminant analysis effect size (LEfSe) analysis of biomarkers in the rhizosphere of different Chinese fir provenances from domain to genus. Linear discriminant analysis (LDA) score = 2 was used to check biomarkers. The yellow node in the figure indicates no significant difference in the abundance of this bacterium at this level amongst different provenances; other node colors indicate that the abundance of bacteria in this provenance was significantly higher than that in other provenances (p < 0.05).
Forests 12 01362 g004
Figure 5. Shannon, Simpson, Chao1, and ACE indices of bacterial communities in the rhizosphere of Chinese fir provenances. Indices changed with latitude (a), longitude (b), and different blocks (c,d). For every provenance with three replicates, one-way variance analysis with the least significant difference test (p < 0.05) was performed using SPSS Statistics 19.0. Letters display the significant shift amongst provenances or blocks. N, northern belt; M1, western middle belt; M2, central middle belt; M3, eastern middle belt; S, southern belt.
Forests 12 01362 g005
Figure 6. Redundancy analysis relating phylum (a) and genus (b) to selected environmental factors (shown as arrows). The lengths of these arrows show relative significance, whereas the angle between the arrows and the axis reflects the degree to which they are correlated.
Forests 12 01362 g006
Table 1. Sample plot details, including geographical location (longitude, latitude, and altitude), climate factors (annual average precipitation (AAP) and annual average temperature (AAT))and growth conditions.
Producing RegionsProvenancesLongitudeLatitudeAltitude (m)AAP (mm)AAT (°C)Stand Age (year)Average Tree Height (m)Average DBH (cm)Average Crown (m)
Southern belt (S)MG104°25′58″23°2′5″1594134516.94528.739.44.7
RS109°8′37″25°3′54″550181319.64225.437.93.9
Eastern middle belt (M3)SH116°38′7″25°9′47″5711518.219.84029.136.73.4
LC113°18′44″25°10′34″501146419.83921.335.63.5
HNYX113°46′55″27°18′58″582141017.83729.334.54.5
QY118°50′51″27°25′38″930176017.43734.443.12.6
SR117°59′13″28°26′47″150178018.34230.335.93.3
HBYX115°1′6″29°55′53″4361389.616.84029.332.14.3
TMS119°30′7″30°23′57″7081613.911.74036.242.34.1
Central middle belt (M2)RJ108°25′45″25°57′48″560125018.14337.144.12.9
JP109°8′9″26°24′32″531130016.44338.743.73.8
JL104°36′46″28°12′50″990110017.63231.440.63.1
Western middle belt (M1)DC102°17′2″27°23′30″7351074.417.73928.137.52.5
ZX104°47′32″27°32′27″17221334.611.34033.641.54.2
Northern belt (N)LT115°32′25″31°7′15″443133016.43827.638.73.7
XY113°59′52″32°5′58″137105015.53926.830.84.3
Table 2. Redundancy analysis of environmental factors on bacterial α-diversity by permutationtest (p < 0.05) using Canoco 5.0.
FactorExplains/%FP
Ca/Mg8.14.00.032 *
AAP6.93.70.044 *
K9.05.20.014 *
Mg10.97.20.006 **
K/Ca5.33.70.032 *
N4.23.10.090
P9.88.50.006 **
AAT2.42.10.132
LO2.52.30.118
LA2.32.20.114
N/P3.94.00.022 *
AL1.81.90.128
K/Mg0.90.90.362
C/N1.01.10.312
C/P0.50.60.516
pH0.40.40.624
C0.20.20.812
Ca0.10.10.874
[LO, Longitude; LA, Latitude; AL, Altitude; AAP, annual average precipitation; AAT, annual average temperature. “*” indicates a significant explanation (p < 0.05) and “**” indicates an extremely significant explanation (p < 0.01)].
Publisher’s Note: MDPI stays neutral with regard to jurisdictional claims in published maps and institutional affiliations.

