Article

A Band Model of Cambium Development: Opportunities and Prospects

by
Vladimir V. Shishov
1,2,*,
Ivan I. Tychkov
1,3,
Kevin J. Anchukaitis
4,5,*,
Grigory K. Zelenov
3 and
Eugene A. Vaganov
2,3
1
Institute of Fundamental Biology and Biothechnology, Siberian Federal University, 660041 Krasnoyarsk, Russia
2
Sukachev Institute of Forest, Siberian Branch of the Russian Academy of Science, 660036 Krasnoyarsk, Russia
3
Institute of Ecology and Geography, Siberian Federal University, 660041 Krasnoyarsk, Russia
4
Laboratory of Tree-Ring Research, University of Arizona, Tucson, AZ 85721, USA
5
School of Geography, Development and Environment, University of Arizona, Tucson, AZ 85721, USA
*
Authors to whom correspondence should be addressed.
Forests 2021, 12(10), 1361; https://doi.org/10.3390/f12101361
Submission received: 13 August 2021 / Revised: 25 September 2021 / Accepted: 28 September 2021 / Published: 7 October 2021
(This article belongs to the Special Issue Simulation Models of the Dynamics of Forest Ecosystems)

Abstract

:
More than 60% of tree phytomass is concentrated in stem wood, which is the result of periodic activity of the cambium. Nevertheless, there are few attempts to quantitatively describe cambium dynamics. In this study, we develop a state-of-the-art band model of cambium development, based on the kinetic heterogeneity of the cambial zone and the connectivity of the cell structure. The model describes seasonal cambium development based on an exponential function under climate forcing which can be effectively used to estimate the seasonal cell production for individual trees. It was shown that the model is able to simulate different cell production for fast-, middle- and slow-growing trees under the same climate forcing. Based on actual measurements of cell production for two contrasted trees, the model effectively reconstructed long-term cell production variability (up to 75% of explained variance) of both tree-ring characteristics over the period 1937−2012. The new model significantly simplifies the assessment of seasonal cell production for individual trees of a studied forest stand and allows the entire range of individual absolute variability in the ring formation of any tree in the stand to be quantified, which can lead to a better understanding of the anatomy of xylem formation, a key component of the carbon cycle.

1. Introduction

More than 60% of tree phytomass is concentrated in stem wood, which is the result of periodic activity of the lateral meristem, that is, the cambium [1,2]. Cambium, as a self-sustaining system in the trunks of tree species, can exist over hundreds and even thousands of years, annually producing layers of phloem and xylem [3,4,5]. The term cambium is commonly used to refer to multiple cell rows that persist even during the dormancy stage. In the active phase of growth, not only does the number of cambial cells increase; there exist both initial cells and their derivatives in the cambial zone, namely the mother cells of phloem and xylem. In this stage of growth, the cambial zone is the target of and responds to both internal (e.g., hormones, peptides) and external (e.g., climate, competition) factors, including stress-related factors [6,7].
Despite advances in both histological and genetic studies of meristems, the mechanisms that coordinate cambium functioning as the main lateral meristem have not yet been clarified. Presumably, the balance of auxins (hormones descending from the eapical meristem) and cytokinins (hormones ascending from the root meristems) participate in the regulation of cambium activity [8,9,10,11,12,13]. It is also assumed that some limited synthesis of these compounds is possible in the cambial zone cells themselves [14]. The cambial zone is subject to gradients of auxin concentration, principal substrates (sugars), and a number of enzymes [10,15,16,17]. Similar gradients have been identified for several cyclins, namely the hormones involved in the regulation of the individual cell cycle [18,19,20,21]. Such gradients are believed to be linked to the differential expression of genes, which regulates the cell division process as well as wall-thickening, maturation, and the transition of cambial mother cells to an enlargement zone. They also trigger the process of apoptosis and the formation of xylem cells as a basic component of water-conducting system of a tree stem [22,23].
For conifer species the lateral meristem is simply structured. The water-conducting system (xylem) consists of radial rows of tracheids (90%–95% of the total number of cells in the xylem), and each individual row is a production of the respective cambial zone region, numbering several cells. The long-term debate regarding the number of initials [2] appears to have been solved by recent experimental confirmation, with the presence of the single initial cell in the cambium having been established using sectoral genetic analysis [24]. It is very difficult to identify the precise spatial position of the initial, taking into account that the production of the mother cells in the xylem direction significantly exceeds (up to 10 times) their production in the phloem direction [2]. Nevertheless, it can be assumed that the number of xylem mother cells significantly exceeds the number of phloem mother cells.
Despite the importance of understanding the regulation of cambium activity, there have still been relatively few attempts to quantitatively describe cambium dynamics [23,25,26,27,28]. Significant limitations of those approaches have been shown, particularly with regards to estimating the processes that determines when cells transition from the cambial zone to the enlargement zone [23]. New quantitative approaches to the modelling of the cambial zone are also needed, in order to take into account a rapidly growing body of literature, observations, experimentation, and theory on xylogenesis measurements and the contributions of internal and external factors in influencing the production of new xylem cells [28,29,30,31,32,33,34,35,36].
Based on data on the outcomes of plant meristem activity [27], we assumed that the growth rate of cells within the cambial zone is heterogeneous and increases towards the outer border of the cambial zone. This hypothesis was used as a basis for the Vaganov-Shashkin process-based tree-ring model (VS-model) developed for conifer species [27]. Cell production during the growing season is simulated in accordance with nonlinear responses of tree-ring growth rate to climate forcings (temperature, soil moisture, and solar irradiation) [27,37,38,39,40,41,42,43]. However, even using multidimensional and multicriteria parameterization of the model [35,39,44,45,46], the cambial block (kinetic model of cambium) is still very complex to use and a challenge to interpret directly. This submodel is based on the kinetic process of complex cambium functioning, i.e., position control of cambial mother cells relative to initial, and their rates of division [27,39,43]. Moreover, the 12 submodel cambial parameters cannot be readily tested using experimental or direct measurements [43]. As a result, it was not possible to characterize the entire spectrum of cambium production variability, which can be specific to different years of tree growth, to individual trees with different growth energy, or across various conifer species and habitats [40]. Moreover, the simulated cambial activity of the VS-model is for a mean (“typical” or “average”) tree experiencing environmental conditions at a site, and the cell production of such a tree is transformed into relative tree-growth indices associated with tree-ring chronology [27]. The potential for abrupt changes in cambial activity (cell production) as a natural response to extreme biotic and abiotic disturbance such as insect outbreaks, geomorphological events, forest fires, etc., were not considered in the model. Based on these limitations as well as more than two decades of experience applying the VS-model to a range of species, habitats, and climate conditions in Northern Hemisphere, we recognize it is necessary to expand the capabilities of the model’s cambial block to simulate the growth response of individual trees with different patterns of cell production and allow estimation of the absolute values of tree-ring increment in a wide range of growing trees in the forest stand.
From a simple description of the cellular process of xylem formation, it might be expected at first that cells in each row can develop independently from those adjacent, i.e. that a row of cells could enlarge with a specific growth rate which could be different from that of the adjacent rows. However, it has been shown that such independent growth is impossible due to the bordered pits between adjacent tracheids [47]. These pits could be considered analogous to “nails” that hold the adjacent rows together and limit their independent activity.
We considered xylem formation (xylogenesis) as sequentially interconnected processes: cambium cell production, cell enlargement, cell-wall thickening and cell lignification [48]. It was shown that seasonal cell production is closely connected with a width of formed rings, i.e., the greater the production, the wider the rings [27,36,38,39,40,43,44].
In this study, we concentrated on the cambial activity process and cell production. The purpose of this work is to develop a new simulated approach to cell production as a result of cambium activity for the entire range of tree-ring variability, even for individual trees We develop a novel, but still tractable model of the active cambial zone, using the hypothesis of the dependence of growth between adjacent rows of cells as an additional constraint [2,47]. This hypothesis within the meristem, therefore, leads to the assumption that the adjacent rows of cells should have the same specific growth rate. It was shown among different mathematical functions (i.e., linear, Gompertz, von Bertalanffy, logistic, Verhulst, etc.) that the enlargement of adjacent cell rows can be described by the exponential law (unpublished results). The exponent function guarantees that the specific rate is a constant along the meristem (unpublished results). We do not claim that an exponential form is the only function; however, so far only this confirms the next fundamental result: the strong correlation between the growth of adjacent rows of cells due to the bordered pits between adjacent tracheids, taking into account our own computer experiments with other biologically interpreted functions. Moreover, it was also shown earlier that the growth rate in meristem should change exponentially based on the relationship between the mitotic index and the duration of a cambial cell cycle [27] (pp. 81–89).
The hypothesis described above leads to the following modifications of the existing paradigm underlying the VS-model (see Supplementary Material, Table S1):
  • The cambial zone is considered as an “elastic band” within which there is non-uniformity in the rate of its radial enlargement, i.e., the wider the cambial zone, the higher the production rate per time unit in the enlargement zone;
  • The growth and division of individual cells in the meristem are not considered;
  • The specific incremental production within the cambial zone is determined at the outer border with the xylem, and the cell production (absolute linear increment of cell tissue as μm in the enlargement zone per time unit) is characterized by the kinetic parameters of the zone as a whole.

2. Materials and Methods

2.1. Brief Description of the VS-Model

The main external factors affecting the growth rate of cambial cells are daily temperature, precipitation, and solar irradiation or day length (Figure 1, Environmental block). The relationship between the integral growth rate of tree-rings Vext(t) and external factors in the time unit t are described by the equation [27,40,42]:
Vext (t) = VI(t)min(VT(t), VW(t))
where VI(t), VT(t), VW(t) are partial growth rates dependent on solar radiation (day length) (I), temperature (T), and soil moisture (W), respectively (Figure 1, Environmental block). The input data for the model are daily records of mean temperature, total precipitation, and latitude of the dendrochronological site to estimate day length.
In the standard version of the VS-model, Vext(t) is used to evaluate seasonal cell production using a complex kinetic model of cambial activity with 12 parameters (Figure 1, Cambial block) based on a position control of cambial mother cells relative to initial and their rates of division [27,39,43]. The cambial block simplification is a target of the developing band model of cambium development.
The VS-modeling results (Figure 1, Outputs) allow us to estimate start of growing season (SoS), end of growing season (EoS) and therefore duration of growing season (or period of cambium activity over the long-term interval of daily climate observations) [35,43,44,45] (see Supplementary Material (SM), Section S1).
The Vext(t), SoS and EoS will be used as input parameters in the band model.

2.2. The Band Model of Cambium Development

The new model block now ignores the kinetics of growth and division of individual cambial cells and instead considers the cambium zone as a whole, or as a stretching elastic band or variable width zone (Figure 2). The model target is a simulation of cell production as a result of cambium activity for the entire range of tree-ring variability for individual trees.
The width of the band or cambial zone grows with an average rate of Vint (2) by the constant increment ΔS (usually in units of μm, green segment, Figure 2) which is equal to the square area under the exponential curve, per unit time (blue area, Figure 2).
V i n t = α e β L
The parameters of the exponential function have the following kinetic meaning: α is the cell cycle of the initial (stem cell) (i.e., α−1 is a duration of cell cycle of the initial), and β is the specific growth rate of the cambial zone. The average rate Vint characterizes the rate of cell production in the enlargement zone. The Vint can be determined for any individual tree of the studied stand, which varies from α (minimal growth rate) to 1(maximal growth rate), i.e., from most unfavorable growth conditions to optimal growth conditions when growth is not limited by external factors. The Vint cannot exceed Vext, therefore if the Vint(t) is greater the Vext (t) then we set Vint to Vext, i.e., Vint(t) = Vext(t).
Since a number of studies show a strong correlation between cell production and number of cells in the cambial zone [49,50], the band model has a third important parameter: the width of the cambial zone (L). The value of L changes throughout the growing season and depends on forcing of the growth-limiting abiotic (climatic) factors at time t. The influence of these can be estimated through the integral growth rate Vext of the environmental block in the VS-model [27,40] by the next equation:
L(t) = (ln(Vext(t)) − ln(α))/β
where t is a time unit which is bounded by the limits of growing season, i.e., between the start of growing season (SoS) and its end (EoS). The absolute increment of the cambial zone (ΔS) in μm per time unit t is the area under the exponential curve calculated by the definite integral of the Equation (2) with parameters α, β over interval [0; L(t)]:
Δ S t = 0 L t α e β L d L .
The ΔS is a key to estimate a seasonal cell production. We propose that a new cell appears in the enlargement zone if the cumulative ΔS has reached a certain critical size (e.g., 7–10 μm in cold climate conditions [27]). In this work we propose that the critical size was 10 μm (e.g., each 10 μm of the absolute cambium increment means a new cell in the enlargement zone).
Thus, the integral growth rate Vext describes, on the one hand, the variability of the “cambial band”, and on the other hand is an input parameter for calculating the growth increment (ΔS) dependent on the estimated value of this rate at time t [37,38,39,40].
The parameter α can be species- or site-specific and can change in different habitats. In the work we considered α as a constant based on a 5 year xylogenesis experiment in the study region. The parameter β was chosen by the two-step procedure of estimation described below.
It follows that we can use the seasonal cell production for an estimate of the absolute tree-ring increment TRW in the growing season (y) due to the strong but presumably non-linear relationship between both characteristics [27,40]:
T R W y = F S o S y E o S y L t d t = F S o S y E o S y Δ S t
where SoS and EoS are the start and end of the growing season y, respectively and F is a non-linear regression between observed TRW and seasonal cell production.
The developed PYTHON code of the band model of cambium activity and supported files (ReadMe, Example of Input and Output files used) are available at the GitHub link (https://github.com/SkailOver/The-band-model-of-cambium-development, access on 15 September 2021) (See Supplementary Material Section S2).

2.3. Two-Step Estimation Procedure of β

Simulated cell production in the cell enlargement zone is based on the assumption that the width of the cambial zone L for fast-growing trees is a larger than for slow-growing trees. In this case, the specific growth rate β is negatively correlated to the length L, i.e., the β for fast-growing trees is less than for slow-growing trees.
To allow us to know the “ideal” (theoretical) annual β values, the parameter was chosen by minimizing the root-mean-square error (RMSE) between the observed cumulative seasonal cell production and its simulation obtained by the one-dimensional golden-section search approach. This was the first step towards β estimation (βideal) which provided the best fitting of simulated to observed seasonal cell production. We note that βideal cannot be used directly in further forecasting or reconstruction of cell production, but can be an extrapolation target of further β estimation through known external (climatic) and internal (age-dependent) factors.
For the second step we used the well-known linear regression technique [51] with respective calibration–verification procedure where common climate signal expressed by the normalized Vext(y) [45] and aged-dependent trend in cell production TrendCP(y) of individual tree are considered as independent variables of regression to estimate β y , i.e.,
β y = a 0 + a 1 V e x t y + a 2 T r e n d C P y + ε
where y is the growing season (year), a0, a1, a2 are regression parameters, and ε is the random error. We testified the multiple regressions using a cross-validation procedure used in dendrochronology and dendroclimatology [51].
These estimates of β values were used to simulate a seasonal cell production of individual tree.

2.4. Data Description

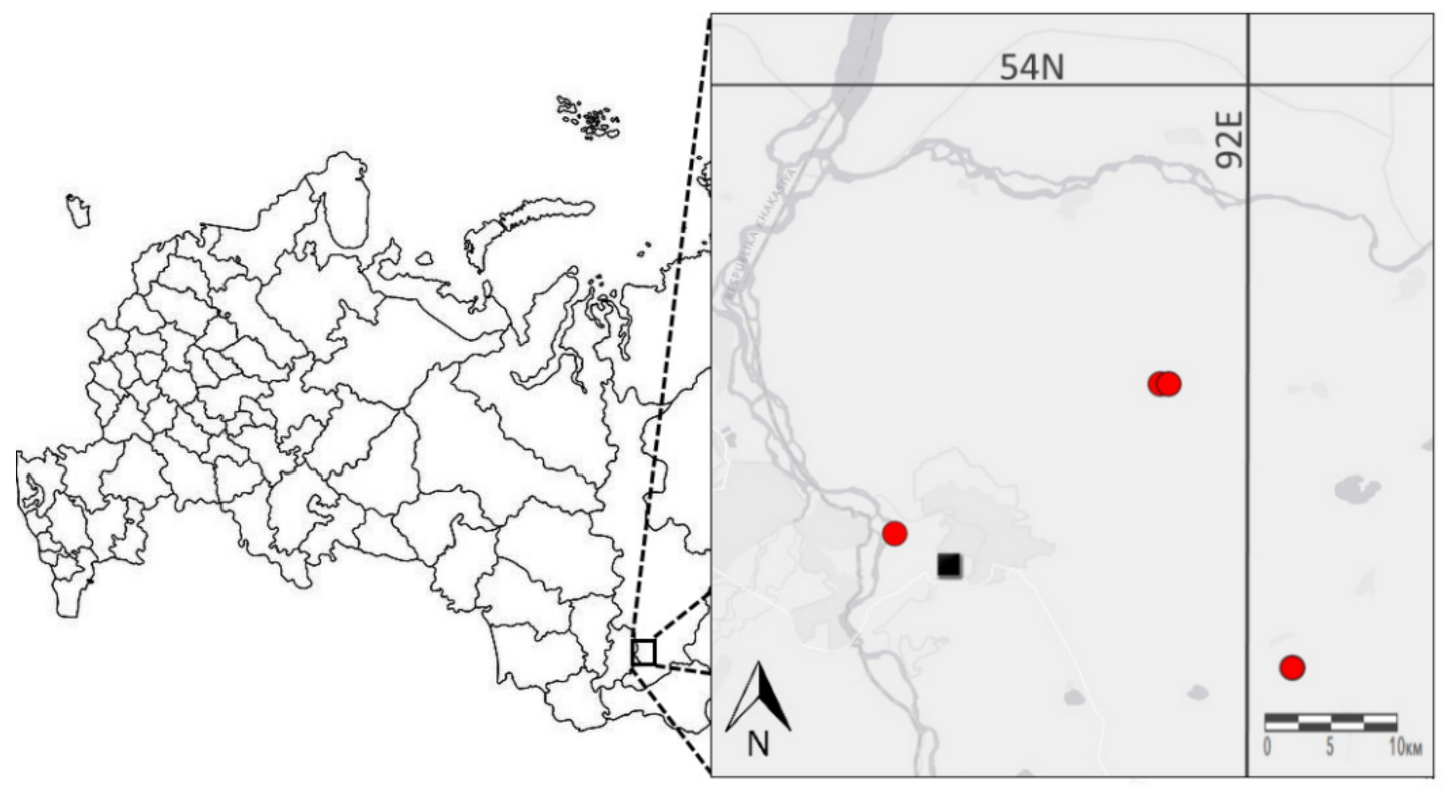
We tested the new model using tree-ring data obtained from 194 Scots pine (Pinus sylvestris) trees growing in homogeneous cold semi-arid conditions in the Khakassia region of Southern Siberia (see the dendrochronological analysis in detail [45,52,53]). The cores of living pine trees were taken from four sites at a distance of up to 25 km from the meteorological station “Minusinsk” 53°41′ N, 91°40′ E, 250 m.a.s.l.): “Malaya Minusa” (310 m.a.s.l.), “Taraska” (360 m.a.s.l.), “Malaya Nichka” (370 m.a.s.l.), and “Zeleniy Shum” (Z, 310 m.a.s.l.) (Figure 3). The tree-ring growth of trees for a study area is well synchronized (Table 1). The four local chronologies are characterized by a common response to climatic factors [54,55], so we combined them into a single regional chronology.
The collection, processing, and analysis of the tree-ring samples were carried out according to the standard procedures in dendrochronology [51]. The tree-ring width (TRW) measurements were made on a LINTAB 5 measuring device using the TSAP Win software (Version 4.xx, Rinntech, Heidelberg, Germany). The crossdating of the samples was verified using the COFECHA program. The standardization of individual series of TRW was carried out in two stages using the ARSTAN program [56]. At the first stage, the age trend was removed using negative exponential curve fitting [56].
In the second stage, the autocorrelation component was removed. Finally, the individual index series were averaged using the weighted average method, as a result of which a residual regional chronology was obtained [51].

2.5. Parameterization of VS-Model for the Simulation of External Rates

The simulation of the TRW indices using the visual tool of the VS-model parameterization—VS-Oscilloscope [35,41,45,57] was carried out on climatic data for the interval 1937−2013. To obtain optimal values of the model parameters (the best fit of the simulated values of tree growth with direct measurements of the TRW), the time interval 1937−2013 was divided into two independent sub-periods: the period of model parameters estimation–calibration (1970−2013), and the period of model testing–verification (1937−1969) (see SM, Figure S1). The accuracy of the model was established based on the following criteria: (a) the root-mean-square error (RMSE) between the simulated results and the direct measurements was minimized; (b) Pearson’s correlation was significant (at least p < 0.05); (c) Gleichläufigkeit (GLK), that is, synchronicity coefficient, was not less than 70% [58]. At the same time, the values of the model parameters should not contradict the nature of the known physical and biological processes associated with the growth of trees for a given region [45].

3. Results

3.1. Estimation of the Integral Growth Rate Vext

Parameterization of the VS-model based on the VS-Oscilloscope provided the best fit between direct measurements and simulated TRW indices (see SM, Tables S2 and S3). For the calibration period (1970−2013), the Pearson correlation coefficient was R = 0.82 (p < 0.0001; n = 44), synchronicity coefficient GLK = 90%, Root Mean Squared Error RMSE = 0.14 and Mean Squared Error MSE = 0.022 (see SM, Table S1 and Figure S1). For the verification period, the following statistics were obtained: R = 0.68 (p < 0.0001; n = 33), GLK = 72%, RMSE = 0.14 and MSE = 0.023 (see SM, Table S2 and Figure S1). Based on the VS-parameterization, the daily values of the integral growth rate Vext as well as SoS and EoS were obtained for each growing season (see SM, Figures S2 and S3) and then used in the band model of cambium.

3.2. Analysis of Cambium Activity Simulations for Synthetic Trees

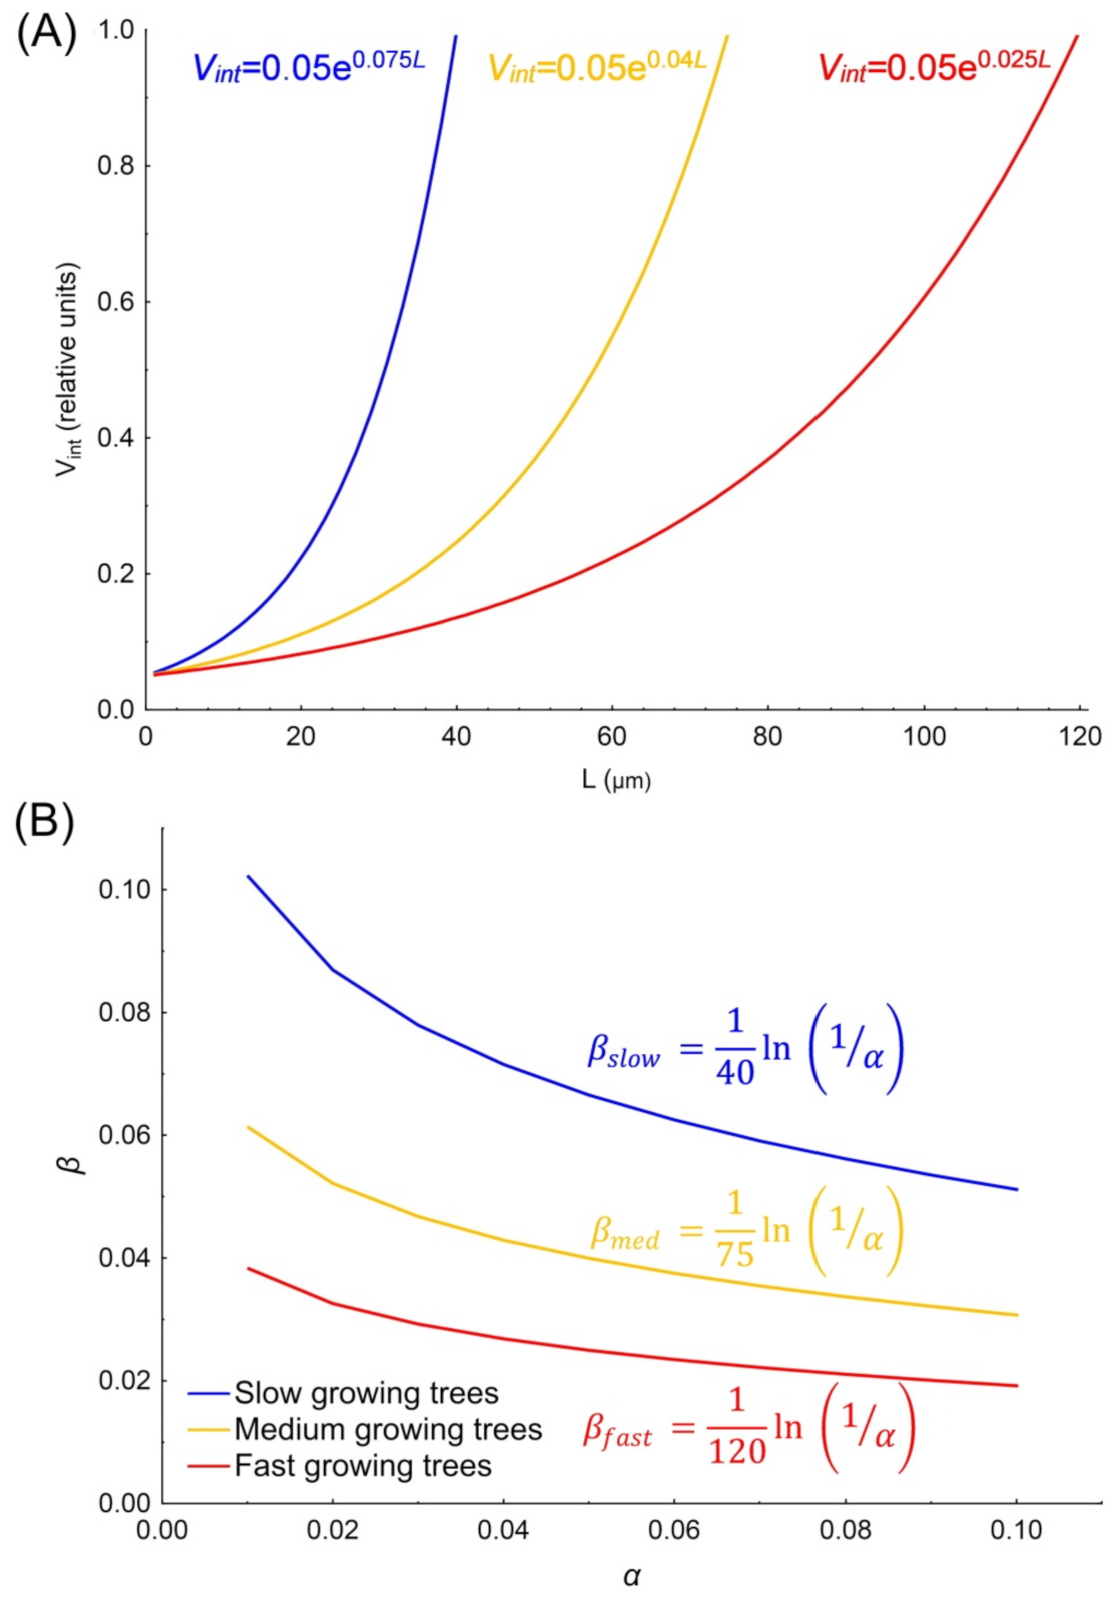
We analyzed slow-growing, medium-growing, and fast-growing “synthetic” trees that are characterized by the same duration of the initial cell cycle, but different specific growth rate of the cambial band. The duration of the initial cell cycle is equal to 20 days (which then corresponds to α = 20−1 = 0.05) for all trees, but the specific growth rate β is different: 0.075 for the slow; 0.040 for the medium and 0.025 for the fast-growing trees.
Figure 4A shows examples of variability in the internal growth rate of the cambial band for three types of synthetic trees under ideal growth conditions when there is no growth limitation by external factors, i.e., Vext = Vint = 1 (optimal growing conditions). The values L of the cambial band are 40, 75, and 120 µm, respectively, with a maximum external growth rate Vext = 1.0. The dependence of the specific growth rate β on the duration of the initial cell cycle α (with a linear decrease of α from 0.02 to 0.1 with a step of 0.01) under optimal (or “ideal”) growth conditions (Vext = 1.0) is non-linear (Figure 4B).
These observations indicate that in order to maintain the production of cells with different growth rates (slow-, medium- and fast-growing), the rate of cell division decreases the specific rate of cambial enlargement (Figure 4B). That is, the faster the initial cell divides, the slower divisions of the mother cells in the cambial zone will be in order to provide the same production. Formally, this can be attributed to the compensatory mechanism for regulating the growth of cambial tape.
Let us consider how the abiotic (climatic) limitations, which can be estimated by the environmental (external) block of the VS-model, affect the increment of the cambial tape. Table 2 shows simulations of increment ΔL for the three types of synthetic trees discussed above, but with different levels of external growth rate, Vext With decreasing external growth rates, ΔL decreases nonlinearly for all types of trees, i.e., for Vext = 0.5 it decreases more than two times relative to the optimal growth conditions (Vext = 1), but in the case of Vext = 0.1 ΔL drops sharply, by 20 times.
By setting the size and then calculating the growth dependent on the external growth rate using the cambial band, with a certain degree of confidence it is possible to estimate the number of cells that appeared in the enlargement zone during the growing season. Thus, assuming that cells in the cambial zone divide and double in size (i.e., the critical size of a cambial cell in mitosis phase is 10 μm on average [27]), it can be estimated that the number of cells in the cambial zone for the three types (i.e., slow-, medium- and fast-growing trees) are 4 (40 μm of cambial width), 7.5 (75 μm), and 12 (120 μm), respectively. Likewise, it is possible to estimate the production of slow-, medium- and fast-growing rings per time unit in the cells in the enlargement zone. For example, with an external growth rate of 0.6, production per unit of time is 0.7, 1.4 and 2.2 cells for slow-, medium- and fast-growing rings, respectively (Table 2, column 5).

3.3. Model Testing in Cold Semi-Arid Southern Siberia

Figure 5 shows the smoothed integral growth rates Vext(t) (see SM, Figure S2) for two years (1965 and 1986) which differ significantly due to moisture conditions for the study area. The total amount of seasonal precipitation in 1986 was greater than in 1965, resulting in higher growth rates in moist 1986 than in dry 1965.
The simulations of seasonal cell production are obtained by the three day time unit for calculating ΔL and 3three day average Vext as a threshold for Vint, which were consequently applied over the growing seasons of the selected years (from respective SoS to EoS, Figure S3).
Based on the actual tree-ring measurements of the 194 trees in the study area, slow-, medium- and fast-growing trees produced on average 9 (24), 17 (46), and 28 (71) cells, or 93 (244), 169 (459), and 279 (709) μm in absolute values of radial increment, for the years 1965 (1986), respectively. Estimated SoS was 129 and 138 days, respectively, for1965 and 1986, while respective EoS was 271 and 278 (see SM, Figure S3).
The three day interval was taken as the time unit based on a computational experiment to minimize the discrepancies between the model cumulative production and observed linear production for the growing season obtained for the three groups of trees.
The results of estimating the production of cambium per season (in linear dimensions ΔL) for slow-, medium-, and fast-growing trees are shown in Figure 6. It becomes obvious that seasonal absolute increments differ for both the three types of rings (trees) as well as for the years. Following the assumption that the radial size of new cells in the enlargement zone is on average 10 μm [27], for slow-growing rings the cumulative increment will be 90 and 240 μm, or 9 and 24 cells for 1965 and 1986, respectively; 17 and 45 cells for medium-growing; and 27 and 72 cells for fast-growing trees (Figure 6A,B), which is very close to the observed production of average trees for each group and selected years. It is therefore possible to make a simple transformation from relative to absolute values of tree-ring production.
An example of such a transformation is shown in Figure 7. The simulated relative tree-ring growth is calculated over 1937−2012 based on the integral seasonal growth rates by VS-oscilloscope (Figure 7A).
Figure 7B shows the estimates of the cumulative absolute increments in the enlargement zone for slow-, medium- and fast-growing trees over the years 1960 to 1990, with the assumptions that: (1) The trees are identical to the mean “site” tree but differ by in internal growth vigor; and (2) There is a strong relationship between tree-ring width and seasonal cell production [27,40].

3.4. Long-Term Estimation of Cell Production and Respective Tree-Ring Width for Individual Trees

Two pine trees, Ma10 (1925−2012) and Ma13 (1930−2012), have a similar cambial age but significantly different levels of annual absolute growth for both tree-ring width (TRW) (Figure 8A) and cumulative (or seasonal) cell production (CP) (Figure 8B). After 40 years, both trees reached almost constant growth rates, but the two-fold size difference remains throughout 1970−2012, i.e., average TRW is 2.24 mm and mean number of formed cells - 63.3 for a medium-growing tree such as Ma13, and 1.01 mm and 28.6 for a slow-growing tree such as Ma10.
Based on the actual tree-ring width (TRW) and cumulative (or seasonal) cell production (CP) for both trees it was shown that TRW is perfectly interpolated by the exponential function of CP (Figure 8C,D). For Ma13 the explained TRW variance is 97% by CP, and for the slow-growing tree Ma10 it is 92%.
Following the two-step procedure, the β values were estimated for a slow-growing tree by the following regression tested by cross-validation procedure (Table S4a,b) and residual analysis (Figure S4):
β ( y ) = 0.210 + 0.090 V e x t ( y ) 0.004 T r e n d C P ( y )
This regression explains 43% of βideal variability by common climate signal and age-dependent trend (Figure 9A).
For the medium-growing tree the following regression (see Table S5a,b and Figure S5) was used:
β ( y ) = 0.086 + 0.051 V e x t ( y ) 0.001 T r e n d C P ( y )
which explains 75% of theoretical βideal variability by common climate signal and age-dependent exponentially fitted trend in cell production (Figure 9B).
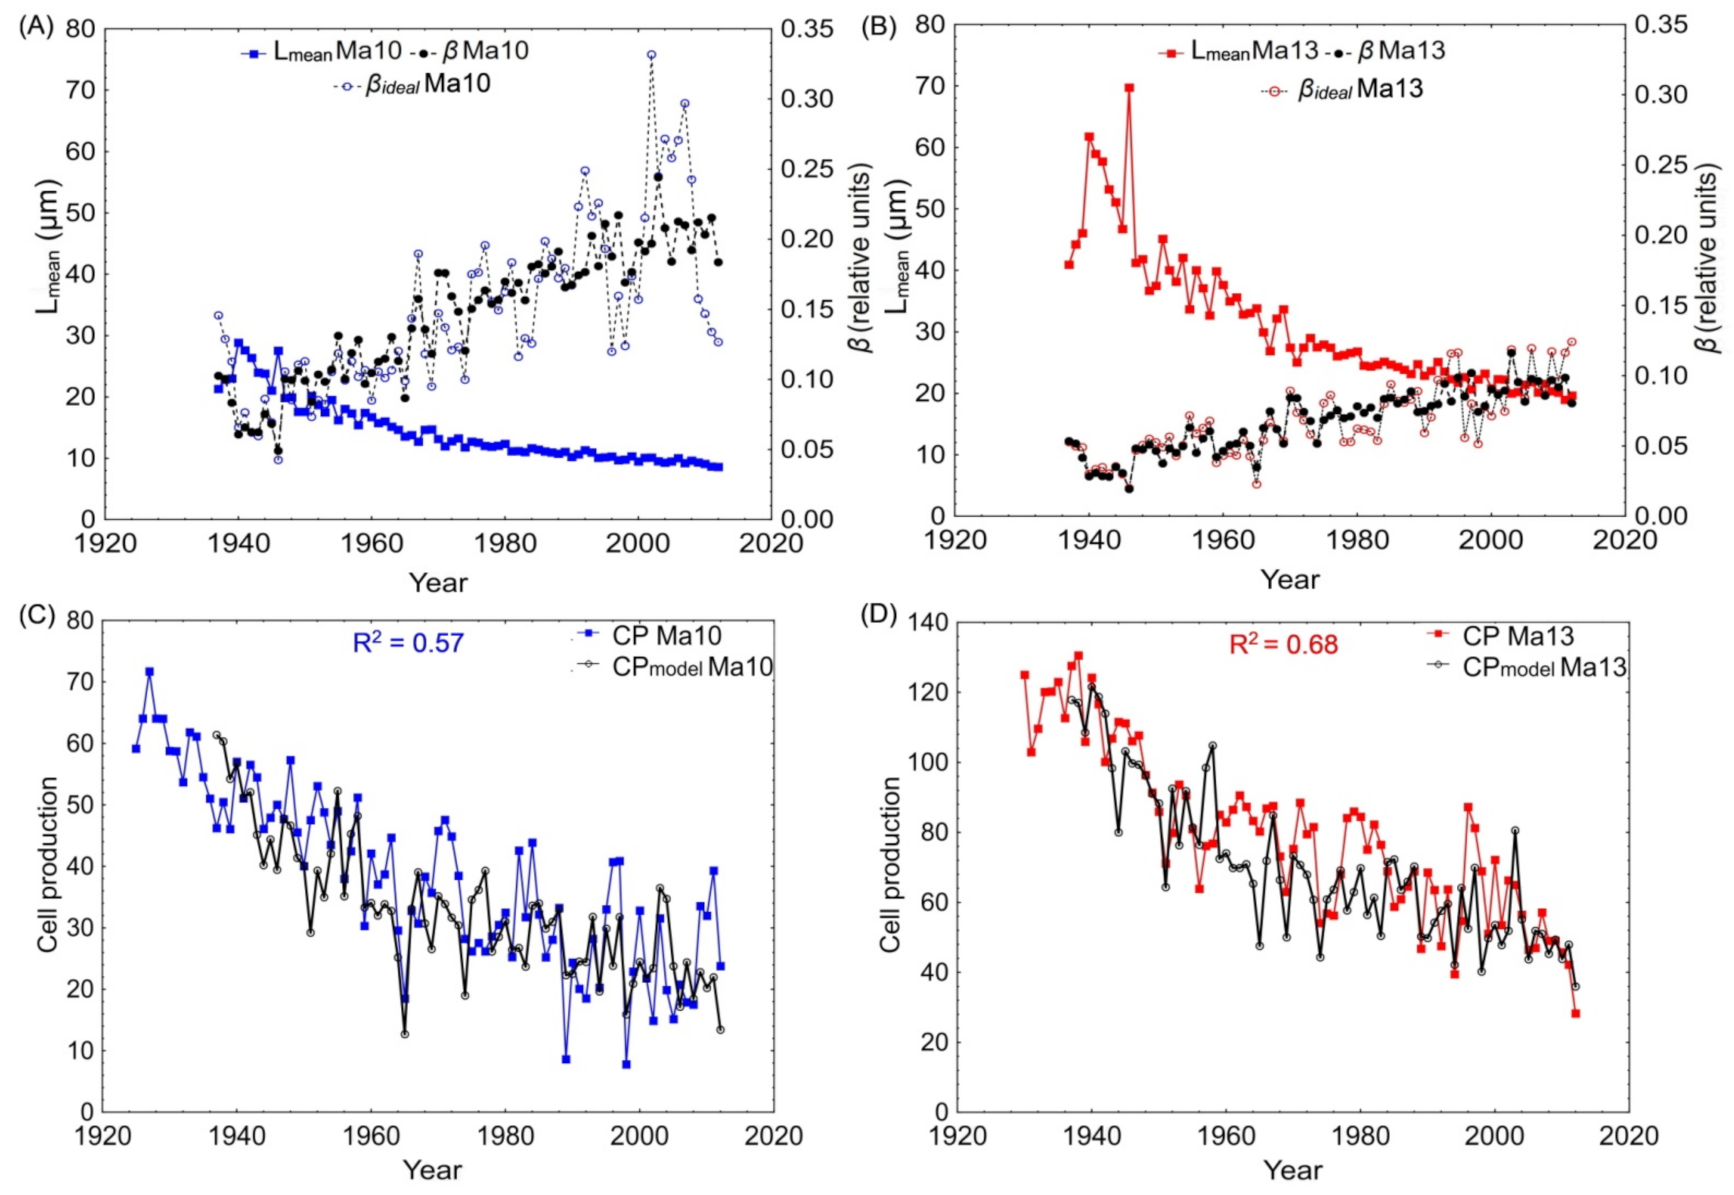
With a constant value of α (0.05) and obtained annual estimations of β, the application of the band model shows a good match between observed and simulated long-term seasonal cell production, i.e., the R2 between the actual cell production and the model estimation was 75% for the medium-growing tree and 64% for the slow-growing tree, respectively (Figure 9C,D).
A mean length of cambium zone (Lmean) decreases with the age of both trees; vice versa, the specific growth rate of the cambial zone β increases over 1937−2012 (Figure 9A,B).
Finally, using formula (3) and estimated exponents (Figure 8C,D) we transformed the seasonal cell production into tree-ring width for both trees (Figure 10A,B). The used approach shows a good match between simulated and observed TRW for both trees (65%–75% of explained variance over 1937–2012).

4. Discussion

Our new cambial band model significantly simplifies both the assessment of seasonal cell production (the number of new cells formed) and the absolute tree-ring increment in the tree-rings. In contrast to the kinetic model of cambium used in the traditional VS-model [27], the new version does not require determination of the positions of new mother cells in the cambium relative to the initial cell, their number during the growing season, or their division rate based on complex calculations and a time-consuming estimation of the 12 cambial block parameters [39,43]. In the band model the entire process of seasonal functioning of the cambium is based on a simple exponential function which can be specified for any individual tree for the study stand. By itself, the exponent used in the model has certain biological and physical interpretations which are well suited to describing different observed growth processes controlling the formation of annual tree rings [2,24,27]. As a result, the number of parameters for the cambial block of the VS-model can be significantly reduced: from 12 parameters in the standard version to three in the new version, which should lead to better statistical robustness and interpretability of the simulation results themselves.
The new model was successfully applied to restore long-term cell production and an absolute tree-ring increment for individual trees of a similar cambial age but significantly different levels of annual absolute growth under the same climatic forcing. This is another advantage of the band model of cambial development compared to the kinetic model of cambium in the VS-model (Figure 1, Cambial block), where the simulated cambial activity is applicable for mean (“typical” or “average”) trees experiencing environmental conditions at a site [27,40].
The simplified algorithm of the cambium band model is based on a number of experimental data that show the strong relationship between cells both in the cambium and enlargement zones by plasmodesmata [59,60,61,62,63,64]. Requiring the same specific rate of growth for adjacent cell rows ensures the functioning of plasmodesmata, especially in the primary cell wall, as it prevents the displacement of adjacent cell rows relative to each other. It is the plasmodesmata, as channels that ensure the exchange of proteins and short RNAs, that support intercellular communication and the functional integrity of the cambial zone [64,65]. The rigidity of connectivity in the growth of adjacent rows of cells is especially important in the formation of a pit network connecting cells in the rows, especially in the earlywood of conifers [47]. It is recorded in [64] that “notably, most of the PD (plasmodemates) deployed in the cambial zone arise by modification of existing PD and extensive insertion of secondary PD [66]. The authors describe four phases of PD development in tangential walls beginning with PD connecting the xylem and phloem initials and ending with PD connecting mature vascular cells”. The relationship between pits and plasmodesmata is analyzed in details in several experimental works [67,68].
The advantage of this new model is that with a minimum of specified parameters, it allows us to calculate the seasonal production of the cambial zone in absolute values (the absolute radial increment of enlargement zone or the number of cells). Thus, the limitations of the cambial block in the standard VS-model are largely removed. This means that the transition into the enlargement zone can be simply specified by the following rule: if the simulated linear increment at a time t reaches 10 μm (the accepted average cell size in the cambial zone), then it corresponds to the transition of the border cell into the enlargement zone. In such a transition, the exponential pattern of cell growth is not impaired and the connectivity of adjacent rows of cells is preserved.
Also noteworthy is the strong inverse relationship between the specific growth rate and the linear size of the cambial zone, demonstrated by calculations for trees with different growth vigor. For fast-growing trees with wide rings and wide cambial bands, the specific growth rate is lower on average. The decrease in the specific rate is significantly compensated by the increase of the cambial zone linear size. On the one hand, this effect can also have a biological explanation; in the case of a large number of cells in the cambium, a high specific rate can be particularly sensitive to internal and external factors including those of a non-climatic nature, which makes it easy to disrupt the connectivity between adjacent cell rows in the cambial zone and, as a result, leads to anatomical abnormalities in the xylem structure (as an example, frost rings [69,70,71]). On the other hand, carbohydrates from photosynthetic organs, as the main source of new cells, are distributed over a larger number of dividing cells, which can cause a lower specific lengthening of individual rows. An interesting hypothesis about competition for carbohydrates during the maturation of tracheids is presented in [72].
Despite having different absolute cell numbers, for slow-, medium- and fast-growing trees in the same stand the final cell production of each year is still affected by the same external conditions. Nonetheless, an individual tree can be influenced by different local factors that may lead to changes in the three basic parameters of the model (e.g., Figure 9A,B). As an example, in this work it was shown that the specific growth rate β can be linear, estimated by two factors: internal (individual age-related trend) and external (common climate signal). Whether these factors have internal or external causes is the object of further research. For example, the relationship between the initial and the specific growth rate could be species-specific. The influence of conditions at the beginning of the growing season is one of the obvious external factors which define the formation and functioning of actively dividing cells in a cambial zone. This aspect will also be considered in further research. A tree age-dependent effect on actively dividing cells in the cambium zone is a complex problem which requires massive wood-anatomical data for different tree species and forest stands. One of the research topics for the near future is an analysis of dependencies between the timing of new cells in an enlargement zone and their final sizes. Resolving these issues can help to better understand the process of ring formation under forcing of external or internal factors using the band model of cambium development.
Finally, the new model, using a minimum amount of information on habitat and tree growth, can be tested for other tree species and other locations for effective estimation of the long-term cell production of individual trees. This individual level of model performance will undoubtedly improve the integrated estimates of stem wood stocks under ongoing and future climate change on both the local and global scales.

Supplementary Materials

The following are available online at https://www.mdpi.com/article/10.3390/f12101361/s1, Figure S1. Initial tree-ring width indices (red curve) and simulated tree-ring width indices (blue curve) for period 1937–2012, Figure S2. Average daily values of growth rates for the period 1937–2012: partial growth rate from soil moisture VW (blue curve), partial growth rate from temperature VT (red curve), integral growth rate Vext (black curve); vertical lines–95%-confidence intervals, Figure S3. The SoS (blue circles) and the EoS (red rectangulars) for period 1937–2012 obtained by the VS-model, Figure S4. Residual and expected Gaussian distribution (A); normal P-plot of expected Gaussian values to residuals (B); time variation (C) and Whiskers boxplot (D) obtained for β estimation of slow-growing tree Ma10 using regression approach, Figure S5. Residual and expected Gaussian distribution (A); normal P-plot of expected Gaussian values to residuals (B); time variation (C) and Whiskers boxplot (D) obtained for β estimation of fast-growing tree Ma13 using regression approach, Table S1. Comparison of theoretical basics between the kynetic model of cambium and the band model of cambium development, Table S2. Statistics between the actual tree-ring chronology and simulated over periods calibration (1970–2012) and verification (1937–1969), Table S3. Estimated VS-model parameters by the VS-oscilloscope. Table S4a. Cross-validation assessments at different periods of multiple regression β from normalized annual cumula-tive Vext and aged-depended trend in cell production TrendCP for tree Ma10, Table S4b. Regression coefficients and statistics of multiple regression β from normalized annual cumulative Vext and aged-depended trend in cell production TrendCP for tree Ma10, Table S5a. Cross-validation assessments at different periods of multiple regression β from normalized annual cumulative Vext and age-depended trend in cell production TrendCP for tree Ma13, Table S5b. Regression coefficients and statistics of multiple regression β from normalized annual cumulative Vext and aged-depended trend in cell production TrendCP for tree Ma13, Table S6. Calibration and verification of multiple regression equation for trees Ma10 and Ma13.

Author Contributions

Conceptualization, V.V.S. and E.A.V.; Methodology, K.J.A., V.V.S. and E.A.V.; Software, I.I.T. and G.K.Z.; Model calibration and validation, V.V.S., I.I.T., G.K.Z.; Data curation, E.A.V. and I.I.T.; Data analysis, V.V.S., K.J.A., E.A.V. and I.I.T.; Writing—original draft preparation V.V.S., K.J.A., E.A.V., I.I.T.; Writing—review and editing, V.V.S. and I.I.T.; Project administration V.V.S.; Funding acquisition, E.A.V. All authors have read and agreed to the published version of the manuscript.

Funding

The work was supported by the RFBR project#19-04-00274A and Minobrnauki project #FSRZ-2020-0010 (methodology, model development; data measurements). V.V.S. appreciates the support of Russian Science Foundation (project #18-14-00072P, software development; model calibration and validation) and the ERC project MONOSTAR (AdG 882727; data analysis).

Institutional Review Board Statement

Not applicable.

Informed Consent Statement

Not applicable.

Data Availability Statement

The code of the band model of cambium activity and supported files are available by the GitHub link: https://github.com/SkailOver/The-band-model-of-cambium-development accessed on 6 September 2021.

Acknowledgments

V.V.S. is personally grateful to Olga V. Kuznetsova for the manuscript proofreading.

Conflicts of Interest

The authors declare no conflict of interest.

References

  1. Chavchavadze, E.S. Drevesina Khvoynykh: Morfologicheskie Osobennosti, Diagnosticheskoe Znachenie. In Wood of Coniferous Plants: Morphological Traits, Diagnostic Value; Nauka: St. Petersburg, Russia, 1979. (In Russian) [Google Scholar]
  2. Larson, P.R. The Vascular Cambium: Development and Structure; Springer Science & Business Media: Berlin/Heidelberg, Germany, 2012. [Google Scholar]
  3. Lanner, R.M.; Connor, K.F. Does bristlecone pine senesce? Exp. Gerontol. 2001, 36, 675–685. [Google Scholar] [CrossRef]
  4. Lanner, R.M. Why do trees live so long? Ageing Res. Rev. 2002, 1, 653–671. [Google Scholar] [CrossRef]
  5. Rossi, S.; Deslauriers, A.; Anfodillo, T.; Carrer, M. Age-dependent xylogenesis in timberline conifers. New Phytol. 2008, 177, 199–208. [Google Scholar] [CrossRef] [PubMed]
  6. Bhalerao, R.P.; Fischer, U. Environmental and hormonal control of cambial stem cell dynamics. J. Exp. Bot. 2017, 68, 79–87. [Google Scholar] [CrossRef]
  7. Fischer, U.; Kucukoglu, M.; Helariutta, Y.; Bhalerao, R.P. The dynamics of cambial stem cell activity. Annu. Rev. Plant Biol. 2019, 70, 293–319. [Google Scholar] [CrossRef] [Green Version]
  8. Su, Y.H.; Liu, Y.B.; Zhang, X.S. Auxin-cytokinin interaction regulates meristem development. Mol. Plant 2011, 4, 616–625. [Google Scholar] [CrossRef]
  9. Schaller, G.E.; Bishopp, A.; Kieber, J.J. The Yin-Yang of hormones: Cytokinin and auxin interactions in plant development. Plant Cell 2015, 27, 44–63. [Google Scholar] [CrossRef] [Green Version]
  10. Immanen, J.; Nieminen, K.; Smolander, O.-P.; Kojima, M.; Serra, J.A.; Koskinen, P.; Zhang, J.; Elo, A.; Mahonen, A.P.; Street, N.; et al. Cytokinin and auxin display distinct but interconnected distribution and signaling profiles to stimulate cambial activity. Curr. Biol. 2016, 26, 1990–1997. [Google Scholar] [CrossRef] [Green Version]
  11. Sang, Y.L.; Cheng, Z.J.; Zhang, X.S. Plant stem cells and de novo organogenesis. New Phytol. 2018, 218, 1334–1339. [Google Scholar] [CrossRef] [Green Version]
  12. Chen, J.J.; Wang, L.Y.; Immanen, J.; Nieminen, K.; Spicer, R.; Helariutta, Y.; Zhang, J.; He, X.Q. Differential regulation of auxin and cytokinin during the secondary vascular tissue regeneration in Populus trees. New Phytol. 2019, 224, 188–201. [Google Scholar] [CrossRef]
  13. Butto, V.; Deslauriers, A.; Rossi, S.; Rozenberg, P.; Shishov, V.; Morin, H. The role of plant hormones in tree-ring formation. Trees-Struct. Funct. 2020, 34, 315–335. [Google Scholar] [CrossRef]
  14. Uggla, C.; Mellerowicz, E.J.; Sundberg, B. Indole-3-acetic acid controls cambial growth in Scots pine by positional signaling. Plant Physiol. 1998, 117, 113–121. [Google Scholar] [CrossRef] [PubMed] [Green Version]
  15. Uggla, C.; Magel, E.; Moritz, T.; Sundberg, B. Function and dynamics of auxin and carbohydrates during earlywood/latewood transition in Scots pine. Plant Physiol. 2001, 125, 2029–2039. [Google Scholar] [CrossRef] [PubMed] [Green Version]
  16. Perrot-Rechenmann, C. Cellular responses to auxin: Division versus expansion. Cold Spring Harb. Perspect. Biol. 2010, 2. [Google Scholar] [CrossRef]
  17. Brackmann, K.; Qi, J.Y.; Gebert, M.; Jouannet, V.; Schlamp, T.; Grunwald, K.; Wallner, E.S.; Novikova, D.D.; Levitsky, V.G.; Agusti, J.; et al. Spatial specificity of auxin responses coordinates wood formation. Nat. Commun. 2018, 9, 15. [Google Scholar] [CrossRef] [Green Version]
  18. Schrader, J.; Nilsson, J.; Mellerowicz, E.; Berglund, A.; Nilsson, P.; Hertzberg, M.; Sandberg, G. A high-resolution transcript profile across the wood-forming meristem of poplar identifies potential regulators of cambial stem cell identity. Plant Cell 2004, 16, 2278–2292. [Google Scholar] [CrossRef] [Green Version]
  19. Nieminen, K.; Immanen, J.; Laxell, M.; Kauppinen, L.; Tarkowski, P.; Dolezal, K.; Tahtiharju, S.; Elo, A.; Decourteix, M.; Ljung, K.; et al. Cytokinin signaling regulates cambial development in poplar. Proc. Natl. Acad. Sci. USA 2008, 105, 20032–20037. [Google Scholar] [CrossRef] [Green Version]
  20. Tank, J.G.; Thaker, V.S. Cyclin dependent kinases and their role in regulation of plant cell cycle. Biol. Plant. 2011, 55, 201–212. [Google Scholar] [CrossRef]
  21. Komaki, S.; Sugimoto, K. Control of the plant cell cycle by developmental and environmental cues. Plant Cell Physiol. 2012, 53, 953–964. [Google Scholar] [CrossRef] [Green Version]
  22. Campbell, L.; Turner, S. Regulation of vascular cell division. J. Exp. Bot. 2017, 68, 27–43. [Google Scholar] [CrossRef] [Green Version]
  23. Hartmann, F.P.; Rathgeber, C.B.K.; Fournier, M.; Moulia, B. Modelling wood formation and structure: Power and limits of a morphogenetic gradient in controlling xylem cell proliferation and growth. Ann. For. Sci. 2017, 74. [Google Scholar] [CrossRef] [Green Version]
  24. Bossinger, G.; Spokevicius, A.V. Sector analysis reveals patterns of cambium differentiation in poplar stems. J. Exp. Bot. 2018, 69, 4339–4348. [Google Scholar] [CrossRef] [PubMed] [Green Version]
  25. Luck, J.; Barlow, P.W.; Luck, H.B. Deterministic patterns of cellular growth and division within a meristem. Ann. Bot. 1994, 73, 1–11. [Google Scholar] [CrossRef]
  26. Deleuze, C.; Houllier, F. A simple process-based xylem growth model for describing wood microdensitometric profiles. J. Theor. Biol. 1998, 193, 99–113. [Google Scholar] [CrossRef]
  27. Vaganov, E.A.; Hughes, M.K.; Shashkin, A.V. Growth Dynamics of Conifer Tree Rings: Images of Past and Future Environments; Springer: Berlin/Heidelberg, Germany, 2006. [Google Scholar]
  28. Hartmann, F.P.; Rathgeber, C.B.K.; Badel, E.; Fournier, M.; Moulia, B. Modelling the spatial crosstalk between two biochemical signals explains wood formation dynamics and tree-ring structure. J. Exp. Bot. 2020. [Google Scholar] [CrossRef]
  29. Rathgeber, C.B.K.; Rossi, S.; Bontemps, J.D. Cambial activity related to tree size in a mature silver-fir plantation. Ann. Bot. 2011, 108, 429–438. [Google Scholar] [CrossRef] [Green Version]
  30. Cuny, H.E.; Rathgeber, C.B.K.; Kiesse, T.S.; Hartmann, F.P.; Barbeito, I.; Fournier, M. Generalized additive models reveal the intrinsic complexity of wood formation dynamics. J. Exp. Bot. 2013, 64, 1983–1994. [Google Scholar] [CrossRef] [PubMed] [Green Version]
  31. Rossi, S.; Morin, H.; Deslauriers, A. Causes and correlations in cambium phenology: Towards an integrated framework of xylogenesis. J. Exp. Bot. 2012, 63, 2117–2126. [Google Scholar] [CrossRef] [PubMed] [Green Version]
  32. Babushkina, E.A.; Zhirnova, D.E.; Belokopytova, L.V.; Tychkov, I.I.; Vaganov, E.A.; Krutovsky, K.V. Response of four tree species to changing climate in a moisture-limited area of South Siberia. Forests 2019, 10, 999. [Google Scholar] [CrossRef] [Green Version]
  33. Fonti, M.V.; Fakhrutdinova, V.V.; Kalinina, E.V.; Tychkov, I.I.; Popkova, M.I.; Shishov, V.V.; Nikolaev, A.N. Long-term variability of anatomic features of annual tree rings of larch, pine and spruce in the permafrost zone in central Siberia. Contemp. Probl. Ecol. 2019, 12, 692–702. [Google Scholar] [CrossRef]
  34. Fonti, M.V.; Babushkina, E.A.; Zhirnova, D.F.; Vaganov, E.A. Xylogenesis of scots pine in an uneven-aged stand of the Minusinsk Depression (Southern Siberia). J. Sib. Fed. Univ. Biol. 2020, 13, 197–207. [Google Scholar] [CrossRef]
  35. Butto, V.; Shishov, V.; Tychkov, I.; Popkova, M.; He, M.H.; Rossi, S.; Deslauriers, A.; Morin, H. Comparing the cell dynamics of tree-ring formation observed in microcores and as predicted by the Vaganov-Shashkin model. Front. Plant Sci. 2020, 11, 16. [Google Scholar] [CrossRef]
  36. Popkova, M.I.; Shishov, V.V.; Vaganov, E.A.; Fonti, M.V.; Kirdyanov, A.V.; Babushkina, E.A.; Huang, J.G.; Rossi, S. Contribution of xylem anatomy to tree-ring width of two larch species in permafrost and non-permafrost zones of Siberia. Forests 2020, 11, 1343. [Google Scholar] [CrossRef]
  37. Evans, M.N.; Reichert, B.K.; Kaplan, A.; Anchukaitis, K.J.; Vaganov, E.A.; Hughes, M.K.; Cane, M.A. A forward modeling approach to paleoclimatic interpretation of tree-ring data. J. Geophys. Res.-Biogeosci. 2006, 111. [Google Scholar] [CrossRef]
  38. Anchukaitis, K.J.; Evans, M.N.; Kaplan, A.; Vaganov, E.A.; Hughes, M.K.; Grissino-Mayer, H.D.; Cane, M.A. Forward modeling of regional scale tree-ring patterns in the southeastern United States and the recent influence of summer drought. Geophys. Res. Lett. 2006, 33, 4. [Google Scholar] [CrossRef]
  39. Anchukaitis, K.J.; Evans, M.N.; Hughes, M.K.; Vaganov, E.A. An interpreted language implementation of the Vaganov-Shashkin tree-ring proxy system model. Dendrochronologia 2020, 60. [Google Scholar] [CrossRef] [Green Version]
  40. Vaganov, E.A.; Anchukaitis, K.J.; Evans, M.N. How well understood are the processes that create dendroclimatic records? A mechanistic model of the climatic control on conifer tree-ring growth dynamics. Dendroclimatol. Prog. Prospect. 2011, 11, 37–75. [Google Scholar] [CrossRef]
  41. Shishov, V.V.; Tychkov, I.I.; Popkova, M.I.; Ilyin, V.A.; Bryukhanova, M.V.; Kirdyanov, A.V. VS-oscilloscope: A new tool to parameterize tree radial growth based on climate conditions. Dendrochronologia 2016, 39, 42–50. [Google Scholar] [CrossRef] [Green Version]
  42. Shishov, V.V.; Arzac, A.; Popkova, M.I.; Yang, B.; He, M.; Vaganov, E.A. “Experimental and theoretical analysis of tree-ring growth in cold climates,” in Boreal Forests in the Face of Climate Change-Sustainable Management. In Advances in Global Change Research; Girona, M., Gauthier, S., Morin, S., Bergeron, Y., Eds.; Springer: Berlin/Heidelberg, Germany, 2021; (Accepted to print). [Google Scholar]
  43. Tumajer, J.; Kaspar, J.; Kuzelova, H.; Shishov, V.V.; Tychkov, I.I.; Popkova, M.I.; Vaganov, E.A.; Treml, V. Forward modeling reveals multidecadal trends in cambial kinetics and phenology at treeline. Front. Plant Sci. 2021, 12, 14. [Google Scholar] [CrossRef] [PubMed]
  44. Popkova, M.I.; Vaganov, E.A.; Shishov, V.V.; Babushkina, E.A.; Rossi, S.; Fonti, M.V.; Fonti, P. Modeled tracheidograms disclose drought influence on Pinus sylvestris tree-rings structure from Siberian forest-steppe. Front. Plant Sci. 2018, 9. [Google Scholar] [CrossRef] [PubMed]
  45. Tychkov, I.I.; Sviderskaya, I.V.; Babushkina, E.A.; Popkova, M.I.; Vaganov, E.A.; Shishov, V.V. How can the parameterization of a process-based model help us understand real tree-ring growth? Trees-Struct. Funct. 2019, 33, 345–357. [Google Scholar] [CrossRef] [Green Version]
  46. Kirdyanov, A.V.; Krusic, P.J.; Shishov, V.V.; Vaganov, E.A.; Fertikov, A.I.; Myglan, V.S.; Barinov, V.V.; Browse, J.; Esper, J.; Ilyin, V.A.; et al. Ecological and conceptual consequences of Arctic pollution. Ecol. Lett. 2020, 23, 1827–1837. [Google Scholar] [CrossRef]
  47. Savidge, R.A. Cell biology of bordered-pit formation in balsam-fir trees. Botany 2014, 92, 495–511. [Google Scholar] [CrossRef]
  48. Cuny, H.E.; Rathgeber, C.B.K.; Frank, D.; Fonti, P.; Makinen, H.; Prislan, P.; Rossi, S.; del Castillo, E.M.; Campelo, F.; Vavrcik, H.; et al. Woody biomass production lags stem-girth increase by over one month in coniferous forests. Nat. Plants 2015, 1, 6. [Google Scholar] [CrossRef] [PubMed]
  49. Lupi, C.; Morin, H.; Deslauriers, A.; Rossi, S. Xylem phenology and wood production: Resolving the chicken-or-egg dilemma. Plant Cell Environ. 2010, 33, 1721–1730. [Google Scholar] [CrossRef] [PubMed]
  50. Rossi, S.; Morin, H.; Deslauriers, A.; Plourde, P.Y. Predicting xylem phenology in black spruce under climate warming. Glob. Chang. Biol. 2011, 17, 614–625. [Google Scholar] [CrossRef]
  51. Cook, E.R.; Kairiukstis, L.A. Methods of Dendrochronology: Applications in the Environmental Sciences; Kluwer Academic Publishers: Dordrecht, The Netherlands, 1990; Volume 23. [Google Scholar]
  52. Babushkina, E.A.; Vaganov, E.A.; Belokopytova, L.V.; Shishov, V.V.; Grachev, A.M. Competitive strength effect in the climate response of scots pine radial growth in south-central Siberia forest-steppe. Tree-Ring Res. 2015, 71, 106–117. [Google Scholar] [CrossRef]
  53. Shah, S.K.; Touchan, R.; Babushkina, E.; Shishov, V.V.; Meko, D.M.; Abramenko, O.V.; Belokopytova, L.V.; Hordo, M.; Jevsenak, J.; Kedziora, W.; et al. August to July precipitation from tree rings in the forest-steppe zone of central Siberia (Russia). Tree-Ring Res. 2015, 71, 37–44. [Google Scholar] [CrossRef]
  54. Magda, V.N.; Vaganov, E.A. Climatic response of tree growth in mountain forest-steppes of the Altai-Sayan region. Izv. RAN. Seriya Geogr. Proc. RAS. Geogr. Ser. 2006, 5, 92–100. (In Russian) [Google Scholar]
  55. Babushkina, E.A.; Knorre, A.A.; Vaganov, E.A.; Bryukhanova, M.V. Transformation of climatic response in radial increment of trees depending on topoecological conditions of their occurrence. Geogr. Nat. Resour. 2011, 32, 80. [Google Scholar] [CrossRef]
  56. Cook, E.R.; Krusic, P.J. Program Arstan: A Tree-Ring Standardization Program Based on Detrending and Autoregressive Time Series Modeling, with Interactive Graphics; Lamont-Doherty Earth Observatory, Columbia University: Palisades, NY, USA, 2005. [Google Scholar]
  57. Jevsenak, J.; Tychkov, I.; Gricar, J.; Levanic, T.; Tumajer, J.; Prislan, P.; Arnic, D.; Popkova, M.; Shishov, V.V. Growth-limiting factors and climate response variability in Norway spruce (Picea abiesL.) along an elevation and precipitation gradients in Slovenia. Int. J. Biometeorol. 2021, 65, 311–324. [Google Scholar] [CrossRef]
  58. Buras, A.; Wilmking, M. Correcting the calculation of Gleichlaufigkeit. Dendrochronologia 2015, 34, 29–30. [Google Scholar] [CrossRef]
  59. Ehlers, K.; Kollmann, R. Primary and secondary plasmodesmata: Structure, origin, and functioning. Protoplasma 2001, 216, 1–30. [Google Scholar] [CrossRef]
  60. Roberts, A.G.; Oparka, K.J. Plasmodesmata and the control of symplastic transport. Plant Cell Environ. 2003, 26, 103–124. [Google Scholar] [CrossRef] [Green Version]
  61. Lucas, W.J.; Lee, J.Y. Plant cell biology—Plasmodesmata as a supracellular control network in plants. Nat. Rev. Mol. Cell Biol. 2004, 5, 712–726. [Google Scholar] [CrossRef]
  62. Fuchs, M.; van Bel, A.J.E.; Ehlers, K. Season-associated modifications in symplasmic organization of the cambium in Populus nigra. Ann. Bot. 2010, 105, 375–387. [Google Scholar] [CrossRef] [PubMed] [Green Version]
  63. Wayne, R. (Ed.) Plasmodesmata. In Plant Cell Biology: From Astronomy to Zoology; Elsevier Science Bv: Amsterdam, The Netherlands, 2009; pp. 51–60. [Google Scholar]
  64. Burch-Smith, T.M.; Stonebloom, S.; Xu, M.; Zambryski, P.C. Plasmodesmata during development: Re-examination of the importance of primary, secondary, and branched plasmodesmata structure versus function. Protoplasma 2011, 248, 61–74. [Google Scholar] [CrossRef] [PubMed] [Green Version]
  65. Haywood, V.; Kragler, F.; Lucas, W.J. Plasmodesmata: Pathways for protein and ribonucleoprotein signaling. Plant Cell 2002, 14, S303–S325. [Google Scholar] [CrossRef] [PubMed] [Green Version]
  66. Ehlers, K.; van Bel, A.J.E. Dynamics of plasmodesmal connectivity in successive interfaces of the cambial zone. Planta 2010, 231, 371–385. [Google Scholar] [CrossRef]
  67. Barnett, J.R. Plasmodesmata and pit development in secondary xylem elements. Planta 1982, 155, 251–260. [Google Scholar] [CrossRef] [PubMed]
  68. Jansen, S.; Lamy, J.B.; Burlett, R.; Cochard, H.; Gasson, P.; Delzon, S. Plasmodesmatal pores in the torus of bordered pit membranes affect cavitation resistance of conifer xylem. Plant Cell Environ. 2012, 35, 1109–1120. [Google Scholar] [CrossRef] [PubMed]
  69. Lamarche, V.C.; Hirschboeck, K.K. Frost rings in trees as records of major volcanic-eruptions. Nature 1984, 307, 121–126. [Google Scholar] [CrossRef]
  70. Gurskaya, M.A.; Shiyatov, S.G. Distribution of frost injuries in the wood of conifers. Russ. J. Ecol. 2006, 37, 7–12. [Google Scholar] [CrossRef]
  71. Montwe, D.; Isaac-Renton, M.; Hamann, A.; Spiecker, H. Cold adaptation recorded in tree rings highlights risks associated with climate change and assisted migration. Nat. Commun. 2018, 9. [Google Scholar] [CrossRef] [Green Version]
  72. Carteni, F.; Deslauriers, A.; Rossi, S.; Morin, H.; De Micco, V.; Mazzoleni, S.; Giannino, F. The physiological mechanisms behind the earlywood-to-latewood transition: A process-based modeling approach. Front. Plant Sci. 2018, 9, 12. [Google Scholar] [CrossRef]
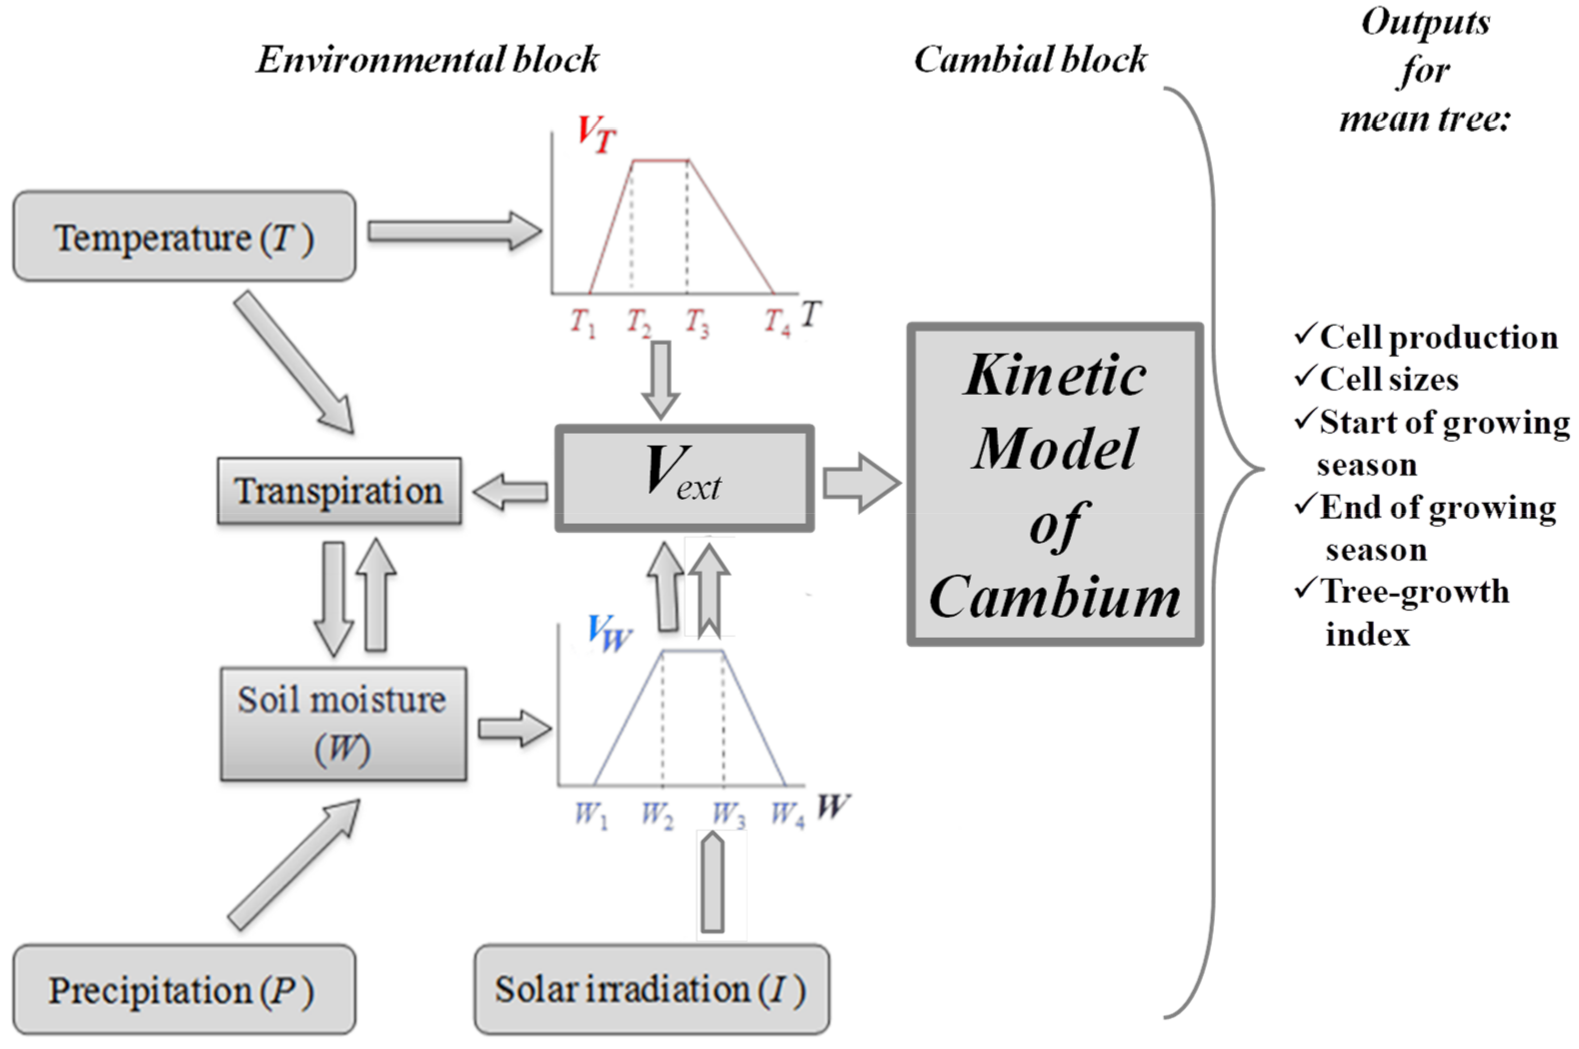
Figure 1. Flowchart of the VS-model algorithm consisting of environmental block, where Vext—integral growth rate and VI(t), VT(t), VW(t)—partial growth rates dependent on the solar irradiance (or day length) I, temperature T and soil moisture W, respectively; cambial block and model outputs.
Forests 12 01361 g001
Figure 2. Conceptual description of a new model block: cambium zone consisting of several adjacent rows of cambial cells (gradient blue color–faster growth in this case associated with the more saturated color), and the enlargement zone with an increment ΔL per unit time (green color) (Upper panel); width of cambial zone (gradient blue color) increased by ΔL (green color) with an exponential rate Vint, which characterizes the individual growth rate of the woody tissue (Low panel).
Forests 12 01361 g002
Figure 3. Location of the study sites (red circles) and the climatic station (black rectangle) in southern Siberia (Khakassia).
Forests 12 01361 g003
Figure 4. Dependence of the rate Vint on the length of the cambial zone L for slow- (β = 0.075; blue curve), medium- (β = 0.040; yellow curve), and fast-growing- (β = 0.025; red curve) annual rings at the same α = 0.05 in optimal growing conditions (i.e., Vext = Vint = 1) (A); Dependence of β on α for slow- (blue curve), medium- (yellow curve) and fast-growing- (red curve) trees in optimal growing conditions (B). All equations used are indicated in corresponded colors.
Forests 12 01361 g004
Figure 5. The 11-day moving average Vext growth rates for 1965 (blue curve) and 1986 (red curve).
Forests 12 01361 g005
Figure 6. Schemes follow the same formatting. Simulated cumulative production of cambium (or TRW) obtained for slow- (blue bar), medium- (yellow bar) and fast-growing (red bar) trees over the growing seasons of dry 1965 (A) and moist 1986 (B).
Forests 12 01361 g006
Figure 7. Initial tree-ring width indices (red curve) and simulated tree growth (blue curve) over 1960−1990 (A); simulated absolute values of cumulative linear increments for slow- (blue curve), medium- (yellow curve) and fast-growing trees (red curve) using the cambial band model for the years 1960−1990 (B).
Forests 12 01361 g007
Figure 8. Variations of tree-ring width (TRW) for the trees Ma10 (blue curve) and Ma13 (red curve), 1925−2012. (A); variations of cumulative cell production (CP) for the trees Ma10 (blue curve) and Ma13 (red curve), 1925−2012 (B); scatterplot between CP and TRW and respective exponential regression for Ma10 (C); scatterplot between CP and TRW and respective exponential regression for Ma13 (D).
Forests 12 01361 g008
Figure 9. Variations of an average seasonal length of the cambium zone Lmean (blue solid curve) and the specific growth rate of the cambial zone β (dashed curve) for Ma10 (A); variations of an average seasonal length of the cambium zone Lmean (red solid curve) and the specific growth rate of the cambial zone β (dashed curve) for Ma13 (B); observed and simulated cell production for Ma10 (C) and Ma13 (D), 1937–2012.
Forests 12 01361 g009
Figure 10. Variations of observed and simulated tree-ring width (TRW) (in) for Ma10 (R2 = 0.67) (A) and Ma13 (R2 = 0.75) (B) over 1937–2012.
Forests 12 01361 g010
Table 1. Statistical characteristics of individual trees in the study region.
CharacteristicValue
Duration of chronology, years167
Number of trees 194
Sensitivity coefficient0.23
Expressed population signal, EPS0.99
Average inter-series correlation coefficient, R-bar0.41
Table 2. Estimated values of the increment ΔL of the cambial tape per time unit for different values of the external growth rate Vext, obtained for a slow-, medium- and fast-growing synthetic trees.
ΔL (μm)Vext (Relative Units)
10.90.80.70.60.50.40.30.20.1
slow12.6811.3510.018.687.346.014.673.342.000.67
medium23.7821.2818.7816.2713.7711.278.766.263.761.25
fast38.0534.0530.0426.0422.0318.0314.0210.016.012.00
Publisher’s Note: MDPI stays neutral with regard to jurisdictional claims in published maps and institutional affiliations.