Article

Projecting the Impact of Climate Change on the Spatial Distribution of Six Subalpine Tree Species in South Korea Using a Multi-Model Ensemble Approach

1
Korea Adaptation Center for Climate Change, Korea Environment Institute, Sejong 30147, Korea
2
Department of Environment & Forest Resources, Chungnam National University, Daejeon 34134, Korea
*
Author to whom correspondence should be addressed.
Forests 2021, 12(1), 37; https://doi.org/10.3390/f12010037
Submission received: 7 November 2020 / Revised: 7 December 2020 / Accepted: 28 December 2020 / Published: 30 December 2020
(This article belongs to the Special Issue Climatic Variability Anticipation and Adaptation of Forest)

Abstract

:
Climate change is recognized as a major threat to global biodiversity and has already caused extensive regional extinction. In particular danger are the plant habitats in subalpine zones, which are more vulnerable to climate change. Evergreen coniferous trees in South Korean subalpine zones are currently designated as a species that need special care given their conservation value, but the reason for their decline and its seriousness remains unclear. This research estimates the potential land suitability (LS) of the subalpine zones in South Korea for six coniferous species vulnerable to climate change in the current time (1970–2000) and two future periods, the 2050s (2041–2060) and the 2070s (2061–2080). We analyze the ensemble-averaged loss of currently suitable habitats in the future, using nine species distribution models (SDMs). Korean arborvitae (Thuja koraiensis) and Khingan fir (Abies nephrolepis) are two species expected to experience significant habitat losses in 2050 (−59.5% under Representative Concentration Pathway (RCP) 4.5 to −65.9% under RCP 8.5 and −56.3% under RCP 4.5 to −57.7% under RCP 8.5, respectively). High extinction risks are estimated for these species, due to the difficulty of finding other suitable habitats with high LS. The current habitat of Korean fir (Abies koreana), listed as a threatened species on the International Union for Conservation of Nature (IUCN) Red List, is expected to decrease by −23.9% (RCP 4.5) to −28.4% (RCP 8.5) and −36.5% (RCP 4.5) to −36.7% (RCP 8.5) in the 2050s and 2070s, respectively. Still, its suitable habitats are also estimated to expand geographically toward the northern part of the Baekdudaegan mountain range. In the context of forest management and adaptation planning, the multi-model ensemble approach to mapping future shifts in the range of subalpine tree species under climate change provides robust information about the potential distribution of threatened and endanger

1. Introduction

Alpine and subalpine regions are known to be more vulnerable to climate change, due to their unfavorable geographical, climatic, edaphic, and water conditions for the growth of plants, as well as the restriction of plant migration [1]. The alpine or subalpine vegetation that has adapted to these unfavorable environments for growth is very sensitive even to small environmental changes from outside, and responses to these changes are reflected in their physiological characteristics and growth rates, which, in turn, have huge influences on the nearby ecosystems [2], and their high extinction risks under climate change, due to their isolated distribution require addressing through more detailed observations of their responses to climatic environmental changes [3]. Human-caused climate change has resulted in alterations in the seasonal temperature and precipitation of forest ecosystems and other extreme climate phenomena, which could influence the geographical or altitudinal distributions of land suitable for plant growth [4]. The increase in the average temperature has increased the altitudes suitable for alpine or subalpine vegetation. It has, thus, decreased the size of their habitats, which has consequently increased their risk of extinction [5].
The subalpine ecosystem in South Korea is mostly located in conservation areas, such as national parks, around the highest areas of the Baekdudaegan mountain range, which extends north and south, and its evergreen coniferous forests represent its high conservation and scarcity value. Recently, the vertical elevation of the natural habitats of evergreen coniferous trees and the reduction of habitat sizes have been observed along with increased numbers of dead trees—all suspected to be related to climate change [6]. Among these species, Korean fir, also known as the Christmas tree, is an endemic species of South Korea; its designation as an endangered species on the International Union for Conservation of Nature (IUCN)’s Red List of Threatened Species [7] has recently drawn the nationwide interest of South Koreans. In the effort to conserve the subalpine ecosystem against the threat of climate change, the Korea Forest Service has selected ten coniferous species and five bare land plant species, considered the most representative of South Korean natural species, as the national index plants for climate change and conducted surveys on their distributions within subalpine regions and growth conditions [8]. In 2016, the Korea Forest Service also constructed a plan for the conservation of subalpine coniferous forests, under which it has conducted ecosystem monitoring and other research and development activities for the proliferation and restoration of coniferous species [9]. However, from a long-term perspective, the decline of land suitable for subalpine coniferous species is forecasted as inevitable under global warming. Thus, this requires surveying of the habitats with higher extinction risks and their alternatives, which is indispensable for understanding the possibility of their conservation and restoration in a national context.
Species distribution models (SDMs) can be used to mathematically estimate the potential suitability of the land for certain tree species based on their observed spatial distributions and information about their growing environments. Using SDMs to simulate the climate-change-driven future alterations in the suitable land for tree species and their colonies usually involve prediction uncertainty, which could be caused by various reasons, such as incomplete observations of species distributions, incomplete data entries of environmental factors, inconsistent prediction capacities of different SDMs and their complexity, and the uncertainty in climate forecasts and models [10]. To reduce this uncertainty inherent in species distribution prediction, the ensemble approach uses multiple SDMs to produce average value prediction surfaces, and for the weighted averages, the representation performance from the evaluation metrics of SDMs for species distributions is generally used [11,12]. Since the future climate variability drawn from the general circulation model (GCM) and regional circulation model (RCM) based on the greenhouse gas emission scenarios usually appears to be higher than the variability of SDMs’ predictabilities [13], various climate forecast data selected for specific regions must be used to ensure accuracy.
The objective of this research is to support the planning formulation for the conservation of South Korean regional subalpine forests and their ecosystems, especially in response to climate change. We analyzed the changes in land suitability of the subalpine regions in South Korea to distribute subalpine coniferous forests and the extinction risks of these species using multiple SDMs. Among the typical subalpine evergreen coniferous tree species in South Korea, those of six species with available appearance data, namely, Korean fir (Abies koreana E.H. Wilson), Khingan fir (Abies nephrolepis (Trautv.) Maxim.), Sargent juniper (Juniperus chinensis L. var. sargentii Henry), Yeddo spruce (Picea jezoensis (Siebold and Zucc.) Carrière), Korean yew (Taxus cuspidata S. et Z.), and Korean arborvitae (Thuja koraiensis Nakai), were selected, and distributions of their potential land suitability were simulated under two greenhouse gas emission scenarios (RCP 4.5 and RCP 8.5) of the Intergovernmental Panel on Climate Change (IPCC) through the ensemble modeling of nine SDMs. Based on the results of the simulation, the geographical distribution of potential land suitable for each species in the future was constructed using the information about these species and regions for conservation according to different climate change scenarios in different time periods. The prediction uncertainty was also examined.

2. Materials and Methods

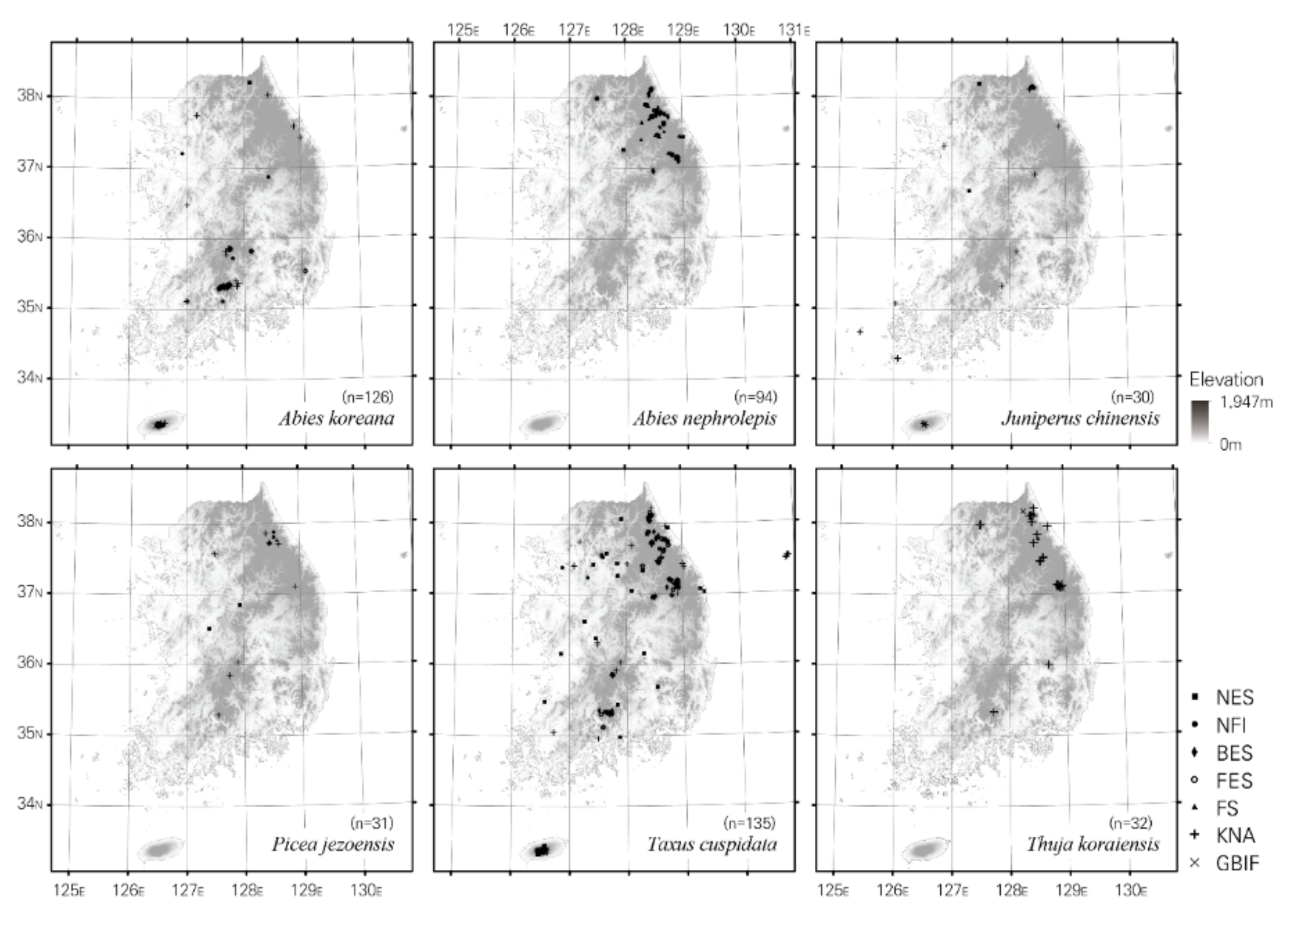
2.1. Location Data for 6 Subalpine Forest Species in South Korea

For the data on the six evergreen coniferous species in the subalpine regions, we employed databases serviced by the National Ecological Survey [14], National Forest Inventory (NFI), Baekdudaegan Mountain Range Ecological Survey [15], Korea National Arboretum [16], the 6th National Forest Inventory survey, and Global Biodiversity Inventory Facility [17]. Additional field surveys were conducted to determine the current distributions of these species necessary for SDMs (Table 1). The accuracies of SDMs can vary according to the sample sizes of presence sites [18,19]. This means that a smaller sample size could increase the accuracy of the model, but with a higher probability of overfitting, as too many environmental factors and sample size with too high density could produce many limitations in model interpretation [20,21,22]. To ensure the integrity of the collected data, cross-checking was performed to spatially rarefy the occurrence data [23], and the location errors and overlapped coordinates were removed through spatial filtering. To prevent sampling bias in SDM, the density of the data was adjusted to allow data from only one location in a single 1 km resolution grid cell. Finally, a total of 930 presence sites for the six subalpine coniferous species were collected, 448 of which were used for the study (Figure 1). The analysis of the altitudes above sea level of the studied sites showed that 86.3% were above 1000 m and the average altitude of all analyzed sites was 1254 ± 335 m.
The analysis of the conditions of the growing environments based on the occurrence data showed an annual mean temperature of 7.14 ± 1.68 °C and annual mean precipitation of 1521 ± 249 mm for the natural habitats of the species under research. The distribution of annual mean temperature among the habitats showed that the habitat for Juniperus chinensis had the highest annual temperature of 8.34 °C, while that for Abies nephrolepis had the lowest, at 6.30 °C. Thuja koraiensis was growing naturally in habitats with an annual mean precipitation of 1383 mm, while Abies koreana was growing in habitats with 1795 mm precipitation. Abies koreana naturally grew in habitats with an average altitude above sea level of 1381 ± 351.5 m, 14.6 ± 7.6° average slope, 7.73 ± 1.28 °C annual mean temperature, and 1795 ± 254 mm annual mean precipitation.

2.2. Environmental Parameters

We downloaded the current climate data to predict the change in the distribution of potential land suitable for subalpine coniferous forests, including 19 bioclimatic variables in the WorldClim datasets [24], which were constructed using the average climate data for the past three decades (1970–2000) with a spatial resolution of 30 arc seconds (about 1 km) [25]. Since the bioclimatic variables used as essential spatial variables to examine the distribution of the suitable lands for plant growth were calculated from monthly average temperatures and precipitation, there could be a multicollinearity problem [26]. To eliminate this possible multicollinearity, based on principal component analysis and cross-correlation matrix to avoid retaining highly correlated variables (Pearson’s r > 0.65), a total of six variables (annual mean temperature, mean diurnal range, temperature seasonality, annual precipitation, precipitation of wettest month, precipitation of driest month) among the 19 BioClim variables were selected for our research [27].
For future climate data, we referred to the HadGEM2-AO climate model, constructed by the National Institute of Meteorological Sciences for the publication of IPCC Assessment Report 5 (AR5), for two future time periods: The 2050s (2041–2060) and 2070s (2061–2080) under the 4.5 and 8.5 RCP emission scenarios. The HadGEM2-AO climate model is a general circulation model (GCM) with a spatial resolution of 135 km, and its bioclimatic variables were downscaled to the spatial resolution of 30 arc-seconds using version 1.4 of WorldClim for the actual analyses conducted for our detailed climate forecast in South Korea. To predict the influence of the efforts to mitigate greenhouse gas emissions upon ecosystems, each period in the negative climate change scenario under RCP 8.5 (meaning no reduction of emissions from the current levels) was compared with RCP 4.5 (assuming a partial reduction of emissions).
Local regions, like South Korea, have characteristic zonal patterns, which are hugely influenced by geomorphic environments [28,29]. Since the vegetation is only present in specific regions, especially reflecting zonal characteristics [30], the variables concerned with certain geographic and edaphic features reflective of the nature of subalpine vegetations were additionally identified for our analyses. The geographic variables altitude, slope, and slope direction were drawn using a digital elevation model (DEM) from Shuttle Radar Topography Mission (SRTM) with a spatial resolution of three arc-seconds [31,32,33]. The topographic position index (TPI) was also used to integrate various geographical, environmental conditions [32]. For the edaphic variables, data provided by Korea Forest Services regarding soil depth, soil texture, and soil moisture were used [34]. In particular, we determined that soil-related variables could prevent overfitting of non-forested areas because data were currently only available in forested areas.
Table 2 shows each environmental variable’s contribution to the common growth environments for coniferous tree species in subalpine regions. The variable with the greatest contribution in the nine SDMs of about six species under research was the altitude (with the average value contribution of 54.2% ± 0.1%) and the second most was the mean diurnal air temperature range (11.0% ± 5.8%), while the annual mean temperature (9.7% ± 5.4%) and annual precipitation (8.5% ± 4.4%) were located next to those. This shows that bioclimatic variables usually have higher contributions to the growth environments with a higher variability across different tree species.

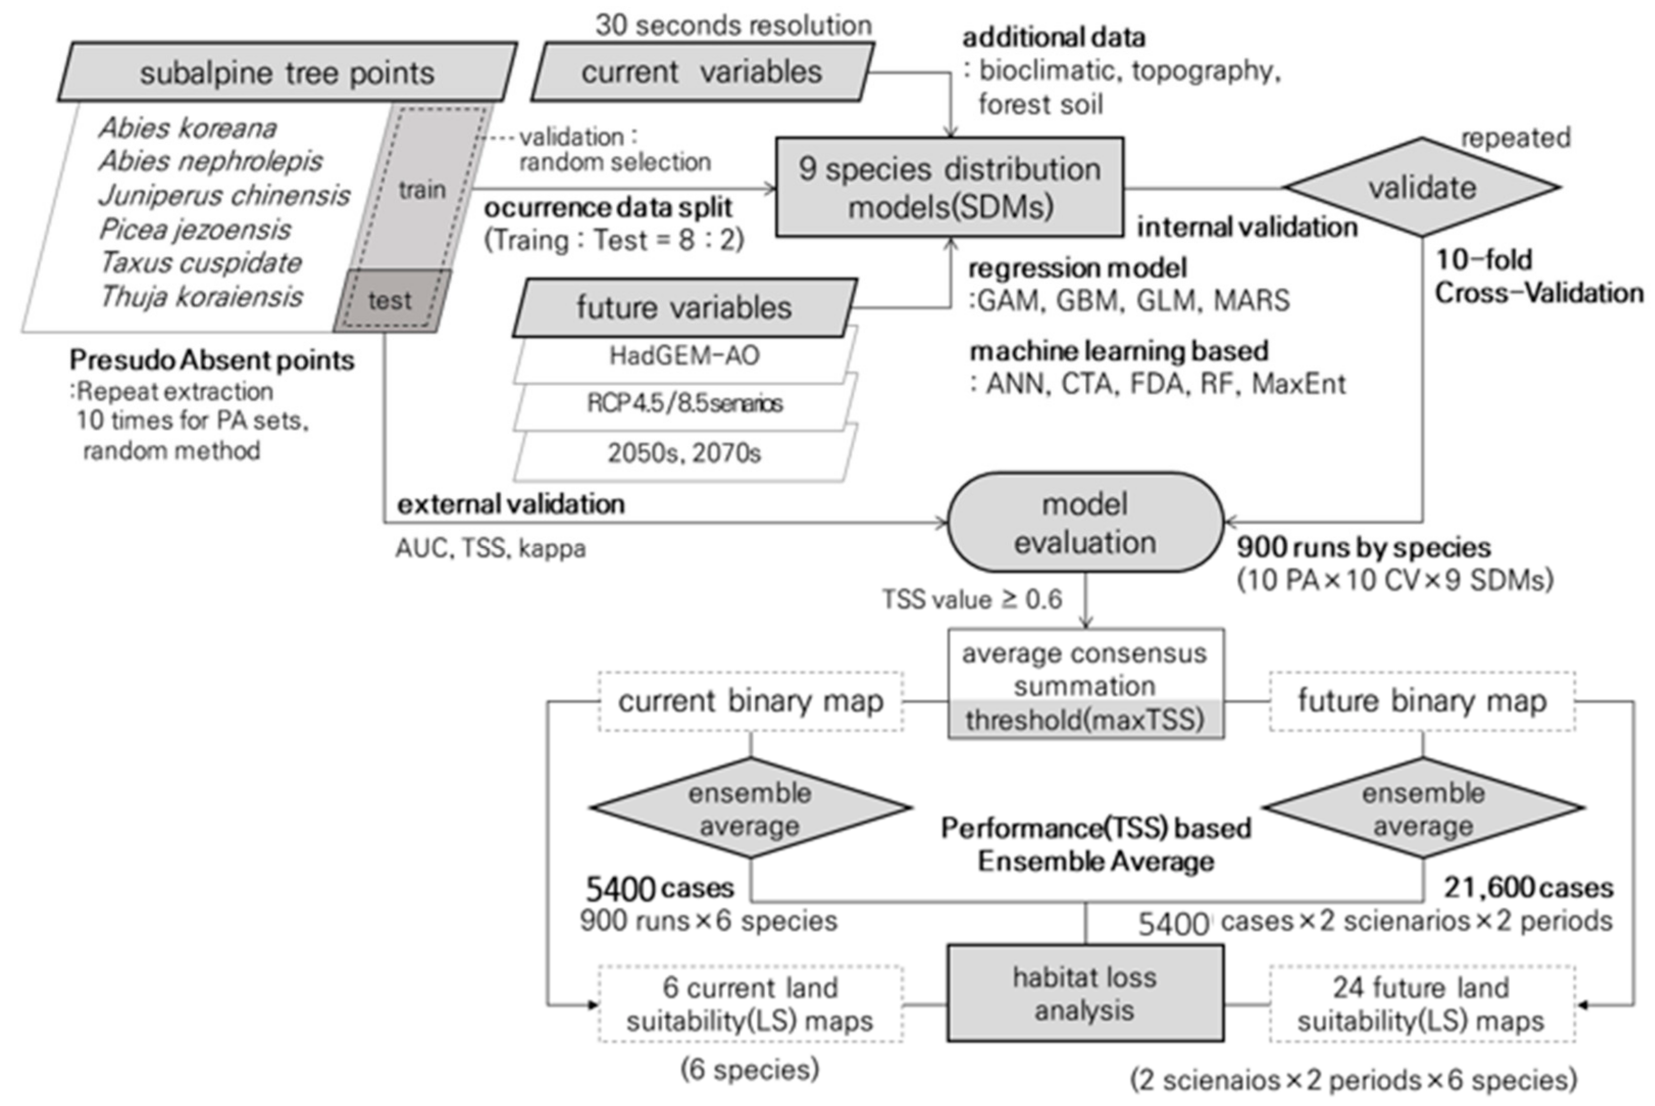
2.3. Species Distribution Ensemble Modeling and Land Suitability Analysis

To model the potential land suitability for the six subalpine coniferous tree species in the future, the ensemble modeling was designed to consist of four different regression models (general additive model (GAM), generalized boosted model (GBM), general linear model (GLM), and multivariate adaptive spline (MARS)) and five machine learning models (artificial neural network (ANN), classification tree analysis (CTA), flexible discriminant analysis (FDA), random forest (RF), and maximum entropy (MaxEnt)), provided by the Biomod2 package in R statistical language (Figure 2). We built individual models using default settings provided by Biomod2 version 3.4.12 [35] and ensembled the outcomes of SDM simulations with TSS value over 0.6 [36] to reduce the uncertainty of SDMs.
We used 80% of the occurrence data for each species for training the SDM, and the remaining 20% was used to test its prediction accuracy. We constructed 10-fold cross-validation (CA) by random selection from training datasets, and the possibility of species occurrence for each SDM was calculated. For the data regarding absence locations, which could directly influence the model performance [37], a total of 1000 pseudo-absence (PA) points were generated randomly in forest areas using ‘dismo’ package [38]. Then 10 PA datasets for SDMs were randomly selected by ‘biomod2′ from the 1000 PA points [39]. To evaluate the prediction accuracies of the models, the area under the receiver operating characteristics curve (AUC), true skill statistics (TSS), and Cohen’s kappa values were considered together [40,41,42,43]. Generally, prediction capabilities of AUC and kappa values of more than 0.7 indicate the good performance of a model, with >0.9 indicating excellent performance; values above 0.6 and 0.8 for TSS indicate good and excellent performance, respectively. Among the prediction data created through a total of 900 simulation runs of nine SDMs for each species, those with TSS values above 0.6 of TSS were selected and used for ensemble modeling [36].
As SDM results showed the possibility of each species’ occurrence in the form of continuous distributions, they imply the importance of deciding the threshold to objectively determine the presence of a given species for the integrity of the modeling results and their interpretation [44]. For each selected simulation run, the point at which TSS had the highest value (maxTSS) was defined as the threshold [45], and a binary map for the presence/absence of each species was then drawn using the threshold. TSS values were also used for calculating the weighted values for each model, and in the ensemble stage, higher weighted values were assigned to the models with higher accuracies; by doing so, the ensemble mean values were calculated [35]. As a result, the current land suitability maps and 24 potential land suitability maps for each tree in different future periods under different scenarios were created through the consensus summation of the binary maps to calculate the probability of the presence of the tree of interest in each pixel. When a pixel indicating the presence of the tree of interest in the current binary map became an absence in the simulated future binary map in which only climatic environmental factors changed, it was interpreted as indicating that a habitat loss would occur for that pixel. The scales of the ensemble average habitat losses for each species were calculated in terms of different climate change scenarios and future time periods.

3. Results

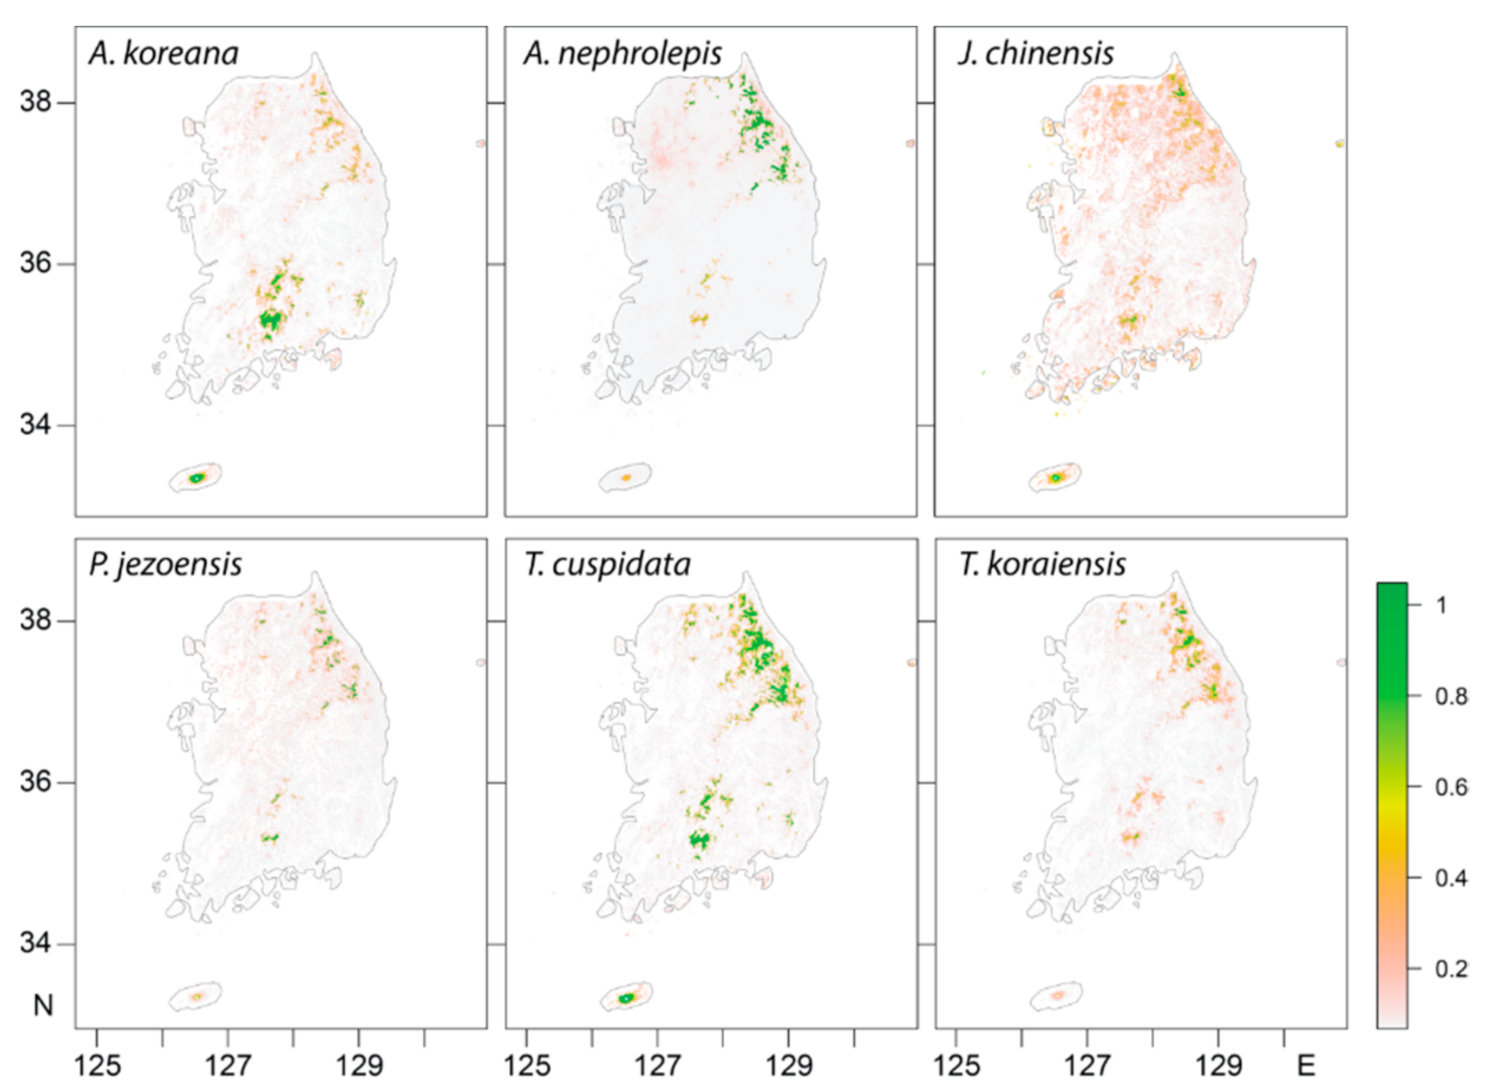
3.1. Model Accuracy and Current Potential Suitable Habitat Areas

Table 3 shows the accuracies of the SDMs tested through cross-validation. According to the tests, GBM (TSS 0.830 ± 0.096) and RF (TSS 0.828 ± 0.092) were the two models with the best performance in all evaluation indices (average value of AUC, kappa, and TSS). The model with a relatively low performance was GAM (TSS 0.679 ± 0.141). The tree species with the highest TSS values in all models was Abies nephrolepis (0.879 ± 0.073), whereas Juniperus chinensis (0.539 ± 0.208) had the lowest. We observed significant deviation among the model performances for different species.
Figure 3 shows the predicted distribution of land suitability of six subalpine forest species in the current time period (1970–2000) calculated from the current climatic and environmental data. The probability value for each pixel refers to the occurrence rate of each species in the 900 simulation runs. The pixel is colored green when its land suitability is 1.0. Most tree species appeared to have higher occurrence rates in the high-altitude regions of the Baekdudaegan mountain range, which has higher altitudes of above sea level and lower temperatures. Abies koreana was previously known for forming its habitats mostly in the mountaintop area of Jiri mountain (127.5° E, 35.5° N) and Halla mountain (126.5° E, 33.5° N) on Jeju Island, both located in the southern part of Korea [46]. Although Gaya Mountain and Namdeogyu Mountain (128° E, 36° N) were generally considered its northernmost habitats [47], the produced models show that the suitable lands for its growth could expand even to the northeastern mountainous regions of South Korea (129° E, 38° N).
The species with the higher TSS-based ensemble average for the size of its suitable land distribution was Abies nephrolepis (3021.7 km2, about 3.01% of the country), followed by Abies koreana (1820.1 km2, about 1.82% of the country), Thuja koraiensis (1129.8 km2, about 1.12% of the country), Taxus cuspidata (674.4 km2, about 0.67% of the country), Picea jezoensis (448.6 km2, about 0.45% of the country), and Juniperus chinensis (307.4 km2, about 0.31% of the country) (Table 4). The estimated altitude of the land suitable for the endangered subalpine coniferous forest species was 923~1225 m, which is lower than the average suitable land distribution altitude of 1200~1600 m [48]. To identify the uncertainty involving the ensemble average method, the ensemble averages of the suitable land sizes weighted either by equal-weighted average or committee averaging (CA) were compared. The results showed that under the use of equal value weighting, Abies nephrolepis will experience the largest change in its suitable land size (−40.6% or −1225.9 km2), while Abies koreana and Taxus cuspidata showed the two largest increases (+56.7% (+1032 km2) and +66.1% (+445.8 km2), respectively) under the use of committee averaging. This implies that the uncertainty could be roughly up to 50% using the ensemble method.

3.2. Future Changes in the Distribution of Suitable Habitat Area and Habitat Loss

The visualization of the predicted changes in the suitable habitats for the six subalpine coniferous species (green-colored when the probability of LS was greater than 0.6) during the 2070s (2061–2080) showed similar patterns of suitable land distributions in both RCP 4.5 and RCP 8.5 scenarios. Although all species are expected to lose some of their current habitats, due to climate change, their future conditions could vary according to whether they can colonize other suitable areas (Figure 4). Abies koreana and Taxus cuspidata are expected to offset some of their loss of current habitats in Jiri and Halla Mountains, with the new habitats be expanding to the mountainous areas of Gangwon-do province, located in the northeastern part of South Korea. Abies nephrolepis, Juniperus chinensis, Picea jezoensis, and Thuja koraiensis are not expected to find new habitats to offset their loss of current habitat, which would place them at more significant risk of extinction in the future.
Table 5 presents the predicted ensemble-averaged area loss of currently suitable habitats for the six species, showing that the current size of alpine coniferous forest in South Korea is expected to change −13.2% ± 16.6% (Taxus cuspidata) to –59.5% ± 30.6% (Thuja koraiensis) and −18.0% ± 22.5% (Taxus cuspidata) to −65.9% ± 34.2% (Thuja koraiensis) in the 2050s under the RCP 4.5 and RCP 8.5 scenarios, respectively. In the 2070s, it is estimated to change from the current size to −17.7% ± 20.1% (Taxus cuspidata) to −62.7% ± 33.8% (Thuja koraiensis) under RCP 4.5 and −26.7% ± 32.2% (Taxus cuspidata) to −67.1% ± 39.1% (Thuja koraiensis) under RCP 8.5. Thuja koraiensis, Abies nephrolepis, and Juniperus chinensis are the three species expected to be most vulnerable to extinction, due to their lack of alternative habitats. Thuja koraiensis (−59.5% ± 30.6% under RCP 4.5 to −65.9% ± 34.2% under RCP 8.5) and Abies nephrolepis (−56.3% ± 33.2% under RCP 4.5 to −57.7% ± 35.5% under RCP 8.5) are the two species for which the proactive plans for their loss of the natural habitats will be required in the 2050s, given the possible forecast fluctuations.
Abies koreana and Taxus cuspidate, currently gathered in the alpine areas of Jiri and Halla Mountains, are expected to lose their current habitats, but expand to the Baekdudaegan mountain range. The suitable habitat for Abies koreana is estimated to be reduced in the 2050s by 23.9% ± 24.4% (RCP 4.5) to 28.4% ± 27.8% (RCP 8.5), and in the 2070s by 36.5% ± 25.4% (RCP 4.5) to 36.7% ± 35.6% (RCP 8.5), and the pace of its habitat loss during the period from the 2050s to 2070s will be faster than that of from the current time to the 2050s. The habitat loss of Taxus cuspidata is expected to be the least among the six species; its current habitat would be reduced by 13.2% ± 16.6% (RCP 4.5 to 18.0% ± 22.5% (RCP 8.5) in the 2050s and by 17.7% ± 20.1% (RCP 4.5) to 26.7% ± 32.2% (RCP 8.5) in the 2070s. The species that showed the largest difference in the amount of the predicted habitat loss between two greenhouse gas emission scenarios were Thuja koraiensis (6.4%) in the 2050s and Taxus cuspidata (9.0%) in the 2070s. This means that efforts to reduce greenhouse gas emissions would be effective in preventing habitat loss, especially for these two species.

4. Discussion

The prediction of the latitudinal and altitudinal distribution of suitable habitats for subalpine coniferous forest species in South Korea could provide information about the extinction risks of each species and the possibility of their restoration, which is important for in-situ or ex-situ conservation and forest management. The statistical prediction of species distribution involves prediction uncertainty given the data quality of the observed species occurrence sites and environmental variables, as well as different algorithms and modeling parameters. Therefore, to minimize this uncertainty, we employed multiple SDMs in this research for the ensemble average method, which provided more accurate simulation performance to predict the suitable habitats of the species under study. However, uncertainty remains about choosing the threshold for determining the range of the habitat in each SDM and the ensemble average method. Among the nine SDMs used for this research (ANN, CTA, FDA, GAM, GBM, GLM, MARS, MAXENT, and RF), those with the highest values for their three evaluation indices (kappa AUC and TSS) were GBM and RF. The variation among the different SDM simulation results, in comparison to the ensemble average of the currently suitable habitat area, ranged from 11.5% (Picea jezoensis) to 34.1% (Taxus cuspidata). However, the uses of different ensemble weighting methods resulted in different outcomes for several species from their TSS-based ensemble averages (under the equal value weighting method, the maximum deviation was −40.6% (Abies nephrolepis) and 111% for Juniperus chinensis under CA-weighting), which implies special caution is needed when deciding a proper weighting method to minimize the inter-SDM variation.
For the two decades after the mid-1990s, the size of the subalpine coniferous forest, including Abies koreana, has been reduced by 25% [49], and the physiological stress caused by various environmental factors, such as the rise in average temperatures in winter and spring, drought, heatwave, and the decrease in the amount of snowfall, has been assumed to be the major reason for the large-scale decline of the habitat areas [48]. To select the candidate conservation and restoration areas for endangered subalpine coniferous forest species, a more comprehensive consideration of the change in the suitable land distributions caused by global warming and possible damage caused by severe weather phenomena is necessary. The simulations for the 65 years from the mid-1990s until the end of the 2050s showed that the ensemble-averaged habitat loss speed for subalpine coniferous forest would be −0.544%/year (−0.203%/year for Taxus cuspidata to −0.915%/year for Thuja koraiensis) under the RCP 4.5 scenario and −0.591%/year (−0.277%/year for Taxus cuspidata to −1.014%/year for Thuja koraiensis) under RCP 8.5. Even considering the possible variations in outcomes among the different SDMs, the future habitat loss velocity is expected to be slower than for the past twenty years (−1.25%/year). This suggests that various environmental factors, including extreme weather events (i.e., cold dry wind), inter/intraspecific competition, dispersal capabilities, etc., should be studied to better understand the reasons for this extinction trend.
The suitable land for the growth of Abies koreana is expected to expand northward, so this species would lose its current habitat at speeds of −0.368%/year (RCP 4.5) to −0.437%/year (RCP 8.5) but, given the slow pace of plant migration, we may need to examine whether it could avoid extinction risk through the altitudinal and geographical migration and natural adaptation.
Even though the SDM-based prediction of the shift in the ranges of species under climate change could provide valuable information for forest ecosystem conservation and management, the predictive accuracy of SDMs is restricted by various factors, thus resulting in uncertainty in the conservation and management plans. The outcomes of SDM simulations, which appear to be affected by choices of algorithms and parameters, can be managed through multi-model ensemble modeling to a certain degree. However, the sampling biases at observation points and the uncertainties inherent in environmental variables, such as future climate data from GCMs and RCMs, could be the source of the uncertainty in the predicted distributions of habitats. Notably, in the case of mountainous regions with large inter-regional weather differences, like those in South Korea, higher resolution is specifically required for local data. The data from WorldClim that we used for simulations were the 1 km downscaled version of climate projection data from HadGEM2-AO GCM (originally with a spatial resolution of about 135 km)—this was insufficient for meteorological observation data of mountainous areas, which are limited for representing the climate variability of these areas. Future research could use HadGEM3-RA RCM of the Coordinated Regional Downscaling Experiment (CODEX) (http://cordex-ea.climate.go.kr/cordex) for more dynamically downscaled climate prediction data (with a spatial resolution of about 12.5 km).
From an ecological perspective, climate change is still a slow-paced phenomenon. Given the slow pace of plant migration, studies of climate-change-related extinctions of plant species need to use continuous observations of the changes over at least a 20- to 30-year period. No organism can exist in isolation. Therefore, the changes in the distributions of subalpine forests, their densities, biodiversity, and other phenological characteristics should be examined within their complicated interrelations in an ecosystem. However, for most endangered plant species, the data about their distributions, competitions, locations in an ecosystem, and adaptabilities are currently unavailable; thus, longer-term surveys for these data are required.

5. Conclusions

The habitat loss of alpine and subalpine plant species is aggravated by the influence of climate change, suggesting the necessity of efforts to maintain species diversity, such as those for the collection and conservation of natural plant resources. As one of these efforts, we estimated the current habitats of selected subalpine tree species with higher conservation values and then constructed models to simulate their future changes under different climate change scenarios. The findings of this research could be used for surveys of the biodiversity on the Korean peninsula under climate change and for decision-making regarding the selection of plant conservation and restoration sites. Severe weather events caused by global warming/climate change are expected to increase the number of plants dying and the severe competition amongst them. To reduce further damage, due to climate change, the efforts of research institutes and experts are required for continuous and longitudinal monitoring alongside more comprehensive modeling-based research to examine the direct and indirect causes of die-offs, as well as to expand scientific data for conservation and restoration projects.

Author Contributions

Conceptualization, J.C.; methodology, H.J.; formal analysis, S.L.; validation, H.J.; resources, J.C.; writing—original draft preparation, S.L.; writing—review and editing, H.J. and J.C.; visualization, S.L.; supervision, H.J. and J.C. All authors have read and agreed to the published version of the manuscript.

Funding

This research was supported by the Korea Environment Industry and Technology Institute (KEITI) grant (No. 2018000210006), funded by the Ministry of Environment (MOE).

Institutional Review Board Statement

Not applicable.

Informed Consent Statement

Not applicable.

Data Availability Statement

Data sharing is not applicable to this article.

Conflicts of Interest

The authors declare no conflict of interest.

References

  1. Grabherr, G.; Gottfried, M.; Pauli, H. Climate change impacts in alpine environments. Geogr. Compass 2010, 4, 1133–1153. [Google Scholar] [CrossRef] [Green Version]
  2. Kayama, M.; Makoto, K.; Nomura, M.; Sasa, K.; Koike, T. Growth characteristics of Sakhalin spruce (Picea glehnii) planted on the northern Japanese hillsides exposed to strong winds. Trees 2009, 23, 145–157. [Google Scholar] [CrossRef]
  3. Guisan, A.; Theurillat, J.-P. Assessing alpine plant vulnerability to climate change: A modeling perspective. Integr. Assess. 2000, 1, 307–320. [Google Scholar] [CrossRef]
  4. Bailey, R.G. Ecosystem Geography: From Ecoregions to Sites; Springer Science & Business Media: New York, NY, USA, 2009; ISBN 0387895159. [Google Scholar]
  5. Freeman, B.G.; Lee-Yaw, J.A.; Sunday, J.M.; Hargreaves, A.L. Expanding, shifting and shrinking: The impact of global warming on species’ elevational distributions. Glob. Ecol. Biogeogr. 2018, 27, 1268–1276. [Google Scholar] [CrossRef]
  6. Korea National Park Research Institute (KNPRI). National Park Climate Change Ecosystem Monitoring; KNPRI: Wonju, Korea, 2019; pp. 105–222. [Google Scholar]
  7. International Union for Conservation of Nature and Natural Resources RED LIST. Available online: https://www.iucnredlist.org (accessed on 10 January 2020).
  8. National Institute of Forest Science (NIFS). Guidelines for Survey of Coniferous Tree Species in Endangered Alpine Areas; NIFS: Seoul, Korea, 2017.
  9. Ministry of Environment (MOE). Subalpine Coniferous Forest Management Measures According to Climate Change; MOE: Sejong, Korea, 2016.
  10. Pecchi, M.; Marchi, M.; Moriondo, M.; Forzieri, G.; Ammoniaci, M.; Bernetti, I.; Bindi, M.; Chirici, G. Potential impact of climate change on the spatial distribution of key forest tree species in Italy under RCP 4.5 for 2050s. Forests 2020, 11, 934. [Google Scholar] [CrossRef]
  11. Breiner, F.T.; Guisan, A.; Bergamini, A.; Nobis, M.P. Overcoming limitations of modelling rare species by using ensembles of small models. Methods Ecol. Evol. 2015, 6, 1210–1218. [Google Scholar] [CrossRef]
  12. Meller, L.; Cabeza, M.; Pironon, S.; Barbet-Massin, M.; Maiorano, L.; Georges, D.; Thuiller, W. Ensemble distribution models in conservation prioritization: From consensus predictions to consensus reserve networks. Divers. Distrib. 2014, 20, 309–321. [Google Scholar] [CrossRef]
  13. Goberville, E.; Beaugrand, G.; Hautekèete, N.C.; Piquot, Y.; Luczak, C. Uncertainties in the projection of species distributions related to general circulation models. Ecol. Evol. 2015, 5, 1100–1116. [Google Scholar] [CrossRef]
  14. National Institute of Ecology ECObank. Available online: https://www.nie-ecobank.kr (accessed on 12 January 2020).
  15. Park, H. Development and Application of Climate Change Sensitivity Assessment Method for Plants Using the Species Distribution Models. Ph.D. Thesis, Kangwon National University, Chuncheon, Korea, August 2016. [Google Scholar]
  16. National Arboretum Korea Biodiversity Information System. Available online: http://www.nature.go.kr (accessed on 2 February 2020).
  17. Global Biodiversity Information Facility. Available online: https://www.gbif.org (accessed on 25 January 2020).
  18. Wisz, M.S.; Hijmans, R.J.; Li, J.; Peterson, A.T.; Graham, C.H.; Guisan, A.; Elith, J.; Dudík, M.; Ferrier, S.; Huettmann, F.; et al. Effects of sample size on the performance of species distribution models. Divers. Distrib. 2008, 14, 763–773. [Google Scholar] [CrossRef]
  19. Mateo, R.G.; Felicísimo, Á.M.; Muñoz, J. Effects of the number of presences on reliability and stability of MARS species distribution models: The importance of regional niche variation and ecological heterogeneity. J. Veg. Sci. 2010, 21, 908–922. [Google Scholar] [CrossRef] [Green Version]
  20. Ter Steege, H.; Haripersaud, P.P.; Banki, O.S.; Schieving, F. A Model of botanical collectors’ behavior in the field: Never the same species twice. Am. J. Bot. 2011, 98, 31–37. [Google Scholar] [CrossRef] [PubMed]
  21. McPherson, J.M.; Jetz, W.; Rogers, D.J. The effects of species’ range sizes on the accuracy of distribution models: Ecological phenomenon or statistical artefact? J. Appl. Ecol. 2004, 41, 811–823. [Google Scholar] [CrossRef]
  22. Kramer-Schadt, S.; Niedballa, J.; Pilgrim, J.D.; Schröder, B.; Lindenborn, J.; Reinfelder, V.; Stillfried, M.; Heckmann, I.; Scharf, A.K.; Augeri, D.M.; et al. The importance of correcting for sampling bias in MaxEnt species distribution models. Divers. Distrib. 2013, 19, 1366–1379. [Google Scholar] [CrossRef]
  23. Hijmans, R.J.; Schreuder, M.; De La Cruz, J.; Guarino, L. Using GIS to check co-ordinates of genebank accessions. Genet. Resour. Crop Evol. 1999, 46, 291–296. [Google Scholar] [CrossRef]
  24. WorldClim. Available online: https://worldclim.org (accessed on 20 January 2020).
  25. Fick, S.; Hijmans, R. Worldclim 2: New 1-km spatial resolution climate surfaces for global land areas. Int. J. Climatol. 2017. [Google Scholar] [CrossRef]
  26. Busby, J. BIOCLIM-a bioclimate analysis and prediction system. Plant Prot. Q. 1991, 6, 8–9. [Google Scholar]
  27. Choi, J.; Lee, S. Climate Change Impact Assessment of Abies nephrolepis (Trautv.) Maxim. in Subalpine Ecosystem using Ensemble Habitat Suitability Modeling. J. Korea Soc. Environ. Restor. Technol. 2018, 21, 103–118. [Google Scholar] [CrossRef]
  28. Wright, J.S.; Sobel, A.; Galewsky, J. Diagnosis of zonal mean relative humidity changes in a warmer climate. J. Clim. 2010, 23, 4556–4569. [Google Scholar] [CrossRef] [Green Version]
  29. Wolter, P.T.; Mladenoff, D.J.; Host, G.E.; Crow, T.R. Using Multi-Temporal Landsat Imagery. Photogramm. Eng. Remote Sens. 1995, 61, 1129–1143. [Google Scholar]
  30. Han, N.; Cha, D.; Kwon, J.; Cho, H. A Study on Geotop Classification and Geodiversity in Mt. Jeombong Experimental Forest. J. Korea Soc. Environ. Restor. Technol. 2015, 18, 179–190. [Google Scholar]
  31. Gorokhovich, Y.; Voustianiouk, A. Accuracy assessment of the processed SRTM-based elevation data by CGIAR using field data from USA and Thailand and its relation to the terrain characteristics. Remote Sens. Environ. 2006, 104, 409–415. [Google Scholar] [CrossRef]
  32. Wilson, J.P.; Gallant, J.C. Terrain Analysis: Principles and Applications; Wiley: Hoboken, NJ, USA, 2000. [Google Scholar]
  33. SRTM Data. Available online: http://srtm.csi.cgiar.org/srtmdata (accessed on 20 February 2020).
  34. Forest Spatial Information Service. Available online: http://map.forest.go.kr (accessed on 20 January 2020).
  35. Thuiller, W.; Lafourcade, B.; Engler, R.; Araújo, M.B. BIOMOD—A platform for ensemble forecasting of species distributions. Ecography 2009, 32, 369–373. [Google Scholar] [CrossRef]
  36. Tiago, P.; Pereira, H.M.; Capinha, C. Using citizen science data to estimate climatic niches and species distributions. Basic Appl. Ecol. 2017, 20, 75–85. [Google Scholar] [CrossRef]
  37. Lobo, J.M.; Tognelli, M.F. Exploring the effects of quantity and location of pseudo-absences and sampling biases on the performance of distribution models with limited point occurrence data. J. Nat. Conserv. 2011, 19, 1–7. [Google Scholar] [CrossRef]
  38. Hijmans, R.J.; Phillips, S.; Leathwick, J.; Elith, J. Dismo: Species Distribution Modeling, R Package Version 1.1-4; 2020. Available online: http://CRAN.R-project.org/package=dismo (accessed on 20 October 2020).
  39. Thuiller, W.; Georges, D.; Engler, R.; Breiner, F. Biomod2: Ensemble Platform for Species Distribution Modeling; R Package Version 3.3-7.1; 2019. Available online: http://CRAN.R-project.org/package=biomod2 (accessed on 20 February 2020).
  40. Leroy, B.; Meynard, C.N.; Bellard, C.; Courchamp, F. virtualspecies, an R package to generate virtual species distributions. Ecography 2016, 39, 599–607. [Google Scholar] [CrossRef]
  41. Robinson, H.S.; Weckworth, B. Landscape Ecology: Linking Landscape Metrics to Ecological Processes. In Snow Leopards; McCarthy, T., Mallon, D.B.T.-S.L., Eds.; Academic Press: Cambridge, MA, USA, 2016; pp. 395–405. [Google Scholar]
  42. Turner, M.G.; Gardner, R.H. Introduction to Landscape Ecology and Scale BT. In Landscape Ecology in Theory and Practice: Pattern and Process; Turner, M.G., Gardner, R.H., Eds.; Springer: New York, NY, USA, 2015; pp. 1–32. [Google Scholar]
  43. Connor, T.; Viña, A.; Winkler, J.A.; Hull, V.; Tang, Y.; Shortridge, A.; Yang, H.; Zhao, Z.; Wang, F.; Zhang, J.; et al. Interactive spatial scale effects on species distribution modeling: The case of the giant panda. Sci. Rep. 2019, 9, 14563. [Google Scholar] [CrossRef] [Green Version]
  44. Liu, C.; Berry, P.M.; Dawson, T.P.; Pearson, R.G. Selecting thresholds of ocurrence in the prediction of species distributions. Ecography 2005, 28, 385–393. [Google Scholar] [CrossRef]
  45. Liu, C.; White, M.; Newell, G. Selecting thresholds for the prediction of species occurrence with presence-only data. J. Biogeogr. 2013, 40, 778–789. [Google Scholar] [CrossRef]
  46. Lee, W.T.; Yim, Y.J. The Phytogeography; Kangwon National University Press: Chuncheon, Korea, 2002. [Google Scholar]
  47. Lee, D.; Jin, D.; Lee, J.; Choi, I.; Choi, B. Floristic study of Mt. Namdeogyu. Korean J. Plant Taxon. 2013, 43, 69–79. [Google Scholar] [CrossRef]
  48. National Institute of Forest Science (NIFS). Endangered Alpine Coniferous Species in Korea; NIFS: Seoul, Korea, 2019.
  49. Kim, E.; Lee, J.; Park, G.; Lim, J. Change of Subalpine Coniferous Forest Area over the Last 20 Years. J. Korean Soc. For. Sci. 2019, 108, 10–20. [Google Scholar]
Figure 1. Occurrence sites of six subalpine forest species in South Korea.
Forests 12 00037 g001
Figure 2. Schematic representation of the ensemble species distribution modeling approach.
Forests 12 00037 g002
Figure 3. Land suitability maps of six subalpine forest species in Korea under the current (1970–2000) climate conditions.
Forests 12 00037 g003
Figure 4. Land suitability maps of six subalpine forest species in South Korea for the 2070s (2061–2080) under RCP 4.5 (upper) and RCP 8.5 (lower) emission scenarios.
Forests 12 00037 g004
Table 1. Number of cleaned (collected) occurrence sites of six subalpine forest species for species distribution modeling.
NameNES 1BES 2KNA 3NFI 4FES 5GBIF 6FS 7Total
Abies koreana9 (11)30 (30)33 (37)10 (15)40 (45)4 (7)-126 (145)
Abies nephrolepis9 (9)27 (45)-7 (10)14 (37)0 (1)37 (239)94 (341)
Juniperus chinensis3 (7)1 (1)12 (16)-12 (41)2 (4)-30 (69)
Picea jezoensis3 (3)-10 (16)2 (4)--16 (16)31 (39)
Taxus cuspidata36 (74)19 (25)41 (67)12 (50)24 (57)3 (14)-135 (287)
Thuja koraiensis--24 (28)1 (1)-6 (19)1 (1)32 (49)
Total60 (104)77 (101)120 (164)32 (80)90 (180)15 (45)54 (256)448 (930)
1 NES: National Ecosystem Survey, 2 BES: Baekdudaegan Mountain Range Ecological Survey, 3 KNA: Korea National Arboretum, 4 NFI: 6th National Forest Inventory survey, 5 FES: Forest Ecological Survey, 6 GBIF: Global Biodiversity Information Facility, 7 FS: Field Survey.
Table 2. Selected environmental variables with percent contribution of all species.
CodeDescriptionUnitContribution (%)
Bio01Annual mean temperature°C9.7 ± 5.4
Bio02Mean diurnal temperature range°C11.0 ± 5.8
Bio04Temperature seasonality°C5.5 ± 2.0
Bio12Annual precipitationmm8.5 ± 4.4
Bio13Precipitation of wettest monthmm7.5 ± 3.7
Bio14Precipitation of driest monthmm5.2 ± 3.2
DEMElevationm54.2 ± 0.1
LFLandforms index from TPI *-4.9 ± 1.5
SPSlope position index from TPI *-6.7 ± 1.8
SLPSlope°5.3 ± 0.7
ASPCos(Aspect(rad))-5.1 ± 1.3
FSDForest soil depthcm6.7 ± 3.7
FSTForest soil texture-5.4 ± 2.3
FSMForest soil moisture%4.6 ± 2.1
* TPI: topographic position index.
Table 3. Mean and standard deviation of model accuracy under area under the receiver operating characteristic (AUROC), kappa, and true skill statistic (TSS) for the species distribution model and each species.
SpeciesModelsAUC (0–1)kappa (0–1)TSS (0–1)
All speciesANN 10.903 ± 0.0620.738 ± 0.1100.783 ± 0.112
CTA 20.864 ± 0.0650.635 ± 0.1170.733 ± 0.117
FDA 30.895 ± 0.0700.783 ± 0.1030.779 ± 0.117
GAM 40.847 ± 0.0740.643 ± 0.1200.679 ± 0.141
GBM 50.929 ± 0.0540.807 ± 0.1000.830 ± 0.096
GLM 60.881 ± 0.0710.673 ± 0.1170.737 ± 0.137
MARS 70.881 ± 0.0700.705 ± 0.1150.742 ± 0.137
MAXENT 80.863 ± 0.0810.706 ± 0.1340.719 ± 0.156
RF 90.926 ± 0.0510.808 ± 0.0940.828 ± 0.092
Abies koreanaAll models0.947 ± 0.0350.858 ± 0.0050.860 ± 0.064
Abies nephrolepis0.946 ± 0.0370.846 ± 0.0720.879 ± 0.073
Juniperus chinensis0.761 ± 0.1220.476 ± 0.1890.539 ± 0.208
Picea jezoensis0.906 ± 0.0770.767 ± 0.1220.811 ± 0.144
Taxus cuspidata0.860 ± 0.0500.681 ± 0.0870.668 ± 0.091
Thuja koraiensis0.905 ± 0.0780.703 ± 0.1430.796 ± 0.155
1 ANN: Artificial neural network, 2 CTA: Classification tree analysis, 3 FDA: Flexible discriminant analysis, 4 GAM: Generalized additive model, 5 GBM: Generalized boosting model, 6 GLM: Generalized linear model, 7 MARS: Multiple adaptive regression splines, 8 MAXENT: Maximum entropy, 9 RF: Random forest.
Table 4. Currently suitable habitat areas for subalpine forest species in Korea using true skill statistic (TSS) weighted average, equal average, and committee averaging (CA)-based ensemble averaging methods.
SpeciesElevation of Habitat (Mean ± SD, m)TSS-Weighted Average Equal Value Average CA-Based Average
Area (km2)Fraction of Country (%)Area (km2)Fraction of Country (%)Area (km2)Fraction of Country (%)
Abies koreana1382 ± 3521820.11.821823.01.822852.12.85
Abies nephrolepis1297 ± 1863021.73.011795.81.793021.73.02
Juniperus chinensis1331 ± 340307.40.31334.30.33649.70.65
Picea jezoensis1338 ± 214448.60.45497.40.50618.30.62
Taxus cuspidata1092 ± 448674.40.67674.40.671120.21.12
Thuja koraiensis1240 ± 2631129.81.121065.71.061129.81.13
Table 5. The projected loss of currently suitable habitat area, due to climate change for the 2050s and 2070s, based on RCP 4.5 and RCP 8.5 emission scenarios. Δ is the areal loss difference between RCP 4.5 and RCP 8.5.
SpeciesAreal Loss in 2050s (2041–2060) (%)Areal Loss in 2070s (2061–2080) (%)
RCP 4.5RCP 8.5ΔRCP 4.5RCP 8.5Δ
Abies koreana23.9 ± 24.428.4 ± 27.84.536.5 ± 25.436.7 ± 35.60.2
Abies nephrolepis56.3 ± 33.257.7 ± 35.51.465.2 ± 34.762.2 ± 39.8−3.0
Juniperus chinensis37.2 ± 26.039.0 ± 29.51.843.9 ± 26.940.6 ± 33.2−3.3
Picea jezoensis22.1 ± 25.621.6 ± 26.5−0.525.9 ± 30.323.7 ± 33.2−2.2
Taxus cuspidata13.2 ± 16.618.0 ± 22.54.817.7 ± 20.126.7 ± 32.29.0
Thuja koraiensis59.5 ± 30.665.9 ± 34.26.462.7 ± 33.867.1 ± 39.14.4
Publisher’s Note: MDPI stays neutral with regard to jurisdictional claims in published maps and institutional affiliations.

