Article

Effect of Bentonite on the Early Growth Characteristics of Teak Seedlings Planted in Sandy Soil in Northeast Thailand—A Pilot Study

1
Japan International Research Center for Agricultural Sciences, 1-1 Ohwashi, Tsukuba, Ibaraki 305-8686, Japan
2
Forestry and Forest Products Research Institute, Ibaraki 305-8687, Japan
3
Royal Forest Department, 61 Phaholyothin Rd., Chatuchak, Bangkok 10900, Thailand
*
Author to whom correspondence should be addressed.
Forests 2021, 12(1), 26; https://doi.org/10.3390/f12010026
Submission received: 27 November 2020 / Revised: 17 December 2020 / Accepted: 24 December 2020 / Published: 28 December 2020
(This article belongs to the Special Issue Nutrients and Water Use of Trees in Tropical Forests)

Abstract

:
The growth of teak (Tectona grandis L. f.) seedlings in sandy soil in northeast Thailand is suppressed by infertility and drought stress. In a preliminary field pot experiment, we confirmed that bentonite was useful for increasing soil water availability. To monitor early growth characteristics of teak seedlings in sandy soil, we curried out an experiment of teak seedlings using bentonite and fertilizer in the field from July 2014 to November 2015. We then compared the growth, biomass, photosynthetic rate, leaf water potential, and concentration of elements in the plant organs among the four treatments. Bentonite increased both soil pH and Ca during the experimental period, and retained P in fertilizer. The dry mass of teak seedlings was markedly increased by concurrent use of bentonite and fertilizer. However, the use of bentonite alone showed little increase of dry mass of teak seedlings. Moreover, application of bentonite was mitigated drought stress in dry season, and photosynthetic rate showed high value by high concentration of chlorophyll. The concentration of K in root of teak seedlings was increased by application of bentonite, and its value showed positive correlation with the relative growth rate of teak seedlings. We concluded that bentonite was useful for the uptake of K and retention of P in fertilizer, as a result, growth of teak seedlings was accelerated.

1. Introduction

Teak (Tectona grandis L. f) is one of the most important timber species, and has been planted in tropical regions of various countries [1]. In general, natural teak forest soil is alkaline (pH 6.8–7.8) [2], and its area in Thailand overlaps with the distribution of calcareous soil originating from limestone [3]. Soil nutrients are important in the growth of teak seedlings, and limited soil nutrient content is a primary restriction on the growth of teak [1,3,4,5]. In particular, a drastic decrease in the growth of teak seedlings has been observed when they are raised in culture medium without nitrogen [N] or calcium [Ca] [4,6]. Thus, we considered N and Ca to be essential nutrients for teak growth.
In the uplands of tropical Asia, soil is characterized by low pH and infertility [7,8,9]. Moreover, clays at the surface have been leached, and the water-holding capacity and cation exchange capacity (CEC) at the surface are low [8,9]. The growth of teak is negatively correlated with sand content, and poor teak growth is observed on plantations with very sandy soil [3,10,11]. Additionally, soil with a low CEC is characterized by rapid leaching after fertilizer application [9,12]. Soil in northeast Thailand is described as a “light textured sandy soil” (referred to as sandy soil herein), and is characterized by low clay content, low pH, low fertility, low water-holding capacity, and low CEC [13,14,15,16]. Previous studies have shown that teak grows poorly in sandy soils [17] and readily suffers from drought stress [15]. Thus, when teak seedlings are planted in sandy soil, the water-holding capacity and CEC must be improved to promote growth.
Meanwhile, there was a case that height of teak planted in northeast Thailand was over 10 m for five years by soil improvement [16]. This value was similar with the suitable region of teak plantation in Thailand [18]. Thus, some areas in northeast Thailand have a potential for high growth of teak [19]. Moreover, growth characteristics of teak seedlings for two years was reflected subsequent growth [11,16]. Therefore, the monitoring of teak growth in early period after planting is important [15,20], and can predict the subsequent growth [11,16]. Moreover, teak seedlings are suffered from the drought stress in the first dry season, and increase their mortality [15,20]. Measurements of leaf water potential and photosynthetic rate can estimate the vitality of teak seedlings [21,22,23]. Therefore, measurements of ecophysiological traits of teak seedlings in early period is essential for the monitoring of teak growth.
The previous method for the improvement of sandy soil was fertilization and acid correction [16]. Recently, bentonite, a clay consisting mostly of montmorillonite is introduced, and has a high water-holding capacity and CEC [13,24,25,26]. However, the use of bentonite in silviculture is rare [24,27]. In a previous experiment, we examined the effects of bentonite on teak growth [14]. We added 4% bentonite to sandy soil in northeast Thailand. Teak seedlings were potted in these soils and raised for 1 year under field conditions with no fertilization. Soil water content was increased by adding bentonite; however, we did not confirm growth acceleration in the teak seedlings after the addition of bentonite [14]. In contrast, application of bentonite improves the fertility of sandy soil owing to its high CEC value. A particle of bentonite is charged negatively, and bind various kind of cations [28]. As a result, bentonite has high capacity of nutrient retention, and plants efficiently absorb cations bound a surface of bentonite [29]. Moreover, application of bentonite has the capacity to increase Ca in the soil [26]. Bentonite has also a capacity to mitigate the leaching of nutrient ions by binding on its surface [29]. However, the capacity of binding is not irreversible [30]. Plant production is increased by concurrent use of bentonite and fertilizer [29,31]. However, verification tests on teak seedlings grown in bentonite and fertilizer-enhanced soils have not yet been conducted in a field environment.
The aim of this study was to examine the suitability of bentonite for improving the CEC and fertility of sandy soil. We conducted a field experiment with teak seedlings grown in sandy soil containing added bentonite and fertilizer. We hypothesized that the concurrent use of bentonite and fertilizer would increase the soil’s capacity for retention of nutrients in fertilizer and that the growth of teak seedlings should be accelerated by efficient nutrient uptake, and mitigate drought stress in dry season. To verify these hypotheses, we examined the ecophysiological traits of teak seedlings in early growth period, including (1) soil nutrient content, (2) seedling growth and biomass, (3) characteristics of photosynthesis and water use, and (4) concentrations of elements in plant organs. These parameters were compared among seedlings grown in untreated sandy soil, grown with a single use of fertilizer or bentonite, and grown with concurrent use of fertilizer and bentonite. In addition, symbiosis of arbuscular mycorrhizal (AM) fungi is important to the growth of teak seedlings [32]. We also observed colonization of AM fungi in the roots of the teak seedlings.

2. Materials and Methods

2.1. Study Site

We curried out the experiment at the Northeast Forest Seed Center, which is located in Khon Kaen Province in northeastern Thailand (16°16′ N, 102°47′ E, 191 m a.s.l.). The metrological data of this center was introduced by Kayama et al. [14]. Precipitation is concentrated from May to October, and other months are considered as dry season [14]. The sandy soil in this area is classified as an Acrisol in the FAO/Unesco soil taxonomy, and as an Ultisol in the USDA taxonomy [7,8].
On the selection on the suitable site for the planting of teak seedlings, we already estimated from the soil research, and categorized as five ranks [19]. Sandy soil is categorized third rank, and is considered as moderately suited soil [19]. Sandy soil is distributed over a large area in this province (13.5%) [19], and there is no natural teak forest in the sandy soil area. Farmers living in this area are interested in the cultivation of teak for its high timber quality [33]. Soil improvement is essential to accelerate the growth of teak planted in sandy soil area.

2.2. Selection of Experimental Plots and Preparation of the Land and Teak Seedlings

A sandy soil experimental plot, which covered 2016 m2, was selected as the site for our experiment. This site had been previously planted with teak seedlings under no-fertilization conditions [17]; however, many of these teak trees were dwarfed. We prepared the land in April 2014. All trees growing at this site were cut down, and their roots were removed.
We prepared teak seedlings by a tissue culture technique at the Ngao Silvicultural Research Station, Lampang, Thailand, and 520 teak seedlings were transported to the Northeast Forest Seed Center. The number of seedlings included was sufficient to replant the study area. The teak clone was selected from Mae Hong Son Province (clone number 21), and this clone has been planted in various locations of Thailand (Royal Forest Department).

2.3. Experiment

The following treatments were established: control (CON), fertilizer (FER), bentonite (BEN), and bentonite and fertilizer (BEN + FER). Three blocks of four treatments were established at the site, and their positions were randomized. The size of each block was 12 m × 10 m, with 2 m between blocks. Teak seedlings were planted as a buffer on the border between the blocks. After establishing the seedlings, we buried a concrete pole at the corner of each block.
We prepared the bentonite and fertilizer before planting. In June 2014, we prepared 120 kg sodium [Na] bentonite and 12 kg of chemical fertilizer (N: phosphorus [P]: potassium [K] = 15:15:15), which was purchased from a market in Thailand. After preparing these materials, 1 kg of bentonite was placed in separate plastic bags, and 100 g fertilizer was added to each plastic bag.
We planted 42 teak seedlings in each replicate block at the site during July 2014. The total number of teak seedlings planted was 504 (4 treatments × 3 replicates × 42 seedlings/replicate). The interval between seedlings was 2 m × 2 m, and 22 teak seedlings were planted outside the blocks as buffer trees. We targeted 20 teak seedlings per replicate block planted within the buffer trees. Before planting, we made a hole at the position of the teak seedling. The area of hole was 30 cm × 30 cm, and 30 cm of depth. The removed soil was collected, and 1 kg of bentonite or 100 g of fertilizer was mixed into it. The amount of fertilizer was the same as that used in a previous fertilization test in sandy soil [16]. After mixing, a teak seedling was planted in this hole and buried in the mixed soil. We also sampled 10 teak seedlings at this time. We collected 2 g of fine roots with diameters <2.0 mm and placed them in a solution of formaldehyde, acetic acid, and alcohol (FAA solution), where they were preserved at 4 °C. These samples were used to observe AM colonization by the following method. Other teak seedling organs were oven-dried at 70 °C for 3 days, and the dry masses of the leaves, stems, and roots were recorded.
We also inserted soil moisture sensors (SM150, Delta-T Devices Ltd., Cambridge, UK) into two blocks. The sensor logger was fixed to a concrete pole, and a soil sensor was inserted near the seedling.

2.4. Soil Analysis

We measured the texture, the CEC and chemical properties of sandy soil. On the subject of chemical properties, we analyzed pH, organic matter (OM), total N, exchangeable p and base cations (Ca, Magnesium [Mg], K and Na). We selected three seedlings from each replicate block located at three corners and collected surface (0–5 cm) soil samples under these seedlings in July 2014 and November 2015. For the measurement of soil pH, we prepared the suspended solution by addition of 10 g of fresh soil and 25 mL of distilled water, and mixing for 1 h [34]. After mixing, Soil pH was measured using a pH meter (SG2, Mettler Toledo, Zürich, Switzerland). The soil samples were air-dried prior to the chemical analysis.
The analysis of soil texture was used for the samples in July 2014, and determined by the hydrometer method [35]. The extraction solution for the CEC analysis was obtained by the rapid method [36] produced by Fujihira Industry Co. (Field Soil Doctor, Tokyo, Japan). The ammonia concentration of this solution was analyzed by the indophenol method [37] using a spectrophotometer (AE-VIS721, A and E Lab. Co., London, UK), and then the CEC value was calculated. The OM concentration was determined by the loss-on-ignition method [38]. Total N concentration was determined by the Kjeldahl method [38]. Exchangeable p was obtained using dilute acid fluoride [38] and shaking for 1 min. p in the extracted solution was analyzed by the molybdenum blue method [39] using a spectrophotometer (U-1800, Shimadzu, Kyoto, Japan). Exchangeable base cations were obtained by mixing 4 g of dry soil with 100 mL of 1 M ammonium acetate solution and shaking for 1 h [38]. The base cations in the extracted solutions were determined using an atomic absorption spectrophotometer (AAnalyst 300, Perkin-Elmer, Norwalk, CT, USA).

2.5. Measurement of Growth of Teak Seedlings

We measured the growth of 20 teak seedlings for three blocks of four treatments. The total number of seedlings was 60 for each treatment. Tree height and basal diameter were measured at six time points (July 2014, October 2014, February 2015, May 2015, July 2015, and November 2015). At these times, we also confirmed the number of dead teak seedlings.

2.6. Measurement of Photosynthetic Rate and Concentrations of Chlorophyll

We measured the area-based photosynthetic rate at light saturation (Psat) and stomatal conductance (gs) in healthy teak leaves at the second level from the top. Some teak seedlings had only immature or senescent leaves by short period of leaf turnover [14]. To unify mature and healthy teak leaves, we selected 9 teak seedlings from 20 seedlings (three individuals from each of three blocks), were used to measure the photosynthetic rate. We measured the photosynthetic rate in leaves that were 1 month old. We measured Psat five times (October 2014, February 2015, May 2015, July 2015, and October 2015), and the measurements were always performed between 09:00 and 11:00. Psat and gs were determined using a portable gas analyzer (LI-6400, LiCor, Lincoln, NE, USA) with an ambient temperature of 28 °C and an ambient CO2 concentration of 38.0 Pa. The supplemental LED light was 1800 µmol m−2 s−1 photosynthetic photon flux, which was a light saturation level.
After measurement, we collected 0.66 cm2 of teak leaf disks and stored them at −18 °C. For the extraction of chlorophyll in the leaves, we used dimethyl sulfoxide (DMSO), and determined using a spectrophotometer (AE-VIS721). The concentrations of chlorophyll a and b were calculated according to a previously reported equation [40].

2.7. Measurements of Leaf Water Potential and Concentrations of Chlorophyll

Leaf water potential of teak leaves was measured in February 2015 and May 2015 in the mid and late dry season. For the measurement of water potential, same leaves were used to measure the photosynthetic rate. In general, the leaf water potential was lowest in the afternoon because of transpiration and highest during the night after recovery of water [41]. We collected nine teak leaves from each treatment, placed in a plastic bag containing wet filter paper and stored at 6 °C. We determined water potential using a pressure chamber (Model 600, PMS Instrument Co., Albany, OR, USA) at 13:00–14:00 and 05:30–06:00 the next day.

2.8. Analysis of Biomass

The dry masses of leaves, stems, and roots were weighed to determine total biomass of the teak seedlings. We collected all of the organs from four teak seedlings in each of the three blocks randomly at the end of November 2015. The other teak seedlings were left so we could examine long-term effects on teak growth. We collected the aboveground organs, divided them into leaves and stems, and measured their fresh masses. We collected the largest leaf from the leaf samples and measured its length and width. Leaf area was calculated using an equation from Tondjo et al. [42] as follows:
A = 0.60 × L × Wi
where A is leaf area, L is leaf length, and Wi is leaf width.
In addition, about 100 g (fresh mass) of leaf and stem samples were collected and their fresh masses were measured. We collected leaves that were second from the top for analysis. These leaf and stem samples were placed in separate envelopes and oven-dried at 70 °C for 3 d. When the sample fresh mass was <100 g, all samples were placed in a single envelope. After drying, the dry mass of each component was determined and the moisture content was calculated. We calculated the dry mass of all leaves and stems based on their moisture content.
We collected root samples from the area of a circle with a radius of 50 cm from the same teak seedlings. The root samples were washed twice with tap water and air-dried for 12 h. After air-drying, the root fresh mass was measured. In addition, about 100 g (fresh mass) of root samples were collected, and their fresh mass was measured. These root samples were placed in envelopes and oven-dried at 70 °C for 3 days. After drying, the root dry mass of each sample was determined, and total root dry mass was calculated from the moisture content value. In addition, we collected 5 g (fresh mass) of fine roots with diameters <2.0 mm. The fine roots were placed in FAA solution, preserved at 4 °C, and used to observe AM colonization.
We then calculated the relative growth rate (RGR [41]) from the July 2014 and November 2015 data.

2.9. Analysis of Mycorrhizal Colonization and Element Concentrations in the Plant Organs

A previous experiment revealed that symbiosis with AM fungi helps teak seedlings acquire nutrients from sandy soil [14]. We observed AM colonization in the fine root samples preserved in FAA solution. The root samples were placed in 1 M KOH and cleared by boiling for 1 h. After boiling, the root samples were stained in 0.05% trypan blue in lactic acid and glycerol (1:1) by boiling for 15 min and then de-stained in lactic acid and glycerol (1:1). The root samples were placed on a Petri dish with a film ruled into 5 mm squares. We observed over 200 spots of roots intersected by grid lines at 7 to 45 × magnification using a stereomicroscope. AM colonization was calculated by the gridline intersect method, which is the ratio of the number of infected intersections per total number of root intersections [43].
We analyzed the concentrations of N, P, K, Ca, and Mg in the leaves (located second from the top) and fine roots using the dried plant organ samples. The leaves and fine root samples were washed with distilled water and oven-dried at 70 °C for 3 days. After drying, the leaf and root samples were ground into a fine powder using a sample mill (WB-1; Osaka Chemical Co., Osaka, Japan). We used NC analyzer (Sumigraph NC-220F, Sumika Chemical Analysis Service, Tokyo, Japan) for the analysis of concentration of N. The powdered samples were also used for the analysis of other elements, and we digested by the HNO3-HCl-H2O2 method [44]. The digested solution was used for the analysis of concentrations of P, K, Ca, and Mg, and determined by ICP analyzer (ICPE-9000, Shimadzu, Kyoto, Japan).

2.10. Statistical Analyses

First, we compared all of these parameters among the three blocks of each treatment using one-way ANOVA in Kyplot 5.0 (Kyens Lab. Inc., Tokyo, Japan). There were no significant differences among the three blocks. Thus, we pooled the mean values of parameters for each treatment.
For the soil texture, tree height, diameter, Psat, gs, concentrations of chlorophyll, leaf water potential, survival of seedlings, RGR, leaf area, mycorrhizal colonization, teak dry mass of each organ, and concentration of elements, we used a two-way ANOVA. We compared fertilizer, bentonite and their interaction. For the soil chemical properties, we used a three-way ANOVA, comparing fertilizer, bentonite, two periods of sampling, and their interactions.
To estimate the concentrations of nutrients needed to grow teak, we performed a correlation analysis of the concentration of elements in soils and in the leaves or roots, and the concentration of elements in the leaves or roots and the RGR.

3. Results

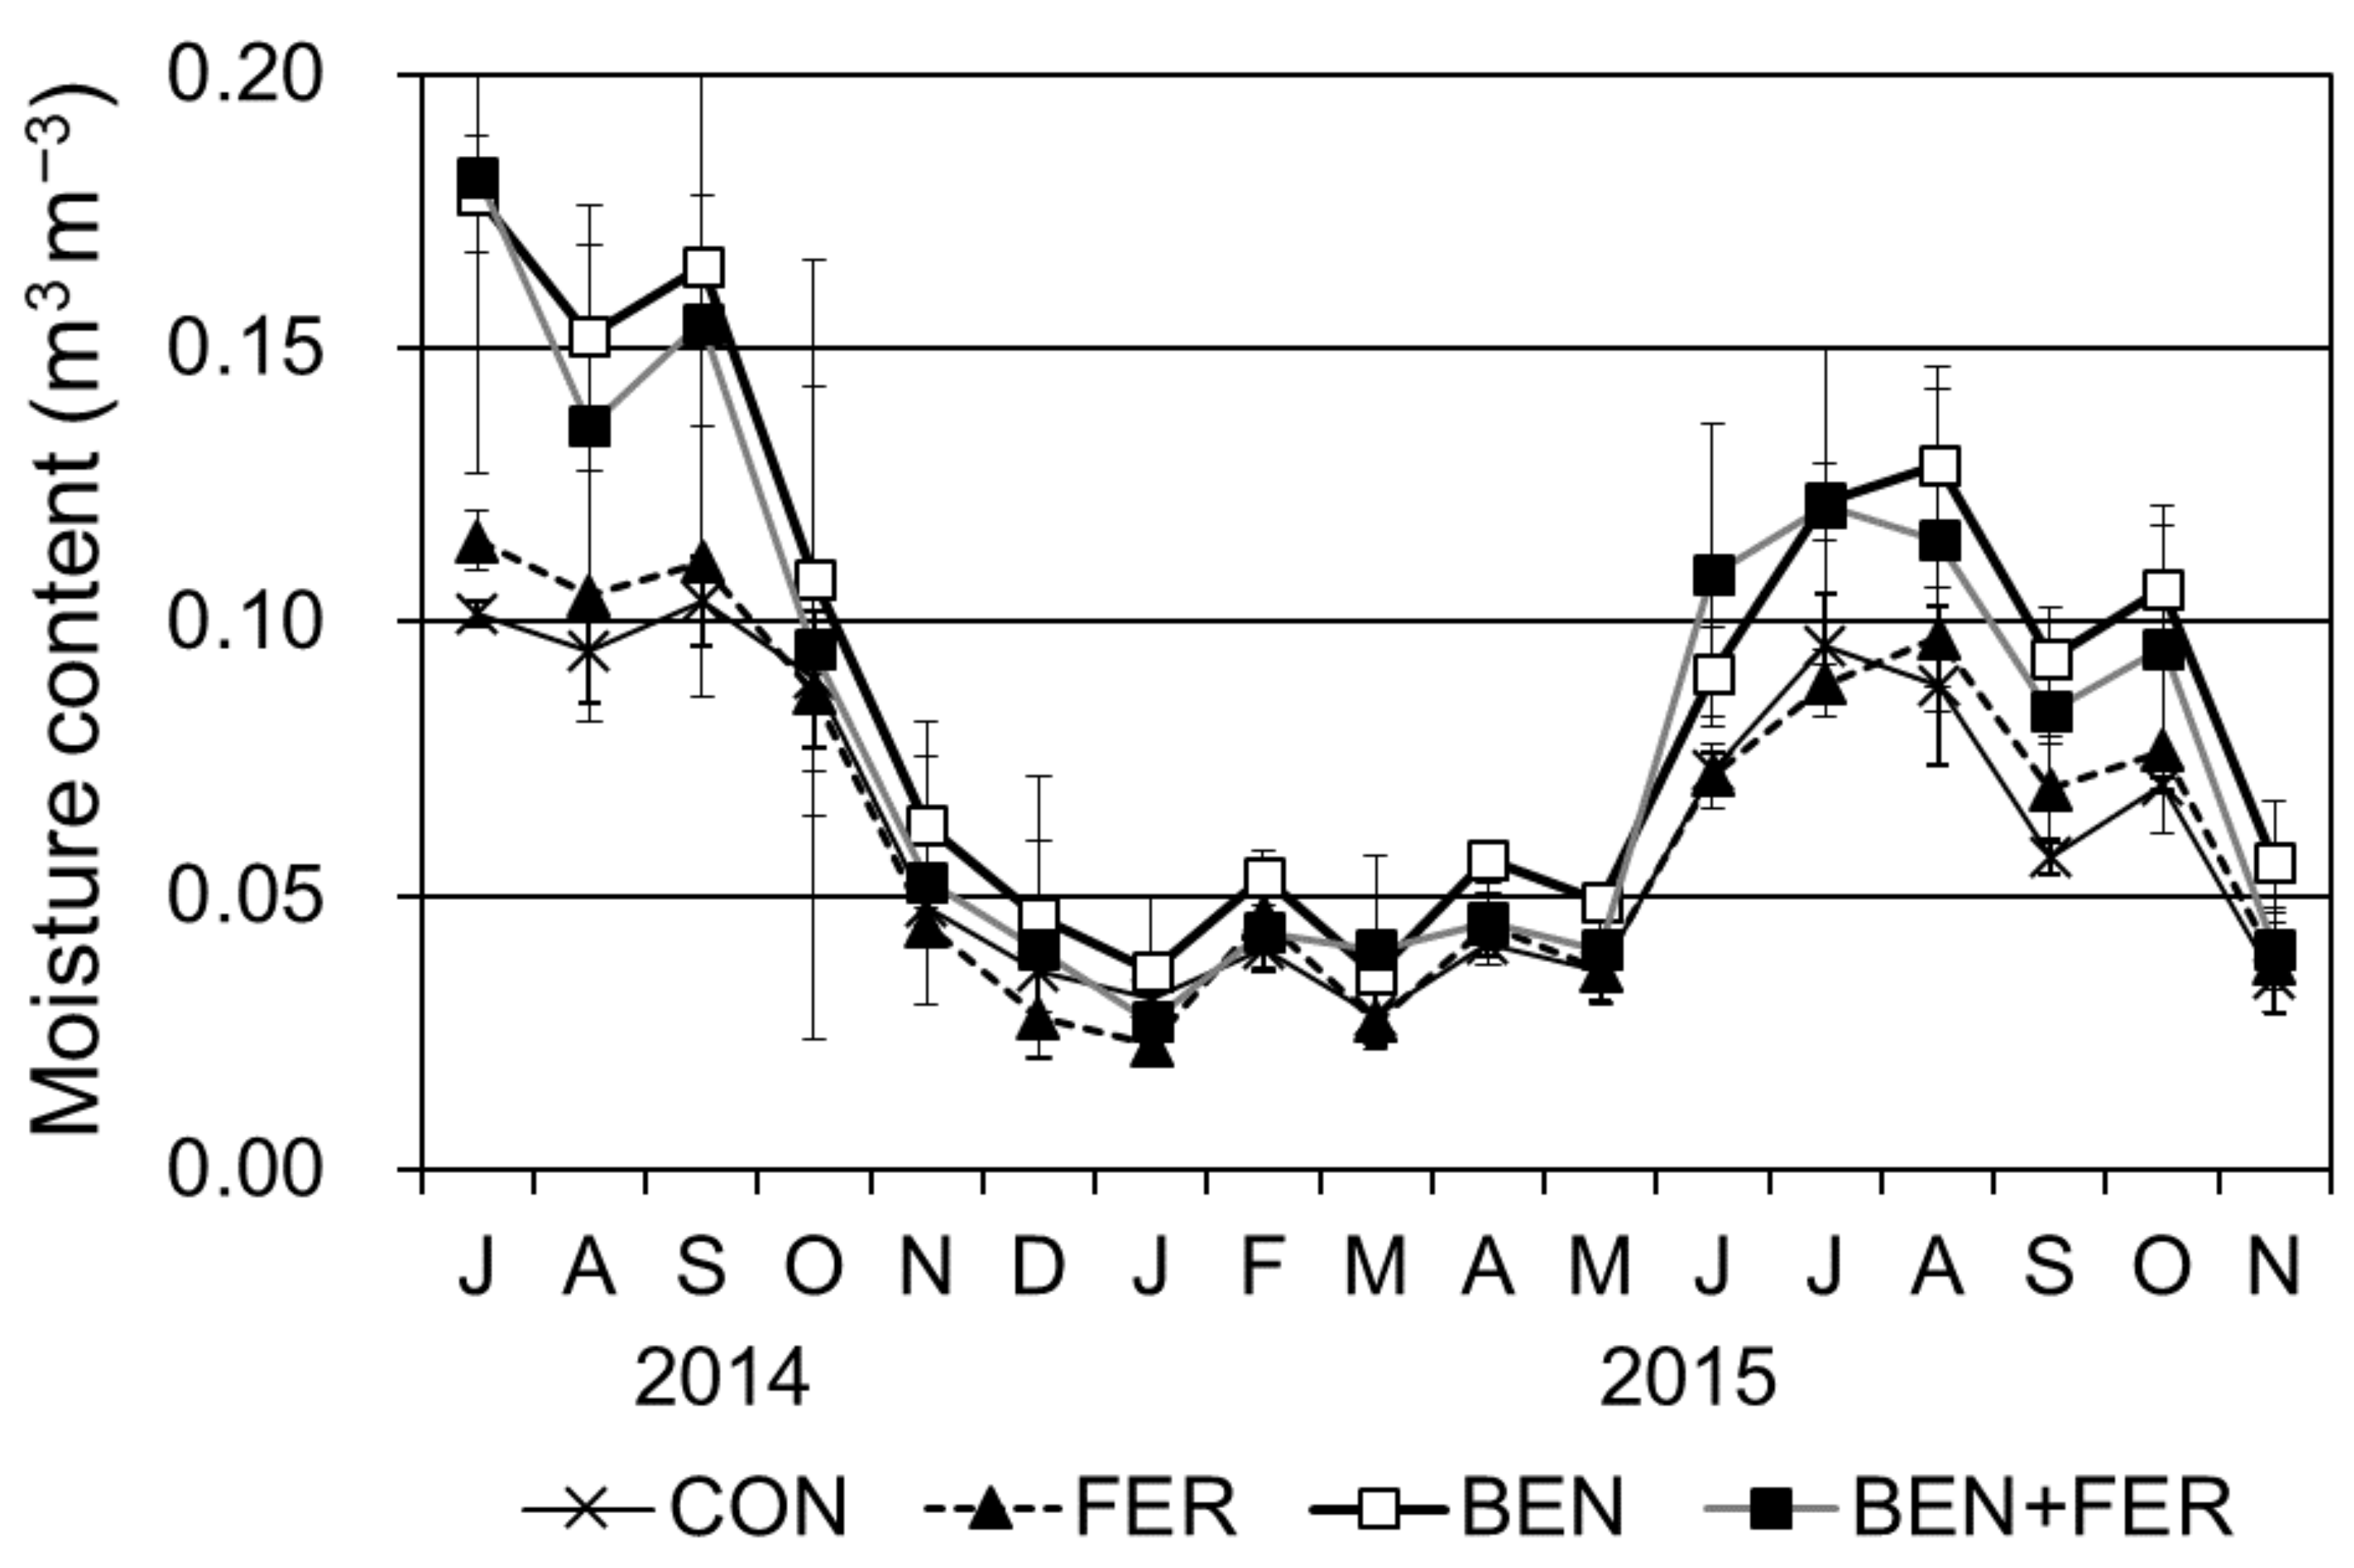
3.1. Soil Moisture Content

Average soil moisture content values in the four treatments are shown in Figure 1. Moisture content was low from January to May 2015, whereas moisture content was high during the rainy season (June–September 2014 and June–August 2015). Soil moisture content significantly differed between months (ANOVA, p < 0.001).
Significant differences were detected in the soil moisture content data with the use of bentonite by unification of all the data (ANOVA, p < 0.001). However, no significant differences were found with the use of bentonite for each month. Soil moisture content was higher in the BEN and BEN + FER treatments during the rainy season. In contrast, little difference was detected in soil moisture content among the four treatments during the dry season. We could not confirm the increase of soil moisture content at surface layer by application of bentonite in dry season.

3.2. Soil Properties

Regarding soil texture, the content of sand was about 80% for each treatment (Table 1), and the contents of sand, silt, and clay were no significant difference by use of fertilizer and bentonite (p > 0.05).
We examined the changes in pH, CEC, OM, and various nutrients to compare the data between July 2014 and November 2015 (Table 2). Soil pH showed significant differences between periods (p < 0.001), and its value was increased in November 2015. However, pH trends differed among the four treatments, and there were significant interactions between fertilizer and bentonite, fertilizer and period, and bentonite and period (p < 0.01). The CEC value showed a significant effect of fertilizer or bentonite (p < 0.01). The CEC value was highest in the BEN + FER treatment. The OM concentration showed a significant difference between the two periods (p < 0.001), and its values were decreased in November 2015. The concentration of N showed a significant difference between the use of fertilizer or bentonite and period (p < 0.001). However, N trends differed among four treatments, and there were significant interactions between fertilizer and bentonite, fertilizer and period, and bentonite and period (p < 0.05). The concentration of N was increased in November 2015, except in the case of the BEN + FER treatment.
The concentration of P showed a significant effect of fertilizer or bentonite (p < 0.01). The concentration of P showed a significant interaction between fertilizer and bentonite (p < 0.001), and the value was the highest in the BEN + FER treatment during two periods. The concentration of Ca showed a significant difference with use of fertilizer or bentonite and period (p < 0.01). The concentration of Ca was increased by the use of bentonite in November 2015, and there was a significant interaction between bentonite and period (p < 0.001). The concentration of Mg showed a significant effect of fertilizer or bentonite (p < 0.01), and its value was high with use of fertilizer in November 2015. In contrast, the concentration of Mg in November 2015 was decreased in the treatment with no fertilization, and there was a significant interaction between fertilizer and period (p < 0.01). The concentration of K showed a significant difference with the use of fertilizer and period (p < 0.001). The concentration of K was decreased with the fertilization treatment in November 2015, and there was a significant interaction between fertilizer and period (p < 0.001). The concentration of Na showed a significant difference with the use of fertilizer or bentonite (p < 0.001). The concentration of Na was decreased in the BEN + FET treatment, and increased in the CON treatment. As a result, there were significant interactions between fertilizer and period, and bentonite and period (p < 0.001).

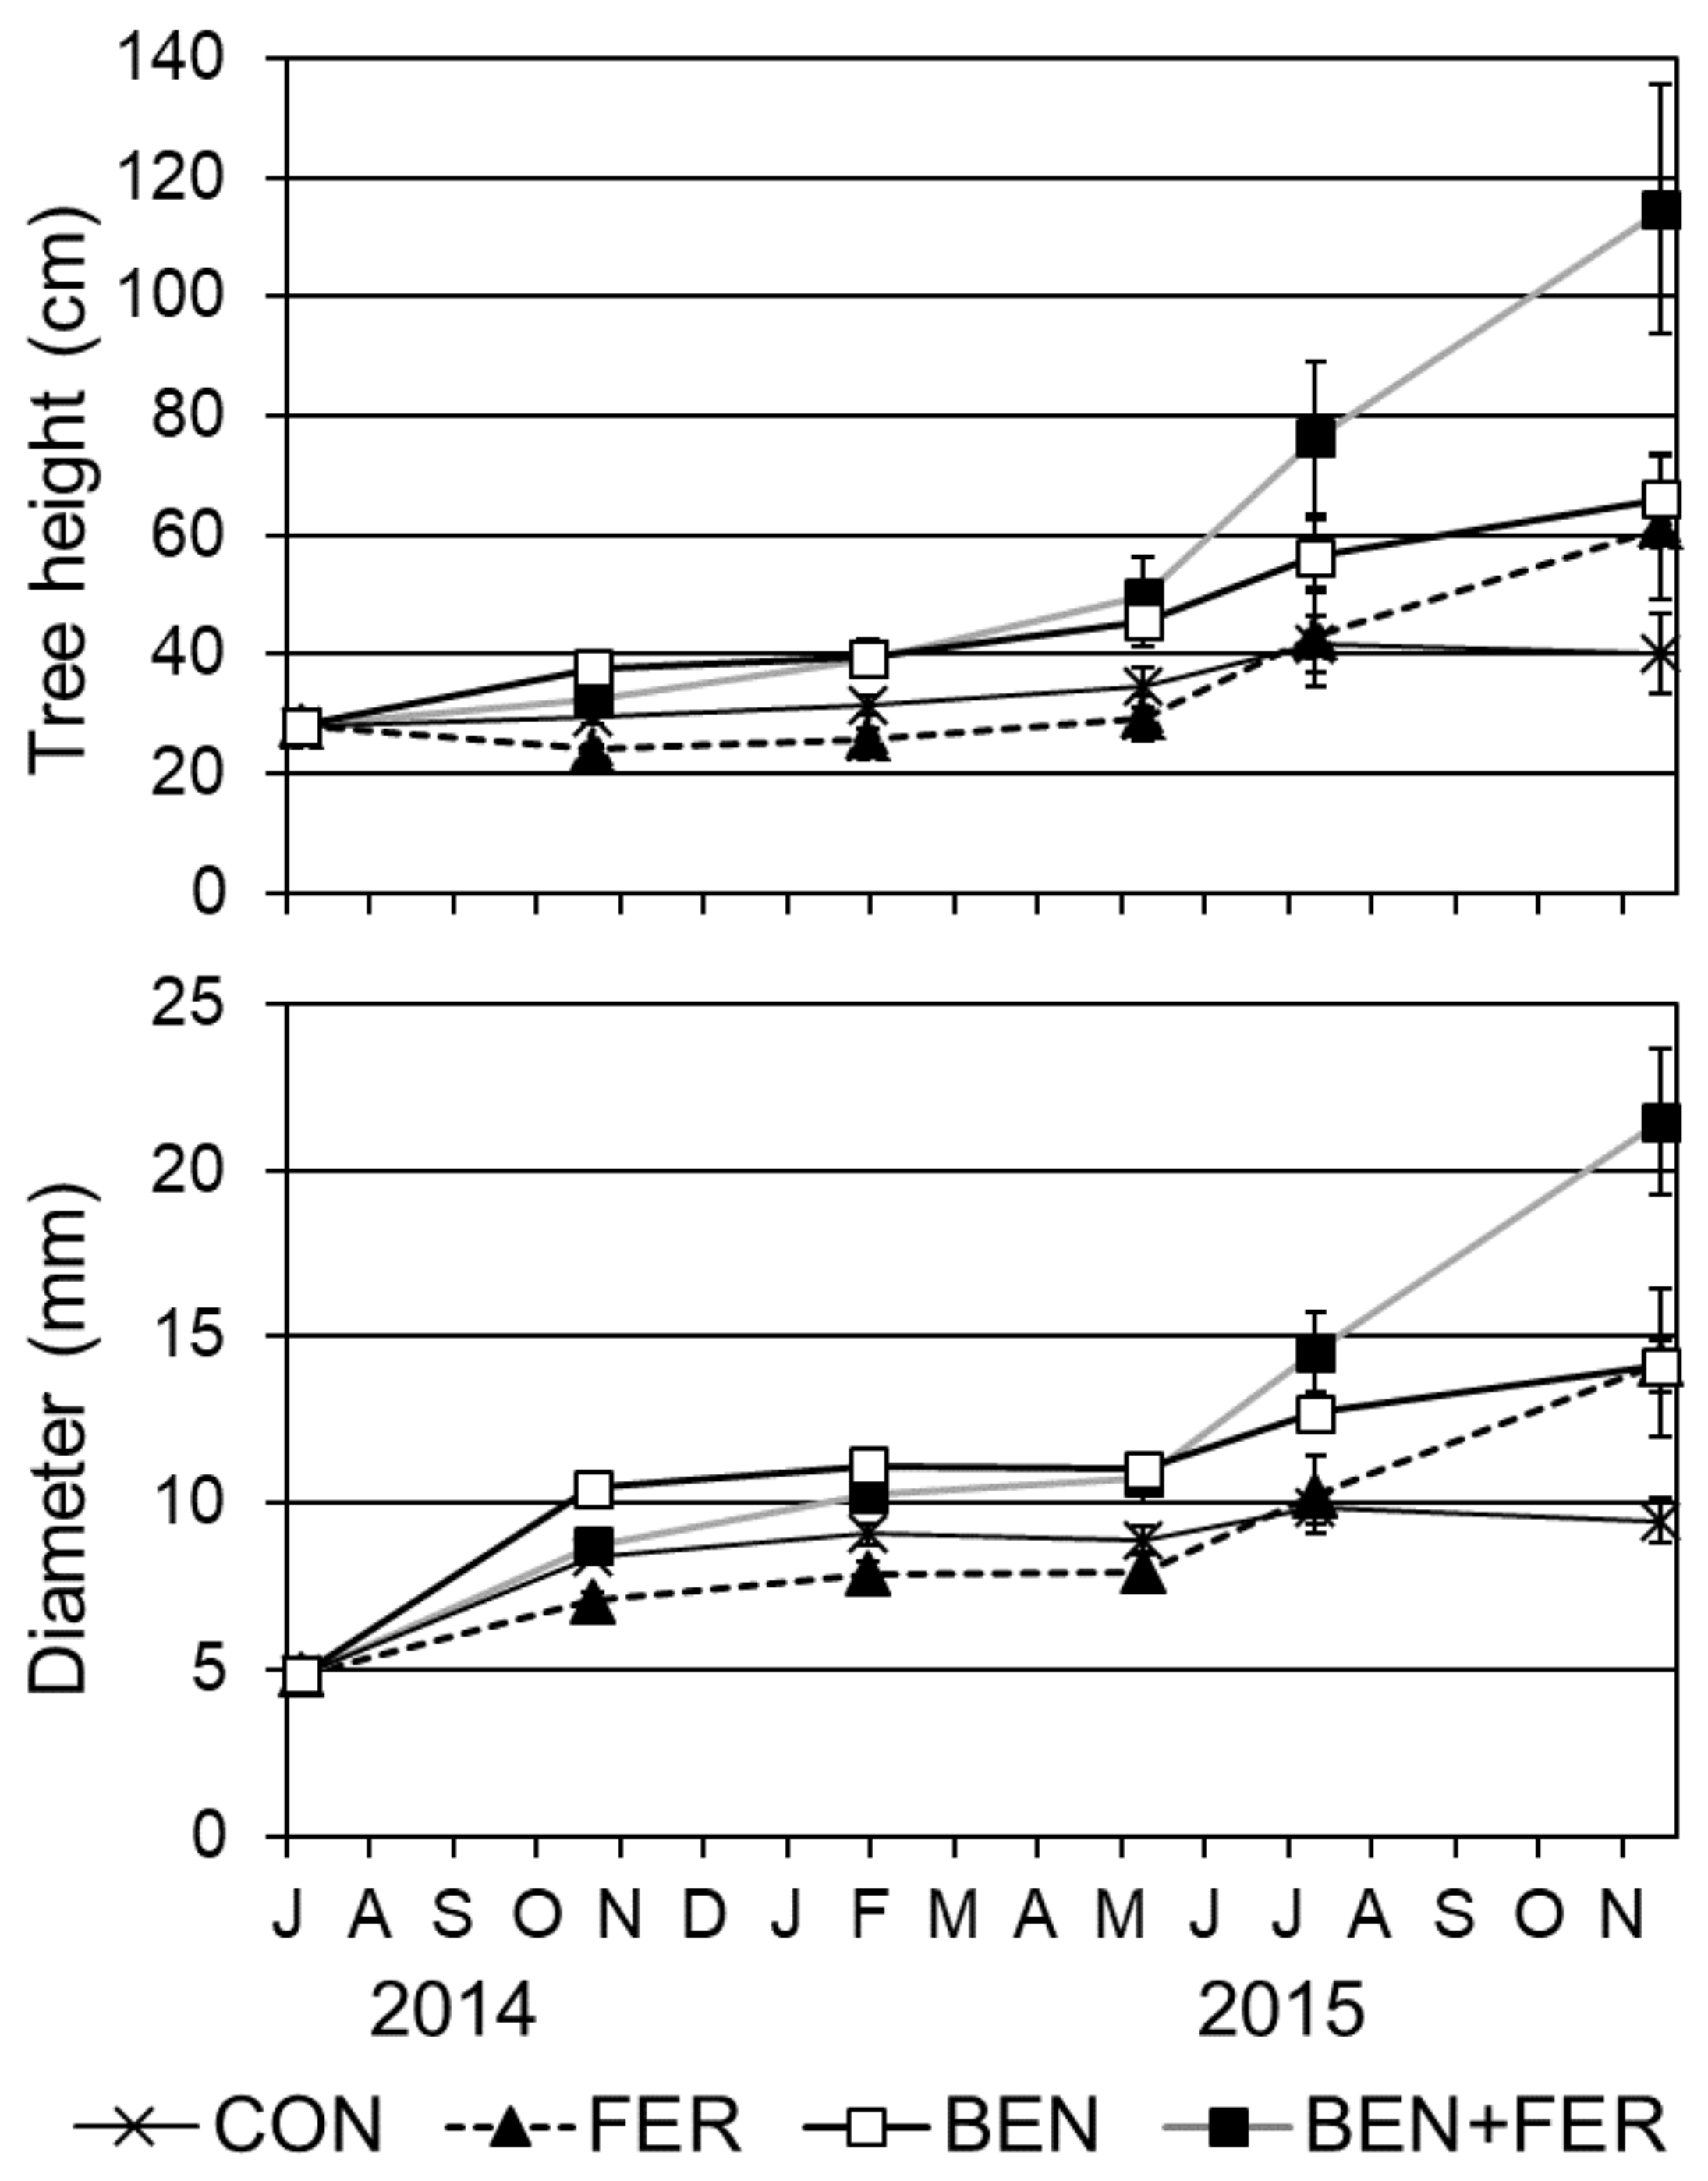
3.3. Growth of Teak Seedlings

From October 2014, tree height and diameter were significantly different among the four treatments (Figure 2). Tree height and diameter showed a significant effect of bentonite, and their values were increased by application of bentonite (Table 3, p < 0.001). On the effects of fertilizer, tree height and diameter showed a significantly difference in October 2014 and November 2015 (p < 0.001). Tree height and diameter were increased by use of fertilizer in November 2015, whereas these values were decreased in October 2014.
Teak seedlings of fertilization treatment were dead gradually from December 2014. Dead teak seedlings were also confirmed for no fertilization treatment from February 2015. Based on the data of dead teak seedlings, we calculated survival rate for each block for the four treatments in November 2015 (Table 4). The FER treatments showed high mortality, the survival rate at the end of the experiment was 20.0%. In contrast, BEN treatment showed the highest value of the survival rate (66.7%). The survival rate showed a significant effect of fertilizer, and their values were decreased by application of fertilizer (p < 0.05).

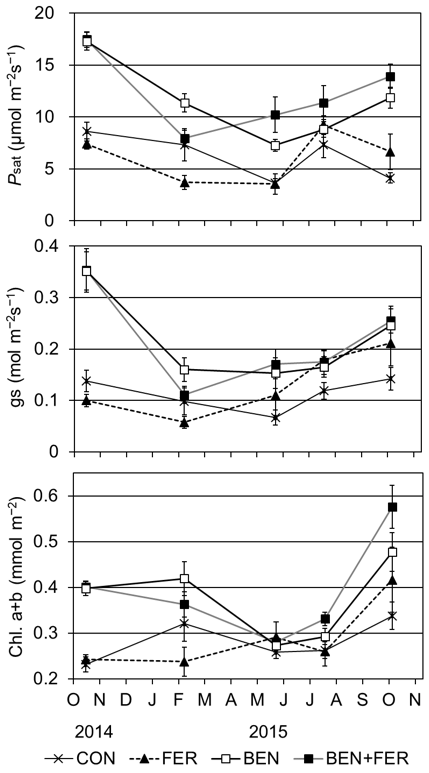
3.4. Photosynthetic Rate

The Psat and gs values showed a significant effect of bentonite except in July 2015 (Table 3, p < 0.05). Psat and gs showed their highest values in the BEN and BEN + FER treatments in October 2014, and the values were decreased in February and May 2015 (Figure 3). In February 2015, the Psat and gs values showed a significant effect of fertilizer (Table 3, p < 0.05). Moreover, Psat in July and October 2015 showed a significant effect of fertilizer (p < 0.05). The values of Psat were low in the FER treatments until May 2015; however, these values increased at the beginning of July 2015 (Figure 3).
The concentrations of chlorophylls were significantly affected by use of bentonite, except in May 2015 (Table 3, p < 0.05). In these periods, chlorophyll concentrations showed high values with use of bentonite (Figure 3). The BEN + FER treatment had the highest chlorophyll values during the experimental period in October 2015. In addition, the concentrations of chlorophylls significantly differed with use of fertilizer in February 2015 (Table 3, p < 0.05). In this period, the concentration of chlorophyll was low in the FER treatment (Figure 3).

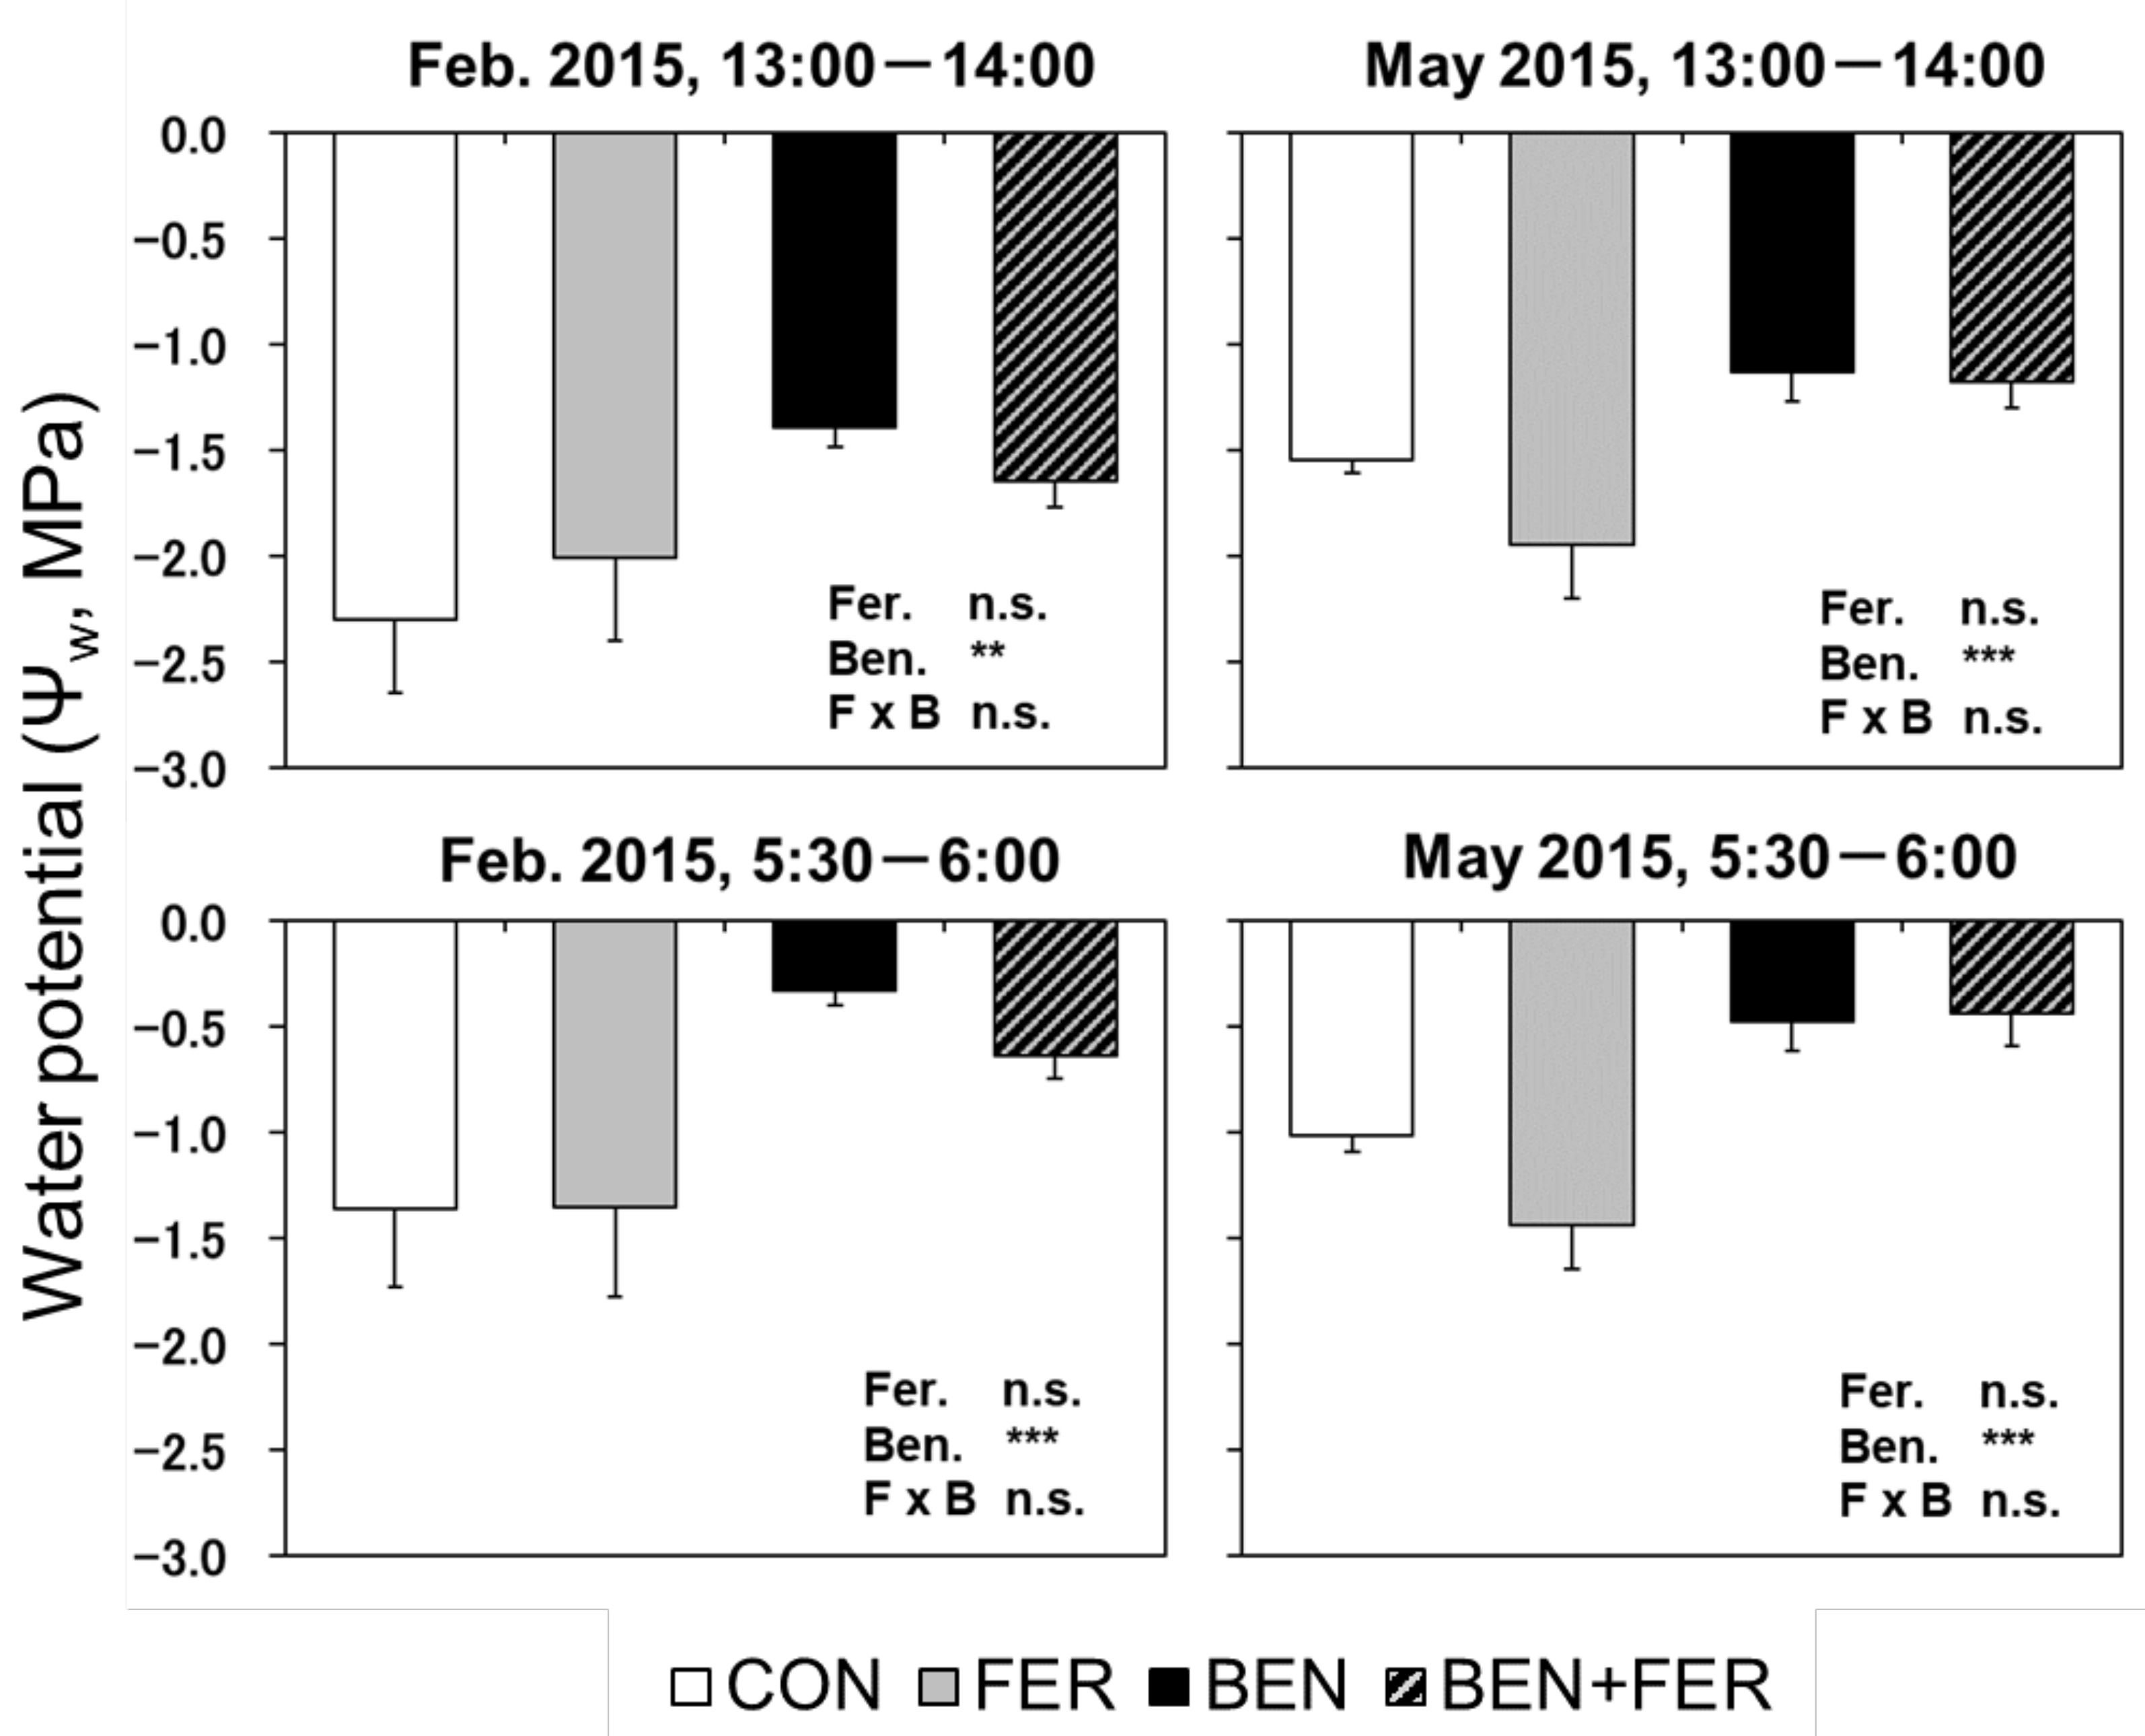
3.5. Leaf Water Potential

Leaf water potential showed a significant difference with the use of bentonite (p < 0.01), and its value was high in the BEN and BEN + FER treatment (Figure 4). In contrast, the water potentials of the CON treatment in February 2015 and FER treatment in May 2015 were the lowest, and their values were <−1.9 MPa.
The leaf water potential value at predawn showed a significant difference with the use of bentonite (p < 0.001), and its value in the BEN and BEN + FER treatment was increased compared with the value in the afternoon (Figure 4). In contrast, water potential values in CON and FER treatments were <−1.0 MPa in February and May 2015.

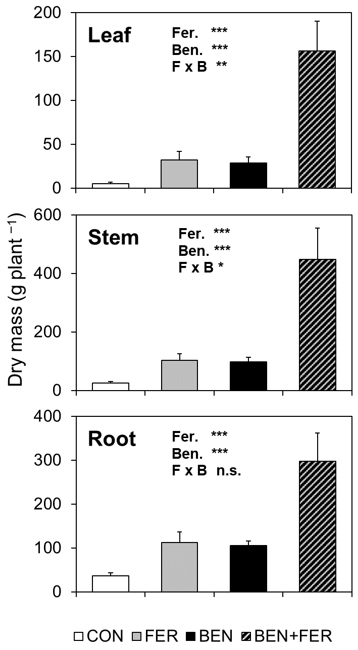
3.6. Biomass and Growth Parameters of Teak Seedlings

The average leaf, stem, and root dry masses at the beginning of the experiment were 1.6, 1.5, and 2.1 g, respectively. The AM colonization value was 21%.
The dry masses of each organ at the end of the experiment were significantly affected by use of fertilizer or bentonite (Figure 5, p < 0.001). The values of dry masses were markedly increased in the BEN + FER treatment. For leaf and stem dry masses, there was a significant interaction between fertilizer and bentonite (p < 0.05), and their increases were not obvious for the BEN treatment. The dry mass of each organ in the CON treatment was quite small.
The values of RGR and leaf area showed a significant difference with use of fertilizer or bentonite (Table 4, p < 0.001). High values of RGR and leaf area were detected in the BEN + FER treatment. AM colonization showed a significant effect of bentonite (Table 4, p < 0.05), and its value was high in the BEN treatment.

3.7. Nutrient Concentrations

The N and P concentrations in leaves and roots showed a significant effect of fertilizer (Table 5, p < 0.01), and these values were increased by fertilization. For the N concentration in roots, the value of the BEN + FER treatment was not high compared with the BEN treatment; as a result, there was a significant interaction between fertilizer and bentonite (p < 0.05). The K concentration in the roots showed a significant effect of fertilizer or bentonite (p < 0.05), and its value was increased by use of bentonite and fertilizer. However, the concentration of K in BEN treatment was not high compared with CON treatment. Therefore, we examined total content of K in roots by multiplying root dry mass and concentration of K. Total content of K in roots was 144 mg for CON treatment, 587 mg for FER treatment, 452 mg for BEN treatment, and 2120 mg for BEN + FER treatment. Content of K in roots showed a significant effect of fertilizer or bentonite (p < 0.01, ANOVA).
The Ca concentrations in leaves showed a significant effect of fertilizer (Table 5, p < 0.001), and its value was increased by fertilization. The Mg concentration in the leaves and roots showed a significant effect of bentonite (p < 0.01). The Mg concentration in the leaves and roots was decreased with the use of bentonite.
For the relationship between nutrient concentrations in the soils (sampled in Nov. 2015) and plant organs, positive relationship was observed for the N and P concentrations in leaves, and K concentrations in roots (Table 6, p < 0.01). For the relationship between RGR and nutrient concentrations in plant organs, a positive relationship was observed between the RGR and P concentration in the leaves (Table 6, p < 0.001). For the nutrients in roots, a positive relationship was detected between RGR and the K concentration (p < 0.001), whereas a negative relationship was observed between RGR and Ca concentration (p < 0.01).

4. Discussion

4.1. Effects of Fertilizer and Bentonite on Soil

With regard to the effects of application of fertilizer, we confirmed not only an increase in N, P, and K, but also an increase in CEC, Ca, and Mg (Table 2). The chemical fertilizer used in our experiment probably contained Ca and Mg in the secondary material; as a result, these nutrients were also increased by application of fertilizer. Based on the soil dry mass in a hole (42 kg) and concentrations of Ca and Mg in soil, we quantified the contents of these nutrients in fertilizer. 100 g of fertilizer was contained 1.1 g of Ca and 0.2 g of Mg. Additionally, there is a possibility that fertilizer might have contained material that would increase the CEC value. In the case of bentonite, CEC, Ca, and Mg were increased (Table 2). Bentonite was contained Na; however, its concentration was decreased at the end of experiment for BEN + FER treatment (Table 2). In contrast, application of bentonite did not change the texture (Table 1).
At the end of the experiment, soil pH was increased by treatment with fertilizer and bentonite (Table 2). This trend may be attributable to the increase in CEC with use of fertilizer or bentonite. Moreover, the use of bentonite increased the concentration of Ca in the soil (Table 2). In contrast, the FER treatment did not increase the Ca in the soil, and fertilizer had no capacity to increase Ca. Thus, we confirmed that application of bentonite alone can increase Ca in the soil. We also examined the retentive capacity of the bentonite with regard to the nutrients in fertilizer. Concentration of P in soil was maintained for the BEN + FER treatment until November 2015, despite the lack of increase in the BEN treatment (Table 2). In contrast, the concentrations of N and K in the soil were decreased for the BEN + FER treatment in November 2015 (Table 2). Thus, bentonite has a retentive capacity for P in fertilizer.
The trait to increase CEC by application of fertilizer is originated from the increase of soil colloid retention by application of K ions [45]. According to Bhatt [46], there have been cases where the use of fertilizer increased CEC and concentrations of Ca and Mg in soil. In the case of bentonite, Mg was increased by application of bentonite, whereas Ca was not increased [14]. Therefore, the increase of Ca by application of bentonite is probably concerned by long period of soil improvement. Noble et al. [26] and Soda et al. [47] reported that application of bentonite increased soluble inorganic sources of cations; as a result, pH and concentrations of various cations were increased in the soil. On the mechanism to increase cations in soil, sodium bentonite has a characteristic to bind Ca2+ ion from pore water in natural soil, and exchange Na+ ion in the double layer of bentonite [48]. The exchanged Ca2+ ion at the site of landfill was increased for two years by use of geosynthetic clay liners, which contained sodium bentonite [48]. This exchanging is enhanced by dry-wet-cycles, and evaporation of water cause the ion concentration in pore water to rise [48]. Thus, application of bentonite may be able to bind Ca from the pore water in sandy soil, as a result, the concentration of Ca in the soil may be increased at the end of experiment. The increase of Ca in soil by application of sodium bentonite may be a peculiar characteristic at the region of the climate with dry season.
Moreover, sodium bentonite is prepared by exchanging of polymeric metal species such as aluminum [Al] [49]. Modified bentonite consists chemical complex of Al3+, and called Al pillared bentonite. The Al3+ in Al pillared bentonite can bind anion of phosphate [49], as a result, P in fertilizer probably retain by application of bentonite. The effects of the increase of Al was little by application of bentonite [14]. Bentonite is utilized as a slow-release fertilizer material [29,50]. Concurrent use of bentonite and fertilizer may play a similar role to that of slow-release fertilizer.

4.2. Effects of Fertilizer and Bentonite on Teak Biomass

The teak seedlings in the BEN + FER treatment had the largest tree height, diameter and dry masses for each organ and the largest leaf area values at the end of the experiment (Figure 2 and Figure 5 and Table 3). Application of bentonite showed positive effect for increase of tree height and diameter of teak seedlings from October 2014 (Figure 2, Table 3). In contrast, the effects of fertilizer for the growth of teak was late compared with bentonite, and growth acceleration by fertilizer was shown after July 2015 (Figure 2, Table 3). Thus, the use of bentonite resulted in accelerated growth of teak seedlings in sandy soil, and effects of fertilizer is appeared after one year. On the effects of nutrients for the application of bentonite, only K in the roots showed a significant increase in concentration and total content with use of bentonite (Table 5). Thus, bentonite had little capacity to increase the concentration of nutrients in the plant organs.
Croker et al. [51] reported an obvious increase in the concentration of K in plant organs with application of bentonite, and this trend was attributed to its migration by diffusion when there was high soil water content. We confirmed an increase in soil moisture in the BEN and BEN + FER treatments during the rainy season (Figure 1). Thus, the increase in uptake of K was probably attributable to migration by diffusion under the high soil water content of the BEN treatment.
To estimate total nutrient uptakes, we examined the total content of each nutrient, which was calculated using the concentration of nutrients and dry mass of leaves or roots. The total content of each nutrient in the leaves and roots showed markedly high values in the BEN + FER treatment and a significant difference with use of fertilizer or bentonite (data not shown, p < 0.05 ANOVA). Thus, large amounts of nutrients were absorbed from the soil in the BEN + FER treatment, which accelerated teak seedling growth. Several reports have indicated that plant production by concurrent use of bentonite and fertilizer was larger than that by single use of fertilizer [24,31]. Thus, the use of bentonite contributes to efficient uptake of the fertilizer.
The teak seedlings in the BEN treatment showed significant high values of height and diameter from October 2014 (Figure 2), and significant large dry masses for each organ at the end of experiment (Figure 5). However, the values of dry masses in the BEN treatment were much smaller than those in BEN + FER treatment (Figure 5). Thus, growth of teak seedlings in the BEN treatment is probably suppressed by nutrient deficiency.
We examined nutrient deficiency in the leaves according to the values of Zech and Drechsel [52]. The concentrations of N, P and Ca for visible symptoms of deficiency were below 12.0 mg g−1, 1.0 mg g−1, and 5.5 mg g−1, respectively [52]. We did not confirm a deficiency of N in leaves in each treatment (Table 5). We also confirmed that more than 80% of the teak seedlings in each treatment were colonized by AM fungi (Table 4). Numerous studies have reported that AM fungi play an important role acquiring N [53]. Raghu et al. [32] confirmed that teak seedlings were increased the uptake of N after inoculation of AM fungi. Thus, indigenous AM fungi distributed in the sandy soil environment might have infected the roots of teak seedlings, which could have enhanced N uptake. Moreover, Ca in the leaves did not show a deficiency in the BEN and BEN + FER treatments (Table 5). In contrast, a deficiency in P was shown for the CON and BEN treatments (Table 5). Therefore, the limiting factor to growth suppression of BEN treatment is probably P deficiency in leaves. Similar results were shown in a pot experiment by single use of bentonite [14], and growth acceleration was not confirmed. Fertilization with P is essential to prevent a deficiency in teak seedlings.
We also verified the most effective nutrients for growth acceleration of teak seedlings. Based on the correlation coefficient, the RGR showed a significant positive correlation with K in the roots and P in the leaves (Table 6). K in the roots and P in the roots were also associated from these concentrations in the soils (Table 6). Thus, the teak seedlings grown on the habitats of high concentrations of K and P in soils can accumulate K in the roots and P in the leaves; as a result, teak seedlings are accelerated their growth.
Behling et al. [54] reported the nutrient dynamics in teak roots. Teak has a characteristic low efficiency of K uptake, and teak demands a greater amount of K in the roots [54]. Chanan et al. [55] also reported a relationship between growth and nutrients in leaves, and P is a macronutrient that limits teak growth. Thus, the level of accumulation of K in roots and P in leaves likely affects the growth of teak.
On the other hand, many teak seedlings of fertilizer treatment were died from December 2014, and the survival rate in November 2015 was significantly decreased (Table 4). Previous experiments reported that the use of fertilizer decreased the survival of seedlings of woody species [56]. When a seedling is exposed high salt concentration around the roots, dehydration occurs [56]. Especially, low CEC soil, such as sandy soil of this experiment can be associated with serious damage to plants by fertilizer [57]. Thus, fertilization treatments may enhance the damage caused by fertilizer.

4.3. Effects of Fertilizer and Bentonite on Physiological Characteristics

High Psat values were observed in the teak seedlings from the BEN treatment in October 2014 and February 2015 (Figure 3). In addition, a high Psat value was observed in the BEN + FER treatment during October 2015 (Figure 3). In contrast, the N and P concentrations, which were positively associated with the photosynthetic rate [41,58,59], did not show high concentrations (Table 5). However, the chlorophyll concentrations were high at the same time (Figure 3). Chlorophyll concentrations are closely related to photosynthetic rate [60,61]. Thus, the photosynthetic rate in teak leaves is regulated by the concentration of chlorophyll in the leaves.
Moreover, high leaf water potential values at predawn were detected in the BEN and BEN + FER treatments in the dry season (Figure 4). Thus, teak seedlings treated with bentonite probably took up water from deep soil layer during the night, so the predawn leaf water potential was high. In addition, AM colonization was significantly increased by application of bentonite (Table 4).
Nemec [62] reported that the use of bentonite enhanced the development of hyphae of AM fungi. This trait is probably concerned the increase of Ca in soil by application of bentonite. Several reports showed the increase of the colonization of AM fungi by application of Ca [63,64]. In addition, the development of hyphae of AM fungi enhances water uptake and increases drought stress tolerance [65]. Thus, teak seedlings treated with bentonite can enhance water uptake by the development of hyphae of AM fungi. As a result, bentonite mitigated drought stress in the teak seedlings during the dry season. A similar trend was confirmed by our preliminary experiment [14] and a crop experiment [66].
In contrast, low Psat, gs, and chlorophyll concentrations were observed in the FER treatment during October 2014 and February 2015 (Figure 3). February 2015 was the middle of dry season, and leaves suffered from drought stress owing to low leaf water potential at predawn (Figure 4). Suppression of these parameters in the FER treatment is probably attributable to drought stress. In contrast, October 2014 was not in the dry season; however, the Psat, gs, and chlorophyll concentrations showed low values. We could not explain this result by climatic conditions, and we analyzed the concentration of nutrients in the leaf during the same period. The concentration of N in the CON treatment in October 2014 was 34.0 mg g−1.
The concentration of N in teak leaves does not typically exceed 30 mg g−1 in the wild [52,67], and this concentration is probably considered an excessive level. One study reported that the concentration of chlorophyll, photosynthetic rate, and stomatal conductance decrease in woody species raised with over 30 mg g−1 N in the leaves [68]. Thus, excess N might have suppressed various physiological parameters in the FER treatment.

5. Conclusions

Based on a preliminary pot experiment, we concluded that bentonite would be useful for improving water content of sandy soil. In contrast, the growth of teak seedlings of pot experiment was not accelerated because of few nutrients in bentonite. Based on previous results, we curried out a verification test with fertilizer and bentonite by planting teak seedlings in a field environment, and monitored early growth period. We confirmed that bentonite had high retentivity of P in fertilizer, and teak seedlings absorbed nutrients efficiently with the application of bentonite and fertilizer. We also confirmed the accumulation of K in roots with the application of bentonite. Moreover, the soil Ca concentration increased during the experimental period, and teak did not show a Ca deficiency without application of Ca. Water availability was increased, and drought stress in the teak seedlings was mitigated by the application of bentonite. Based on these positive effects on the concurrent use of bentonite and fertilizer, teak seedlings showed markedly growth acceleration. In contrast, a single use of bentonite did not clearly accelerate the growth of teak because of the effect of P deficiency. The single use of fertilizer increased biomass and nutrients in the plant organs; however, the photosynthetic rate was decreased and drought stress ensued. As a result, the use of fertilizer alone showed high mortality, and did not promote marked growth acceleration.
We concluded that the concurrent use of fertilizer and bentonite showed a synergistic effect for the growth of teak seedlings. This method was useful for accelerating the growth of teak seedlings in sandy soil in northeast Thailand. In particular, we confirmed the beneficial effects of bentonite, which has not been widely studied for its application to silviculture. In contrast, we also confirmed that fertilization of teak seedlings was better after first dry season. In the future, we intend to examine the quantitative effects of bentonite to establish silviculture methods.

Author Contributions

Conceptualization: M.K. and R.Y.; investigation and data curation: M.K. and S.N.; methodology: M.K.; project administration and resources: S.H. and W.H.; supervision: W.H. and I.N.; writing—Original draft: M.K.; writing—Review and editing: S.H., R.Y., W.H. and I.N. All authors have read and agreed to the published version of the manuscript.

Funding

Supporting by non-profit organization (Ministry of Agriculture, Forestry and Fishery).

Institutional Review Board Statement

Not applicable.

Informed Consent Statement

Not applicable.

Data Availability Statement

The data presented in this study are available on request from the corresponding author. The data are not publicly available due to policy of the institute.

Acknowledgments

We thank the researchers of the Royal Forest Department (RFD) and Takuya Kajimoto for their invaluable comments on this study. We are grateful to the technical staff of Northeast Forest Seed Centre, Khon Kaen Province for their technical assistance. Thanks are due to the technical staff of the Plantation Silviculture Subdivision and the Forest Soil Subdivision for their support of our experiment. We thank the staff of the Japan International Research Center for Agricultural Science (JIRCAS) for transporting the samples and analyzing the plant organs. This study was conducted as a joint research project between the RFD and JIRCAS as part of a program to improve techniques for utilizing forest resources and promote sustainable forestry methods.

Conflicts of Interest

We declare that our research has no conflict of interest.

References

  1. Tewari, D.N. A Monograph of Teak (Tectona grandis Linn. f.); International Book Distributors: Dehra Dun, India, 1992; p. 479. [Google Scholar]
  2. Kaosa-ard, A. Teak (Tectona grandis Linn. f) Its Natural Distribution and Related Factors. Nat. Hist. Bull. Siam Soc. 1989, 29, 55–74. [Google Scholar]
  3. Tanaka, N.; Hamazaki, T.; Vacharangkura, T. Distribution, Growth and Site Requirements of Teak. Jpn. Agric. Res. Q. 1998, 32, 65–77. [Google Scholar]
  4. Barroso, D.G.; Figueiredo, F.A.M.M.A.; Pereira, R.C.; Mendonça, A.V.R.; Silva, L.C. Macronutrient Deficiency Diagnosis in Teak Seedlings. Rev. Árvore 2005, 29, 671–679, (In Portuguese and English Summary). [Google Scholar] [CrossRef]
  5. Zhou, Z.; Liang, K.; Xu, D.; Zhang, Y.; Huang, G.; Ma, H. Effects of Calcium, Boron and Nitrogen Fertilization on the Growth of Teak (Tectona grandis) Seedlings and Chemical Property of Acidic Soil Substrate. New For. 2012, 43, 231–243. [Google Scholar] [CrossRef]
  6. Gopikumar, K.; Varghese, V. Sand Culture Studies of Teak (Tectona grandis) in Relation to Nutritional Deficiency Symptoms, Growth and Vigour. J. Trop. For. Sci. 2004, 16, 46–61. [Google Scholar]
  7. Food and Agriculture Organization. An Explanatory Note on the FAO World Soil Resources Map at 1:25,000,000 Scale; World Soil Resources Reports 66; FAO: Rome, Italy, 1993; p. 64. [Google Scholar]
  8. Kyuma, K. Soil Resources and Land Use in Tropical Asia. Pedosphere 2003, 13, 49–57. [Google Scholar]
  9. Eswaran, H.; Padmanabhan, E. Tropics and Sub-Tropics, Soil of the. In Encyclopedia of Soil Science; Lal, R., Ed.; Marcel Dekker Inc.: New York, NY, USA, 2002; pp. 1342–1345. [Google Scholar]
  10. Salifu, K.F. Site Variables Controlling Teak (Tectona grandis) Growth in the High Forest Zone of Ghana. J. Trop. For. Sci. 2001, 13, 99–108. [Google Scholar]
  11. Huy, B.; Tri, P.C.; Triet, T. Assessment of Enrichment Planting of Teak (Tectona grandis) in Degraded Dry Deciduous Dipterocarp Forest in the Central Highland, Vietnam. South. For. J. For. Sci. 2018, 80, 75–84. [Google Scholar] [CrossRef]
  12. Ghiberto, P.J.; Libardi, P.L.; Trivelin, P.C.O. Nutrient Leaching in an Ultisol Cultivated with Sugarcane. Agric. Water Manag. 2015, 148, 141–149. [Google Scholar] [CrossRef]
  13. Suzuki, S.; Noble, A.D.; Ruaysoongnern, S.; Chinabut, N. Improvement in Water-Holding Capacity and Structural Stability of a Sandy Soil in Northeast Thailand. Arid. Land Res. Manag. 2007, 21, 37–49. [Google Scholar] [CrossRef]
  14. Kayama, M.; Nimpila, S.; Hongthong, S.; Yoneda, R.; Wichiennopparat, W.; Himmapan, W.; Vacharangkura, T.; Noda, I. Effects of Bentonite, Charcoal and Corncob for Soil Improvement and Growth Characteristics of Teak Seedling Planted on Acrisols in Northeast Thailand. Forests 2016, 7, 36. [Google Scholar] [CrossRef] [Green Version]
  15. Kayama, M.; Nimpila, S.; Hongthong, S.; Himmapan, W. Growth Characteristics of Teak Seedling Planted on Different Types of Sandy Soil in Northeast Thailand. In Improvement of Utilization Techniques of Forest Resources to Promote Sustainable Forestry in Thailand; JIRCAS Working report 85; Kayama, M., Himmapan, W., Eds.; Japan International Research Center for Agricultural Sciences: Tsukuba, Japan, 2017; pp. 45–56. [Google Scholar]
  16. Wichiennopparat, W.; Wanpinit, M.; Nimpila, S.; Soonthornwit, N. Growth Performance of 6-Year-Old Teak Plantation under Different Soil Improvement Methods in Khon Kaen Province, Thailand. In Improvement of Utilization Techniques of Forest Resources to Promote Sustainable Forestry in Thailand; JIRCAS Working Report 85; Kayama, M., Himmapan, W., Eds.; Japan International Research Center for Agricultural Sciences: Tsukuba, Japan, 2017; pp. 57–62. [Google Scholar]
  17. Tangmitcharoen, S.; Nimpila, S.; Phuangjumpee, P.; Piananurak, P. Two-Year Results of a Clonal Test of Teak (Tectona grandis L.f.) in the Northeast Thailand. In Approach to Sustainable Forestry of Indigenous Tree Species in Northeast Thailand; JIRCAS Working report 74; Noda, I., Vacharangkura, T., Himmapan, W., Eds.; Japan International Research Center for Agricultural Sciences: Tsukuba, Japan, 2012; pp. 19–22. [Google Scholar]
  18. Kenzo, T.; Himmapan, W.; Yoneda, R.; Tedsorn, N.; Vacharangkura, T.; Hitsuma, G.; Noda, I. General Estimation Model for above- and below-Ground Biomass of Teak Plantation in Thailand. For. Ecol. Manag. 2020, 457, 117701. [Google Scholar] [CrossRef]
  19. Wichiennopparat, W.; Wanpinit, M.; Visaratana, T.; Noda, I.; Sukchan, S.; Sasrisang, A. Soil Suitability Map for Teak Plantation in Chaiyaphum and Khon Kaen Provinces; RFD-JIRCAS Joint Research Project: Bangkok, Thailand, 2015; p. 52. (In Thai) [Google Scholar]
  20. Wehr, J.B.; Smith, T.E.; Menzies, N.W. Influence of Soil Characteristics on Teak (Tectona grandis L. f.) Establishment and Early Growth in Tropical Northern Australia. J. For. Res. 2017, 22, 153–159. [Google Scholar] [CrossRef]
  21. Rajendrudu, G.; Naidu, C.V.; Mallikarjuna, K. Effect of Water Stress on Photosynthesis and Growth in Two Teak Phenotypes. Photosynthetica 1999, 36, 627–630. [Google Scholar] [CrossRef]
  22. Rao, P.B.; Kaur, A.; Tewari, A. Drought Resistance in Seedlings of Five Important Tree Species in Terai Region of Uttarakhand. Trop. Ecol. 2008, 49, 43–52. [Google Scholar]
  23. Geleano, E.; Vasconcelos, T.S.; Novais de Oliveira, P.; Carrer, H. Physiological and Molecular Responses to Drought Stress in Teak (Tectona grandis L.f.). PLoS ONE 2019, 14, e0221571. [Google Scholar] [CrossRef]
  24. Bledsoe, C.S.; Zasoski, R.J. Effects of Ammonium and Nitrate on Growth and Nitrogen Uptake by Mycorrhizal Douglas-fir Seedlings. Plant Soil 1983, 71, 445–454. [Google Scholar] [CrossRef]
  25. Mishra, P.K.; Prasad, S.S.; Babu, B.M.; Varalakshmi, L.R. Bentonite as an Ameliorant in an Alfisol—A Laboratory Study. J. Irrig. Drain. Eng. 2001, 127, 118–122. [Google Scholar] [CrossRef]
  26. Noble, A.D.; Gillman, G.P.; Nath, S.; Srivastava, R.J. Changes in the Surface Charge Characteristics of Degraded Soils in the Wet Tropics Through the Addition of Beneficiated Bentonite. Soil Res. 2001, 39, 991–1001. [Google Scholar] [CrossRef]
  27. Brockley, R.P. Effects of Different Sources and Rates of Sulphur on the Growth and Foliar Nutrition of Nitrogen-Fertilized Lodgepole Pine. Can. J. For. Res. 2004, 34, 728–743. [Google Scholar] [CrossRef] [Green Version]
  28. Muththalib, A.; Baudet, B.A. Effect of Heavy Metal Contamination on the Plasticity of Kaolin-Bentonite Clay Mixtures and an Illite-Smectite Rich Natural Clay. E3S Web Conf. 2019, 92, 10005. [Google Scholar] [CrossRef]
  29. Redding, M.R.; Lewis, R.; Kearton, T.; Smith, O. Manure and Sorbent Fertilisers Increase On-Going Nutrient Availability Relative to Conventional Fertilisers. Sci. Total Environ. 2016, 569–570, 927–936. [Google Scholar] [CrossRef] [PubMed] [Green Version]
  30. Sherriff, N.; Issa, R.; Morris, K.; Livens, F.; Heath, S.; Bryan, N. Reversibility in Radionuclide/Bentonite Bulk and Colloidal Ternary Systems. Miner. Mag. 2015, 79, 1307–1315. [Google Scholar] [CrossRef]
  31. Yang, Y.; Ni, X.; Zhou, Z.; Yu, L.; Liu, B.; Yang, Y.; Wu, Y. Performance of Matrix-Based Slow-Release Urea in Reducing Nitrogen Loss and Improving Maize Yield and Profits. Field Crops Res. 2017, 212, 73–81. [Google Scholar] [CrossRef]
  32. Raghu, H.B.; Ashwin, R.; Ravi, J.E.; Bagyaraj, D.J. Microbial Consortium Improved Growth and Performance of Teak (Tectona grandis L.f.) in Nursery and Field Trials. Proc. Natl. Acad. Sci. India Sect. B Biol. Sci. 2020, 20, 903–909. [Google Scholar] [CrossRef]
  33. Himmapan, W.; Noda, I.; Furuya, N. The Study on the Administration of Private Forest Plantation Cooperative of Thailand: A Case Study of Nomgbua Lamphu Private Forest Plantation Cooperative Limited. J. For. Manag. 2010, 4, 1–12. [Google Scholar]
  34. Van Reeuwijk, L.P. Procedures for Soil Analysis, 6th ed.; International Soil Reference and Information Centre: Wagningen, The Netherlands, 2002; p. 100. [Google Scholar]
  35. Klute, A. Methods of Soil Analysis, Part 1. Physical and Mineralogical Methods, 2nd ed.; Soil Science Society of America Inc.: Madison, WI, USA, 1986; p. 1188. [Google Scholar]
  36. Muto, K.; Sakurai, K.; Ito, A. Simplified Analysis of Cation-Exchange-Capacity (CEC). Tohoku Agric. Res. 1984, 35, 271–272. (In Japanese) [Google Scholar]
  37. Weatherburn, M.W. Phenol-Hypochlorite Reaction for Determination of Ammonia. Anal. Chem. 1967, 39, 971–974. [Google Scholar] [CrossRef]
  38. Sparks, D.L.; Page, A.L.; Helmke, P.A.; Loeppert, R.H.; Soltanpour, P.N.; Tabatabai, M.A.; Johnson, C.T.; Sumner, M.E. Methods of Soil Analysis, Part 3. Chemical Methods; Soil Science Society of America Inc.: Madison, WI, USA, 1996; p. 1390. [Google Scholar]
  39. American Public Health Association; American Water Works Association; Water Environment Federation. Standard Methods for the Examination of Water and Wastewater, 20th ed.; American Public Health Association: Washington, DC, USA, 1998; p. 1220. [Google Scholar]
  40. Barnes, J.D.; Balaguer, L.; Manrique, E.; Elvira, S.; Davison, A. A Reappraisal of the Use of DMSO for the Extraction and Determination of Chlorophylls a and b in Lichens and Higher Plants. Environ. Exp. Bot. 1992, 32, 85–100. [Google Scholar] [CrossRef]
  41. Larcher, W. Physiological Plant Ecology, 4th ed.; Springer: Berlin, Germany, 2003; p. 513. [Google Scholar]
  42. Tondjo, K.; Brancheriau, L.; Sabatier, S.A.; Kokutse, A.D.; Akossou, A.; Kokou, K.; Fourcaud, T. Non-Destructive Measurement of Leaf Area and Dry Biomass in Tectona grandis. Trees 2015, 29, 1625–1631. [Google Scholar] [CrossRef]
  43. Giovannetti, M.; Mosse, B. An Evaluation of Techniques for Measuring Vesicular Arbuscular Mycorrhizal Infection in Roots. New Phytol. 1980, 84, 489–500. [Google Scholar] [CrossRef]
  44. Goto, S. Digestion Method. In Manual of Plant Nutrition; Editorial Committee of Methods for Experiments in Plant Nutrition, Ed.; Hakuyusha: Tokyo, Japan, 1990; pp. 125–128. (In Japanese) [Google Scholar]
  45. Radulov, I.; Berbecea, A.; Sala, F.; Crista, F.; Lato, A. Mineral Fertilization Influence on Soil pH, Cationic Exchange Capacity and Nutrient Content. Res. J. Agric. Sci. 2011, 43, 160–165. [Google Scholar]
  46. Bhatt, M.K.; Labanya, R.; Joshi, H.C. Influence of Long-Term Chemical Fertilizer and Organic Manures on Soil Fertility—A Review. Univers. J. Agric. Res. 2019, 7, 177–188. [Google Scholar] [CrossRef]
  47. Soda, W.; Noble, A.D.; Suzuki, S.; Simmons, R.; Sindhusen, L.; Bhuthorndharaj, S. Co-composting of Acid Waste Bentonites and Their Effects on Soil Properties and Crop Biomass. J. Environ. Qual. 2006, 35, 2293–2301. [Google Scholar] [CrossRef] [PubMed]
  48. Egloffstein, T.A. Natural Bentonite—Influence of the Ion Exchange and Partial Desiccation on Permeability and Self-Healing Capacity of Bentonites Used in GCLs. Geotext. Geomembr. 2001, 19, 427–444. [Google Scholar] [CrossRef]
  49. El-Sergany, M.; Shanableh, A. Phosphorus Removal Using Al-Modified Bentonite Clay—Effect of Particle Size. In Proceedings of the 2012 Asia Pacific Conference on Environmental Science and Technology, Kuala Lumpur, Malaysia, 1–2 February 2012; pp. 323–329. [Google Scholar]
  50. Dong, D.; Wang, C.; Zwieten, L.V.; Wang, H.; Jiang, P.; Zhou, M.; Wu, W. An Effective Biochar-Based Slow-Release Fertilizer for Reducing Nitrogen Loss in Paddy Fields. J. Soil Sediment 2020, 20, 3027–3040. [Google Scholar] [CrossRef]
  51. Croker, J.; Poss, R.; Hartmann, C.; Bhuthorndharaj, S. Effects of Recycled Bentonite Addition on Soil Properties, Plant Growth and Nutrient Uptake in A tropical Sandy Soil. Plant Soil 2004, 267, 155–163. [Google Scholar] [CrossRef]
  52. Zech, W.; Drechsel, P. Relationships between Growth, Mineral Nutrition and Site Factors of Teak (Tectona grandis) Plantations in the Rainforest Zone of Liberia. For. Ecol. Manag. 1991, 41, 221–235. [Google Scholar] [CrossRef]
  53. Bücking, H.; Kafle, A. Role of Arbuscular Mycorrhizal Fungi in the Nitrogen Uptake of Plants: Current Knowledge and Research Gaps. Agronomy 2015, 5, 587–612. [Google Scholar] [CrossRef] [Green Version]
  54. Behling, M.; Neves, J.C.L.; de Barros, N.F.; Kishimoto, C.B.; Smit, L. Nutrient Use Efficiency for the Formation of Fine and Medium Roots in Teak Stands. Rev. Árvore 2014, 38, 837–846, (In Portuguese and English Summary). [Google Scholar] [CrossRef] [Green Version]
  55. Chanan, M.; Hardiwinoto, S.; Abus, C.; Purwanto, R.H.; Purwanta, S. The Identification of Macro Nutrient Status of Superior Teak Plantation (Tectona grandis Lin.F) by Means of DRIS Norms (Diagnosis and Recommendation Integrated System) in Indonesia. For. Sci. Technol. 2019, 15, 7–12. [Google Scholar] [CrossRef] [Green Version]
  56. Óskarsson, H.; Sigurgeirsson, A.; Raulund-Rasmussen, K. Survival, Growth, and Nutrition of Tree Seedlings Fertilized at Planting on Andisol Soils in Iceland: Six-Year Results. For. Ecol. Manag. 2006, 229, 88–97. [Google Scholar] [CrossRef]
  57. Wolf, B. The Fertile Triangle: The Interrelationship of Air, Water, and Nutrients in Maximizing Soil Productivity, 1st ed.; Food Products Press: Binghamton, NY, USA, 1999; p. 484. [Google Scholar]
  58. Evans, J.R. Photosynthesis and Nitrogen Relationships in Leaves of C3 Plants. Oecologia 1989, 78, 9–19. [Google Scholar] [CrossRef] [PubMed]
  59. Raaimakers, D.; Boot, R.G.A.; Dijkstra, P.; Pot, S.; Pons, T. Photosynthetic Rates in Relation to Leaf Phosphorus Content in Pioneer Versus Climax Tropical Rainforest Trees. Oecologia 1995, 102, 120–125. [Google Scholar] [CrossRef]
  60. Enríquez, S.; Duarte, C.M.; Sand-Jensen, K.; Nielsen, S.L. Broad-Scale Comparison of Photosynthetic Rate across Phototrophic Organisms. Oecologia 1996, 108, 197–206. [Google Scholar] [CrossRef]
  61. Gratani, L.; Pesoli, P.; Crescente, M.F. Relationship between Photosynthetic Activity and Chlorophyll Content in an Isolated Quercus ilex L. Tree during the Year. Photosynthetica 1998, 35, 445–451. [Google Scholar] [CrossRef]
  62. Nemec, S. Effects of Soil Amendments and Tillage on Vesicular-Arbuscular Mycorrhizal Fungus Colonization of Citrus. HortTechnology 1998, 8, 51–54. [Google Scholar] [CrossRef] [Green Version]
  63. Hepper, C.M.; O’Shea, J. Vesicular-Arbuscular Mycorrhizal Infection in Lettuce (Lactuca sativa) in Relation to Calcium Supply. Plant Soil 1984, 82, 61–68. [Google Scholar] [CrossRef]
  64. Juice, S.M.; Fahey, T.J.; Siccama, T.G.; Driscoll, C.T.; Denny, E.G.; Eagar, C.; Cleavitt, N.L.; Minocha, R.; Richardson, A.D. Response of Sugar Maple to Calcium Addition to Northern Hardwood Forest. Ecology 2006, 87, 1267–1280. [Google Scholar] [CrossRef]
  65. Wu, Q.S.; Zou, Y.N. Chapter 2 Arbuscular Mycorrhizal Fungi and Tolerance of Drought Stress in Plants. In Arbuscular mycorrhiza and Stress Taolerance of Plantsanual of Plant Nutrition; Wu, Q.S., Ed.; Springer: Singapore, 2017; pp. 25–41. [Google Scholar]
  66. Saleth, R.M.; Inocencio, A.; Noble, A.; Ruaysoongnern, S. Economic Gains of Improving Soil Fertility and Water Holding Capacity with Clay Application; IWMI Research Report 130; International Water Management Institute: Colombo, Sri Lanka, 2009; p. 30. [Google Scholar]
  67. Fernandez-Moya, J.; Murillo, R.; Portuguez, E.; Fallas, J.L.; Rios, V.; Kottman, F.; Verjans, J.M.; Mata, R.; Alvarado, A. Nutrient Concentration Age Dynamics of Teak (Tectona grandis L.f.) Plantations in Central America. For. Syst. 2013, 22, 123–133. [Google Scholar] [CrossRef]
  68. Nakaji, T.; Fukami, M.; Dokiya, Y.; Izuta, T. Effects of High Nitrogen Load on Growth, Photosynthesis and Nutrient Status of Cryptomeria japonica and Pinus densiflora Seedlings. Trees 2001, 15, 453–461. [Google Scholar] [CrossRef]
Figure 1. Average soil moisture content in the six treatments (July 2014–November 2015, mean ± SE, n = 2). Note: Average Data for the CON treatment were from Kayama et al. [15]. The data for the CON treatment in Tables 1–5, Figure 2–5 were also from Kayama et al. [15]. CON: control, FER.: fertilizer, BEN: Bentonite and BEN + FER.: bentonite and fertilizer.
Forests 12 00026 g001
Figure 2. Tree height and basal diameter of teak seedlings grown in the four treatments (mean ± SE, n = 60).
Forests 12 00026 g002
Figure 3. Photosynthetic rate at light saturation (Psat), stomatal conductance (gs), and concentration of chlorophyll (a + b) in teak seedlings grown in the four treatments (9:00–11:00, mean ± SE, n = 9). Note. n = 6 in the FER. and BEN + FER treatments from May 2015 because of dead seedlings.
Forests 12 00026 g003
Figure 4. Leaf water potential in the afternoon (13:00–14:00) and predawn (05:30–06:00) for teak seedlings grown in the four treatments during February and May 2015 (mean ± SE, n = 9). Asterisks indicate significant differences by two-factor ANOVA. ** = p < 0.01 and *** = p < 0.001. Note. n = 6 in the FER. and BEN + FER. treatments from May 2015 because of dead seedlings.
Forests 12 00026 g004
Figure 5. Dry mass of each organ and total dry mass for teak seedlings at the end of the experiment (November 2015) grown in the four treatments (mean ± SE, n = 12). Asterisks indicate significant differences by two-factor ANOVA. * = p < 0.05, ** = p < 0.01 and *** = p < 0.001.
Forests 12 00026 g005
Table 1. Texture of soils in the four treatments (mean ± SE, n = 9) sampled in June 2014. There was no significant effect of fertilizer, bentonite and their interaction.
ParameterTreatmentStatistical Analysis
Sand
(%)
CON
FER
BEN
BEN + FER
80.2 ± 0.5
79.8 ± 1.1
80.2 ± 0.5
78.9 ± 0.8
Fer.
Ben.
F × B
n.s.
n.s.
n.s.
Silt
(%)
CON
FER
BEN
BEN + FER
14.1 ± 0.7
15.4 ± 1.1
14.6 ± 0.4
14.5 ± 0.3
Fer.
Ben.
F × B
n.s.
n.s.
n.s.
Clay
(%)
CON
FER
BEN
BEN + FER
5.7 ± 0.9
4.8 ± 0.7
5.2 ± 0.4
6.6 ± 1.0
Fer.
Ben.
F × B
n.s.
n.s.
n.s.
Table 2. Texture Chemical properties (pH, CEC, OM, and elements) of soils in the four treatments (mean ± SE, n = 9) sampled in June 2014 and December 2015. Asterisks indicate significant differences by three-factor ANOVA. * = p < 0.05, ** = p < 0.01 and *** = p < 0.001.
ParameterTreatmentJul. 2014Nov. 2015Statistical Analysis
pHCON
FER
BEN
BEN + FER
4.53 ± 0.08
4.62 ± 0.05
4.67 ± 0.04
4.36 ± 0.06
4.68 ± 0.03
5.09 ± 0.08
5.03 ± 0.05
5.08 ± 0.05
Fer.
Ben.
Per.
n.s.
n.s.
***
F × B
F × P
B × P
F × B × P
***
***
**
n.s.
CEC
(cmol kg−1)
CON
FER
BEN
BEN + FER
1.30 ± 0.10
1.61 ± 0.14
1.75 ± 0.08
2.20 ± 0.13
1.42 ± 0.06
1.44 ± 0.13
1.78 ± 0.13
2.14 ± 0.25
Fer.
Ben.
Per.
**
***
n.s.
F × B
F × P
B × P
F × B × P
n.s.
n.s.
n.s.
n.s.
OM
(g kg−1)
CON
FER
BEN
BEN + FER
7.00 ± 2.32
6.76 ± 1.61
9.60 ± 1.90
9.84 ± 2.03
1.54 ± 0.23
2.16 ± 0.23
1.32 ± 0.12
2.53 ± 0.28
Fer.
Ben.
Per.
n.s.
n.s.
***
F × B
F × P
B × P
F × B × P
n.s.
n.s.
n.s.
n.s.
N
(mg kg−1)
CON
FER
BEN
BEN + FER
96 ± 16
346 ± 72
104 ± 16
644 ± 41
367 ± 17
411 ± 11
278 ± 32
556 ± 41
Fer.
Ben.
Per.
***
***
***
F × B
F × P
B × P
F × B × P
***
***
*
n.s.
P
(mg kg−1)
CON
FER
BEN
BEN + FER
9 ± 2
36 ± 8
10 ± 2
80 ± 14
4 ± 0
44 ± 12
4 ± 0
91 ± 15
Fer.
Ben.
Per.
***
***
n.s.
F × B
F × P
B × P
F × B × P
***
n.s.
n.s.
n.s.
Ca
(mg kg−1)
CON
FER
BEN
BEN + FER
53 ± 8
78 ± 7
70 ± 4
99 ± 17
33 ± 5
73 ± 5
154 ± 19
171 ± 24
Fer.
Ben.
Per.
**
***
***
F × B
F × P
B × P
F × B × P
n.s.
n.s.
***
n.s.
Mg
(mg kg−1)
CON
FER
BEN
BEN + FER
22.9 ± 2.9
26.9 ± 2.6
30.1 ± 1.5
29.0 ± 2.4
7.9 ± 2.1
28.8 ± 4.6
26.3 ± 5.0
41.0 ± 8.5
Fer.
Ben.
Per.
**
**
n.s.
F × B
F × P
B × P
F × B × P
n.s.
**
n.s.
n.s.
K
(mg kg−1)
CON
FER
BEN
BEN + FER
23 ± 3
239 ± 43
25 ± 3
240 ± 38
16 ± 2
40 ± 5
34 ± 9
109 ± 10
Fer.
Ben.
Per.
***
n.s.
***
F × B
F × P
B × P
F × B × P
n.s.
***
n.s.
n.s.
Na
(mg kg−1)
CON
FER
BEN
BEN + FER
2.4 ± 0.6
11.5 ± 2.0
12.2 ± 2.1
22.9 ± 2.6
11.1 ± 1.1
11.5 ± 1.4
10.1 ± 1.0
09.4 ± 2.6
Fer.
Ben.
Per.
***
***
n.s.
F × B
F × P
B × P
F × B × P
n.s.
***
***
n.s.
Note. Abbreviation written in Statistical analysis was following. Fer. and F: fertilizer, Ben. and B: bentonite, Per. and P: period.
Table 3. Statistical analysis for tree height, diameter, photosynthetic rate at light saturation (Psat), stomatal conductance (gs), and concentration of chlorophyll (a + b) in teak seedlings by two-factor ANOVA. Asterisks indicate significant differences. * = p < 0.05, ** = p < 0.01 and *** = p < 0.001.
ParameterJul. 2014Oct. 2014Feb. 2015May 2015Jul. 2015Nov. 2015
Tree heightFer.
Ben.
F × B
n.s.
n.s.
n.s.
***
***
n.s.
*
***
n.s.
n.s.
***
n.s.
n.s.
***
n.s.
***
***
n.s.
DiameterFer.
Ben.
F × B
n.s.
n.s.
n.s.
***
***
n.s.
n.s.
***
n.s.
n.s.
***
n.s.
n.s.
***
n.s.
***
***
n.s.
Oct. 2014Feb. 2015May 2015Jul. 2015Oct. 2015
PsatFer.
Ben.
F × B
n.s.
***
n.s.
***
***
n.s.
n.s.
***
n.s.
*
n.s.
n.s.
*
***
n.s.
gsFer.
Ben.
F × B
n.s.
***
n.s.
*
**
n.s.
n.s.
*
n.s.
n.s.
n.s.
n.s.
n.s.
*
n.s.
Chl.a + bFer.
Ben.
F × B
n.s.
***
n.s.
*
**
n.s.
n.s.
n.s.
n.s.
n.s.
*
n.s.
n.s.
**
n.s.
Table 4. Survival rate (Nov. 2015), growth rate (RGR), leaf area, and the percentage of AM fungi colonizing teak seedlings grown in the four treatments (mean ± SE, n = 3 for survival rate, and n = 12 for other parameters). Asterisks indicate significant differences by two-factor ANOVA. * = p < 0.05 and *** = p < 0.001.
ParameterTreatmentStatistical Analysis
Survival rate
(%)
CON
FER
BEN
BEN + FER
55.0 ± 13.2
20.0 ± 7.6
66.7 ± 7.3
44.3 ± 3.3
Fer.
Ben.
F × B
*
n.s.
n.s.
RGR
(g g−1 yr)
CON
FER
BEN
BEN + FER
3.21 ± 0.22
4.54 ± 0.47
4.96 ± 0.15
6.42 ± 0.36
Fer.
Ben.
F × B
***
***
n.s.
Leaf area
(cm2)
CON
FER
BEN
BEN + FER
92 ± 34
528 ± 106
454 ± 84
1214 ± 149
Fer.
Ben.
F × B
***
***
n.s.
AM colonization
(%)
CON
FER
BEN
BEN + FER
90.7 ± 3.6
84.2 ± 3.5
94.8 ± 1.5
93.4 ± 1.5
Fer.
Ben.
F × B
n.s.
*
n.s.
Table 5. Concentrations of elements (N, P, K, Ca and Mg; dry mass) in leaves and roots of teak seedlings grown in the four treatments (November 2015, mean ± SE, n = 12). Asterisks indicate significant differences by two-factor ANOVA. * = p < 0.05, ** = p < 0.01 and *** = p < 0.001.
ElementTreatmentConcentration (mg g−1)Statistical Analysis
LeafRoot LeafRoot
NCON
FER
BEN
BEN + FER
18.9 ± 1.0
24.2 ± 1.0
21.5 ± 0.8
25.7 ± 1.4
7.6 ± 0.3
9.9 ± 0.6
8.8 ± 0.3
9.1 ± 0.4
Fer.
Ben.
F × B
***
n.s.
n.s.
**
n.s.
*
PCON
FER
BEN
BEN + FER
0.76 ± 0.06
1.54 ± 0.17
0.90 ± 0.06
1.64 ± 0.13
0.33 ± 0.03
0.67 ± 0.09
0.33 ± 0.03
0.56 ± 0.05
Fer.
Ben.
F × B
***
n.s.
n.s.
***
n.s.
n.s.
KCON
FER
BEN
BEN + FER
5.20 ± 0.53
4.87 ± 0.62
6.73 ± 0.41
5.88 ± 0.84
3.99 ± 0.24
5.31 ± 0.30
4.17 ± 0.26
6.53 ± 0.37
Fer.
Ben.
F × B
n.s.
n.s.
n.s.
***
*
n.s.
CaCON
FER
BEN
BEN + FER
3.88 ± 0.75
9.25 ± 1.35
6.01 ± 0.97
9.00 ± 0.89
3.16 ± 0.25
3.18 ± 0.51
3.10 ± 0.27
2.91 ± 0.35
Fer.
Ben.
F × B
***
n.s.
n.s.
n.s.
n.s.
n.s.
MgCON
FER
BEN
BEN + FER
5.05 ± 0.36
6.31 ± 0.46
4.46 ± 0.29
4.58 ± 0.39
1.02 ± 0.06
1.25 ± 0.09
0.92 ± 0.06
1.22 ± 0.10
Fer.
Ben.
F × B
n.s.
**
n.s.
n.s.
***
n.s.
Table 6. Regression coefficients of relationships between concentrations of elements in the leaves or roots of teak seedlings (dependent variable) and concentrations of elements in the soils (independent variable, Nov. 2015, n = 36), and the RGR (dependent variable) and concentrations of elements in the leaves or roots (independent variable) of teak seedlings (n = 48). ** p < 0.01 and *** p < 0.001.
ElementsLeavesRoots
rFrF
Elements in soils—Elements in leaves or roots
N
P
K
Ca
Mg
0.427
0.506
–0.041
0.073
–0.204
7.58 **
11.1 **
0.06
0.18
1.48
0.208
0.272
0.469
–0.171
0.076
1.54
2.72
9.61 ***
1.02
0.20
Elements in leaves or roots–RGR
N
P
K
Ca
Mg
0.140
0.493
0.129
0.222
–0.250
0.92
14.7 ***
0.78
2.40
3.05
–0.014
<0.001
0.520
–0.369
–0.034
<0.01
<0.01
17.1 ***
7.23 **
0.05
Publisher’s Note: MDPI stays neutral with regard to jurisdictional claims in published maps and institutional affiliations.

