Linking Forest Vegetation and Soil Carbon Stock in Northwestern Russia

 ,
,  , , , , and
Abstract
1. Introduction
2. Materials and Methods
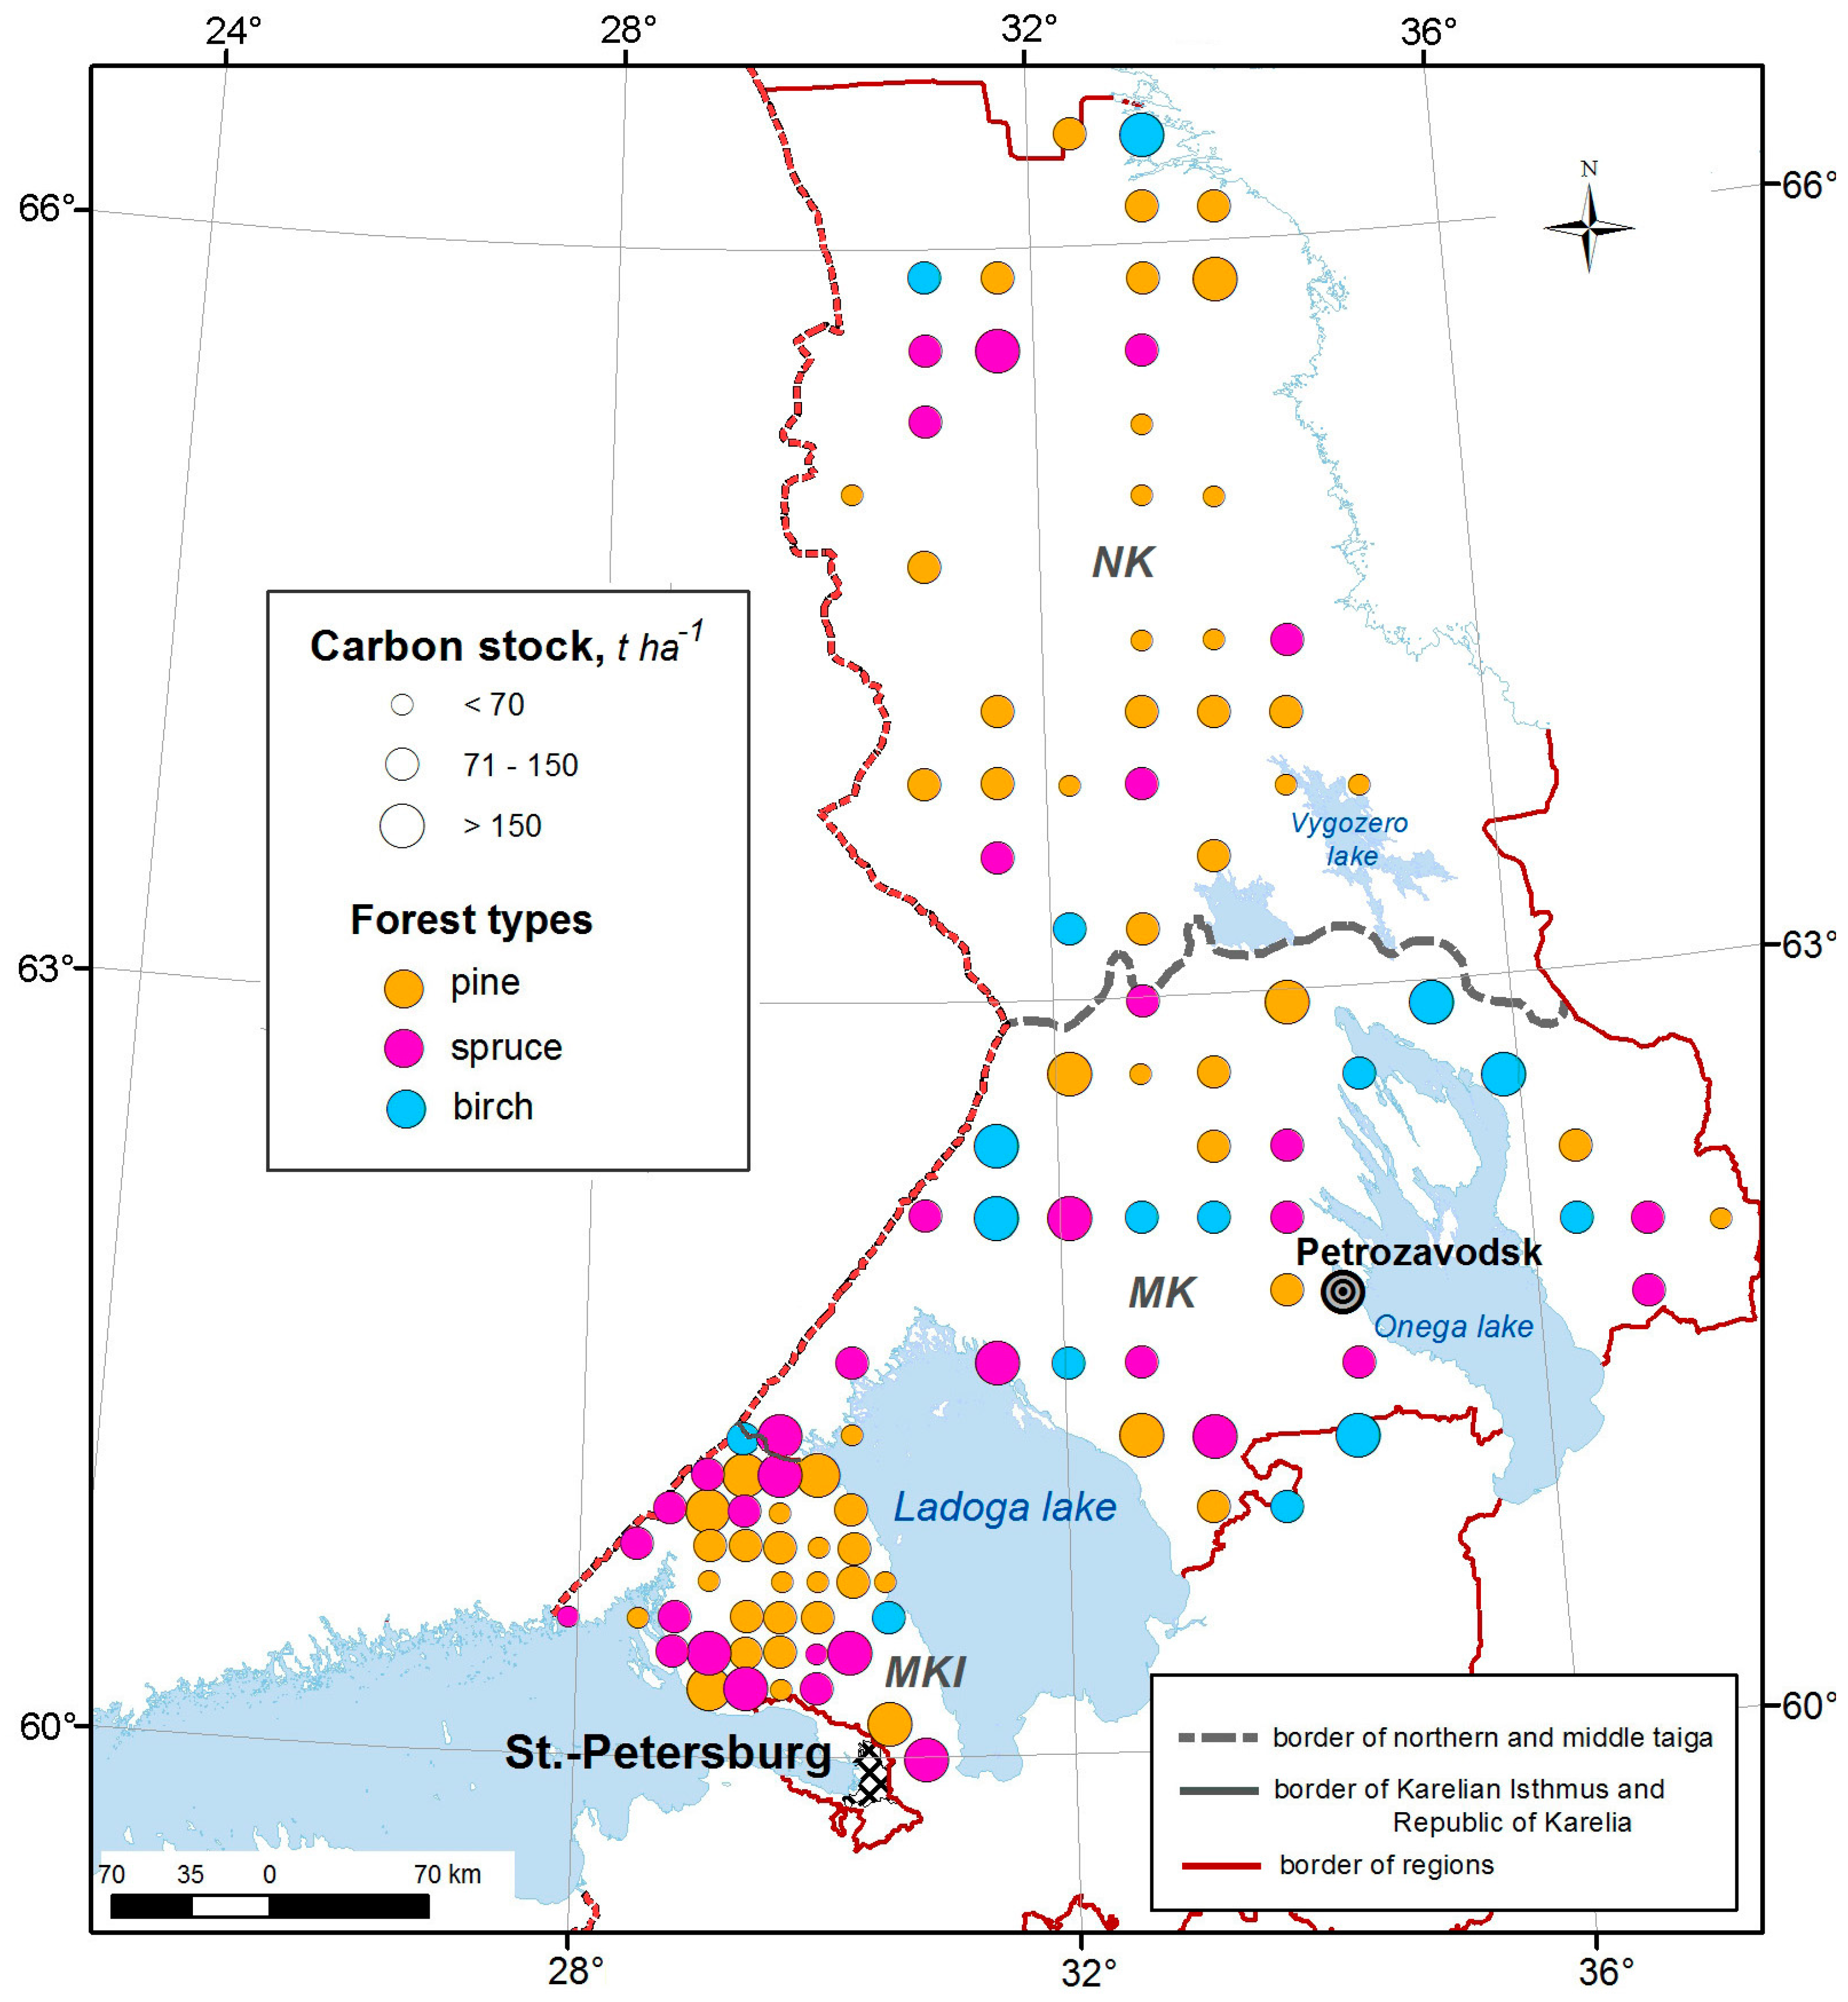
2.1. Study Areas
2.1.1. Climatic Conditions
2.1.2. Vegetation
2.1.3. Soil
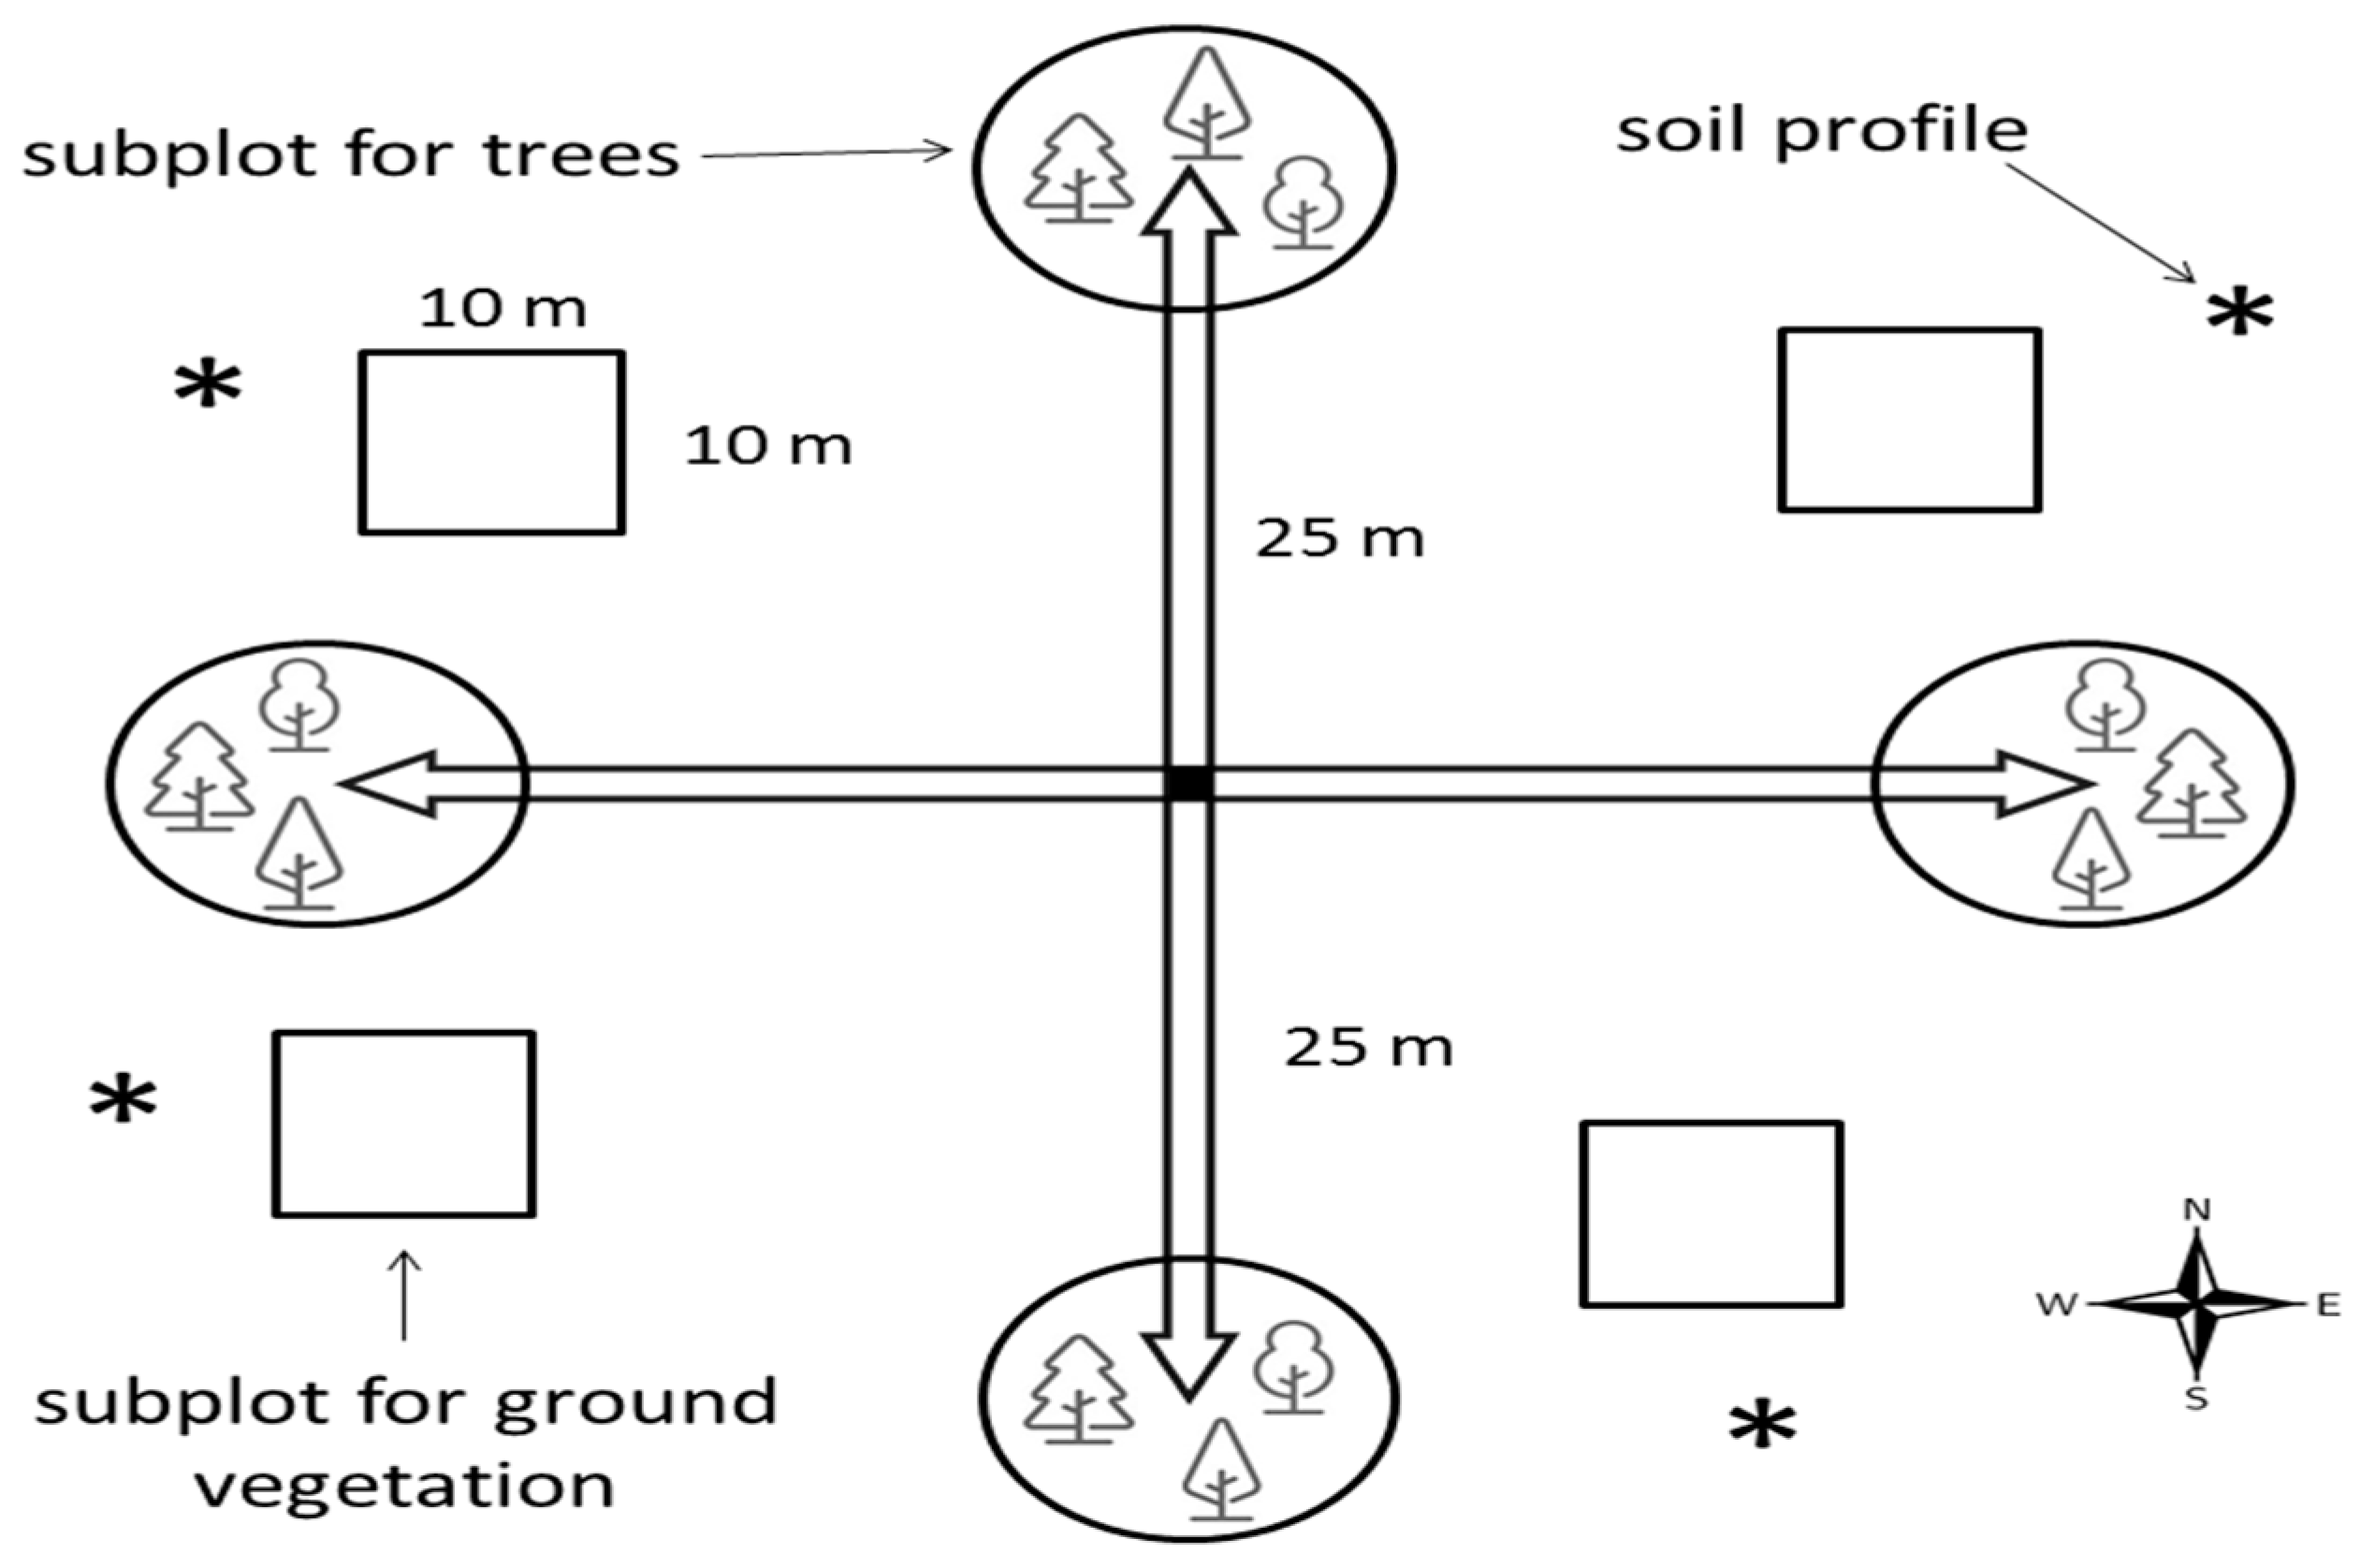
2.2. Methods
2.2.1. Vegetation
2.2.2. Soil
2.2.3. Statistical Processing
3. Results
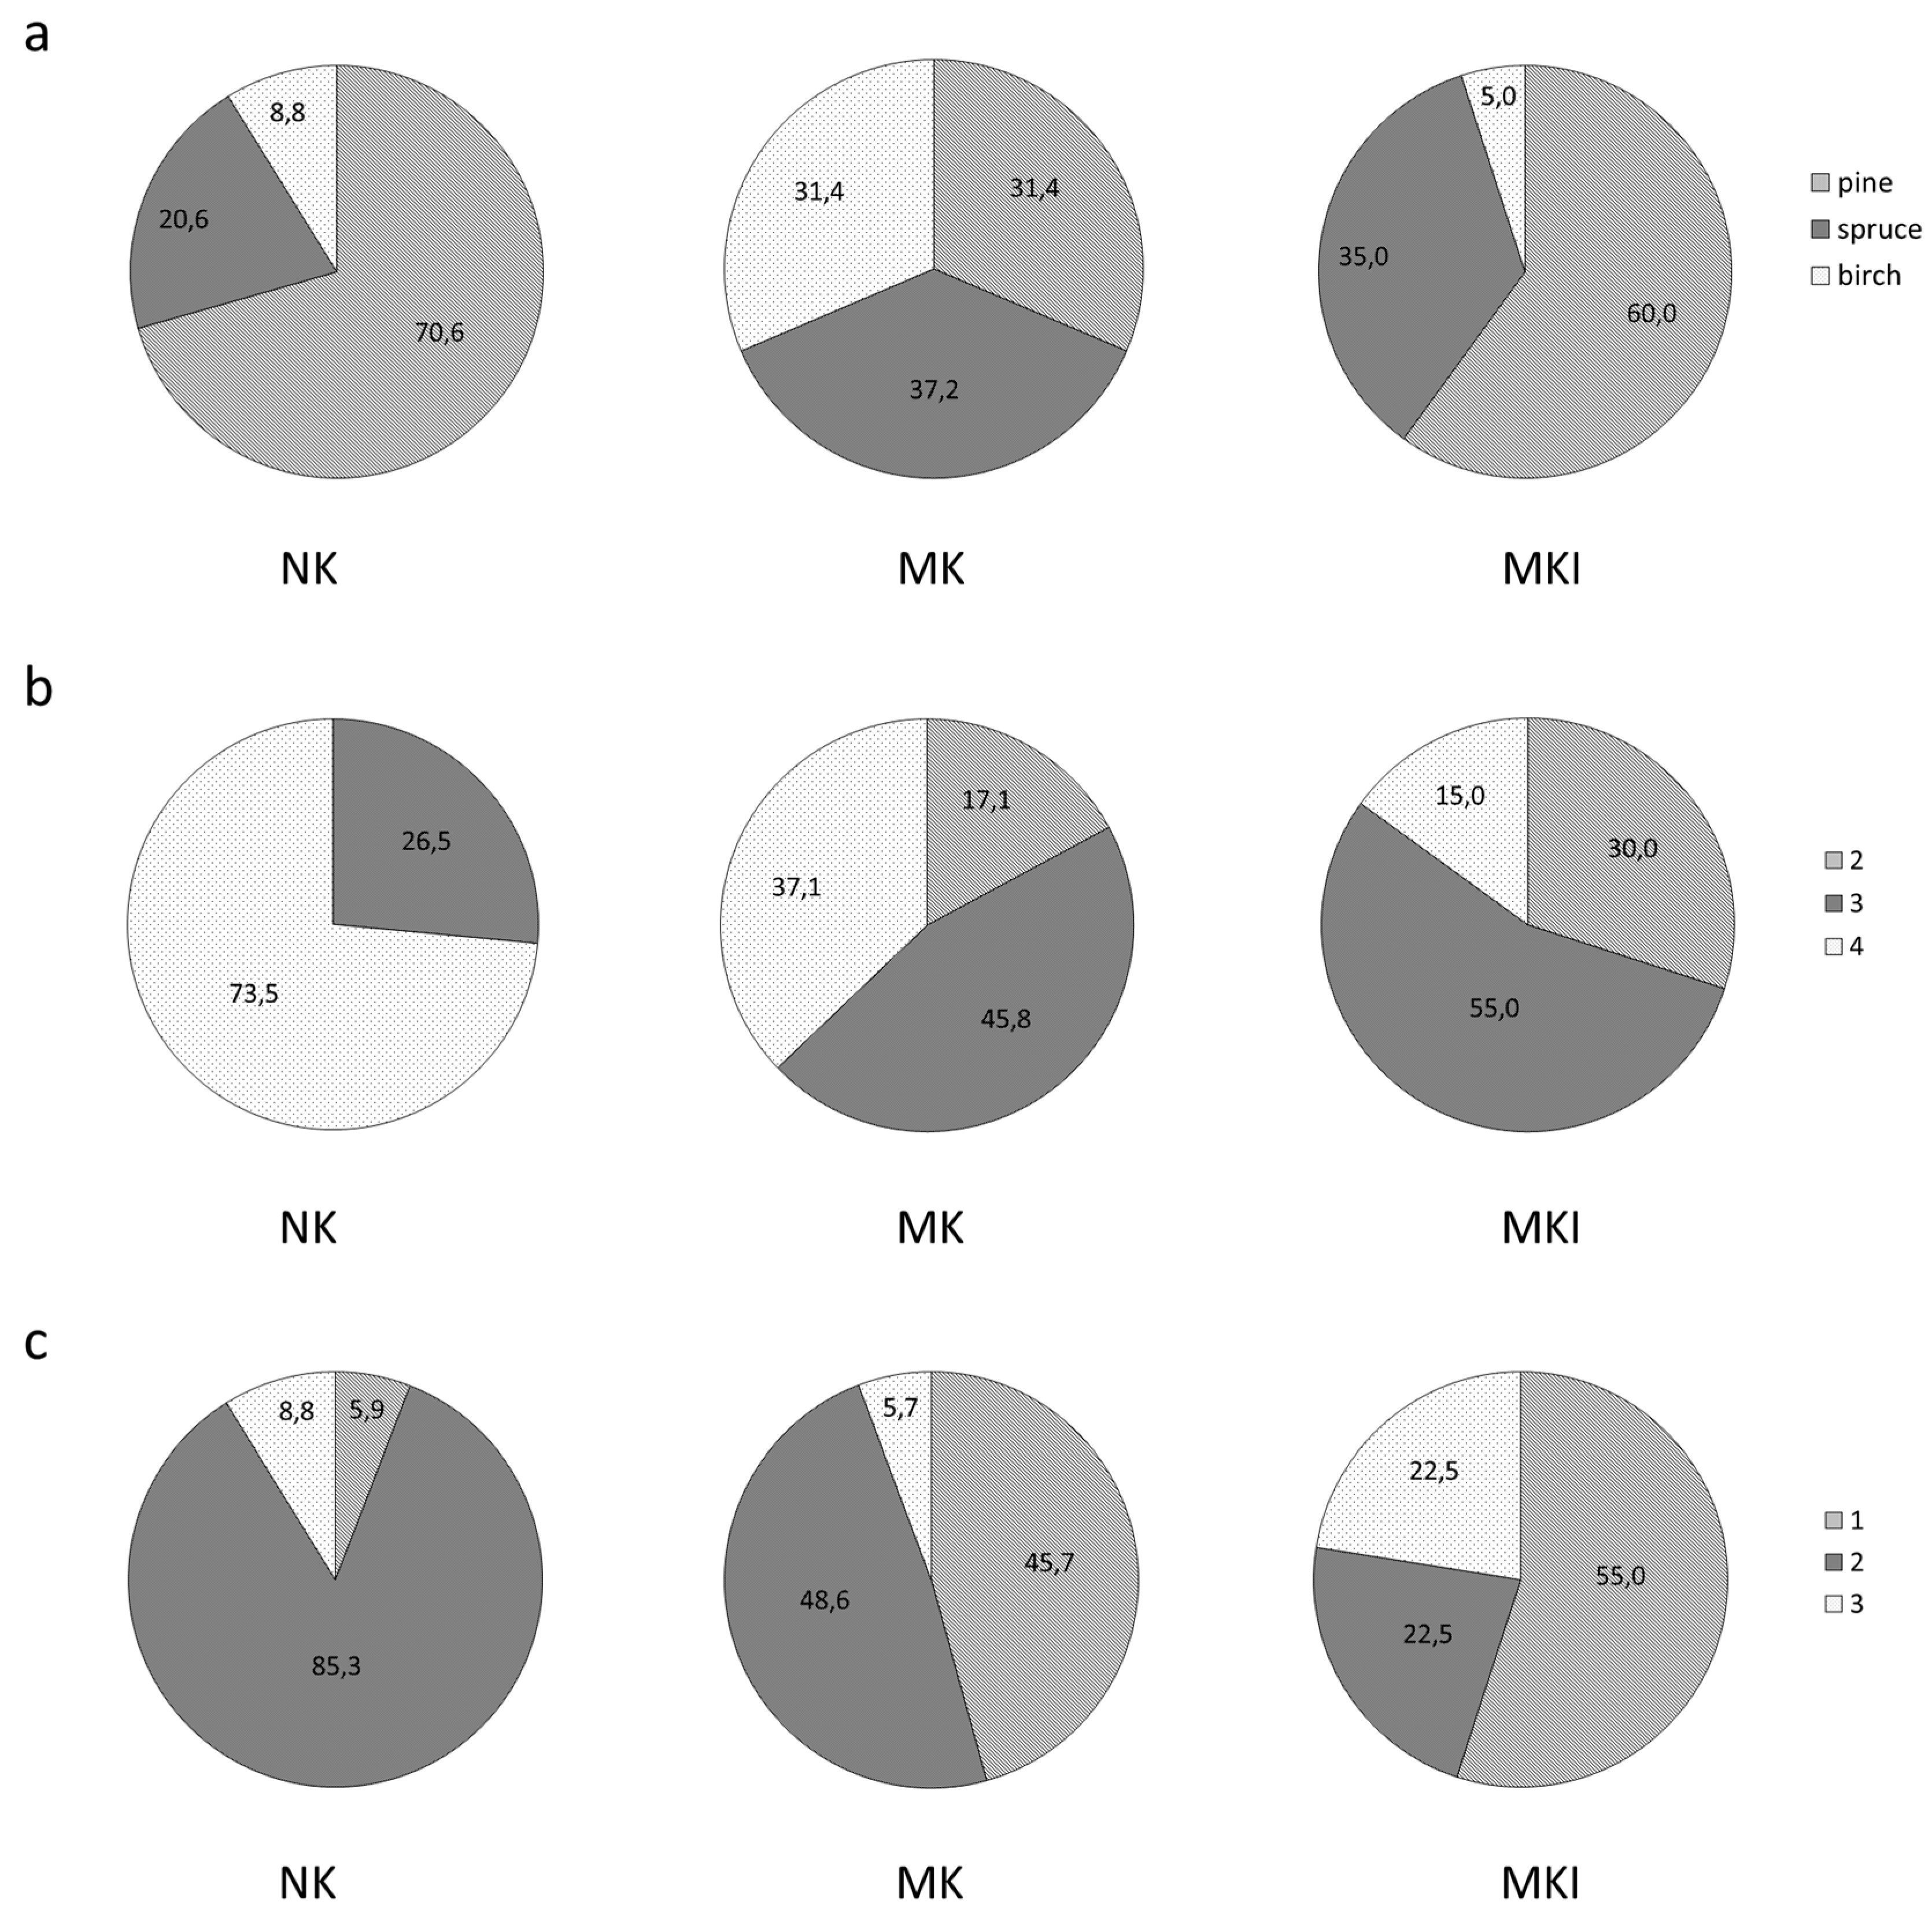
3.1. Vegetation
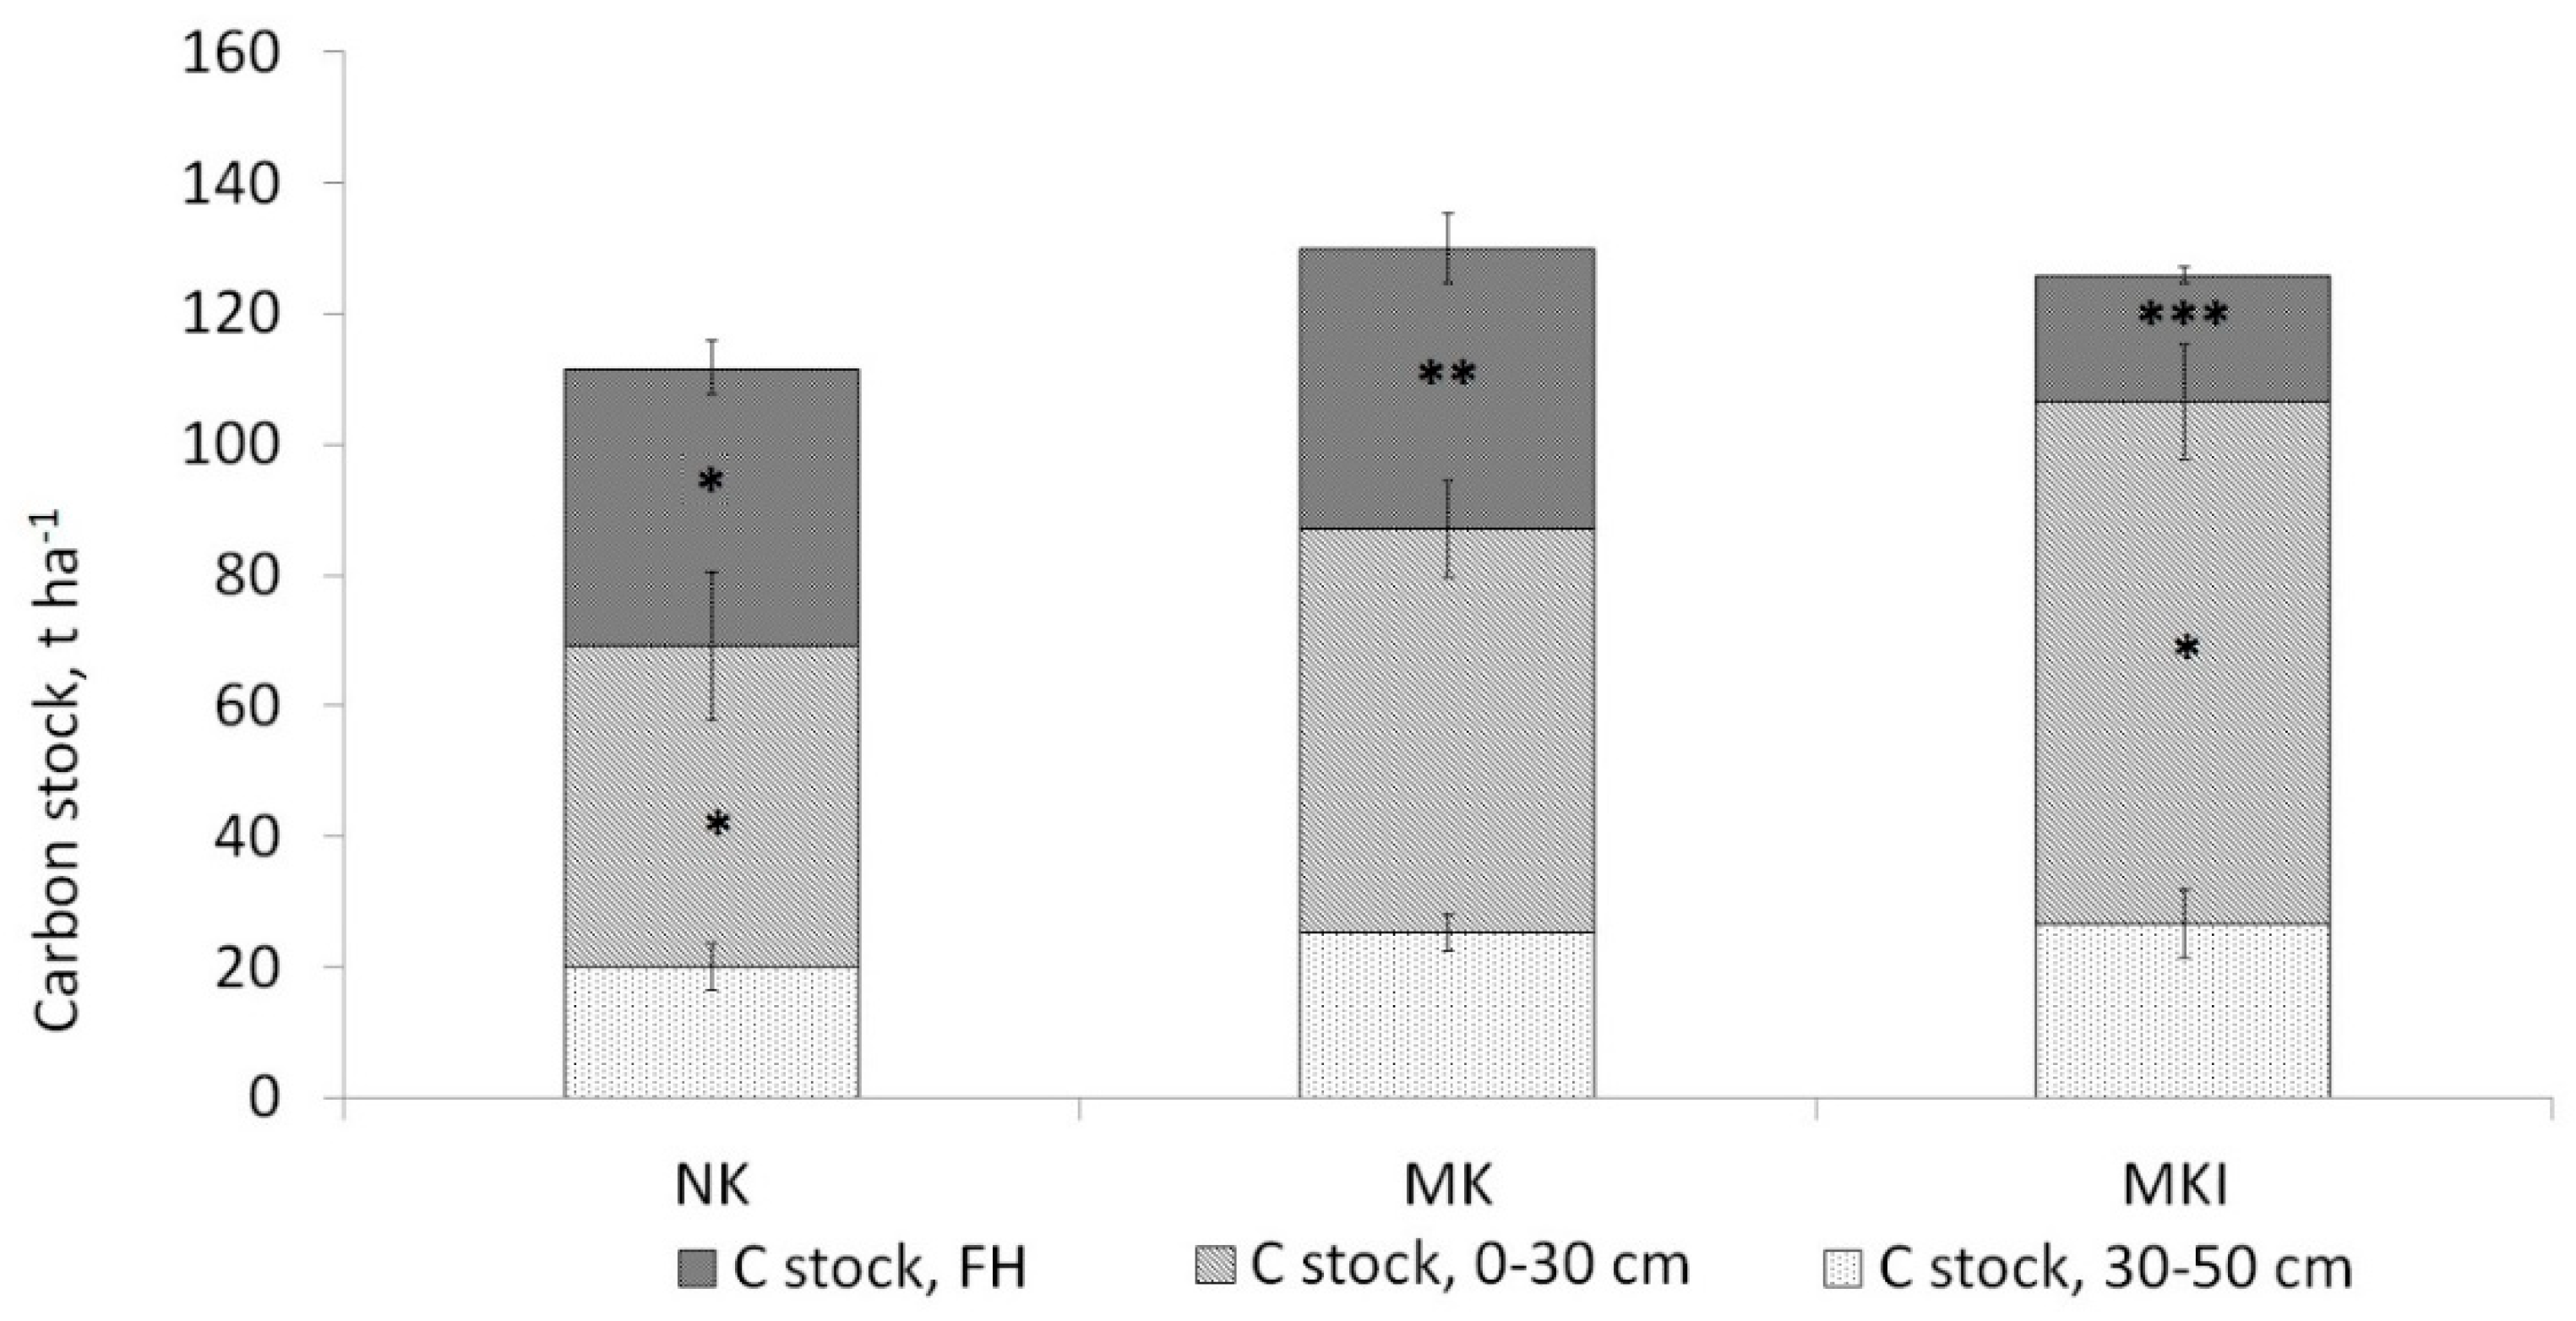
3.2. Soil Carbon Stock
4. Discussion
4.1. Soil Type and Soil Carbon Stocks
4.2. Soil Carbon Stock in the Sites with Different Functional Groups and in Cajander’s Site Types
4.3. Soil Carbon Stock in Forests Dominated by Different Tree Species
4.4. Soil Carbon Stock Comparison Taking into Account Both Tree Species and Ground Vegetation
4.5. Soil Carbon Stock Comparison between the Areas
5. Conclusions
Supplementary Materials
Author Contributions
Funding
Acknowledgments
Conflicts of Interest
References
- Jones, C.; Falloon, P. Sources of uncertainty in global modelling of future soil organic carbon storage. In Uncertainties in Environmental Modelling and Consequences for Policy Making; Springer: Dordrecht, The Netherlands, 2009; pp. 283–315. [Google Scholar]
- Lindner, S.; Peterson, S.; Windhorst, W. An economic and environmental assessment of carbon capture and storage (CCS) power plants: A case study for the City of Kiel. J. Environ. Plan. Manag. 2010, 53, 1069–1088. [Google Scholar] [CrossRef]
- Vesterdal, L.; Clarke, N.; Sigurdsson, B.D.; Gundersen, P. Do tree species influence soil carbon stocks in temperate and boreal forests? For. Ecol. Manag. 2013, 309, 4–18. [Google Scholar] [CrossRef]
- Framstad, E.; Wit, H.; Mäkipää, R.; Larjavaara, M.; Vesterdal, L.; Karltun, E. Biodiversity, Carbon Storage and Dynamics of Old Northern Forests; Nordic Council of Ministers: Copenhagen, Denmark, 2013; p. 130. [Google Scholar]
- Callesen, I.; Liski, J.; Raulund-Rasmussen, K.; Olsson, M.T.; Tau-Strand, L.; Vesterdal, L.; Westman, C.J. Soil carbon stores in Nordic well-drained forest soils—Relationships with climate and texture class. Glob. Chang. Biol. 2003, 9, 358–370. [Google Scholar] [CrossRef]
- Svensson, M.; Jansson, P.-E.; Berggren Kleja, D. Modelling soil C sequestration in spruce forest ecosystems along a Swedish transect based on current conditions. Biogeochemistry 2008, 89, 95–119. [Google Scholar] [CrossRef]
- Stendahl, J.; Johansson, M.B.; Eriksson, E.; Nilsson, A.; Langvall, O. Soil organic carbon in Swedish spruce and pine forests–differences in stock levels and regional patterns. Silv. Fenn. 2010, 44, 5–21. [Google Scholar] [CrossRef]
- De Wit, H.A.; Kvindesland, S. Carbon stocks in Norwegian forest soils and effects of forest management on carbon storage. Rapp. Fraskogforskningen Suppl. 1999, 14, 52. [Google Scholar]
- State of Finland’s Forests 2012 Criterion 1 Forest Resources. Carbon Stock on Forest Land (1.4). Available online: http://www.metla.fi/metinfo/sustainability/c1-carbon-stock.htm (accessed on 7 July 2020).
- Liski, J.; Westman, J. Carbon storage in forest soil of Finland. 1. Effect of thermoclimate. Biogeochemistry 1997, 36, 239–260. [Google Scholar] [CrossRef]
- Payne, N.J.; Cameron, D.A.; Leblanc, J.D.; Morrison, I.K. Carbon storage and net primary productivity in Canadian boreal mixedwood stands. J. For. Res. 2019, 30, 1667–1678. [Google Scholar] [CrossRef]
- Laganiere, J.; Paré, D.; Bergeron, Y.; Chen, H.Y.; Brassard, B.W.; Cavard, X. Stability of soil carbon stocks varies with forest composition in the Canadian boreal biome. Ecosystems 2013, 16, 852–865. [Google Scholar] [CrossRef]
- Order of the Ministry of Natural Resources and Ecology of Russian Federation no. 20-r of June 30, 2017 on Recommendations for Qualitative Measurements of Absorption Volume of Greenhouse Gases. Available online: https://www.garant.ru/products/ipo/prime/doc/71612096/ (accessed on 7 July 2020).
- Dymov, A.A. Soils of Post-Cutting, Post-Pyrogenic and Post-Agrogenic Forest Ecosystems of the Northeast of the European Part of Russia; Moscow State University: Moscow, Russia, 2018; p. 46. (In Russian) [Google Scholar]
- Bakhmet, O.N. Carbon storages in soils of pine and spruce forests in Karelia. Russ. J. For. Sci. 2018, 1, 48–55. [Google Scholar] [CrossRef]
- Lukina, N.V.; Tikhonova, E.V.; Orlova, M.A.; Bakhmet, O.N.; Kryshen, A.M.; Tebenkova, D.N.; Kuznetsova, A.I.; Smirnov, V.E.; Braslavskaya, T.Y.; Gornov, A.V.; et al. Associations between forest vegetation and the fertility of soil organic horizons in northwestern Russia. Ecosystem 2019, 6, 34. [Google Scholar] [CrossRef]
- UNECE ICP Forests Programme Co-Ordinating Centre (Ed.) Manual on Methods and Criteria for Harmonized Sampling, Assessment, Monitoring and Analysis of the Effects of air Pollution on Forests; Thünen Institute of Forest Ecosystems: Eberswalde, Germany, 2016; Available online: http://www.icp-forests.net/page/icp-forests-manual (accessed on 7 July 2020).
- Tikhonova, E.; Tikhonov, G.; Shevchenko, N.; Knyazeva, S.; Plotnikova, A.; Lukina, N.; Shashkov, M. Tree diversity patterns along the latitudinal gradient in the northwestern Russia. For. Ecosyst. 2017, 4, 27. [Google Scholar] [CrossRef]
- Volkov, A.D. Karelian Forest Types; Karelian Research Centre of RAS: Petrozavodsk, Russia, 2008; 180p. (In Russian) [Google Scholar]
- Kryshen, A.M. Types of forest vegetation conditions on automorphic soils in Karelia. Botani. J. 2010, 95, 281–297. (In Russian) [Google Scholar]
- Doronina, A.Y. Vascular Plants of the Karelian Isthmus; Association of Scientific Publications; KMK: Moscow, Russia, 2007; p. 574. (In Russian) [Google Scholar]
- Fedorchuk, V.N.; Neshatayev, V.Y.; Kuznetsova, M.L. Forest Ecosystems of the Northwest Regions of Russia: Typology, Dynamics, Economic Features; Hromis: St.-Petersburg, Russia, 2005; 382p. (In Russian) [Google Scholar]
- Deluca, T.H.; Boisvenue, C. Boreal forest soil carbon: Distribution, function and modelling. Forestry 2012, 85, 161–184. [Google Scholar] [CrossRef]
- Chertov, O.G. Ecology of Forest Land (Soil and Ecological Research of Forest Habitats); Nauka: Leningrad, Soviet Union, 1981. (In Russian) [Google Scholar]
- Salemaa, M.; Derome, J.; Nojd, P. Response of boreal forest vegetation to the fertility status of the organic layer along a climatic gradient. Boreal Environ. Res. 2008, 13, 48–66. [Google Scholar]
- Hotanen, J.P.; Maltamo, M.; Reinikainen, A. Canopy stratification in Peatland Forests in Finland. Silva Fennica 2008, 40, 53–76. [Google Scholar] [CrossRef][Green Version]
- Sukachev, V.N. Concepts Forest Biogeocoenology. Selected Works; Science: Leningrad, Soviet Union, 1972; pp. 311–356. (In Russian) [Google Scholar]
- Lukina, N.V.; Orlova, M.A.; Gornov, A.V.; Kryshen’, A.M.; Kuznetsov, P.V.; Knyazeva, S.V.; Smirnov, V.E.; Bakhmet, O.N.; Eydlina, S.P.; Ershov, V.V.; et al. Assessment of Sustainable Forest Management Criteria with the ICP Forests Indicators. Russ. J. For. Sci. 2013, 5, 62–75. [Google Scholar]
- R Core Team R: A Language and Environment for Statistical Computing; R Foundation for Statistical Computing: Vienna, Austria, 2019; Available online: https://www.R-project.org/ (accessed on 7 July 2020).
- Husson, F.; Le, S.; Pagès, J. Exploratory Multivariate Analysis by Example Using R, 2nd ed.; Chapman and Hall/CRC: New York, NY, USA, 2017. [Google Scholar]
- Le, S.; Josse, J.; Husson, F. FactoMineR: An R package for multivariate analysis. J. Stat. Softw. 2008, 25, Issue1. [Google Scholar] [CrossRef]
- Barton, K. MuMIn: Multi-Model Inference. R Package Version 1.42.1. 2018. Available online: https://CRAN.Rproject.org/package=MuMIn (accessed on 7 July 2020).
- Walsh, C.; Mac Nally, R. Hier.Part: Hierarchical Partitioning. R Package Version 1.0-4. 2013. Available online: https://CRAN.R-project.org/package=hier.part (accessed on 7 July 2020).
- Vitousek, P.M. Beyond global warming: Ecology and global change. Ecology 1994, 75, 1861–1876. [Google Scholar] [CrossRef]
- Berg, B. Litter decomposition and organic matter turnover in northern forest soil. For. Ecol. Manag. 2000, 133, 13–22. [Google Scholar] [CrossRef]
- Coq, S.; Souquet, J.M.; Meudec, E.; Cheynier, V.; Hättenschwiler, S. Interspecific variation in leaf litter tannins drives decomposition in a tropical rain forest of French Guiana. Ecology 2010, 91, 2080–2091. [Google Scholar] [CrossRef]
- Cornwell, W.K.; Cornelissen, J.H.; Amatangelo, K.; Dorrepaal, E.; Eviner, V.T.; Godoy, O.; Hobbie, S.E.; Hoorens, B.; Kurokawa, H.; Pérez-Harguindeguy, N.; et al. Plant species traits are the predominant control on litter decomposition rates within biomes worldwide. Ecol. Lett. 2008, 11, 1065–1071. [Google Scholar] [CrossRef] [PubMed]
- Lukina, N.V.; Orlova, M.A.; Steinnes, E.; Artemkina, N.A.; Gorbacheva, T.T.; Smirnov, V.E.; Belova, E.A. Mass-loss rates from decomposition of plant residues in spruce forests near the northern tree line subject to strong air pollution. Environ. Sci. Pollut. Res. 2017, 24, 19874–19887. [Google Scholar] [CrossRef] [PubMed]
- Li, X.; Han, S.; Zhang, Y. Indirect effects of precipitation variation on the decomposition process of Mongolian oak (Quercus mongolica) leaf litter. Front. China 2007, 2, 417–423. [Google Scholar] [CrossRef]
- Nilsson, M.C.; Wardle, D.A. Understory vegetation as a forest ecosystem driver: Evidence from the northern Swedish boreal forest. Front. Ecol. Environ. 2005, 3, 421–428. [Google Scholar] [CrossRef]
- Hilli, S.; Stark, S.; Derome, J. Litter decomposition rates in relation to litter stocks in boreal coniferous forests along climatic and soil fertility gradients. Appl. Soil Ecol. 2010, 46, 200–208. [Google Scholar] [CrossRef]
- Hilli, S. Significance of Litter Production of Forest Stands and Ground Vegetation in the Formation of Organic Matter and Storage of Carbon in Boreal Coniferous Forests; Forest Condition Monitoring in Finland-National Report; Merilä, P., Jortikka, S., Eds.; The Finnish Forest Research Institute: Vantaa, Finland, 2013; Available online: http://www.metla.fi/metinfo/forest-condition/intensive-monitoring/foliar-chemistry.htm (accessed on 7 July 2020).
- Cornelissen, J.H.; Lang, S.I.; Soudzilovskaia, N.A.; During, H.J. Comparative cryptogam ecology: A review of bryophyte and lichen traits that drive biogeochemistry. Ann. Bot. 2007, 99, 987–1001. [Google Scholar] [CrossRef]
- Gielen, B.; Neirynck, J.; Luyssaert, S.; Janssens, I.A. The importance of dissolved organic carbon fluxes for the carbon balance of a temperate Scots pine forest. Agric. For. Meteorol. 2011, 151, 270–278. [Google Scholar] [CrossRef]
- Ponomareva, V.V. Theory of the Podzol-Forming Process (Biochemical Aspects); Nauka: Moscow, Soviet Union, 1964. (In Russian) [Google Scholar]
- Dalsgaard, L.; Lange, H.; Strand, L.T.; Callesen, I.; Borgen, S.K.; Liski, J.; Astrup, R. Underestimation of boreal forest soil carbon stocks related to soil classification and drainage. Can. J. For. Res. 2016, 46, 1413–1425. [Google Scholar] [CrossRef]
- Buurman, P.; Jongmans, A.G. Podzolisation and soil organic matter dynamics. Geoderma 2005, 125, 71–83. [Google Scholar] [CrossRef]
- Ivanova, E.A.; Lukina, N.V.; Danilova, M.A.; Artemkina, N.A.; Smirnov, V.E.; Ershov, V.V.; Isaeva, L.G. The effect of air pollution on the rate of decomposition of plant litter at the northern limit of pine forests. Russ. J. For. Sci. 2019, 6, 533–546. [Google Scholar] [CrossRef]
- Lukina, N.V.; Ershov, V.V.; Gorbacheva, T.T.; Orlova, M.A.; Isaeva, L.G.; Tebenkova, D.N. Assessment of soil water composition in the Northern taiga coniferous forests of background territories in the industrially developed region. Eurasian Soil Sci. 2018, 51, 277–289. [Google Scholar] [CrossRef]
- Hansson, K.; Fröberg, M.; Helmisaari, H.S.; Kleja, D.B.; Olsson, B.A.; Olsson, M.; Persson, T. Carbon and nitrogen pools and fluxes above and below ground in spruce, pine and birch stands in southern Sweden. For. Ecol. Manag. 2013, 309, 28–35. [Google Scholar] [CrossRef]
- Fedorets, N.G.; Morozova, R.M.; Bakhmet, O.N. Soils and soil cover of Zaonezhie Karelia. Tr. Karel. Nauchnogo Cent. Ross. Akad. Nauk. 2004, 6, 69–89. (In Russian) [Google Scholar]
- Gromtsev, A.N. Secondary forests in the west of the taiga zone of Russia: Origin, current status and dynamics. Boreal For. Status Dyn. Ecosyst. Serv. 2019, 5, 5–16. (In Russian) [Google Scholar]
- Valyaev, V.N. Age structure of pine forests of Karelia. Russ. J. For. Sci. 1968, 6, 36–41. (In Russian) [Google Scholar]
- Rautiainen, A.; Virtanen, T.; Kauppi, P.E. Land cover change on the isthmus of Karelia 1939–2005: Agricultural abandonment and natural succession. Environ. Sci. Pol. 2016, 55, 127–134. [Google Scholar] [CrossRef]


| Factor | Layer, cm | n | |||||
|---|---|---|---|---|---|---|---|
| 0–30 | 30–50 | 0–50 | |||||
| R2 | p | R2 | p | R2 | p | ||
| Areas | 0.24 | <0.001 | 0.04 | 0.167 | 0.17 | <0.001 | 99 * |
| Soil types | 0.23 | <0.001 | 0.00 | 0.436 | 0.15 | <0.001 | 99 |
| Cajander’s types, three areas | 0.10 | 0.005 | 0.05 | 0.079 | 0.11 | 0.004 | 99 |
| Cajander’s types, MK+NK | 0.07 | 0.119 | 0.018 | 0.591 | 0.06 | 0.178 | 60 |
| Cajander’s types, MKI | 0.01 | 0.800 | 0.09 | 0.176 | 0.04 | 0.451 | 39 |
| Trees, three areas | 0.01 | 0.501 | 0.07 | 0.036 | 0.04 | 0.149 | 99 |
| Trees, MK+NK | 0.15 | 0.010 | 0.18 | 0.004 | 0.22 | <0.001 | 60 |
| Trees, MKI | 0.01 | 0.856 | 0.02 | 0.642 | 0.01 | 0.791 | 39 |
| Functional types, three areas | 0.06 | 0.048 | 0.02 | 0.336 | 0.04 | 0.108 | 99 |
| Functional types, NK+MK | 0.10 | 0.042 | 0.05 | 0.240 | 0.11 | 0.035 | 60 |
| Functional types, MKI | 0.02 | 0.734 | 0.02 | 0.759 | 0.00 | 0.941 | 39 |
| Model 1 | Estimate | Std. Error | t | Explained Variance, % | p |
|---|---|---|---|---|---|
| Intercept | 2.399 | 0.263 | 9.123 | <0.001 | |
| log10(C/N) | −0.437 | 0.161 | −2.705 | 34.4 | 0.008 |
| log10(Herbs) | 0.094 | 0.025 | 3.770 | 46.9 | <0.001 |
| log10(Spruce) | 0.070 | 0.033 | 2.124 | 18.7 | 0.036 |
| 0.32; F = 16.04, ν1 = 3, ν2 = 93, p < 0.001 | |||||
© 2020 by the authors. Licensee MDPI, Basel, Switzerland. This article is an open access article distributed under the terms and conditions of the Creative Commons Attribution (CC BY) license (http://creativecommons.org/licenses/by/4.0/).
Share and Cite
Lukina, N.; Kuznetsova, A.; Tikhonova, E.; Smirnov, V.; Danilova, M.; Gornov, A.; Bakhmet, O.; Kryshen, A.; Tebenkova, D.; Shashkov, M.; et al. Linking Forest Vegetation and Soil Carbon Stock in Northwestern Russia. Forests 2020, 11, 979. https://doi.org/10.3390/f11090979
Lukina N, Kuznetsova A, Tikhonova E, Smirnov V, Danilova M, Gornov A, Bakhmet O, Kryshen A, Tebenkova D, Shashkov M, et al. Linking Forest Vegetation and Soil Carbon Stock in Northwestern Russia. Forests. 2020; 11(9):979. https://doi.org/10.3390/f11090979
Chicago/Turabian StyleLukina, Natalia, Anastasia Kuznetsova, Elena Tikhonova, Vadim Smirnov, Maria Danilova, Aleksey Gornov, Olga Bakhmet, Aleksandr Kryshen, Daria Tebenkova, Maxim Shashkov, and et al. 2020. "Linking Forest Vegetation and Soil Carbon Stock in Northwestern Russia" Forests 11, no. 9: 979. https://doi.org/10.3390/f11090979
APA StyleLukina, N., Kuznetsova, A., Tikhonova, E., Smirnov, V., Danilova, M., Gornov, A., Bakhmet, O., Kryshen, A., Tebenkova, D., Shashkov, M., & Knyazeva, S. (2020). Linking Forest Vegetation and Soil Carbon Stock in Northwestern Russia. Forests, 11(9), 979. https://doi.org/10.3390/f11090979