Abstract
Research Highlights: The informed decisions on land use require assessment of the impacts of these decisions on the supply of different ecosystem services. Background and Objectives: Scenario modeling can be used to provide harmonized and quantitative information on the impacts of various zoning decisions on the provision of various ecosystem services. In this study, we explored the effects of land-use zoning decisions on the provision of roundwood and energy wood, carbon stock of living tree components, berry yields, scenic beauty and recreation. Materials and Methods: Three alternative forest scenarios were formulated in terms of restrictions on forest management for already established land-use zones by the provinces in Finland. These data were integrated with the National Forest Inventory (NFI) plot data for forest dynamics modeling. Results: In Finland, 9% of the forest land was protected and 9% was under restricted forest management due to legislative decisions, forest owners’ decisions, or regional land use plans in 2016. These established zoning decisions resulted in an estimated 17% smaller roundwood and energy wood removals per year in 2016–2025 compared to the estimated wood removals in the scenario without any restrictions. The decrease in annual gross stumpage earnings was EUR 775 million per year. The carbon stock of living tree components in 2025 was 12% larger than in the scenario without any restrictions. Bilberry yield increased due to the restrictions considered in our study, while the restrictions had only a slight effect on cowberry yield at province and country levels. The restrictions increased the recreation value, particularly in Lapland, but only slightly affected scenic beauty at province and country levels. Conclusions: Scenario analyses support informed decision making and the balancing of different forest uses. Harmonized translation of restrictions and the use of standard indicators to model the impacts also support comparisons between the regions.
1. Introduction
In recent years, forests have gained much political attention because of their contribution to climate change mitigation. Forests act as carbon sinks, and wood-based products both store carbon and can be used in replacing materials and energy from nonrenewable sources [1]. The forest sector is facing new opportunities in the growing bioeconomy, but at the same time, concerns about the ecological, cultural and social sustainability of forest management have increased [2]. The concept of ecosystem services has become a central framework in cross-sectoral policy making [3,4,5,6,7]. Ecosystem services are defined as the benefits people obtain from ecosystems. They include provisioning (e.g., timber, food), regulating (e.g., climate regulation) and cultural services (e.g., recreation), which directly affect people, and supporting services (e.g., nutrient cycling), which are needed to maintain other services [3]. Consolidation of different ecosystem services together with investments in a bio-based economy calls for analyses of multiple production and use possibilities of forest resources. Before setting the new goals or defining measures related to different ecosystem services, knowledge on the impacts of already established measures, such as prioritizing biodiversity over wood production in certain land-use zones, is required.
In Europe, both forest area and the total growing stock of forests have increased steadily in 1990–2015. At the same time, the forest area designated to the conservation of biodiversity has expanded [8]. For example, in Finland, the area of protected forests is currently 2.9 million hectares, accounting for 13% of forested land (i.e., forest land and poorly productive forest). Most of the protected forests are located in northern Finland, where they amount to 20% of the forest land and poorly productive forest area, whereas only 5% are in southern Finland [9]. This is partly due to the structure of forest ownership, while most protected areas have been established on state-owned land. The importance of forestry and nature-based businesses, such as nature tourism, also varies between the provinces. On one hand, regional goals for the sustainable use and management of forests are set in forest programs outlined by regional forest centers [10]. On the other hand, regional land use planning plays a significant role in setting goals for sustainable development [11]. According to national land use guidelines, land use planning also contributes to the implementation of international agreements, such as the Paris Agreement of Climate Change 2016 and the Conventions on Biological Diversity 1994 [12]. The national objectives, for example, viable natural and cultural environment, natural resources and renewable energy supply [12] must be taken into account in regional land use planning. Regional land use plans are legally binding and set a framework for the more detailed local plans [13]. To ensure social and territorial equity in cross-sectoral forest policy, there is a need for regional analyses on the impacts of policy actions, for example, on the forestry sector, which is an important livelihood sector, particularly in rural Finland.
For forest policy support, the sample plot data of national forest inventories (NFIs) are commonly used as data for national and regional scenario analyses of future use and management potential of forest resources [14,15,16]. Traditionally, scenario modeling has been used in strategic forest planning to predict the potential wood removal that could be harvested sustainably, when the development is based on the current state of the forest and on alternative felling strategies e.g., [14,17,18,19,20,21,22,23]. In this case, the sustainable felling level often refers to the economic sustainability; that is, the felling removal and yield value of the growing stock should not decrease over time. In recent years, forest decision support systems (DSS) and quantitative scenario analyses have also been frequently used in assessing the consequences of alternative forest management strategies on the development of multiple ecosystem services and their joint production possibilities e.g., [24,25,26,27,28,29]. In the previous studies, the complexity of ecosystems services is usually operationalized through indicators that measure the magnitude (“value”) of a benefit to wellbeing [30]. Indicators are generally variables providing aggregated information on certain phenomena [31], and an appropriate set of indicators depends on the ecosystems under interest and the policy context for which they are applied [32]. Provisioning of materials such as wood and berries can be measured and is commonly described, for example, in the form of areas, stocks, increment, harvest and income [33,34]. In scenario analyses of different ecosystem services, indicators related to ecological values have been expressed, for example, as the amount of dead wood, area of old forest and volume of deciduous trees [26,27]. Further examples of ecological indicators used in scenario analyses are habitat areas of valuable or endangered wildlife species or habitat indices indicating habitats suitable for these species [24,25,35]. In previous studies, cultural services have been incorporated into scenario analyses, for example, by using the scenic beauty index and the recreation value [36,37,38,39].
Management interventions such as land use zoning decisions can drive change in one or more ecosystem services. The effects of these interventions can be in opposite (i.e., diminishing one service while enhancing other) or the same direction for two services (i.e., enhancing or diminishing both services) [40]. In this study, we explored the effects of land-use zoning decisions on the provision of various ecosystem services. We applied harmonized and quantitative measures for the impacts of already established decisions by the provinces in Finland. The specific objectives were: (1) to estimate the effects of forest conservation and restricted forest management due to legislative decisions, forest owners’ decisions or regional land use plans on traditional wood production, measured via roundwood and energy wood removal, stumpage earnings, logging costs and need for labor force in silvicultural and logging operations; (2) to estimate the effects of these restrictions on carbon stock of living tree components; and (3) to analyze how these restrictions affect the supply of ecosystem services other than woody biomass, namely bilberry and cowberry yields as well as scenic beauty and recreation value.
2. Materials and Methods
2.1. Study Areas and Field Data
The study extended over the whole of Finland, and the effects of regional land use plans were analyzed for 19 provinces (Figure 1). For the analyses, we used the sample plot data of the 12th NFI (NFI12) measured in 2014–2018. The Finnish NFI is a continuous inventory based on systematic cluster sampling, where one-fifth of the field plots is measured in the entire country each year. The province of Åland in southwestern Finland is an exception; in NFI12, all field plots were measured in 2018, and a spatially balanced sampling tool—the Local Pivotal Method was applied for temporary clusters [41]. Another exceptional area is northernmost Lapland, i.e., the three municipalities in northern Lapland, mostly comprising open fells. There, the NFI method is a two-phase sampling, and all field plots are measured in 1 year during every second inventory round. The area was not covered by the NFI12, and therefore, the NFI11 sample plots from 2012 and 2013 were used for northernmost Lapland. On average, the NFI forest data represented the year 2016, which was the starting point of the analyses. The borders of the provinces valid in 2018 were applied.
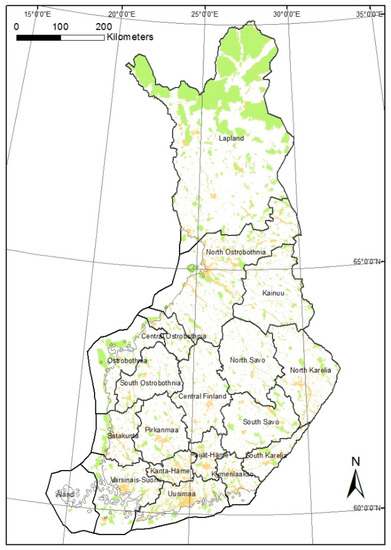
Figure 1.
The provinces in Finland with the forest conservation areas based on legislation (in light green) overlaid on the areas of regional land use plans where forest management is restricted (light orange). Digital map data: National Land Survey of Finland 2020.
The total land area was 303,905 km2, of which 75% was forested land, including forest land (increment at least 1 m3 ha−1 year−1) and poorly productive forest land (increment 0.1–1 m3 ha−1 year−1) (Table 1). The most common tree species were Scots pine (Pinus sylvestris L.) and Norway spruce (Picea abies (L.) Karst.), while birches (Betula spp.) and other deciduous trees (mainly Populus tremula L. and Alnus spp.) had a lower proportion. The number of NFI sample plots on land was 64,579.

Table 1.
Forest estimates based on the NFI12 field plots and total and land areas based on the statistics of the National Land Survey of Finland (in 2018) for the provinces (N = 19) and the whole of Finland.
The NFI12 sampling units were cocentric circular plots with fixed sizes [42]. For trees with a diameter at a breast height (dbh) of 95 mm or larger, the radius was 9 m, while for trees smaller than that but with a dbh of at least 45 mm, the radius was 5.64 m. Trees smaller than 45 mm were measured on an angle count sample plot using a basal area factor of 1.5. In the NFI11 in northern Finland, that is, in the data for the northernmost Lapland, trees were measured on restricted angle count sample plots with a basal area factor (relascope factor) of 1.5 and a maximum radius of 12.45 m. In this study, the tree volumes were estimated by applying species-specific volume functions [43] for each tally tree, summarizing the volume of the growing stock on a sample plot from the estimated tree volumes [44].
2.2. Conservation Areas and Regional Land Use Plans
Map data on nature conservation areas governed by the Nature Conservation Act (1096/1996) [45], areas of stationary relics governed by the Antiquities Act (295/1963) [46] and the regional land use plan (valid in March 2017) (Land Use and Building Act 132/1999) [13] were used for determining restrictions on forest management. The same classification of restrictions as in the operational NFI, with some extensions, was applied (Table 2). In particular, the restrictions set in the regional land use plans were classified in more detail. We also included separate groundwater areas and areas preserving architectural heritage and cultural landscape values. Interpretation of design codes of the regional land use plans involves uncertainty because their restrictive effects on forest management are not unambiguous. In this study, we used interpretations made for lower level plans—see [47], i.e., local-level master plans [48].
Table 2.
Restrictions on forest management applied in different zones.
The information on restrictions was assigned to the NFI sample plots using the geo-coordinates recorded for the plot centers by GPS device in the field. In the operational NFI, this information on protected areas is assigned to the sample plots prior to the field work, and field teams both check the information and have a possibility to record restrictions due to other values observed in the field. These include habitats of special importance in terms of biodiversity protected by the Forest Act (1093/1996) [49], forests along shoreline and habitats of a rare or vulnerable species [42]. In this study, the information on protected areas was updated using the latest map data available, but the other restrictions observed and recorded by the field teams were used as such in the analyses. The latest updates of the data on the conservation areas from the Finnish Environmental Institute (SYKE) were from November 2018, and those of the data on protected areas from the Finnish Heritage Agency were from November 2019. Furthermore, the restrictions due to forest owner decision in state forests, which are provided by Metsähallitus and assigned to the sample plots after the field work, were the same as in the operational NFI (Table 2).
Some subareas of the regional land use plans overlapped with the nature conservation areas or the areas where forest management was restricted due to the owners’ decision. Consequently, the sample plots within the overlapping areas had restrictions from different sources. In these cases, the strictest restriction for forest management was taken into account in the analyses.
2.3. Modeling Forest Scenarios
The Finnish forestry dynamics model MELA was used in scenario analyses. MELA is a forest decision support system generated for Finnish conditions to analyze the regional and national level potentials for wood production and to clarify how to manage forests to meet the overall goals of the society or individual forest owners [50]. The MELA system has been utilized in several regional and national level analyses e.g., [16,22,35,51,52,53,54].
The MELA system consists of a stand simulator based on tree-level models producing a number of feasible management schedules for each management unit [44] and of an optimization package [55], simultaneously selecting a production program for the whole forest area and the corresponding management schedules for all management units that fulfil the set goals. The simulated management schedules were based on development models designed for Finnish conditions [56] and on the management practice recommendations [57,58]. The management activities included regeneration and intermediate felling, clearing of regeneration areas, renovation of ditches, soil preparation, artificial regeneration and tending of young stands. The selection of feasible felling and other management activities was based on the mean characteristics of the management unit (e.g., growing stock, soil properties and vegetation type).
For scenario analyses, sample plots on forest land were classified into three management categories according to the restrictions assigned to the plots: (1) forest management allowed, (2) restricted forest management and (3) forest management not allowed (Table 2). In Category 1, all management activities were simulated. In Category 2, clear-felling, renovation of ditches or soil preparation were not allowed. In Category 3, only natural processes (ingrowth, growth and mortality) were simulated. Furthermore, sample plots on poorly productive forest land were included in Category 3; although light forest management is possible also on these poor soils, often sparsely wooded bogs or rocky outcrops.
Three alternative forest scenarios in terms of restrictions on forest management were compiled separately by the provinces in Finland. The first scenario, “estimation without restrictions” (WRE), was a baseline where none of the zoning decisions (legislative decisions, forest owners’ decisions or regional land use plans) were taken into account. Therefore, the forest management practices were allowed in the whole area of the forest land. In the second scenario (OthersE), only legislative or forest owners’ decisions on forest conservation and restricted forest management were included, but not those based on the regional land use plans. In the third scenario (ProbableE), the regional land use plans were included, and management restrictions were based on the probable interpretations of design codes (Table 2) see [47]. The impacts of different restriction levels on roundwood production, carbon stock of living tree components, as well as other ecosystem services were presented as differences between the output variables compared to the baseline scenario WRE.
Because the main objective was to analyze the impacts of land-use zoning decisions on roundwood production, the net present value of wood production was maximized using a 5% interest rate in all scenarios. The 5% interest rate was chosen because it has been commonly used in the forestry scenario analyses in Finland when analyzing maximum wood supply e.g., [22,59,60]. Consequently, the results show the maximum level of potential wood supply when forests are managed according to the management practice recommendations [57,58], and the profitability requirement is 5%. Price elasticity of both demand and supply as well as maintaining sustained yields at regional level were ignored. Although the results were calculated for 50 years, they were presented for the first 10 year period.
2.4. Calculation of Indicators
The main determinant for the selection of the indicators was that the values of the indicators were able to be estimated using the MELA system. Furthermore, the indicators were selected to represent different types of ecosystem services, i.e., provisioning (indicators representing wood production, bilberry and cowberry yields), regulating (carbon stock of living tree components) and cultural services (recreation value and scenic beauty value). The indicators representing wood production were roundwood and energy wood removals, stumpage earnings, logging costs and the need for labor force in silvicultural and logging operations. In addition, changes in forest land area, volume of growing stock and stumpage price of growing stock in the areas having no restrictions on forest management were used to indicate the effects on wood production. The estimation of these indicators is presented in Hirvelä et al. (2017) [44].
The carbon stock of living tree components on forest land was estimated at the tree level using the MELA system. First, the biomass (dry matter) of a tree was estimated for the different components (stem wood, stem bark, living branches, foliage, dead branches, stump and roots) using species-specific models of Repola (2008; 2009) [61,62], and subsequently, the default value of 50% for the carbon fraction of biomass was applied [44,63].
Bilberry (Vaccinium myrtillus L.) and cowberry (Vaccinium vitis-idaea) yields were predicted in the MELA system with empirical berry models of Miina et al. (2009) [64] and Turtiainen et al. (2013) [65], respectively. In both model sets, the mean coverage of the berry species (%) is predicted first as a function of forest site and stand parameters, and then, berry yields (kg year−1) are evaluated using the predicted coverages and stand parameters such as stand age, basal area and dominant tree species [64,65,66].
The recreation value and the scenic beauty value were calculated using the stand level models of Pukkala et al. (1988) [67]. According to these models, both values are positively associated with the size or age of the trees, the pine volume and the volume of birches and aspen, while they are negatively associated with the number of stems per hectare [67]. At first, the recreation and scenic beauty values were predicted for each sample plot in 2025. After that, the scenic beauty and recreation values for each province were estimated as a weighted mean of the predicted values, using the sample plot areas as weights [68].
3. Results
3.1. Effects on Wood Production
In the whole country, the area of forest land in 2016 was 20.3 million ha, of which 1,823,000 ha (9%) was protected and 1,007,000 ha (5%) was under restricted forest management based on legislative or forest owners’ decisions (OthersE). When the regional land use plans were taken into account (ProbableE), the area of protected forest further increased by 38,000 ha (by 0.2% of the total forest area) and the forest area under restricted forest management by 868,000 ha (4%). Thus, in ProbableE, the total area where forest management was restricted or not allowed was 3,736,000 ha (18%). Compared to WRE, in ProbableE, the difference in the area having no restrictions on forest management was most significant in Lapland (−35%), followed by the provinces Kanta-Häme (−25%) and Uusimaa (−24%) (Figure 2a). In Lapland, most of the decrease was due to legislative decision on nature protection, while in Kanta-Häme and Uusimaa, most of the decrease was caused by the restrictions set in the regional land use plans.
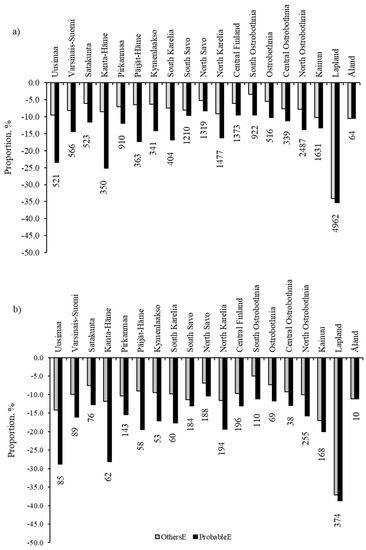
Figure 2.
The proportion of (a) area with restrictions on forest management and (b) volume of the growing stock in the areas with restrictions on forest management in OthersE and ProbableE in different provinces in Finland. The numbers below the bars represent the total area (million ha−1) of forest land and the volume (million m−3) of the growing stock in forest land in each province in 2016.
In Finland, the total volume of the growing stock on forest land was 2409 million m3 in 2016, and in OthersE, 5% of this was under restricted forest management and 9% on protected forest land. In ProbableE, these proportions were 10% and 9%, respectively. In all provinces, the proportion of volume was higher in the area with restrictions on forest management than that of area with restrictions on forest management in OthersE and ProbableE (compare Figure 2a,b). The stumpage price of the growing stock on protected forest land was EUR 6.1 and 6.2 billion in OthersE and ProbableE, respectively.
In ProbableE, the estimated annual roundwood removal was 17% smaller than in WRE (125 million m3 year−1) in 2016–2025 throughout the country. The largest proportion of this was due to the restrictions based on legislative or forest owners’ decisions (OthersE), with less than 2% being due to regional land use plans. In ProbableE, the impact of the restrictions on roundwood removal was highest in Lapland (−48%) and in Kainuu (−30%), where most of the nature conservation areas are located (Figure 3). In Southern Finland, this effect was most pronounced (−21%) in the province Uusimaa. This province includes the capital, Helsinki, and densely populated urban areas around it, and therefore, the effect of the regional land use plan was higher there than in any other province in Finland. Because most of the protected areas have been established on state-owned land (State of Finland’s Forests 2012), the difference between WRE and ProbableE in roundwood removal was moderate (−5.5%) in privately owned forests in Finland. In different provinces, this decrease was 0.3%–9.8% in privately owned forests. In such forests, the decrease was most pronounced in the province Uusimaa. In ProbableE, the estimated annual removal of energy wood was 17% smaller than in WRE. The regional land use plans accounted for 4% of that decrease. The estimated gross stumpage earnings in 2016–2025 decreased by EUR 775 million per year in ProbableE compared to WRE. Due to the largest decrease in roundwood removal, the decrease in gross stumpage earnings was also most pronounced in Lapland (−46%), Kainuu (−31%) and Uusimaa (−21%) (Figure 4a). In ProbableE, the logging costs decreased by 42%, 28% and 23%, respectively, compared to WRE. (Figure 4b). The effect of the restrictions on the labor force employed in silvicultural and logging operations was a decrease in 4100 man-years per year in OthersE and 4700 man-years per year in ProbableE.
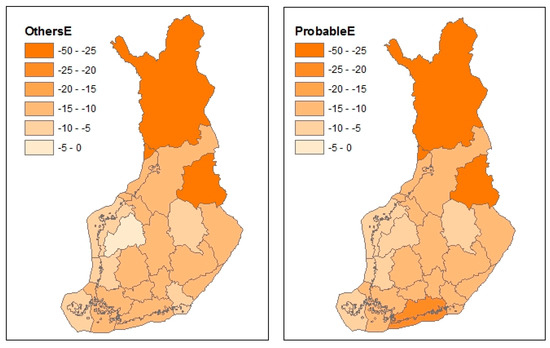
Figure 3.
Estimated roundwood removals in 2016–2025 according to the scenarios OthersE and ProbableE, compared to the wood removal in the estimation without restrictions (WRE) scenario (%) by the provinces in Finland. Digital map data: National Land Survey of Finland 2020.
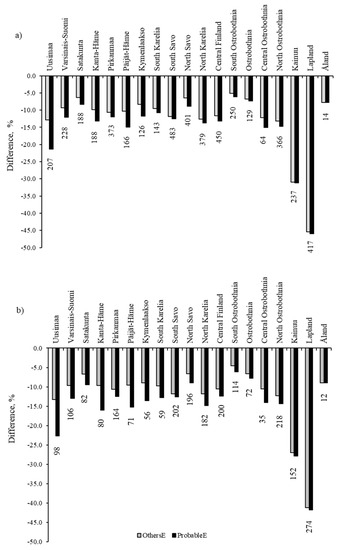
Figure 4.
Difference (%) in (a) gross stumpage earnings and (b) logging costs in OthersE and ProbableE compared to the WRE scenario in different provinces in Finland. The numbers below the bars represent the gross stumpage earnings (million EUR year−1) and logging costs (million EUR year−1) in forest land in each province in the WRE in 2016–2025.
3.2. Effects on Carbon Stock
The carbon stock of the living tree components on forest land and poorly productive forest land was 866 million tons in 2016. In OthersE, 11% of the carbon stock was in protected forests and 6% on land where forest management was restricted based on legislative or forest owner’s decisions. In ProbableE, these proportions were 11% and 10%, respectively.
In the estimation without any restrictions (WRE), the carbon stock of living tree components was 727 million tons in 2025 throughout the country. In OthersE, the carbon stock was 11% larger than in the WRE scenario. The restrictions of the regional land use plans (ProbableE) further increased the positive effect, with the carbon stock being 12% larger than in the WRE scenario. Again, forest conservation had the greatest positive effect on carbon stock in Lapland and Kainuu. The effects of the regional land use plans were more evident in southern Finland; in ProbableE, the greatest relative increases in carbon stock compared to the stock in the WRE scenario were found in Uusimaa (Figure 5).
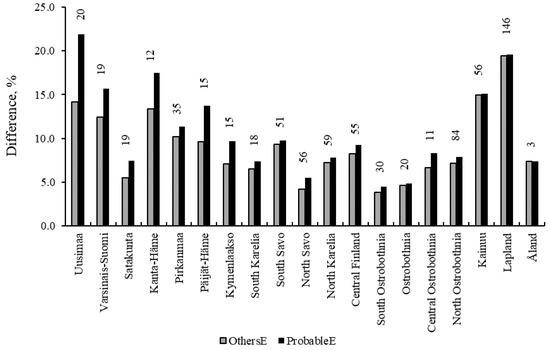
Figure 5.
Estimated difference (%) in carbon stock of living tree components in OthersE and ProbableE compared to WRE for the provinces in Finland in 2025. The numbers above the bars represent the carbon stock (million tons) in forest land and poorly productive forest land in WRE in 2025.
3.3. Effects on Bilberry and Cowberry Yields
In Finland, the estimated bilberry yield was 175 million kg year−1 in 2016–2025 when forest management was allowed in all forest land (WRE). Compared to WRE, the annual bilberry yield was 8% and 9% larger in OthersE and ProbableE, respectively. The difference to WRE was most pronounced in Kainuu (+10%) and Lapland (+16%) in both scenarios (Figure 6). The effect of regional land use plans on bilberry yield was highest in Uusimaa, where the increase was 5% and 9% in OthersE and ProbableE, respectively, compared to WRE. In the same period, the estimated cowberry yield was 264 million kg year−1 when the restrictions were not taken into account in the calculations (WRE). The restrictions only slightly decreased the cowberry yield both at the country and province level.
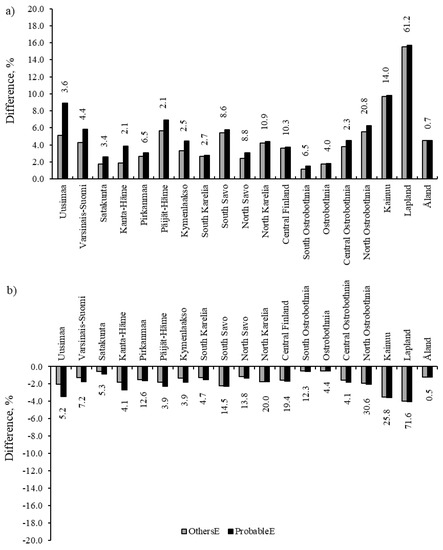
Figure 6.
Differences in (a) bilberry and (b) cowberry yields in OthersE and ProbableE compared to WRE in different provinces in Finland. The numbers above/below the bars represent the estimated bilberry and cowberry yields (million kg year−1) in forest land in each province in WRE in 2016–2025.
3.4. Effect on Scenic Beauty and Recreation Values
The mean recreation value was 5.04, and the mean scenic beauty value 5.39 for forest land and poorly productive forest land in the whole of Finland in WRE in 2025. At the sample plot level, the recreation value was 0.71–15.94, and the scenic beauty value was 1.10–10.05. In ProbableE, the restrictions on forest management increased the mean recreation value to 5.29 at the country level. At the province level, the relative increase in the recreation value due to restrictions (ProbableE) was the largest (9.2%) in Lapland and the lowest in South Ostrobothnia (1.1%). The restrictions only slightly affected the scenic beauty index at the country level. Additionally, at the province level, the effects of different scenarios on the scenic beauty value were smaller than those on the recreation value.
3.5. Synthesis of the Effects at Country Level
Forest management restrictions had negative effects on wood production (Figure 7). At the country level, in ProbableE, the values of variables representing wood production (except logging costs) were 16%–20%, while in OthersE, they were 13%–16% lower than in WRE. Compared to WRE, in ProbableE, the largest decreases were detected in the volume of the growing stock and the stumpage price of the growing stock in the areas without any restrictions on forest management. In OthersE, the decrease was most pronounced for the volume of roundwood removal and need for labor force in silvicultural and logging operations. The positive impact on wood production was the reduction in logging costs, which were 15% lower in OthersE and 17% lower in ProbableE than in WRE.
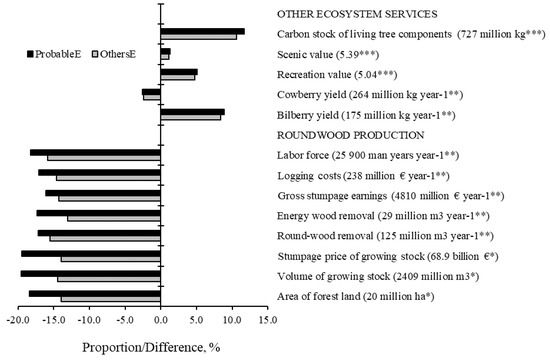
Figure 7.
Effects of restrictions (%) on roundwood production and other ecosystem services in OthersE and ProbableE at the country level. The values for area of forest land, volume of growing stock and stumpage price of growing stock represent the areas without restrictions on forest management in ProbableE and OthersE compared to WRE. Carbon stock of living tree components, scenic beauty value and recreation value are presented for forest land and poorly productive forest land, while other variables are presented for forest land. In parentheses, the values of the variables are presented for the years * = 2016, ** = 2016–2025 and *** = 2025.
At the country level, the restrictions had the highest positive impact on carbon stock of living tree components. In OthersE, the carbon stock of living tree components was 11% higher, while in ProbableE, it was 12% higher than in WRE in 2025. The restrictions on forest management increased bilberry yield, but the effect on cowberry yield was small at the country level. The effects on scenic value and recreation value were also small at the country level.
4. Discussion
4.1. Impacts of Land-Use Zoning Decisions on Ecosystem Services from Forests
In our study, the areas with different restrictions on forest management covered nearly one-fifth of the forest land area in Finland. Consequently, the immediate decrease in roundwood removal due to these restrictions was 17%, which meant a decrease of EUR 775 million year−1 in the gross stumpage earnings in 2016–2025. There are large differences between the different provinces in the allocation of the effects on wood production. According to our study, the proportion of areas with different restrictions on forest management was the largest in the provinces Lapland, Kanta-Häme and Uusimaa. However, the relative effect of the restrictions on roundwood removal was most pronounced in Lapland and Kainuu. This is due to the high proportion of protected areas in these provinces. In Finland, most of the protected areas are located in state-owned forests [69], and therefore, in Lapland and Kainuu, the economic impacts of the restrictions on forest management in certain areas are focused on the state. In Uusimaa and Kanta-Häme, the proportion of areas covered by regional land use plans is the largest, because urban concentration increases the need for land use planning. In our study, forest management was not totally restricted in most of these areas; however, such restrictions decreased roundwood removal, albeit to a lower extent in Kanta-Häme than in Uusimaa. This was due to differences in the structure of forests in the areas with restrictions on forest management in these two provinces. The decrease in roundwood removal and, therefore, in gross stumpage earnings because of the restrictions was more pronounced for private forest owners and companies in Uusimaa than in other provinces. Because a high proportion of forest land is owned by private forest owners and companies in Uusimaa (85%, average in Finland 68%) [70] and large areas are under restricted forest management, the effects on roundwood removal are larger than in other parts of Finland. In Uusimaa, the financial gains of forest owners may contrast with public benefits such as recreational use compare [71].
The restrictions on forest management increased the carbon stock of living tree components. This result corresponds to other studies, where the different management scenarios showed trade-offs between roundwood production and carbon storage e.g., [72,73]. Similarly, in studies based on forest ecosystem models e.g., [74], the increase in forest conservation areas has resulted in a higher carbon stock in forests. However, the trade-offs between timber and carbon storage or carbon sequestration are different. A high correlation has been found between the stands that provide the highest harvest revenues and carbon storage, while a much weaker correlation has been observed between the stands that provide the highest harvest revenues and carbon sequestration measures [75]. For example, in Finland, carbon sequestration is usually higher in fast-growing young forests, which provide low harvest revenues, than in mature forests e.g., [76]. However, the trade-offs for the production of carbon stock in the forest and the harvested amount of carbon have implications also for the carbon in long-term wood products and the replacement of fossil fuel consumption with bioenergy [74,77]. The carbon sinks can be increased, and CO2 emissions can be decreased with adequate land use [78] and forest management planning.
Based on the results of our study, the bilberry yields are larger due to the restrictions on forest management at regional and country levels. This result corresponds to the study of Pukkala (2016) [25], according to which bilberry suffers from clear-fellings. Therefore, the bilberry benefits from the restrictions on forest management, which included the restrictions on clear-fellings. According to Pukkala (2016) [25], cowberry becomes highly productive after clear-felling. This is in agreement with our study, in which the cowberry yield was slightly lower, both at regional and country levels, when forest management was restricted in certain areas.
According to the previous studies on scenario analyses of different ecosystem services e.g., [27,72,73,79], roundwood production affect negatively recreation. In our study, the recreation value increased due to the restrictions on forest management, with the highest increase in Lapland. This is due to the large area of protected forests in Lapland. Most of the protected areas are located in northern Lapland, where the forests are old and pine-dominated, with a low stem number [80,81,82]. According to the functions of Pukkala et al. (1988) [67], these features increase the recreation value. The restrictions had only a slight impact on the scenic beauty. This result was opposite to the study of Biber et al. (2015) [79], according to which the socioeconomic functions, such as scenic beauty, generally decrease with more intensive forest management. However, in their study, strong region-specific differences were observed due to regional forest history and societal perceptions and preferences. In the study of Silvennoinen et al. (2002) [83], the regenerative cuttings had a negative impact on scenic beauty, while thinning had a positive impact. These authors found that a highly negative immediate impact of clear-fellings could be avoided by using natural regeneration with seed trees. In the function of Pukkala et al. (1988) [67] used in our study, a decrease in stem number increases the scenic value, while a decrease in the diameter weighted by the basal area decreases the scenic value. In northern Lapland, although the forests are old, the trees have a small diameter [84], and therefore, in Lapland, the scenic value did not increase as much as the recreation value.
The effects of land-use zoning decisions on the provision of different ecosystem services vary from one province to another. The quantitative estimation represented in our study could provide decision support when analyzing the effects of different options for land-use zoning on multiple ecosystem services in the preparation phase of new regional land use plans. The effects depend on the extent of areas having restrictions on forest management, structure of forests and type of zoning decisions. Therefore, the need and usefulness for this kind of estimation should be examined on a case-by-case basis.
4.2. Evaluation of the Method
The objective of our study was to maximize profits from wood production using a 5% interest rate. Because of this objective, the forests which did not meet the demand of the 5% profit were cut. If the demand for the profit was below 5%, less cuttings would have been made during the first 10 year period. However, the aim of the study was to analyze the immediate effects of restrictions on wood production, and therefore, the use of a high interest rate and the consideration of only the first 10 year period were justified.
Our interpretations on the effects of different restrictions on forest management include uncertainty, because the actual impacts are not known before the zoning decisions of regional land use plans are realized [47]. However, our study provides valuable information for land use planners on the potential impacts of the current decisions on ecosystem services, which can be used in the future to support informed decision making and to facilitate balancing between different forest uses. In the future, the indicators related to other ecosystem services (e.g., game habitats) and biodiversity could be included in the analyses.
The scenarios with restrictions on forest management (OthersE and ProbableE) were compared to the scenario without any restrictions on forest management (WRE); all scenarios were built for the maximization of roundwood production. Therefore, they did not maximize the carbon stock of living tree components, berry yields, scenic beauty value or recreation value, and these ecosystem services were not considered here as the main targets of forest management. If the objective of the scenarios was to maximize the production of one of these other ecosystem services, the effects of land-use zoning decisions would have been different.
The carbon stock change was represented only for the living tree components. In future studies, it would be important to develop the estimation of carbon in peat soils and to include the soil carbon stock change in mineral and peat soils in the impact analyses.
The outputs produced for cowberry and bilberry yields include high uncertainty, which is due to the high variability of the yields between the years due to the differences in growing conditions (e.g., weather). Therefore, the results represented in this study show only indicative effects of the restrictions on forest management on berry yields in different regions.
We used stand-level models to estimate the scenic beauty and recreation values. However, the accessibility or visibility of the stands were not taken into account. Therefore, even if a sample plot had a high recreation value in our estimations, it could have a low recreation value in reality because of low accessibility. Similarly, the high scenic beauty value of a stand can be worthless if it is not accessible [85].
5. Conclusions
Scenario analyses can provide invaluable information on the impacts of land-use zoning decisions on different ecosystem services. Although the impacts on wood production can be negative, the effects on some other ecosystem services can be positive. The regional differences in the amount of impacts are due to the differences in the area with restrictions on forest management and in the structure of forests. Furthermore, the type of zoning decisions has effects on the amount of impacts. The amount of effects on different ecosystem services varies between different forest owner groups at the regional level. This is due to differences in the structure of forest owners, the structure of forests owned by different forest owners and the allocation of different areas with restrictions on forest management in different provinces. The application of a harmonized interpretation of restrictions on forest management and quantitative indicators enables the comparison of consequences between the provinces. The results can be used to support informed decision making and to facilitate balancing between different forest uses.
Author Contributions
Conseptualization, L.K., H.H. (Helena Haakana), H.H. (Hannu Hirvelä), R.L. and T.P.; formal analysis, L.K., H.H. (Helena Haakana); methodology, L.K., H.H. (Helena Haakana), H.H. (Hannu Hirvelä), R.L. and T.P.; project administration, L.K.; supervision, T.P.; validation, L.K.; visualization, L.K. and H.H. (Helena Haakana); writing—original draft, L.K. and H.H. (Helena Haakana); writing—review and editing, H.H. (Hannu Hirvelä), R.L. and T.P. All authors have read and agreed to the published version of the manuscript.
Funding
The study was carried out within the project “NFI2020”, supported financially by the Ministry of Agriculture and Forestry of Finland.
Acknowledgments
We would like to thank the staff members of the Natural Resources Institute Finland (Luke), who contributed to the NFI materials applied in this study. We would also like to thank Annika Kangas from Luke and the anonymous referees for their valuable comments on the manuscript.
Conflicts of Interest
The authors declare no conflict of interest. The sponsors had no role in the design, execution, interpretation, or writing of the study.
Availability of Data and Material
The original NFI datasets and the generated datasets used in MELA scenario analyses are not publicly available due to restrictions concerning locational information. Digital map data on conservation areas and land-use plans are available from the Finnish Environment Institute. Other map data used in this study are available from the National Land Survey of Finland, but restrictions may apply to the availability of these data.
References
- The European Parliament and the Council of European Union. Renewable Energy Directive 2018/2001/EU. Off. J. Eur. Union 2018, 5, 82–209. Available online: https://eur-lex.europa.eu/legal-content/EN/TXT/?uri=CELEX%3A32018L2001 (accessed on 11 August 2020).
- Alberdi, I.; Michalak, R.; Fischer, C.; Gasparini, P.; Brändli, U.-B.; Tomter, S.M.; Kuliesis, A.; Snorrason, A.; Redmond, J.; Hernández, L.; et al. Towards harmonized assessment of European forest availability for wood supply in Europe. For. Policy Econ. 2016, 70, 20–29. [Google Scholar] [CrossRef]
- Millennium Ecosystem Assessment. Ecosystem and Human Well-being. In Synthesis; Island Press: Washington, DC, USA, 2015; Available online: https://www.millenniumassessment.org/documents/document.356.aspx.pdf (accessed on 11 April 2020).
- EC. EU Biodiversity Action Plan. Halting the Loss of Biodiversity by 2010—And Beyond—Sustaining Ecosystem Services for Human Well-Being. 2016. Available online: http://ec.europa.eu/environment/nature/biodiversity/comm2006/index_en.htm (accessed on 4 May 2020).
- EC. Our Life Insurance, Our Natural Capital: An EU Biodiversity Strategy to 2020. COM(2011) 244 Final. 2011. Available online: http://eur-lex.europa.eu/legal-content/EN/TXT/?uri=CELEX:52011DC0244 (accessed on 4 May 2020).
- Forest Europe; UNECE; FAO. State of Europe’s Forests 2011. Status and Trends in Sustainable Forest Management in Europe. 2011. Available online: https://www.foresteurope.org/documentos/State_of_Europes_Forests_2011_Report_Revised_November_2011.pdf (accessed on 5 May 2020).
- EC. A New Forest Strategy: For Forests and the Forest-Based Sector. COM(2013) 659 Final. 2013. Available online: https://eur-lex.europa.eu/resource.html?uri=cellar:21b27c38-21fb-11e3-8d1c-01aa75ed71a1.0022.01/DOC_1&format=PDF (accessed on 4 May 2020).
- Forest Europe. State of Europe’s Forests 2015. 2015. Available online: https://www.foresteurope.org/docs/fullsoef2015.pdf (accessed on 5 May 2020).
- Natural Resources Institute Finland. Statistics Database: Protected Areas, Biodiversity Conservation Sites in Commercial Forests, and Areas Supporting Conservation of Nature Values, by Region (1000 ha). 2019. Available online: http://statdb.luke.fi/PXWeb/pxweb/en/LUKE/LUKE__04%20Metsa__02%20Rakenne%20ja%20tuotanto__04%20Metsien%20suojelu/02_metsien-suojelu.px/?rxid=001bc7da-70f4-47c4-a6c2-c9100d8b50db (accessed on 18 April 2020).
- Kangas, A.; Saarinen, N.; Saarikoski, H.; Leskinen, L.A.; Hujala, T.; Tikkanen, J. Stakeholder perspectives about proper participation for Regional Forest Programmes in Finland. For. Policy Econ. 2010, 12, 213–222. [Google Scholar] [CrossRef]
- UN. The 2030 Agenda for Sustainable Development. 2018. Available online: https://sustainabledevelopment.un.org/?menu=1300 (accessed on 6 May 2020).
- Government Decision on Finland’s National Land Use Guidelines. 2017. Available online: https://www.ym.fi/download/noname/%7BC8DAA05E-FBC8-490E-A805-37BCE01A1E43%7D/138177 (accessed on 5 May 2020).
- Land Use and Building Act. Maankäyttö- ja Rakennuslaki 5.2.1999/132. Available online: https://www.finlex.fi/en/laki/kaannokset/1999/en19990132.pdf (accessed on 28 February 2020).
- Nuutinen, T.; Kilpeläinen, A.; Hirvelä, H.; Härkönen, K.; Ikonen, V.-P.; Lempinen, R.; Peltola, H.; Wilhelmsson, L.; Kellomäki, S. Future wood and fiber resources in the region of North Karelia. Silva Fenn. 2009, 43, 489–505. [Google Scholar] [CrossRef][Green Version]
- Barreiro, S.; Schelhaas, M.J.; Kändler, G.; Antón-Fernandéz, C.; Colin, A.; Bontemps, J.D.; Alberdi, I.; Condés, S.; Dumitru, M.; Ferezliev, A.; et al. Overview of methods and tools for evaluating future woody biomass availability in European countries. Ann. For. Sci. 2016, 73, 823–837. [Google Scholar] [CrossRef]
- Kärkkäinen, L.; Haakana, H.; Hirvelä, H.; Packalen, T. Using a decision support system to study impacts of land use policies on wood procurement possibilities of the sawmill industry—A case study at regional and municipal levels. For. Policy Econ. 2019, 103, 136–146. [Google Scholar] [CrossRef]
- Siitonen, M. Experiences in the use of forest management planning models. Silva Fenn. 1993, 27, 167–178. [Google Scholar] [CrossRef]
- Jonsson, B.; Jacobsson, J.; Kallur, H. The Forest Management Planning Package. Theory and Application; Studia Forestalia Suecica: Huddersfield, UK, 1993; Volume 189, 56p, ISBN 91-576-4698-8. [Google Scholar]
- Eid, T.; Hobbelstad, K. AVVIRK-2000: A Large-scale Forestry Scenario Model for Long-term Investment, Income and Harvest Analyses. Scand. J. For. Res. 2000, 15, 472–482. [Google Scholar] [CrossRef]
- Eid, T.; Hoen, H.F.; Økseter, P. Timber production possibilities of the Norwegian forest area and measures for a sustainable forestry. For. Policy Econ. 2002, 4, 187–200. [Google Scholar] [CrossRef]
- Eriksson, L.O.; Sallnäs, O.; Ståhl, G. Forest certification and Swedish wood supply. For. Policy Econ. 2007, 9, 452–463. [Google Scholar] [CrossRef]
- Nuutinen, T.; Hirvelä, H.; Hynynen, J.; Härkönen, K.; Hökkä, H.; Korhonen, K.T.; Salminen, O. The role of peatlands in Finnish wood production—An analysis based on large-scale forest scenario modelling. Silva Fenn. 2000, 34, 131–153. [Google Scholar] [CrossRef]
- Wikström, P.; Edenius, L.; Elfving, B.; Eriksson, L.O.; Lämås, T.; Sonesson, J.; Öhman, K.; Wallerman, J.; Waller, C.; Klintebäck, F. The Heureka Forestry Decision Support System: An overview. Math. Comput. For. Nat. Resour. Sci. 2011, 3, 87–94. [Google Scholar]
- Kline, J.D.; Harmon, M.E.; Spies, T.A.; Morzillo, A.T.; Pabst, R.J.; McComb, B.C.; Schnekenburger, F.; Olsen, K.A.; Csuti, B.; Vogeler, J.C. Evaluating carbon storage, timber harvest, and habitat possibilities for a Western Cascades (USA) forest landscape. Ecol. Appl. 2016, 26, 1–16. [Google Scholar] [CrossRef] [PubMed]
- Pukkala, T. Which type of forest management provides most ecosystem services? For. Ecosyst. 2016, 3, 9. [Google Scholar] [CrossRef]
- Heinonen, T.; Pukkala, T.; Mehtätalo, L.; Asikainen, A.; Kangas, J.; Peltola, H. Scenario analyses for the effects of harvesting intensity on development of forest resources, timber supply, carbon balance and biodiversity of Finnish forestry. For. Policy Econ. 2017, 80, 80–98. [Google Scholar] [CrossRef]
- Eggers, J.; Holmgren, S.; Nordström, E.-M.; Lämås, T.; Lind, T.; Öhman, K. Balancing different forest values: Evaluation of forest management scenarios in a multi-criteria decision analysis framework. For. Policy Econ. 2019, 103, 55–69. [Google Scholar] [CrossRef]
- Eyvindson, K.; Repo, A.; Mönkkönen, M. Mitigating forest biodiversity and ecosystem service losses in the era of biobased economy. For. Policy Econ. 2018, 92, 119–127. [Google Scholar] [CrossRef]
- Vauhkonen, J.; Packalen, T. Shifting from even-aged management to less intensive forestry in varying proportions of forest land in Finland: Impacts on carbon storage, harvest removals, and harvesting costs. Eur. J. For. Res. 2019, 138, 219–238. [Google Scholar] [CrossRef]
- de Groot, R.S.; Alkemade, R.; Braat, L.; Hein, L.; Willemen, L. Challenges in integrating the concept of ecosystem services and values in landscape planning, management and decision making. Ecol. Complex. 2010, 7, 260–272. [Google Scholar] [CrossRef]
- Muller, F.; Burkhard, B. The indicator side of ecosystem services. Ecosyst. Serv. 2012, 1, 26–30. [Google Scholar] [CrossRef]
- Layke, C.; Mapendembe, A.; Brown, C.; Walpole, M.; Winn, J. Indicators from the global and sub-global Millennium Ecosystem Assessments: An analysis and next steps. Ecol. Indic. 2012, 17, 77–87. [Google Scholar] [CrossRef]
- Hansen, K.; Malmaeus, M. Ecosystem services in Swedish forests. Scand. J. For. Res. 2016, 31, 626–640. [Google Scholar] [CrossRef]
- Mononen, L.; Auvinen, A.-P.; Ahokumpu, A.-L.; Rönkä, M.; Aarras, N.; Tolvanen, H.; Kamppinen, M.; Viirret, E.; Kumpula, T.; Vihervaara, P. National ecosystem service indicators: Measures of social-ecological sustainability. Ecol. Indic. 2016, 61, 27–37. [Google Scholar] [CrossRef]
- Haakana, H.; Hirvelä, H.; Hanski, I.K.; Packalen, T. Comparing regional forest policy scenarios in terms of predicted suitable habitats for the Siberian flying squirrel (Pteromys volans). Scand. J. For. Res. 2017, 32, 185–195. [Google Scholar] [CrossRef]
- Raitio, K.; Tikkanen, O.-P.; Heinonen, T.; Matero, J.; Kouki, J. Metsien käyttöskenaarioiden sosiaaliset vaikutukset. In Uhanalaisten Lahopuulajien Elinympäristöjen Turvaaminen Suojelualueilla ja Talousmetsissä. Kustannustehokkuus ja Ekologiset, Ekonomiset sekä Sosiaaliset Vaikutukset Kitsin Seudulla Lieksassa; Kouki, J., Tikkanen, O.-P., Eds.; Suomen Ympäristö: Helsinki, Finland, 2007; Volume 24, pp. 51–61. (In Finnish) [Google Scholar]
- Tikkanen, O.-P.; Heinonen, T.; Matero, J.; Kouki, J. Metsien käyttöskenaarioiden vaikutukset puuntuotantoon, virkistyskäyttöön ja lajien habitaatin määrään. In Uhanalaisten Lahopuulajien Elinympäristöjen Turvaaminen Suojelualueilla ja Talousmetsissä. Kustannustehokkuus ja Ekologiset, Ekonomiset sekä Sosiaaliset Vaikutukset Kitsin Seudulla Lieksassa; Kouki, J., Tikkanen, O.-P., Eds.; Suomen Ympäristö: Helsinki, Finland, 2007; Volume 24, pp. 44–50. (In Finnish) [Google Scholar]
- Frank, S.; Fürst, C.; Koschke, L.; Witt, A.; Makeschin, F. Assessment of landscape aesthetics—Validation of a landscape aesthetics—Validation of a landscape metrics-based assessment by visual estimation of the scenic beauty. Ecol. Indic. 2013, 32, 222–231. [Google Scholar] [CrossRef]
- Fürst, C.; Frank, S.; Witt, A.; Koschke, L.; Makeschin, F. Assessment of the effects of forest land use strategies on the provision of ecosystem services at regional scale. J. Environ. Manag. 2013, 127, 96–116. [Google Scholar] [CrossRef] [PubMed]
- Bennett, E.M.; Peterson, G.D.; Gordon, L.J. Understanding relationships among multiple ecosystem services. Ecol. Lett. 2009, 12, 1394–1404. [Google Scholar] [CrossRef]
- Räty, M.; Heikkinen, J.; Korhonen, K.T.; Peräsaari, J.; Ihalainen, A.; Pitkänen, J.; Kangas, A.S. Effect of cluster configuration and auxiliary variables on the efficiency of local pivotal method for national forest inventory. Scand. J. For. Res. 2019, 34, 607–616. [Google Scholar] [CrossRef]
- Valtakunnan Metsien 12. Inventointi (VMI12). In Maastotyön Ohjeet 2018; Koko Suomi ml. Ahvenanmaa; Luonnonvarakeskus: Moniste, Finland, 2018. (In Finnish) [Google Scholar]
- Laasasenaho, J. Taper Curves and Volume Functions for Pine, Spruce and Birch; Communicationes Instituti Forestalis Fenniae: Helsinki, Finland, 1982; Volume 108. [Google Scholar]
- Hirvelä, H.; Härkönen, K.; Lempinen, R.; Salminen, O. MELA2016 Reference Manual; Natural Resources Institute Finland: Helsinki, Finland, 2017; Volume 7, 547p, ISBN 978-952-326-1. [Google Scholar]
- Nature Conservation Act (1096/1996). Available online: https://finlex.fi/en/laki/kaannokset/1996/en19961096.pdf (accessed on 6 May 2020).
- Antiquities Act (295/1963). Muinaismuistolaki. Available online: https://www.finlex.fi/fi/laki/ajantasa/1963/19630295 (accessed on 6 May 2020). (In Finnish).
- Kärkkäinen, L.; Haakana, H.; Hirvelä, H.; Lempinen, R.; Packalen, T. Impact Assessment of Land Use Decisions on Wood Supply at Regional Level—Case Kainuu, Finland. Unpublished work. 2020.
- Mattila, U.; Korhonen, K.T. Yleiskaavamerkintöjen ja -määräysten aiheuttamat puuntuotannon rajoitukset Pohjois-Karjalassa valtakunnan metsien 10. inventoinnin mukaan. Metsätieteen Aikakauskirja 2010, 1, 5–18. (In Finnish) [Google Scholar] [CrossRef][Green Version]
- Forest Act (1093/1996). Available online: https://finlex.fi/fi/laki/kaannokset/1996/en19961093_20140567.pdf (accessed on 5 May 2020).
- Siitonen, M.; Härkönen, K.; Hirvelä, H.; Jämsä, J.; Kilpeläinen, H.; Salminen, O.; Teuri, M. MELA Handbook–1996 Edition; Research Papers’; The Finnish Research Institute: Helsinki, Finland, 1996; Volume 622, 452p, Available online: http://urn.fi/URN:ISBN:951-40-1543-6 (accessed on 18 August 2020).
- The Forest 2000 Programme. Guidelines for Developing Finnish Forestry and the Forest Industries. Silva Fenn. 1985, 20, 35–44.
- Nuutinen, T.; Matala, J.; Hirvelä, H.; Härkönen, K.; Peltola, H.; Väisänen, H.; Kellomäki, S. Regionally optimized forest management under changing climate. Clim. Chang. 2006, 79, 315–333. [Google Scholar] [CrossRef]
- Mäkelä, H.; Hirvelä, H.; Nuutinen, T.; Kärkkäinen, L. Estimating forest data for analyses of forest production and utilization possibilities at local level by means of multi-source National Forest Inventory. For. Ecol. Manag. 2011, 262, 1345–1359. [Google Scholar] [CrossRef]
- Ministry of Agriculture and Forestry, National Resources Institute Finland. National Forestry Accounting Plan for Finland; Submission of Updated National Forestry Accounting Plan Including Forest Reference Level (2021–2025) for Finland (20 December 2019); Ministry of Agriculture and Forestry, National Resources Institute Finland; 76p, Available online: https://www.luke.fi/wp-content/uploads/2019/12/NFAP-for-Finland-20-December-2019.pdf (accessed on 11 August 2020).
- Lappi, J. JPL: A Linear Programming Package for Management Planning; Research Papers; The Finnish Forest Research Institute: Suonenjoki, Finland, 1992; Volume 414. [Google Scholar]
- Hynynen, J.; Ojansuu, R.; Hökkä, H.; Siipilehto, J.; Salminen, H.; Haapala, P. Models for Predicting Stand Development in MELA System; Research Papers; The Finnish Forest Research Institute: Vantaa, Finland, 2002; Volume 835, 116p. [Google Scholar]
- Äijälä, O.; Koistinen, A.; Sved, J.; Vanhatalo, K.; Väisänen, P. Metsänhoidon Suositukset; Metsätalouden Kehittämiskeskus Tapion Julkaisuja: Helsinki, Finland, 2014. (In Finnish) [Google Scholar]
- Koistinen, A.; Luiro, J.-P.; Vanhatalo, K. (Eds.) Metsänhoidon Suositukset Energiapuun Korjuuseen, Työopas; Tapion Julkaisuja: Helsinki, Finland, 2016; Available online: https://tapio.fi/wp-content/uploads/2015/06/MHS-Energiapuun-korjuun-suositukset_verkkojulkaisu2.pdf (accessed on 5 May 2020). (In Finnish)
- Salminen, O.; Hirvelä, H.; Härkönen, K. Valtakunnan metsien 10. inventointiin perustuvat ainespuun alueelliset hakkuumahdollisuusarviot. Metsätieteen Aikakauskirja 2013, 3, 199–268. (In Finnish) [Google Scholar] [CrossRef]
- Natural Resources Institute Finland. MELA Summary Reports 2020. Available online: https://www.luke.fi/mela-cutting-possibilities/ (accessed on 13 February 2020).
- Repola, J. Biomass equations for Birch in Finland. Silva Fenn. 2008, 42, 605–624. [Google Scholar] [CrossRef]
- Repola, J. Biomass equations for Scots pine and Norway spruce in Finland. Silva Fenn. 2009, 43, 625–647. [Google Scholar] [CrossRef]
- Penman, J.; Gytarsky, M.; Hiraishi, T.; Krug, T.; Kruger, D.; Pipatti, R.; Buendia, L.; Miwa, K.; Ngara, T.; Tanabe, K.; et al. (Eds.) Good Practice Guidance for Land Use, Land-Use Change and Forestry; IPCC National Greenhouse Gas Inventories Programme: Hayama, Japan, 2003; Available online: https://www.ipcc-nggip.iges.or.jp/public/gpglulucf/gpglulucf_files/GPG_LULUCF_FULL.pdf (accessed on 6 May 2020).
- Miina, J.; Hotanen, J.P.; Salo, K. Modelling the abundance and temporal variation in the production of bilberry (Vaccinium myrtillus L.) in Finnish mineral soil forests. Silva Fenn. 2009, 43, 181. [Google Scholar] [CrossRef]
- Turtiainen, M.; Miina, J.; Salo, K.; Hotanen, J.P. Empirical prediction models for the coverage and yields of cowberry in Finland. Silva Fenn. 2013, 47. [Google Scholar] [CrossRef]
- Kilpeläinen, H.; Salminen, O.; Härkönen, K.; Miina, J.; Kurttila, M. Integrating bilberry yields into regional long-term forest scenario analyses. Scand. J. For. Res. 2018, 33, 378–386. [Google Scholar] [CrossRef]
- Pukkala, T.; Kellomäki, S.; Mustonen, E. Prediction of the Amenity of a Tree Stand. Scand. J. For. Res. 1988, 3, 533–544. [Google Scholar] [CrossRef]
- Heinonen, T. Monitavoitteinen metsäsuunnittelu: Menetelmän yleisperiaatteet ja Kitsin-Hattuvaaran alueen erityispiirteet. In Uhanalaisten Lahopuulajien Elinympäristöjen Turvaaminen Suojelualueilla ja Talousmetsissä. Kustannustehokkuus ja Ekologiset, Ekonomiset sekä Sosiaaliset Vaikutukset Kitsin Seudulla Lieksassa; Kouki, J., Tikkanen, O.P., Eds.; Suomen Ympäristö: Helsinki, Finland, 2007; Volume 24, pp. 36–43. (In Finnish) [Google Scholar]
- State of Finland’s Forests. Based on the Criteria and Indicators of Sustainable Forest Management. 2012. Available online: http://www.metla.fi/metinfo/sustainability/ (accessed on 6 May 2020).
- Natural Resources Institute Finland. Statistics Database: Ownership of Forest Land (1000 ha). 2019. Available online: http://statdb.luke.fi/PXWeb/pxweb/en/LUKE/LUKE__04%20Metsa__06%20Metsavarat/1.07_Metsamaa_omistajaryhmittain.px/?rxid=001bc7da-70f4-47c4-a6c2-c9100d8b50db (accessed on 6 May 2020).
- Pohjanmies, T.; Triviño, M.; Le Tortorec, E.; Salminen, H.; Mönkkönen, M. Conflicting objectives in production forests pose a challenge for forest management. Ecosyst. Serv. 2017, 28, 298–310. [Google Scholar] [CrossRef]
- Verkerk, P.J.; Mavsar, R.; Giergiczny, M.; Lindner, M.; Edwards, D.; Schelhaas, M.J. Assessing impacts of intensified biomass production and biodiversity protection on ecosystem services provided by European forests. Ecosyst. Serv. 2014, 9, 155–165. [Google Scholar] [CrossRef]
- Pang, X.; Nordström, E.-M.; Böttcher, H.; Trubins, R.; Mörtberg, U. Trade-offs and synergies among ecosystem services under different forest management scenarios—The LEcA tool. Ecosyst. Serv. 2017, 28, 67–79. [Google Scholar] [CrossRef]
- Alrahahleh, L.; Ikonen, V.-P.; Kilpeläinen, A.; Torssonen, P.; Strandman, H.; Asikainen, A.; Kaurola, J.; Venäläinen, A.; Peltola, H. Effects of forest conservation and management on volume growth, harvested amount of timber, carbon stock, and amount of deadwood in Finnish boreal forests under changing climate. Can. J. For. Res. 2017, 47, 215–225. [Google Scholar] [CrossRef]
- Triviño, M.; Juutinen, A.; Mazziotta, A.; Miettinen, K.; Podkopaev, D.; Reunanen, P.; Mönkkönen, M. Managing a boreal forest landscape for providing timber, storing and sequestrating carbon. Ecosyst. Serv. 2015, 14, 179–189. [Google Scholar] [CrossRef]
- Matala, J.; Kärkkäinen, L.; Härkönen, K.; Kellomäki, S.; Nuutinen, T. Carbon sequestration in the growing stock of trees in Finland under different cutting and climate scenarios. Eur. J. For. Res. 2009, 128, 493–504. [Google Scholar] [CrossRef]
- Seely, B.; Welham, C.; Kimmins, H. Carbon sequestration in a boreal forest ecosystem: Results from the ecosystem simulation model, FORECAST. For. Ecol. Manag. 2002, 169, 123–135. [Google Scholar] [CrossRef]
- Niemelä, J.; Saarela, S.-R.; Söderman, T.; Kopperoinen, L.; Yli-Pelkonen, V.; Väre, S.; Kotze, D.J. Using the ecosystem services approach for better planning and conservation of urban green spaces: A Finland case study. Biodivers. Conserv. 2010, 19, 3225–3243. [Google Scholar] [CrossRef]
- Biber, P.; Borges, J.G.; Moshammer, R.; Barreiro, S.; Botequim, B.; Brodrechtová, Y.; Brukas, V.; Chirichi, G.; Cordero-Debets, R.; Corrigan, E.; et al. How Sensitive Are Ecosystem Services in European Forest Landscapes to Silvicultural Treatment? Forests 2015, 6, 1666–1695. [Google Scholar] [CrossRef]
- Sandström, O.; Vaara, I.; Heikkuri, P.; Jokinen, M.; Kokkoniemi, T.; Liimatainen, J.; Loikkanen, T.; Mela, M.; Osmonen, O.; Salmi, J.; et al. Ylä-Lapin luonnonvarasuunnitelma. Metsähallituksen Metsätalouden Julk. 2000, 38, 246. Available online: https://julkaisut.metsa.fi/assets/pdf/mt/mt38-1.pdf (accessed on 6 May 2020). (In Finnish).
- Saarela, P. Selvitys Ylä-Lapin Metsä- ja Porotalouden Yhteensovittamisesta; Työryhmämuistio MMM, 2003; Volume 15, 55p, Available online: https://julkaisut.valtioneuvosto.fi/bitstream/handle/10024/160546/trm%202003_15_Selvitys%20Yl%C3%A4-Lapin%20mets%C3%A4-%20ja%20porotalouden%20yhteensovittamisesta.pdf?sequence=1&isAllowed=y (accessed on 6 May 2020). (In Finnish)
- Lapin Metsäohjelma 2012–2015 Metsäkeskus Lappi. 2012. Available online: https://www.metsakeskus.fi/sites/default/files/lapin-metsaohjelma-2012-2015.pdf (accessed on 6 May 2020). (In Finnish).
- Silvennoinen, H.; Pukkala, T.; Tahvanainen, L. Effect of Cuttings on the Scenic Beauty of a Tree Stand. Scand. J. For. Res. 2002, 17, 263–273. [Google Scholar] [CrossRef]
- Hyppönen, M. Lapin metsätalouden erityispiirteet. Metsätieteen Aikakauskirja 2002, 4. (In Finnish) [Google Scholar] [CrossRef]
- Pukkala, T. Metsäsuunnittelun Perusteet; Joen Forest Program Consulting Ay: Joensuu, Finland, 1994. (In Finnish) [Google Scholar]


© 2020 by the authors. Licensee MDPI, Basel, Switzerland. This article is an open access article distributed under the terms and conditions of the Creative Commons Attribution (CC BY) license (http://creativecommons.org/licenses/by/4.0/).