Impacts of Forest Thinning on Wildland Fire Behavior


Abstract
:1. Introduction
- What changes in fire behavior are observed following thinning effects?
- Can we observe the signatures of this competition between changes in wind speed and reduction of fuels following fuel treatments? If this competition exists, what the thresholds for competing effects to dominate the other?
2. Methods
2.1. Model Description
2.2. Simulations
3. Results
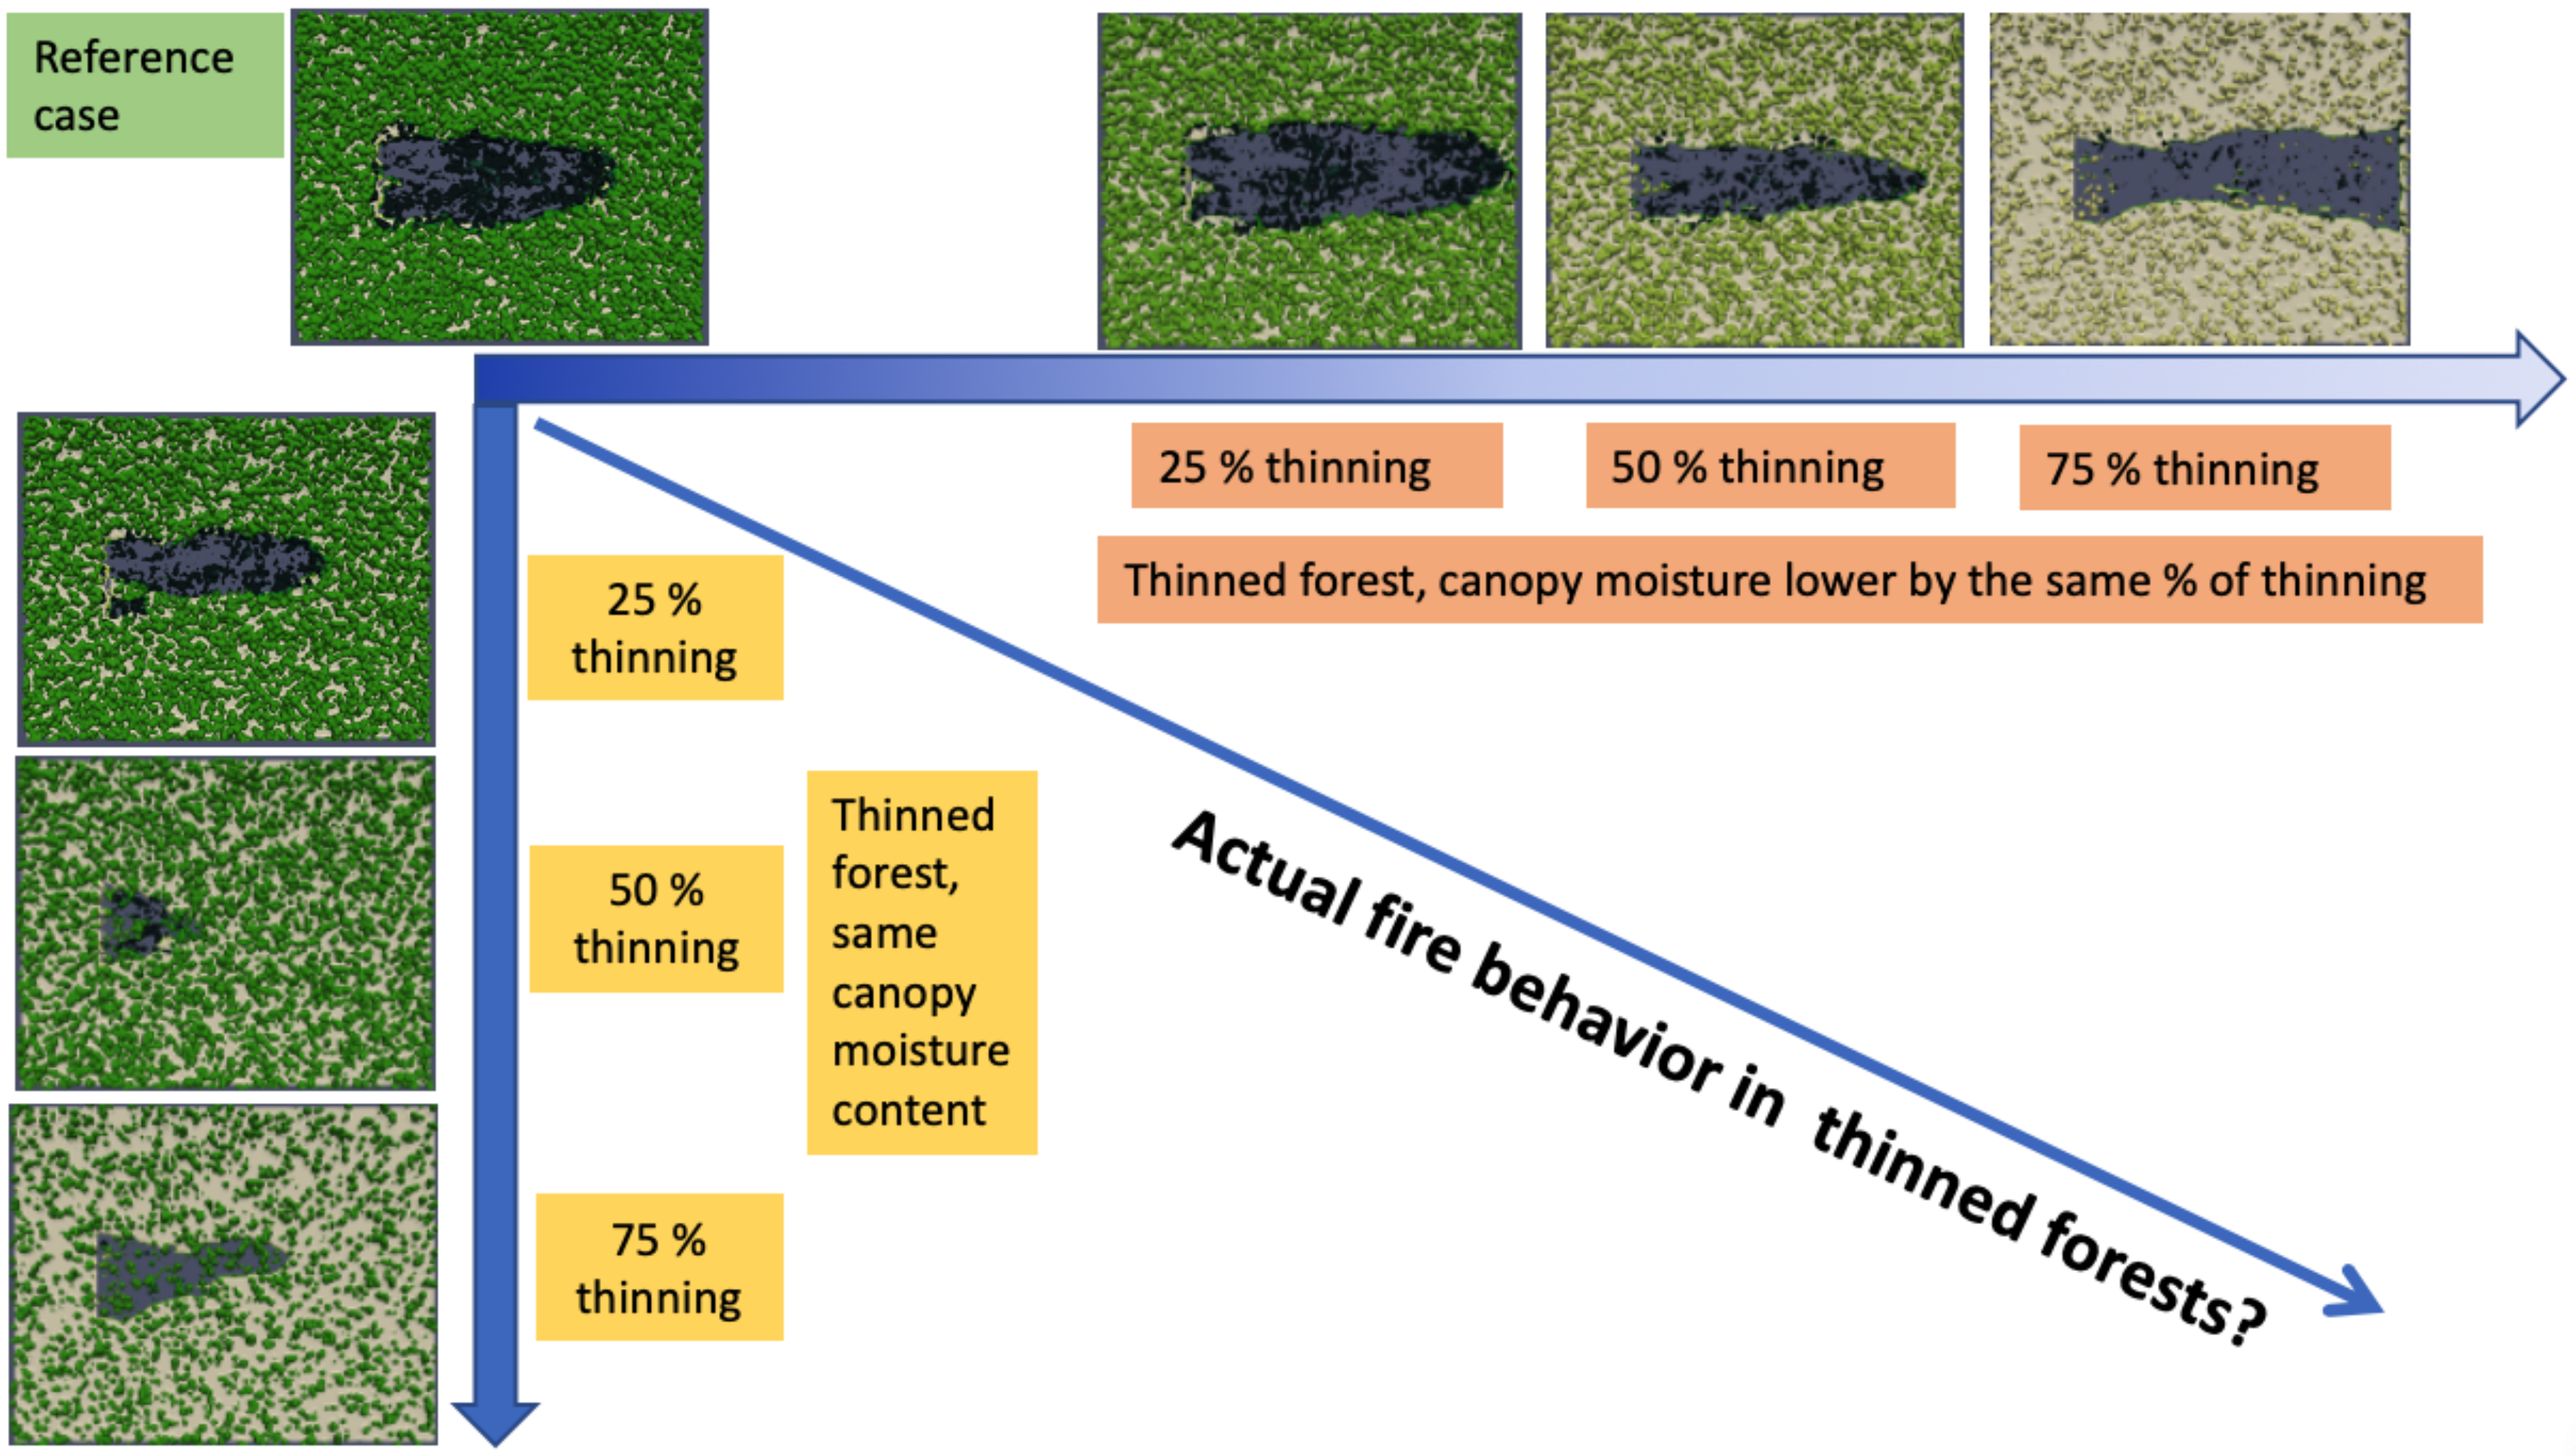
3.1. Burnt Area
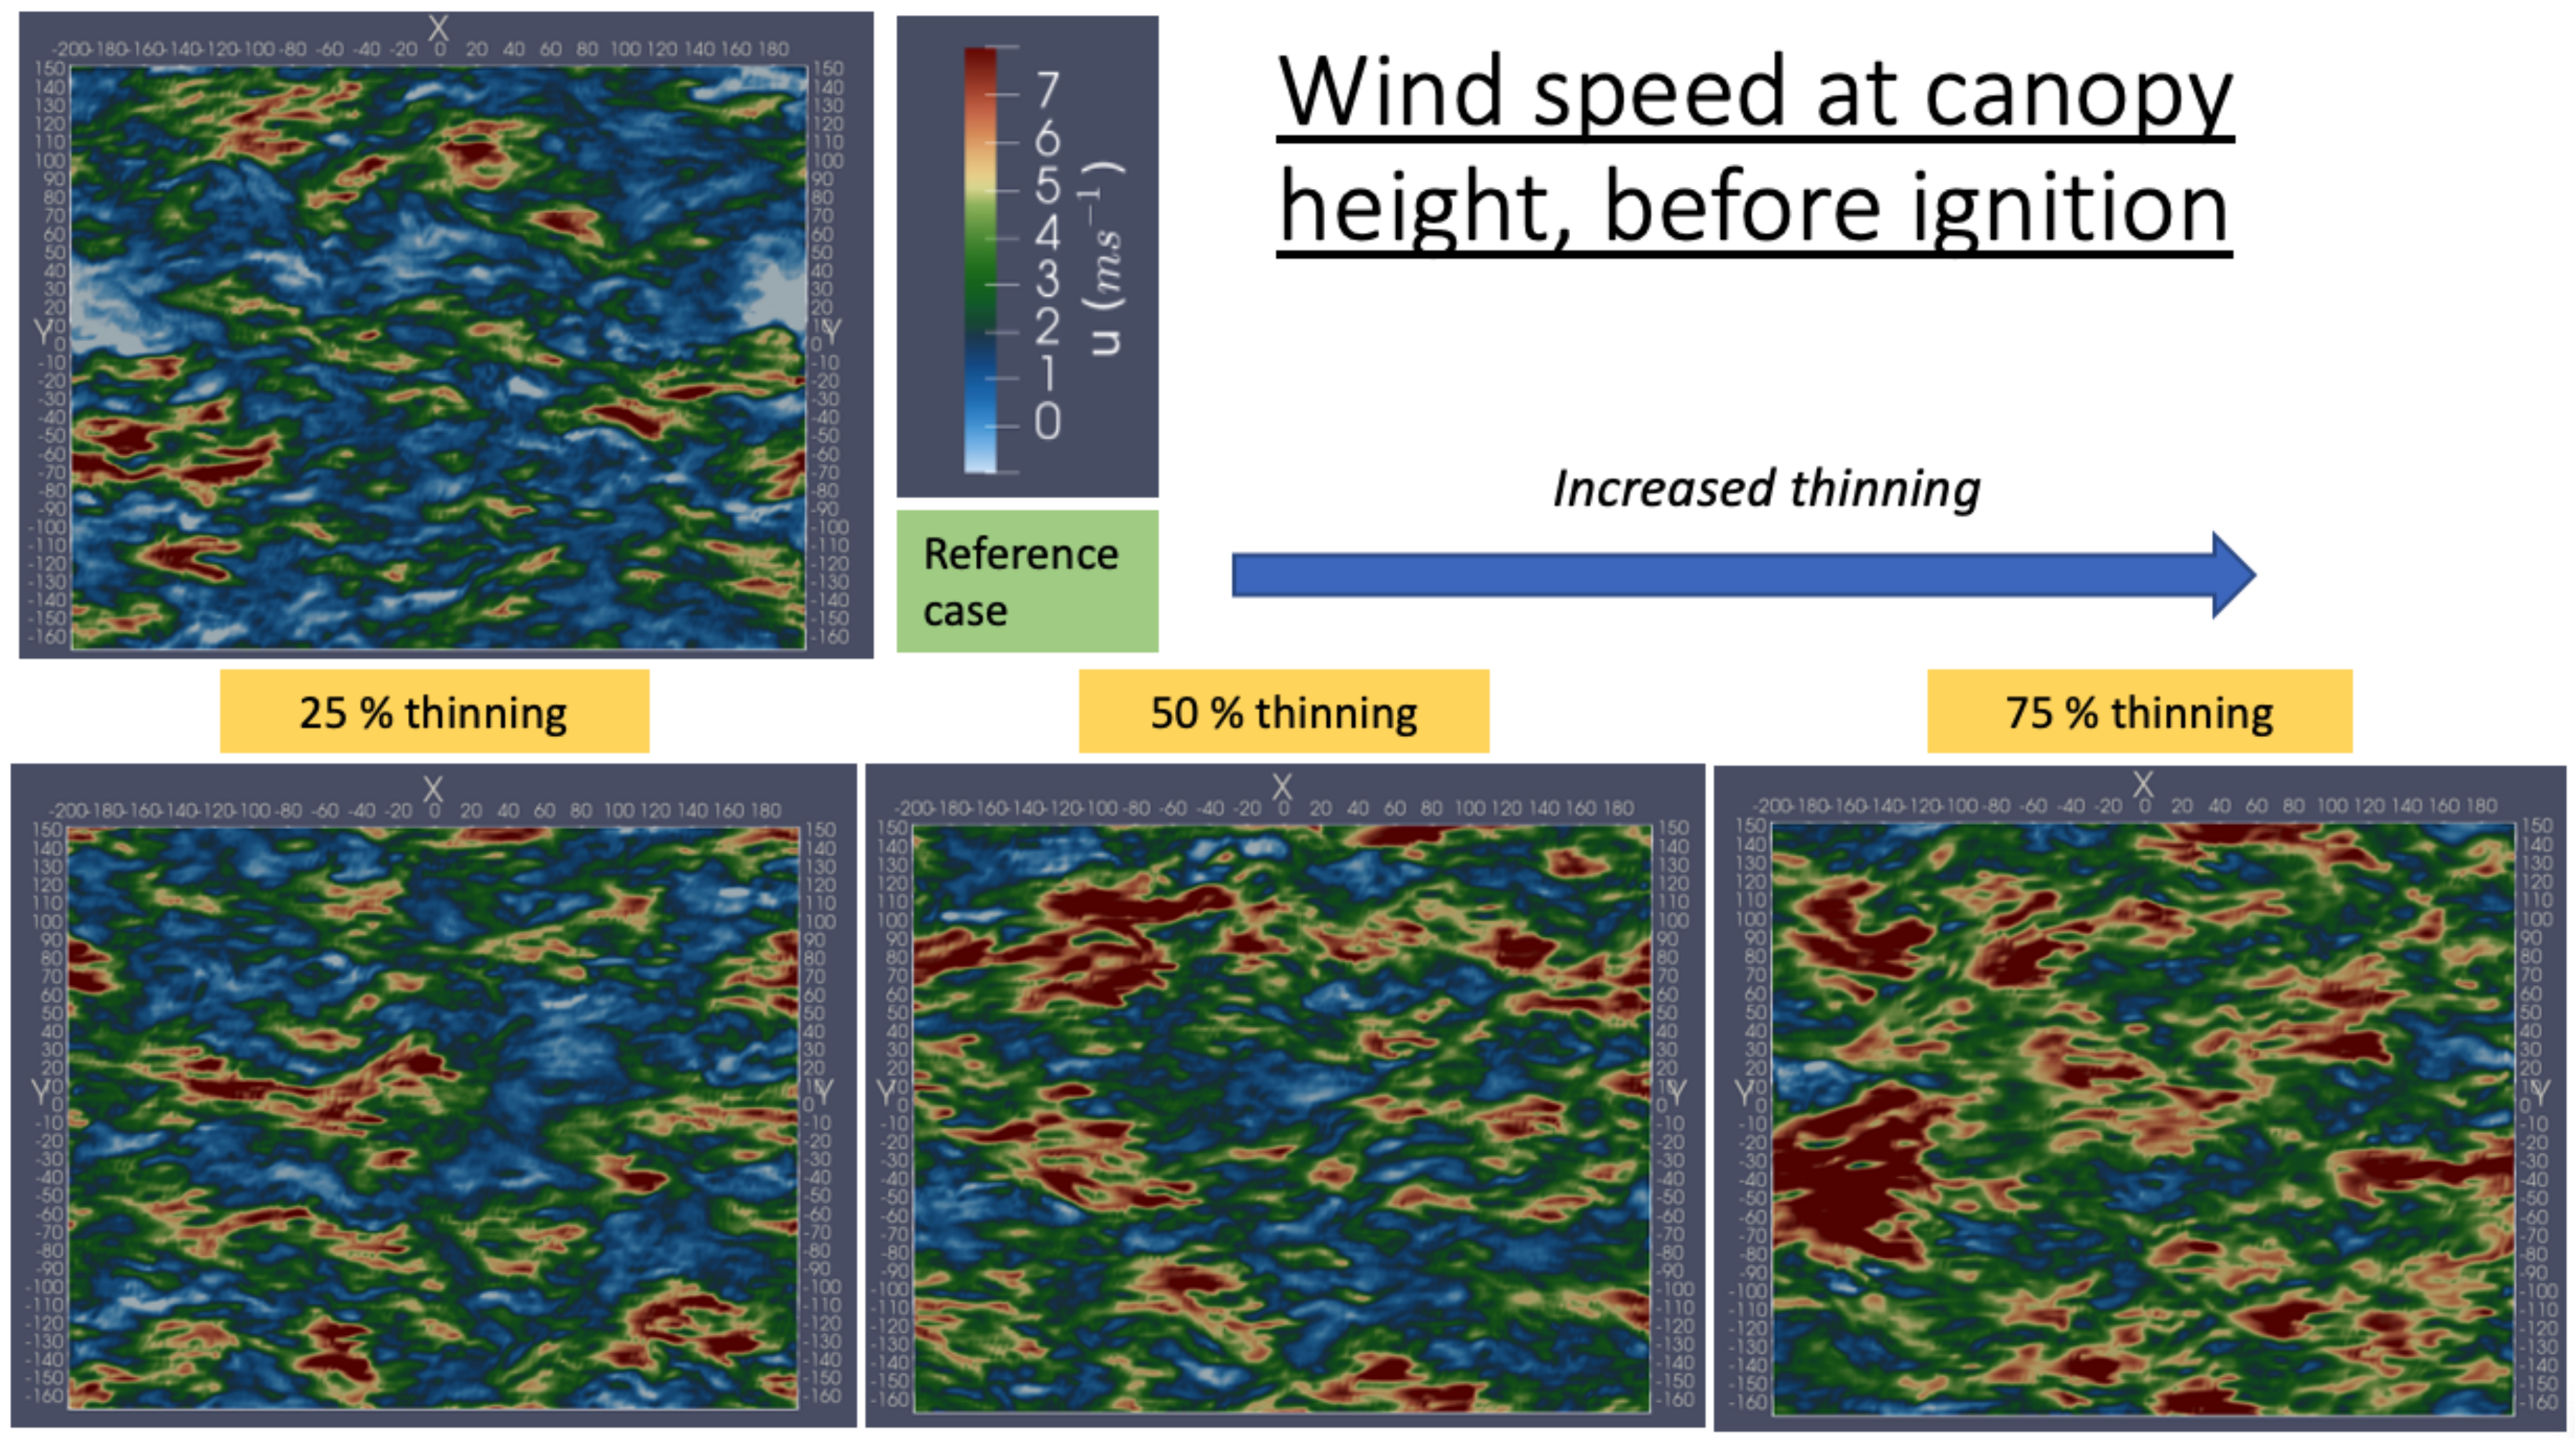
3.2. Wind Speed
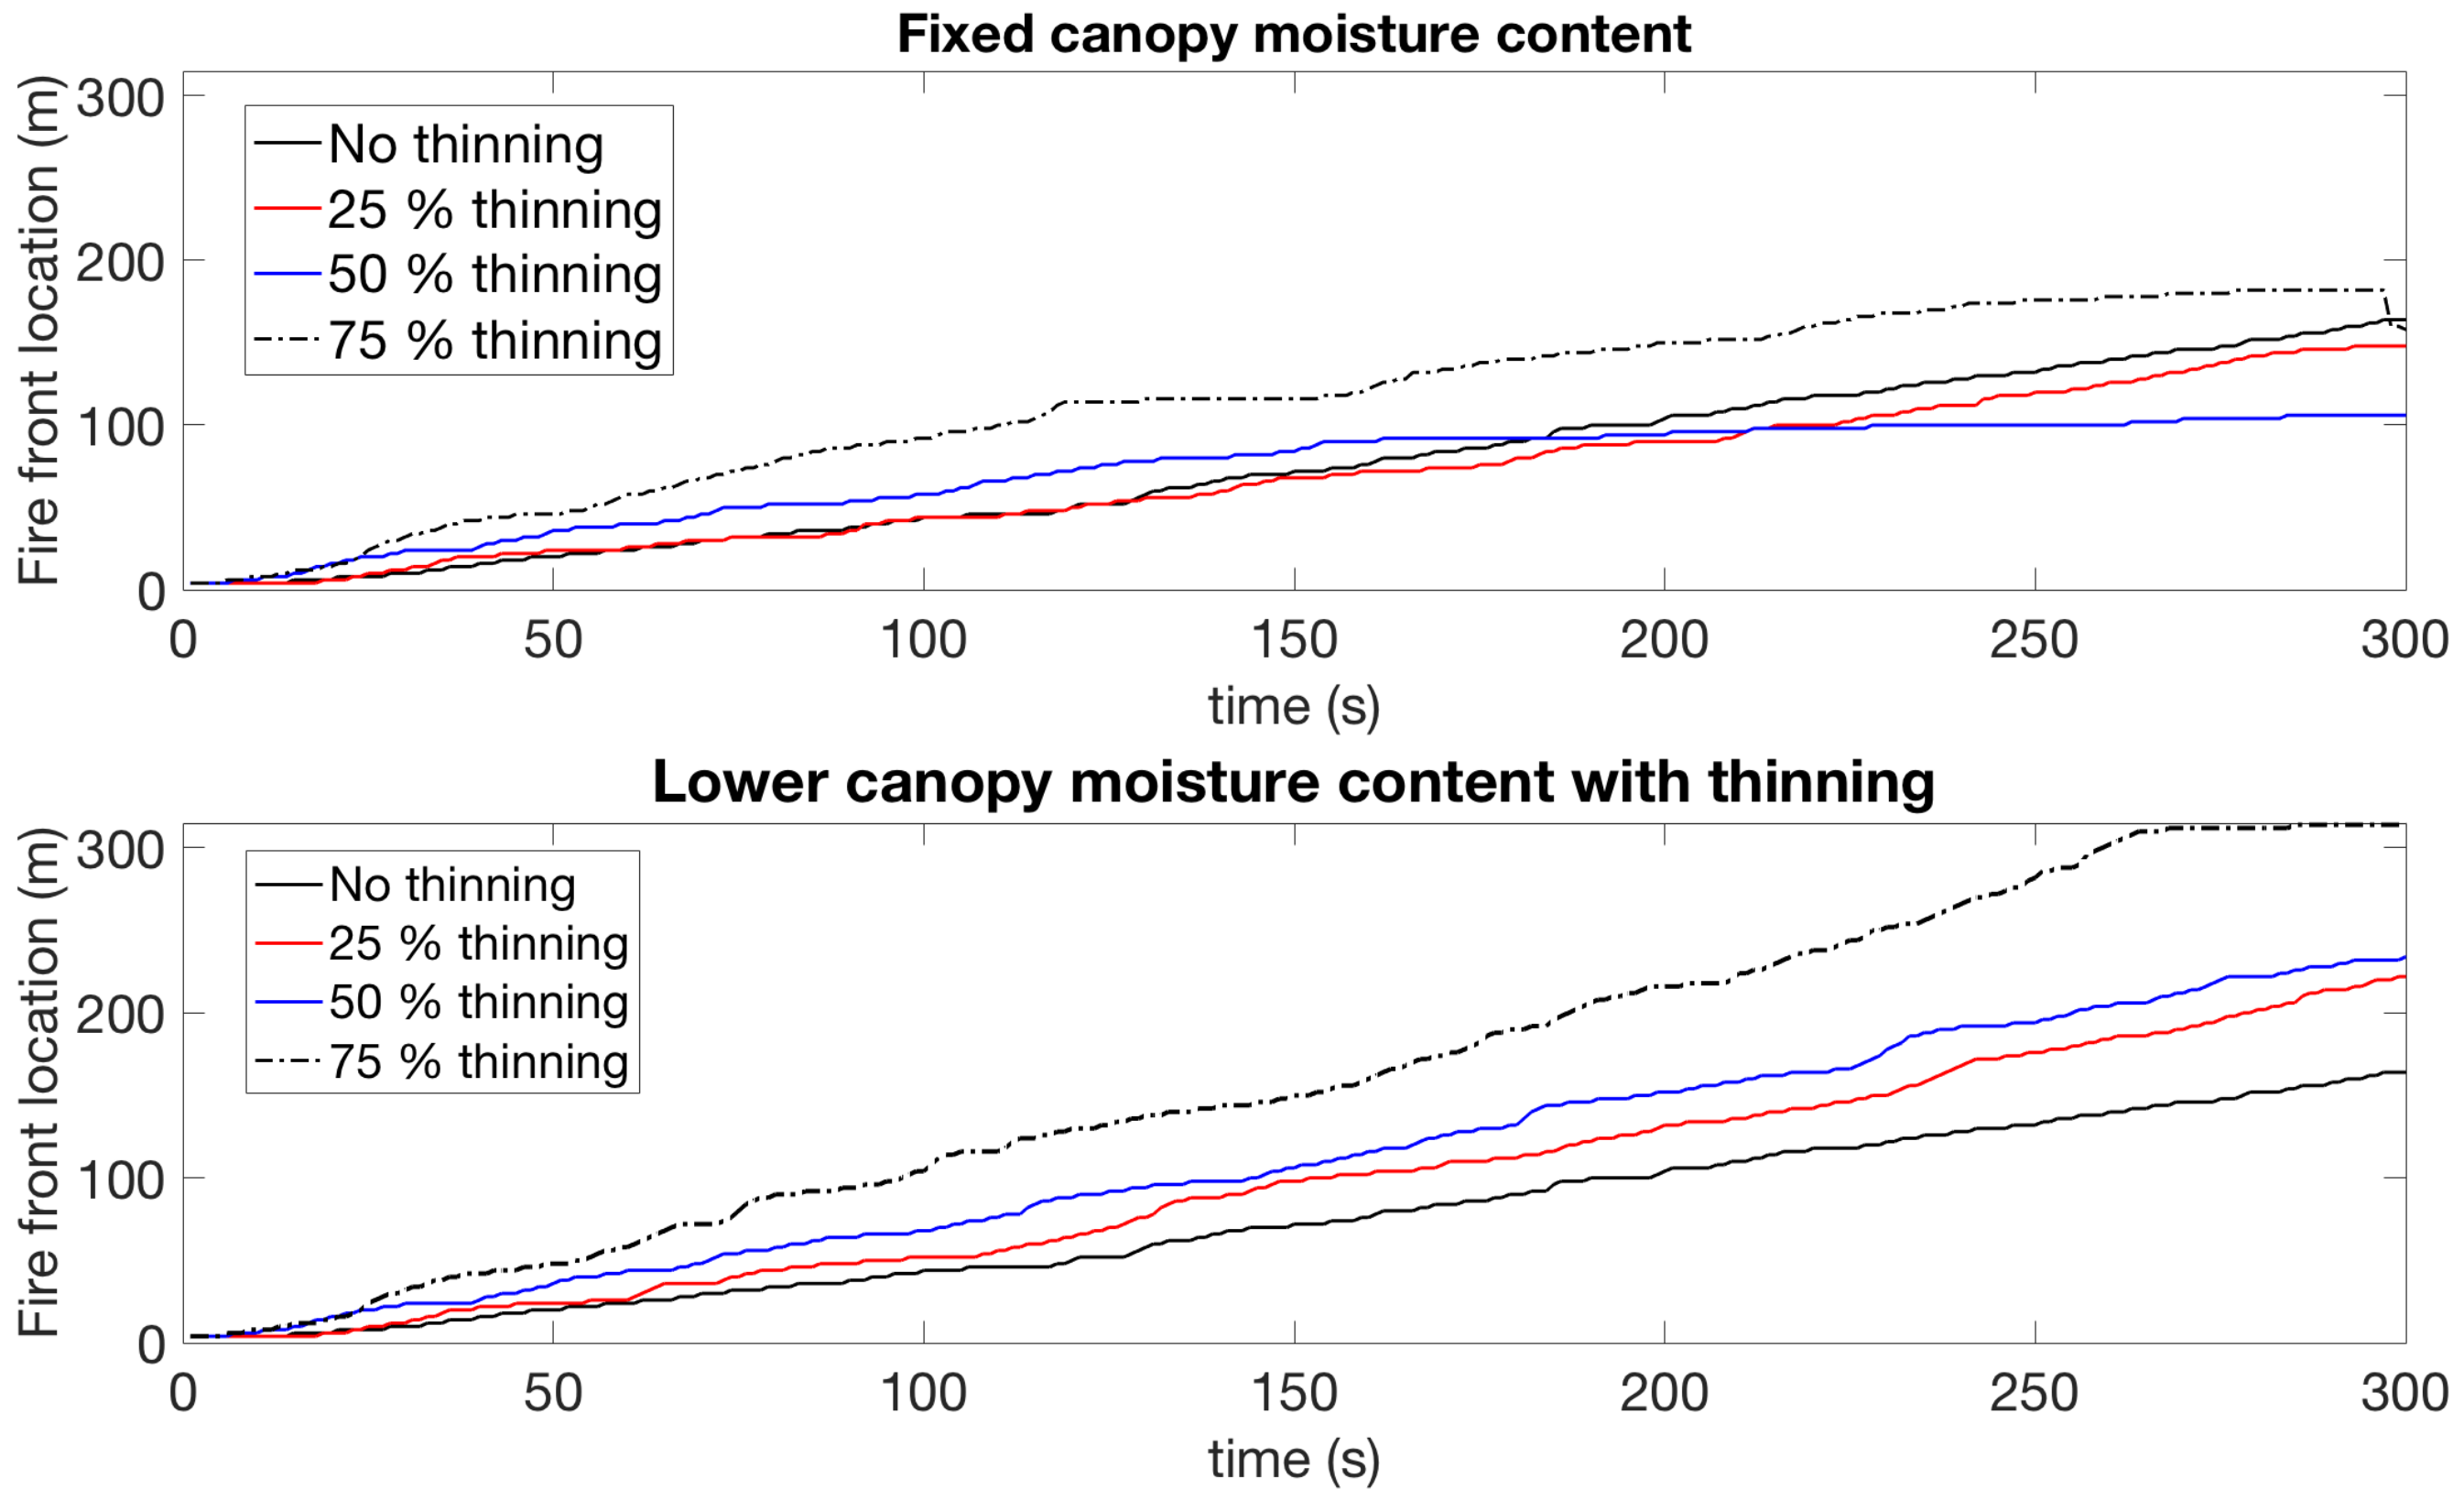
3.3. Rate of Spread
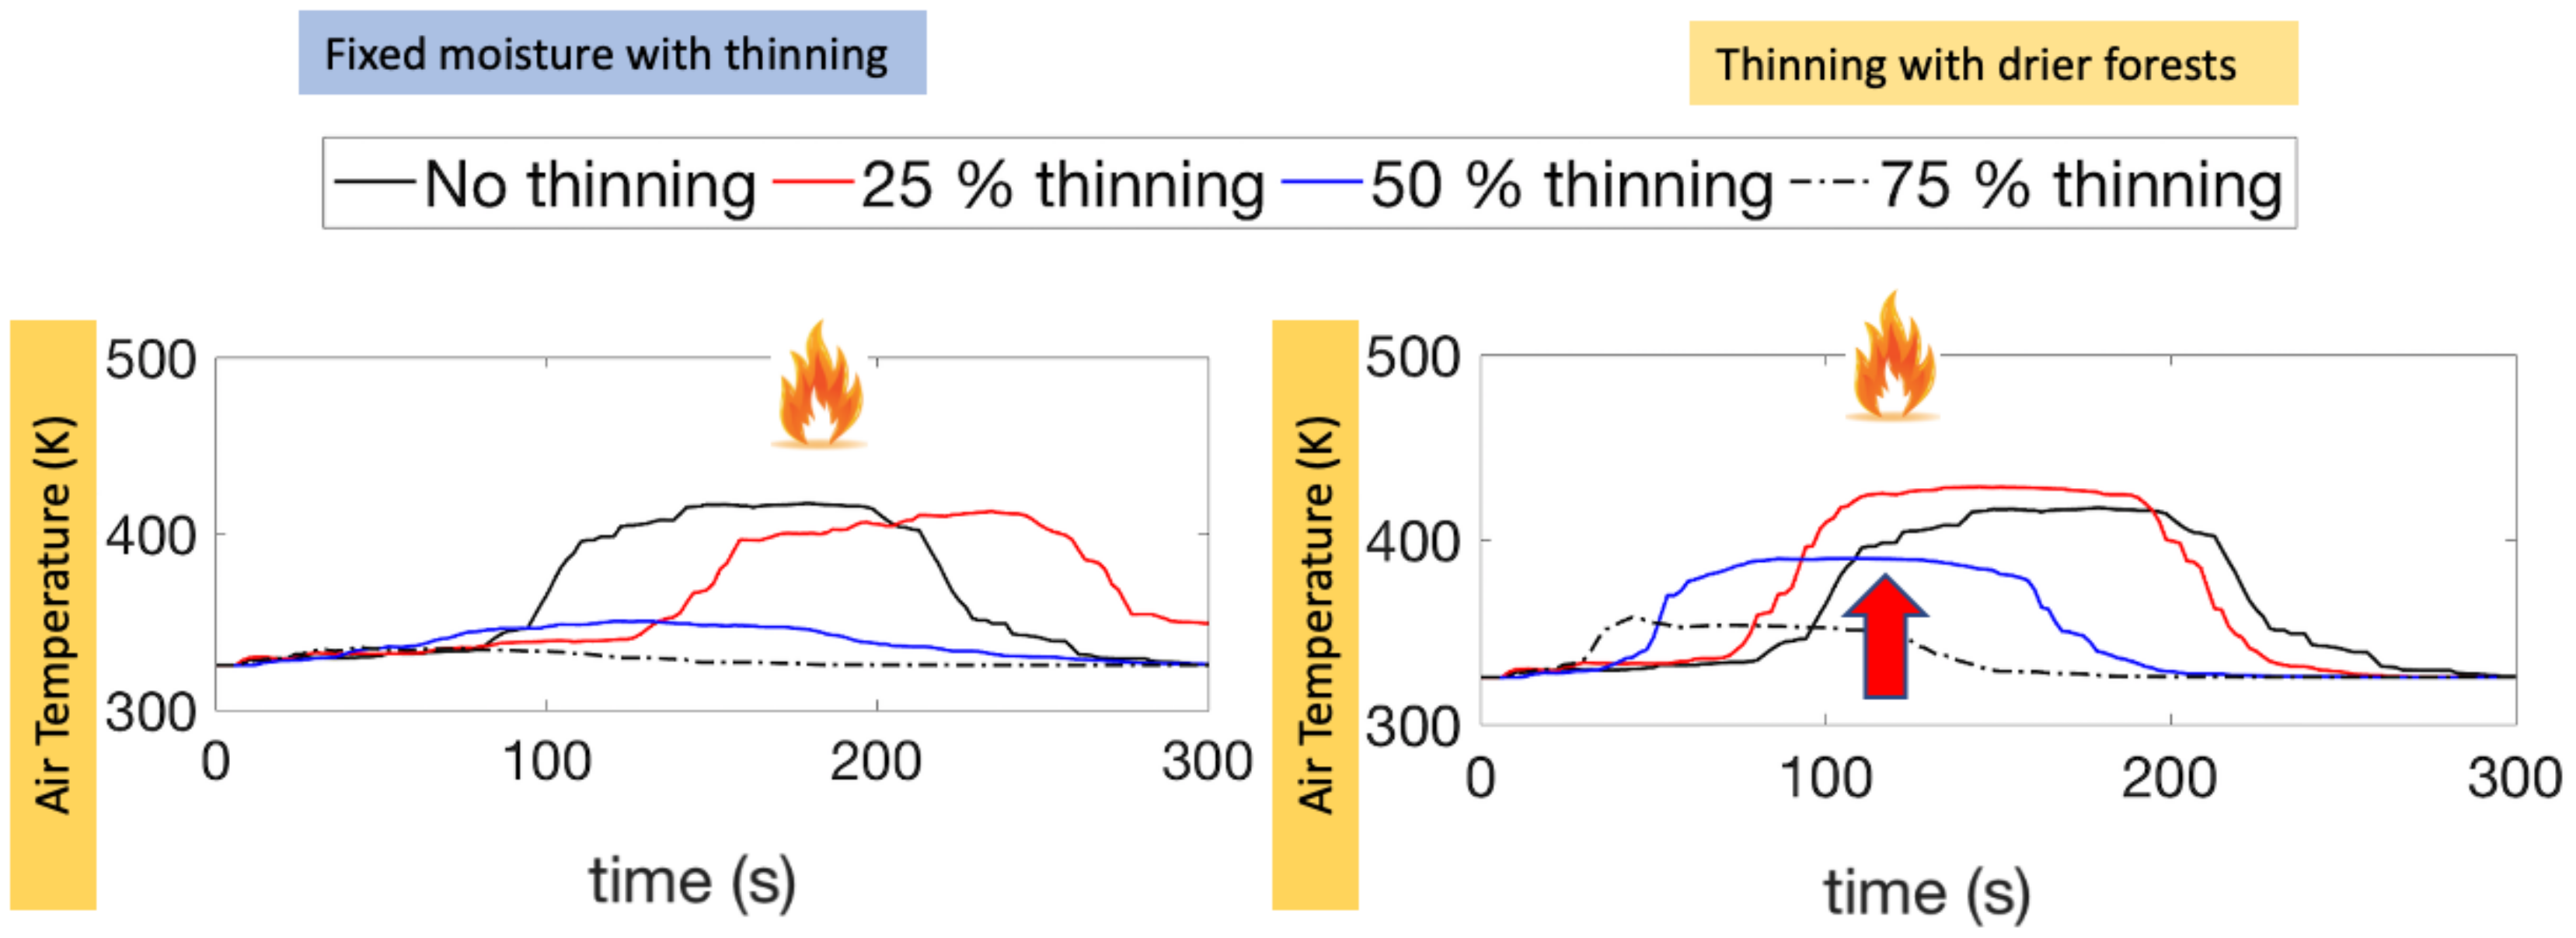
3.4. Air Temperature
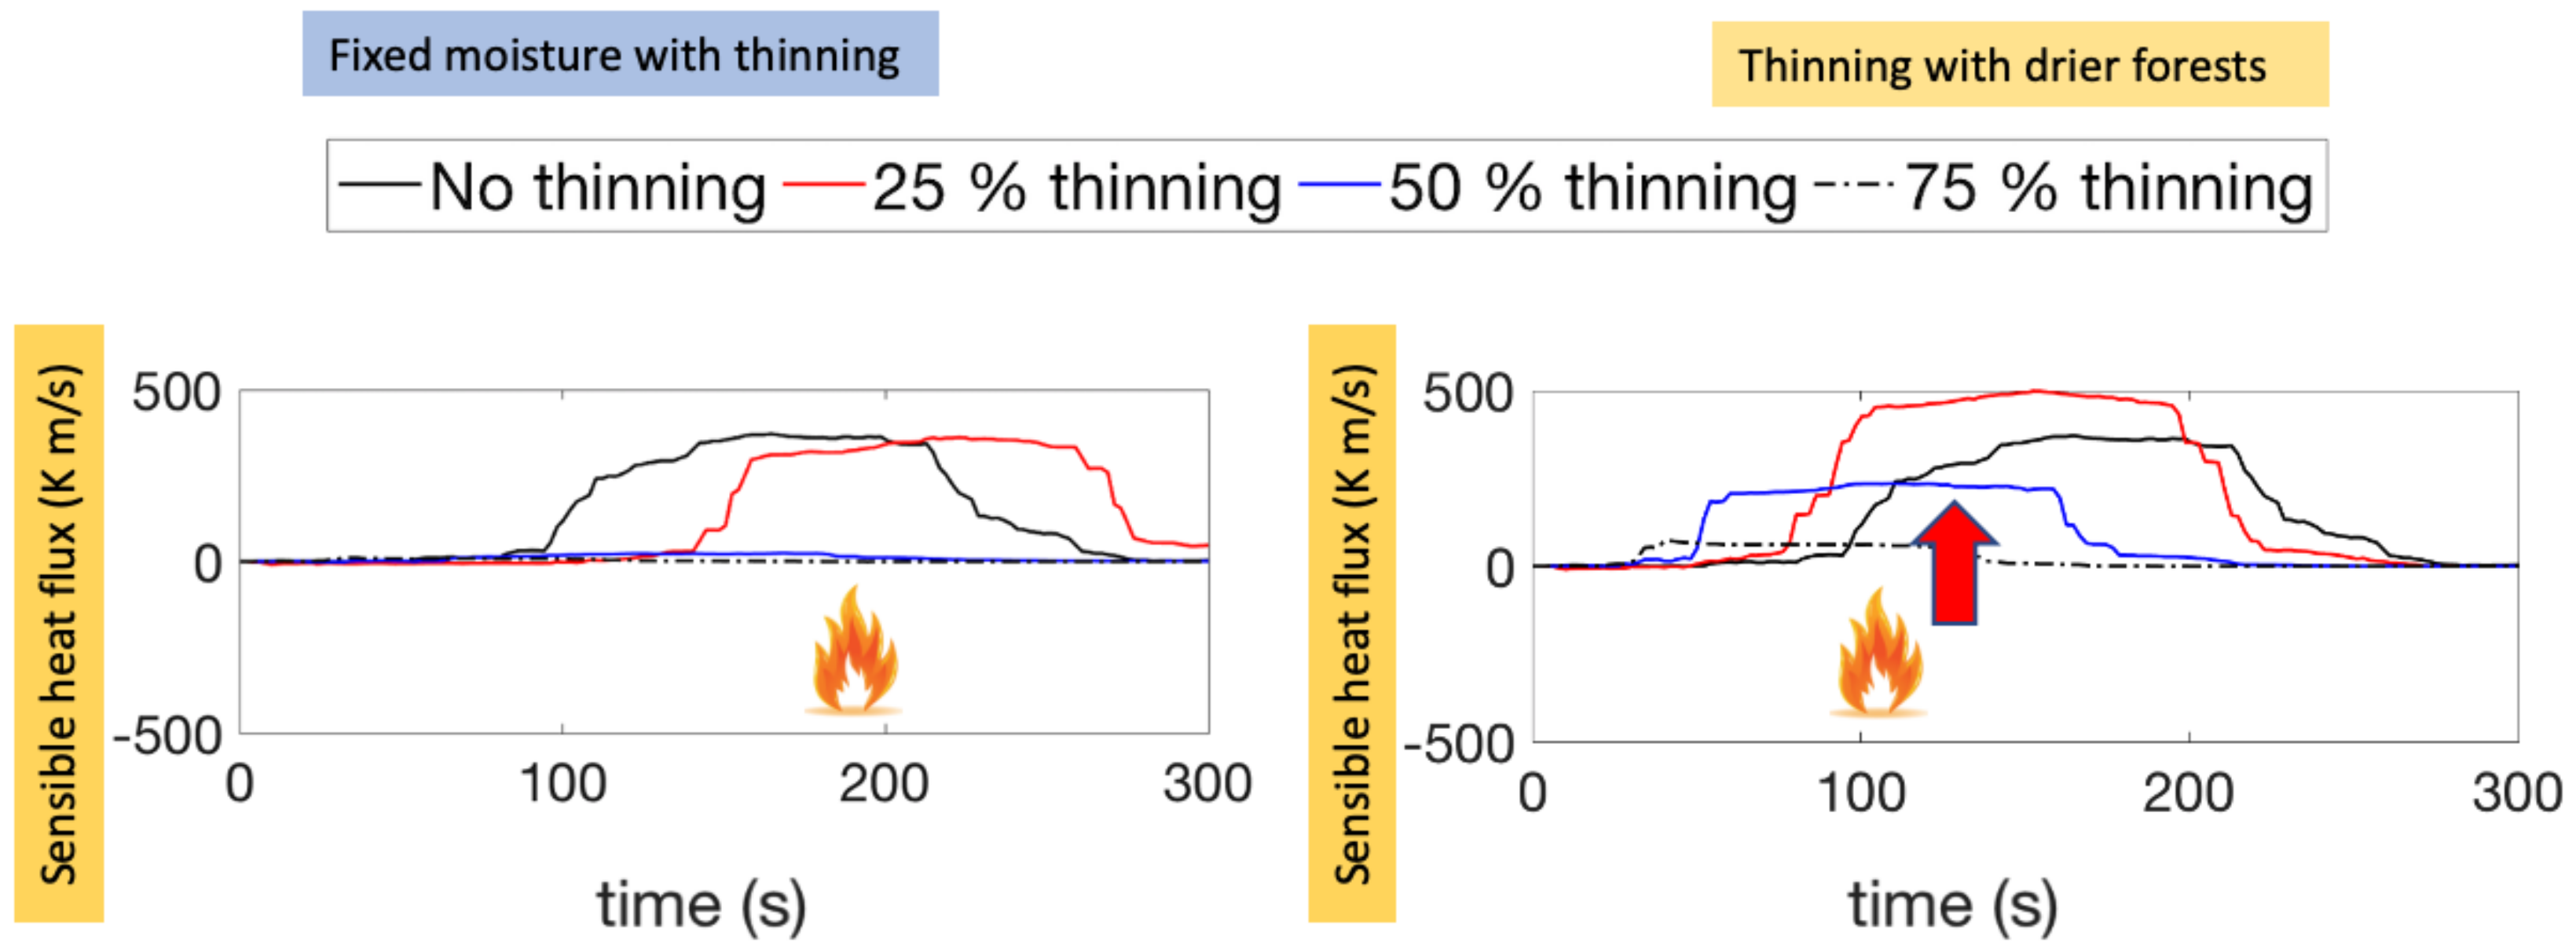
3.5. Sensible Heat Flux
4. Discussions
5. Conclusions
Funding
Acknowledgments
Conflicts of Interest
References
- Whitehead, R.J.; Russo, G.; Hawkes, B.; Taylor, S.; Brown, B.; Armitage, O.; Barclay, H.; Benton, R. Effect of Commercial Thinning on Within-Stand Microclimate and Fine Fuel Moisture Conditions in a Mature Lodgepole Pine Stand in Southeastern British Columbia; British Columbia, Information Report, FI-X-004; Canadian Forest Service, Canadian Wood Fibre Centre: Victoria, BC, Canada, 2008. [Google Scholar]
- Agee, J.K.; Lolley, M.R. Thinning and prescribed fire effects on fuels and potential fire behavior in an eastern Cascades forest, Washington, USA. Fire Ecol. 2006, 2, 3–19. [Google Scholar] [CrossRef]
- Graham, R.T. The Effects of Thinning and Similar Stand Treatments on Fire Behavior in Western Forests; US Department of Agriculture, Forest Service, Pacific Northwest Research Station: Portland, OR, USA, 1999; Volume 463. [Google Scholar]
- Mutch, R.W. Fighting fire with prescribed fire: A return to ecosystem health. J. For. 1994, 92, 31–33. [Google Scholar]
- Crotteau, J.S.; Keyes, C.R.; Sutherland, E.K.; Wright, D.K.; Egan, J.M. Forest fuels and potential fire behaviour 12 years after variable-retention harvest in lodgepole pine. Int. J. Wildland Fire 2016, 25, 633–645. [Google Scholar] [CrossRef]
- Hood, S.M.; Baker, S.; Sala, A. Fortifying the forest: Thinning and burning increase resistance to a bark beetle outbreak and promote forest resilience. Ecol. Appl. 2016, 26, 1984–2000. [Google Scholar] [CrossRef]
- Parsons, R.A.; Pimont, F.; Wells, L.; Cohn, G.; Jolly, W.M.; de Coligny, F.; Rigolot, E.; Dupuy, J.L.; Mell, W.; Linn, R.R. Modeling thinning effects on fire behavior with STANDFIRE. Ann. For. Sci. 2018, 75, 7. [Google Scholar] [CrossRef] [Green Version]
- Russell, E.S.; Liu, H.; Thistle, H.; Strom, B.; Greer, M.; Lamb, B. Effects of thinning a forest stand on sub-canopy turbulence. Agric. For. Meteorol. 2018, 248, 295–305. [Google Scholar] [CrossRef]
- Agee, J.K.; Skinner, C.N. Basic principles of forest fuel reduction treatments. For. Ecol. Manag. 2005, 211, 83–96. [Google Scholar] [CrossRef]
- North, M.P.; Hurteau, M.D. High-severity wildfire effects on carbon stocks and emissions in fuels treated and untreated forest. For. Ecol. Manag. 2011, 261, 1115–1120. [Google Scholar] [CrossRef]
- Jones, K.W.; Cannon, J.B.; Saavedra, F.A.; Kampf, S.K.; Addington, R.N.; Cheng, A.S.; MacDonald, L.H.; Wilson, C.; Wolk, B. Return on investment from fuel treatments to reduce severe wildfire and erosion in a watershed investment program in Colorado. J. Environ. Manag. 2017, 198, 66–77. [Google Scholar] [CrossRef] [Green Version]
- Safford, H.D.; Stevens, J.; Merriam, K.; Meyer, M.; Latimer, A. Fuel treatment effectiveness in California yellow pine and mixed conifer forests. For. Ecol. Manag. 2012, 274, 17–28. [Google Scholar] [CrossRef]
- Whitehead, R.; Russo, G.; Hawkes, B.; Taylor, S.; Brown, B.; Barclay, H.; Benton, R. Effect of a spaced thinning in mature lodgepole pine on within-stand microclimate and fine fuel moisture content. In Proceedings of the Fuels Management-How to Measure Success: Conference Proceedings, Portland, OR, USA, 2006; Andrews, P.L., Butler, B.W., Eds.; Proceedings RMRS-P-41; US Department of Agriculture, Forest Service, Rocky Mountain Research Station: Fort Collins, CO, USA, 2006; Volume 41, pp. 523–536. [Google Scholar]
- Stephens, S.L.; Moghaddas, J.J. Experimental fuel treatment impacts on forest structure, potential fire behavior, and predicted tree mortality in a California mixed conifer forest. For. Ecol. Manag. 2005, 215, 21–36. [Google Scholar] [CrossRef]
- Omi, P.N.; Martinson, E.J. Effectiveness of Fuel Treatments for Mitigating Wildfire Severity: A Manager-Focused Review and Synthesis; JFSP Research Project Report 08-2-1-09. 58; U.S. Joint Fire Science Program at DigitalCommons@University of Nebraska—Lincoln; University of Nebraska: Lincoln, NE, USA, 2010. [Google Scholar]
- Kalies, E.L.; Kent, L.L.Y. Tamm Review: Are fuel treatments effective at achieving ecological and social objectives? A systematic review. For. Ecol. Manag. 2016, 375, 84–95. [Google Scholar] [CrossRef] [Green Version]
- Pollet, J.; Omi, P.N. Effect of thinning and prescribed burning on crown fire severity in ponderosa pine forests. Int. J. Wildland Fire 2002, 11, 1–10. [Google Scholar] [CrossRef]
- Martinson, E.; Omi, P.N.; Shepperd, W. Part 3: Effects of Fuel Treatments on Fire Severity; Graham, R.T., Ed.; Hayman Fire Case Study; USDA Forest Service General Technical Report RMRS-GTR-114; Rocky Mountain Research Station: Ogden, UT, USA, 2003; pp. 96–126. [Google Scholar]
- Martinson, E.J.; Omi, P.N. Performance of fuel treatments subjected to wildfires. In Proceeding of the Conference on Fire, Fuel Treatments, and Ecological Restoration, Fort Collins, CO, USA, 16–18 April 2002; RMRS-P-29; US Department of Agriculture, Forest Service, Rocky Mountain Research Station: Fort Collins, CO, USA, 2003; pp. 7–13. [Google Scholar]
- Moghaddas, J.J.; Craggs, L. A fuel treatment reduces fire severity and increases suppression efficiency in a mixed conifer forest. Int. J. Wildland Fire 2008, 16, 673–678. [Google Scholar] [CrossRef]
- Martinson, E.J.; Omi, P.N. Fuel Treatments and Fire Severity: A Meta-Analysis; Research Paper RMRS-RP; U.S. Department of Agriculture, Forest Service, Rocky Mountain Research Station: Fort Collins, CO, USA, 2013; Volume 103, 38p. [Google Scholar]
- Omi, P.N.; Martinson, E.J. Effect of Fuels Treatment on Wildfire Severity; Final Report; Joint Fire Science Program Governing Board, Western Forest Fire Research Center; Colorado State University: Fort Collins, CO, USA, 2002. [Google Scholar]
- Omi, P.N.; Martinson, E.J.; Chong, G.W. Effectiveness of Pre-Fire Fuel Treatments. Final Report: Joint Fire Science Program Project. Joint Fire Science Program Project. 2006. Available online: https://www.firescience.gov/projects/03-2-1-07/project/03-2-1-07_final_report.pdf (accessed on 20 April 2019).
- Prichard, S.J.; Kennedy, M.C. Fuel treatment effects on tree mortality following wildfire in dry mixed conifer forests, Washington State, USA. Int. J. Wildland Fire 2012, 21, 1004–1013. [Google Scholar] [CrossRef]
- Prichard, S.J.; Kennedy, M.C. Fuel treatments and landform modify landscape patterns of burn severity in an extreme fire event. Ecol. Appl. 2014, 24, 571–590. [Google Scholar] [CrossRef]
- Prichard, S.J.; Peterson, D.L.; Jacobson, K. Fuel treatments reduce the severity of wildfire effects in dry mixed conifer forest, Washington, USA. Can. J. For. Res. 2010, 40, 1615–1626. [Google Scholar] [CrossRef]
- Ritchie, M.W.; Skinner, C.N.; Hamilton, T.A. Probability of tree survival after wildfire in an interior pine forest of northern California: Effects of thinning and prescribed fire. For. Ecol. Manag. 2007, 247, 200–208. [Google Scholar] [CrossRef]
- Strom, B.A.; Fulé, P.Z. Pre-wildfire fuel treatments affect long-term ponderosa pine forest dynamics. Int. J. Wildland Fire 2007, 16, 128–138. [Google Scholar] [CrossRef]
- Symons, J.N.; Fairbanks, D.H.; Skinner, C.N. Influences of stand structure and fuel treatments on wildfire severity at Blacks Mountain Experimental Forest, northeastern California. Calif. Geogr. 2008, 48, 1–23. [Google Scholar]
- Waltz, A.E.; Stoddard, M.T.; Kalies, E.L.; Springer, J.D.; Huffman, D.W.; Meador, A.S. Effectiveness of fuel reduction treatments: Assessing metrics of forest resiliency and wildfire severity after the Wallow Fire, AZ. For. Ecol. Manag. 2014, 334, 43–52. [Google Scholar] [CrossRef]
- DellaSala, D.A.; Olson, D.M.; Barth, S.E.; Crane, S.L.; Primm, S.A. Forest health: Moving beyond rhetoric to restore healthy landscapes in the inland Northwest. Wildl. Soc. Bull. (1973–2006) 1995, 23, 346–356. [Google Scholar]
- Bessie, W.; Johnson, E. The relative importance of fuels and weather on fire behavior in subalpine forests. Ecology 1995, 76, 747–762. [Google Scholar] [CrossRef] [Green Version]
- Turner, M.G.; Romme, W.H.; Gardner, R.H. Landscape disturbance models and the long-term dynamics of natural areas. Nat. Areas J. 1994, 14, 3–11. [Google Scholar]
- Cram, D.S.; Baker, T.T.; Fernald, A.G.; Cibils, A.F.; VanLeeuwen, D.M. Fuel and vegetation trends after wildfire in treated versus untreated forests. For. Sci. 2015, 61, 753–762. [Google Scholar] [CrossRef]
- Wimberly, M.C.; Cochrane, M.A.; Baer, A.D.; Pabst, K. Assessing fuel treatment effectiveness using satellite imagery and spatial statistics. Ecol. Appl. 2009, 19, 1377–1384. [Google Scholar] [CrossRef]
- Hudak, A.T.; Rickert, I.; Morgan, P.; Strand, E.; Lewis, S.A.; Robichaud, P.; Hoffman, C.; Holden, Z.A. Review of Fuel Treatment Effectiveness in Forests and Rangelands and a Case Study from the 2007 Megafires in Central Idaho USA; U.S. Department of Agriculture: Forest Service—National Agroforestry Center: Lincoln, NE, USA, 2011; p. 172. [Google Scholar]
- Raymond, C.L.; Peterson, D.L. Fuel treatments alter the effects of wildfire in a mixed-evergreen forest, Oregon, USA. Can. J. For. Res. 2005, 35, 2981–2995. [Google Scholar] [CrossRef]
- Region, P.N. An Assessment of Fuel Treatments on Three Large 2007 Pacific Northwest Fires; Pacific Northwest Region, USDA Forest Service Oregon State Office: Portland, OR, USA; USDI Bureau of Land Management: Washington, DC, USA, 2007. [Google Scholar]
- Bigelow, S.W.; North, M.P. Microclimate effects of fuels-reduction and group-selection silviculture: Implications for fire behavior in Sierran mixed-conifer forests. For. Ecol. Manag. 2012, 264, 51–59. [Google Scholar] [CrossRef]
- Faiella, S.M.; Bailey, J.D. Fluctuations in fuel moisture across restoration treatments in semi-arid ponderosa pine forests of northern Arizona, USA. Int. J. Wildland Fire 2007, 16, 119–127. [Google Scholar] [CrossRef]
- Estes, B.L.; Knapp, E.E.; Skinner, C.N.; Uzoh, F.C. Seasonal variation in surface fuel moisture between unthinned and thinned mixed conifer forest, northern California, USA. Int. J. Wildland Fire 2012, 21, 428–435. [Google Scholar] [CrossRef]
- Pook, E.; Gill, A. Variation of live and dead fine fuel moisture in Pinus radiata plantations of the Australian-Capital-Territory. Int. J. Wildland Fire 1993, 3, 155–168. [Google Scholar] [CrossRef]
- Weatherspoon, C.P.; Skinner, C. Fire-Silviculture Relationships in Sierra Forests; Sierra Nevada Ecosystem Project: Final Report to Congress; University of California, Centers for Water and Wildland Resources: Davis, CA, USA, 1996; Volume 2, pp. 1167–1176. [Google Scholar]
- Countryman, C. Old-growth conversion also converts fire climate. US For. Serv. Fire Control Notes 1955, 17, 15–19. [Google Scholar]
- Marshall, G.; Thompson, D.K.; Anderson, K.; Simpson, B.; Linn, R.; Schroeder, D. The Impact of Fuel Treatments on Wildfire Behavior in North America Boreal Fuels: A Simulation Study Using FIRETEC. Fire 2020, 3, 18. [Google Scholar] [CrossRef]
- Linn, R.; Reisner, J.; Colman, J.J.; Winterkamp, J. Studying wildfire behavior using FIRETEC. Int. J. Wildland Fire 2002, 11, 233–246. [Google Scholar] [CrossRef]
- Pimont, F.; Dupuy, J.L.; Linn, R.R.; Dupont, S. Validation of FIRETEC wind-flows over a canopy and a fuel-break. Int. J. Wildland Fire 2009, 18, 775–790. [Google Scholar] [CrossRef] [Green Version]
- Shaw, R.H.; Schumann, U. Large-eddy simulation of turbulent flow above and within a forest. Bound. Layer Meteorol. 1992, 61, 47–64. [Google Scholar] [CrossRef] [Green Version]
- Raupach, M.R.; Bradley, E.; Ghadiri, H. A Wind Tunnel Investigation into the Aerodynamic Effect of Forest Clearings on the Nesting of Abbott’s Booby on Christmas Island; CSIRO Division of Environmental Machanics: Black Mountain, ACT, Australia, 1987. [Google Scholar]
- Bossert, J.E.; Linn, R.; Reisner, J.; Winterkamp, J.; Dennison, P.; Roberts, D. Coupled atmosphere-fire behavior model sensitivity to spatial fuels characterization. In Proceedings of the Third Symposium on Fire and Forest Meteorology, Long Beach, CA, USA, 10 January 2000; p. 21. [Google Scholar]
- Linn, R.; Winterkamp, J.; Colman, J.J.; Edminster, C.; Bailey, J.D. Modeling interactions between fire and atmosphere in discrete element fuel beds. Int. J. Wildland Fire 2005, 14, 37–48. [Google Scholar] [CrossRef] [Green Version]
- Linn, R.R.; Cunningham, P. Numerical simulations of grass fires using a coupled atmosphere–fire model: Basic fire behavior and dependence on wind speed. J. Geophys. Res. Atmos. 2005, 110, D13. [Google Scholar] [CrossRef]
- Linn, R.; Anderson, K.; Winterkamp, J.; Brooks, A.; Wotton, M.; Dupuy, J.L.; Pimont, F.; Edminster, C. Incorporating field wind data into FIRETEC simulations of the International Crown Fire Modeling Experiment (ICFME): Preliminary lessons learned. Can. J. For. Res. 2012, 42, 879–898. [Google Scholar] [CrossRef]
- Linn, R.; Canfield, J.; Cunningham, P.; Edminster, C.; Dupuy, J.L.; Pimont, F. Using periodic line fires to gain a new perspective on multi-dimensional aspects of forward fire spread. Agric. For. Meteorol. 2012, 157, 60–76. [Google Scholar] [CrossRef]
- Linn, R.R. A Transport Model for Prediction of Wildfire Behavior; Technical Report; Los Alamos National Laboratory: Los Alamos, NM, USA, 1997. [Google Scholar]
- Dupuy, J.L.; Linn, R.; Konovalov, V.; Pimont, F.; Vega, J.; Jiménez, E. Exploring three-dimensional coupled fire–atmosphere interactions downwind of wind-driven surface fires and their influence on backfires using the HIGRAD-FIRETEC model. Int. J. Wildland Fire 2011, 20, 734–750. [Google Scholar] [CrossRef]
- Sullivan, A.L. Wildland surface fire spread modelling, 1990–2007. 1: Physical and quasi-physical models. Int. J. Wildland Fire 2009, 18, 349–368. [Google Scholar] [CrossRef] [Green Version]
- Sackett, S.S.; Haase, S.M. Fuel Loadings in Southwestern Ecosystems of the United States; United States Department of Agriculture Forest Service General Technical Report RM; Pacific Southwest Research Station, U.S. Department of Agriculture, Forest Service: Riverside, CA, USA, 1996; pp. 187–192. [Google Scholar]
- Parresol, B.R.; Shea, D.; Ottmar, R. Creating a fuels baseline and establishing fire frequency relationships to develop a landscape management strategy at the Savannah River Site. In Proceedings of the Fuels Management-How to Measure Success: Conference Proceedings, Portland, OR, USA, 28–30 March 2006; Andrews, P.L., Butler, B.W., Eds.; Proceedings RMRS-P-41. US Department of Agriculture, Forest Service, Rocky Mountain Research Station: Fort Collins, CO, USA, 2006; Volume 41, pp. 351–366. [Google Scholar]
- Banerjee, T.; Heilman, W.; Goodrick, S.; Hiers, K.; Linn, R. Effects of Canopy Midstory Management and Fuel Moisture on Wildfire Behavior. 2019. Available online: https://osf.io/4p57h/ (accessed on 20 April 2019).


© 2020 by the author. Licensee MDPI, Basel, Switzerland. This article is an open access article distributed under the terms and conditions of the Creative Commons Attribution (CC BY) license (http://creativecommons.org/licenses/by/4.0/).
Share and Cite
Banerjee, T. Impacts of Forest Thinning on Wildland Fire Behavior. Forests 2020, 11, 918. https://doi.org/10.3390/f11090918
Banerjee T. Impacts of Forest Thinning on Wildland Fire Behavior. Forests. 2020; 11(9):918. https://doi.org/10.3390/f11090918
Chicago/Turabian StyleBanerjee, Tirtha. 2020. "Impacts of Forest Thinning on Wildland Fire Behavior" Forests 11, no. 9: 918. https://doi.org/10.3390/f11090918
APA StyleBanerjee, T. (2020). Impacts of Forest Thinning on Wildland Fire Behavior. Forests, 11(9), 918. https://doi.org/10.3390/f11090918