Article

Structural Carbon Allocation and Wood Growth Reflect Climate Variation in Stands of Hybrid White Spruce in Central Interior British Columbia, Canada

Ecosystem Science and Management, University of Northern British Columbia, Prince George, BC V2N 4Z9, Canada
*
Author to whom correspondence should be addressed.
Forests 2020, 11(8), 879; https://doi.org/10.3390/f11080879
Submission received: 11 July 2020 / Revised: 4 August 2020 / Accepted: 10 August 2020 / Published: 12 August 2020

Abstract

:
Research Highlights: This research presents a novel approach for comparing structural carbon allocation to tree growth and to climate in a dendrochronological analysis. Increasing temperatures reduced the carbon proportion of wood in some cases. Background and Objectives: Our goal was to estimate the structural carbon content of wood within hybrid white spruce (Picea glauca (Moench) × engelmannii (Parry) grown in British Columbia, Canada, and compare the percent carbon content to wood properties and climate conditions of the region. Specific objectives included: (i) the determination of average incremental percent carbon, ring widths (RW), earlywood (EW) and latewood (LW) widths, cell wall thickness, and density over time; (ii) the determination of differences between percent carbon in individual forest stands and between regions; and (iii) the evaluation of the relationships between percent carbon and climate variation over time. Methods: Trees were sampled from twelve sites in northern British Columbia. Wood cores were analyzed with standard dendrochronology techniques and SilviScan analysis. Percent structural carbon was determined using acetone extraction and elemental analysis for 5 year increments. Individual chronologies of wood properties and percent carbon, and chronologies grouped by region were compared by difference of means. Temperature and precipitation values from the regions were compared to the carbon chronologies using correlation, regression, and visual interpretation. Results: Significant differences were found between the percent structural carbon of wood in individual natural and planted stands; none in regional aggregates. Some significant relationships were found between percent carbon, RW, EW, LW, and the cell wall thickness and density values. Percent carbon accumulation in planted stands and natural stands was found in some cases to correlate with increasing temperatures. Natural stand percent carbon values truncated to the last 30 years of growth was shown as more sensitive to climate variation compared to the entire time series. Conclusions: Differences between the stands in terms of structural carbon proportion vary by site-specific climate characteristics in areas of central interior British Columbia. Wood properties can be good indicators of variation in sequestered carbon in some stands. Carbon accumulation was reduced with increasing temperatures; however, warmer late-season conditions appear to enhance growth and carbon accumulation.

1. Introduction

Tree growth in both naturally occurring, and managed forests is a key process that influences carbon balance in terrestrial ecosystems, that is subject to the impacts of environmental change. The estimations of carbon content in tree stems are usually based on modelled data, calculated from measured variables such as tree height and diameter at breast height (DBH), but can be enhanced with knowledge of wood density, carbon concentration, and wood volume [1]. It has been suggested that wood density and cell wall thickness correlate with carbon sequestration; cellulose and lignin are components of xylem cell walls, and thicker, denser cell walls should have greater proportions of sequestered carbon [1,2,3,4]. However, the relationships between wood properties and sequestered carbon are not well understood because past research has focused mainly on biomass (or allometric biomass equations as determined from DBH and height measurements) instead of the direct measurements of volatile and structural carbon [5,6]. Expanding knowledge of the variation in naturally grown (hereafter referred to as ‘natural stands’) and managed plantation stands (‘planted stands’) and between wood properties, such as density and cell wall thickness, and carbon could improve the projections of carbon sequestration [1].
Forest growth, and the subsequent carbon accumulation, are strongly affected by changes in the climate. Changes in the climate are predicted to cause deviations in tree photosynthetic and respiration rates, increase disturbance, and increase tree mortality related to chronic drought [7,8,9,10,11]. Changes in the climate in British Columbia (BC), Canada, are predicted to include warmer and wetter conditions, with increased maximum and minimum temperatures and a decreased depth and water content of snowpack that will vary across the topographic landscape [12,13]. Over the next century, substantial changes in the temperature and precipitation in central interior BC, particularly in the spruce–willow–birch (SWB) and sub-boreal spruce (SBS) biogeoclimatic zones, are expected [12,14]. Increasing temperatures may push forests beyond growth sustainability thresholds, reducing the amount of carbon dioxide uptake and carbon accumulation [15].
Tree-ring analysis was used to determine forest growth dynamics and has provided climate variability information through radial growth and climate reconstructions [10,16]. Dendrochronological techniques may also be used to enhance the understandings of relationships between above ground carbon accumulation and the climate [17], as most carbon research relates to productivity based on climate [18], biomass equations [19], and changes to forests after anthropogenic management [20,21].
This study aimed to determine: (1) the variations in the sequestered structural carbon of hybrid white spruce (Picea glauca x engelmannii) in natural and planted stands over time; (2) how variations in carbon relate to ring width (RW), earlywood width (EW), latewood width (LW), density and cell wall thickness measurements at the annual scale; and (3) how variations in both carbon and wood properties compare with changes in the temperature and precipitation in central interior BC.

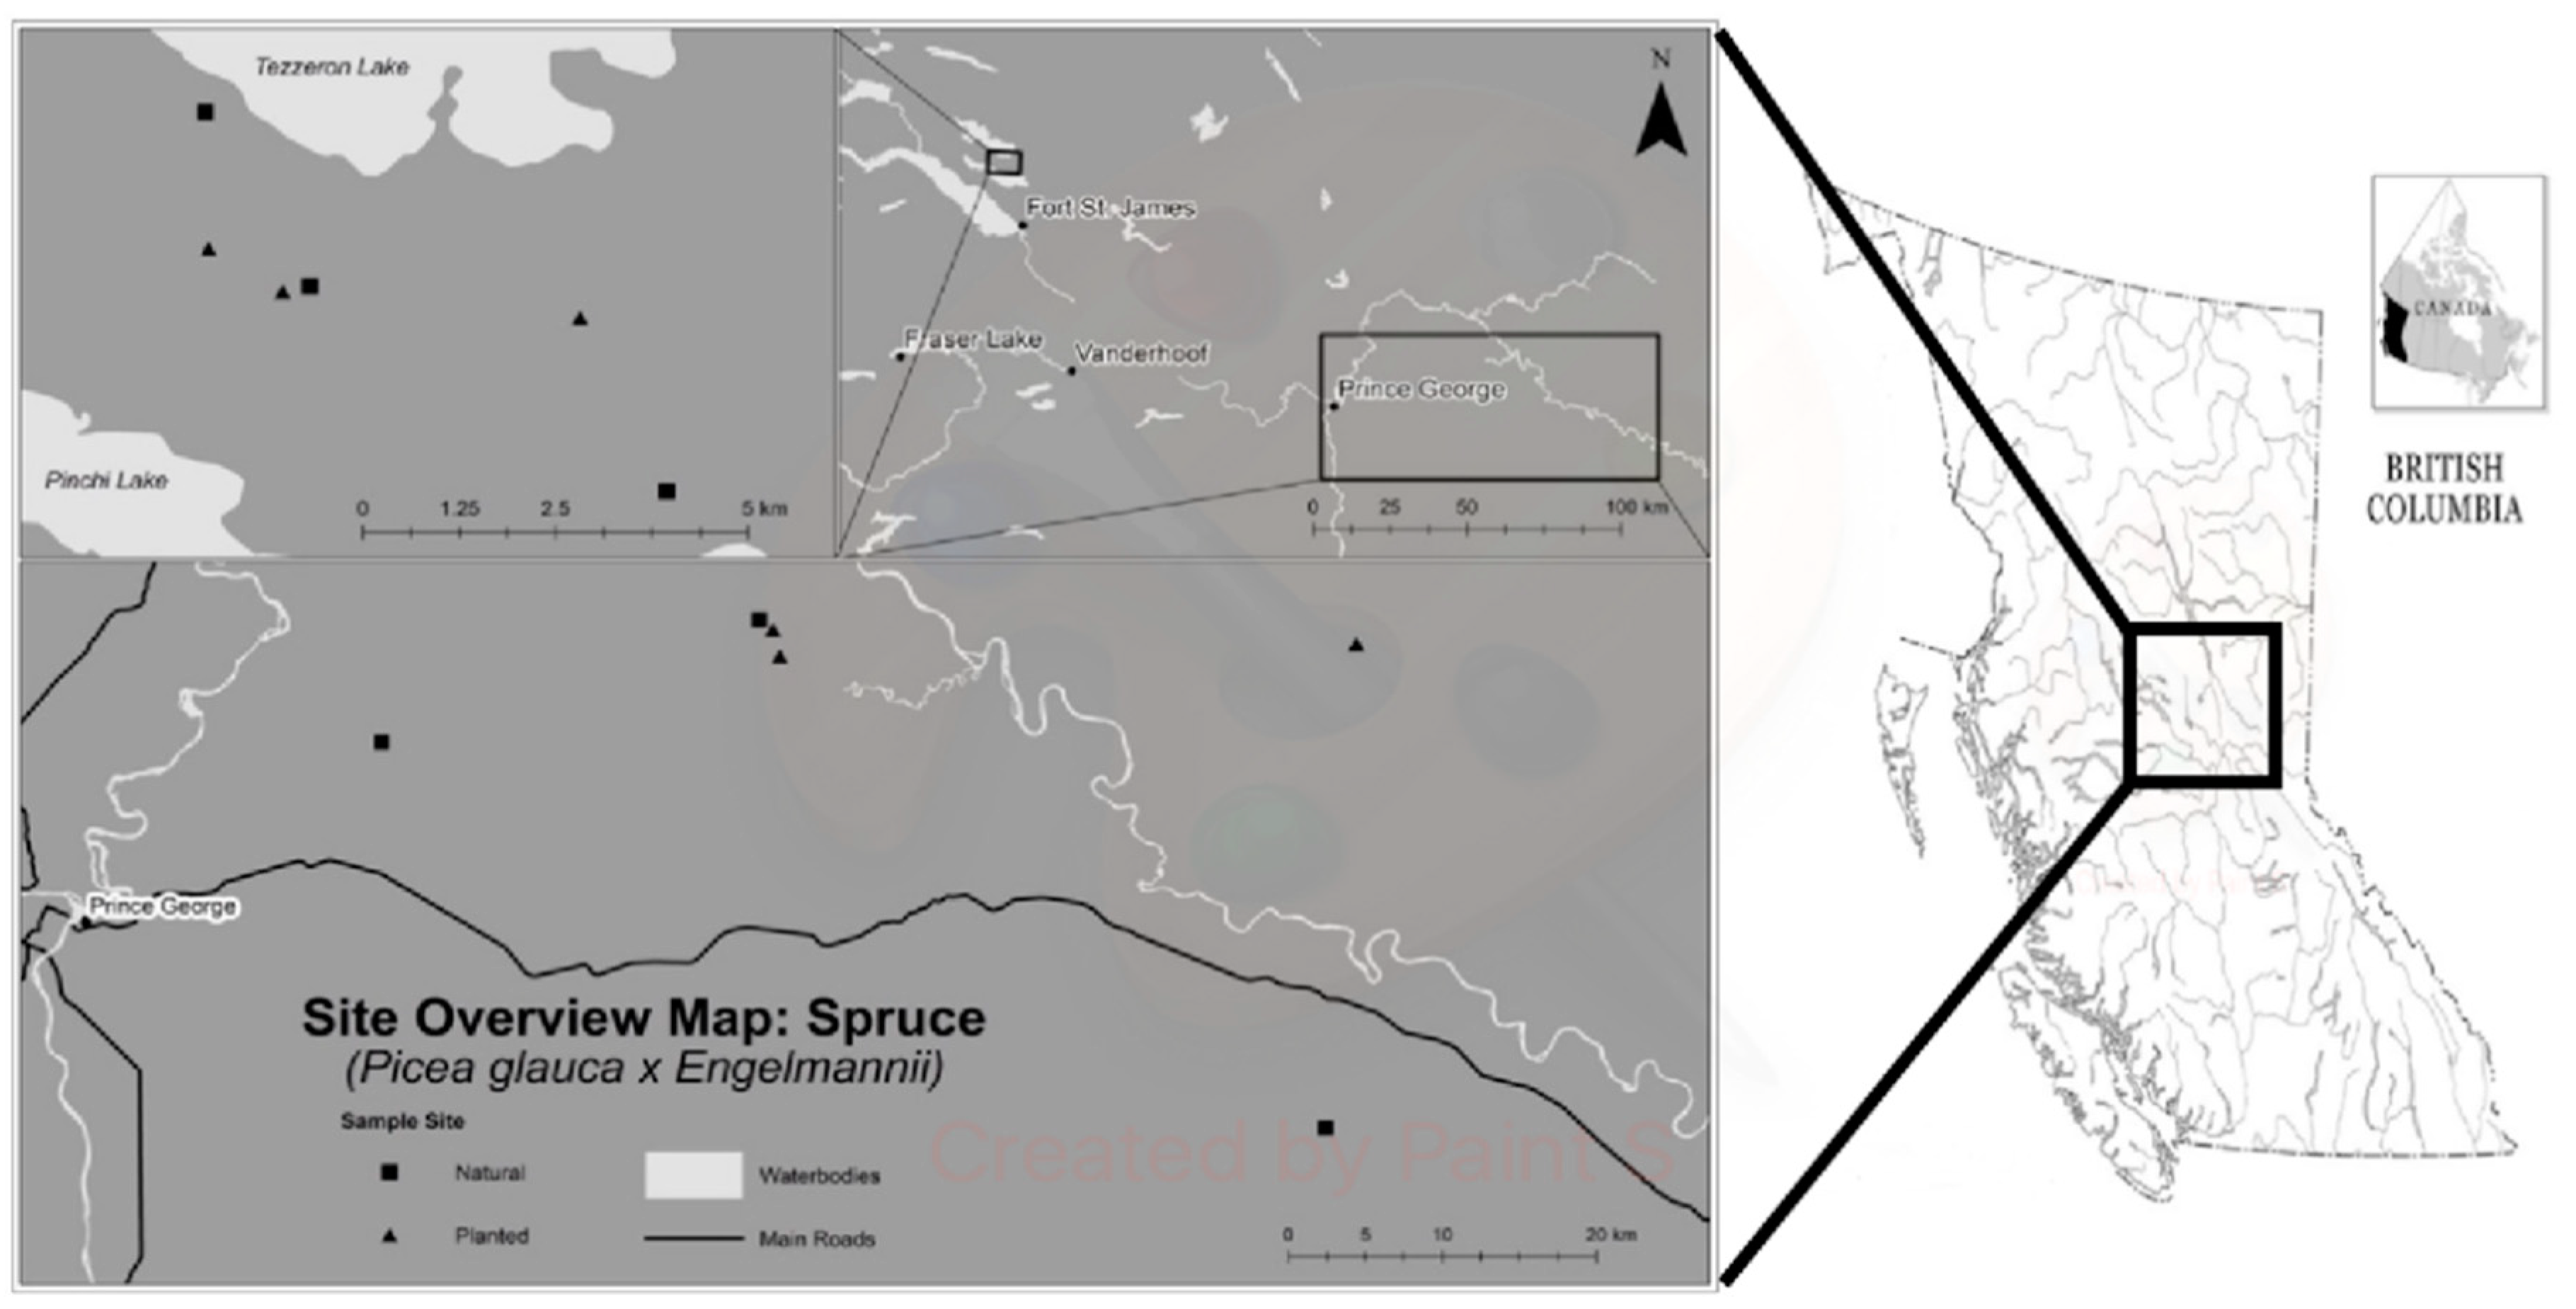
2. Materials and Methods

Hybrid white spruce trees were selected from six natural (N1–N6) and six planted stands (P1–P6) from areas of central interior BC (Figure 1 and Table 1). One group of six stands (N1–N3; P1–P3) was selected from the John Prince Research Forest (FSJ), located north of the town of Fort St. James, where each stand sampled was within 5 km of another. The second group of six stands (N4–N6; P4–P6) were within 200 km from Prince George (PG) (Figure 1). The target sample sites were dominant stands of hybrid white spruce naturally grown or planted approximately 40 years prior to sampling. We described and classified the sites sampled according to BC’s Biogeoclimatic Ecosystem Classification system [22]. The biogeoclimatic variant of each site, which describes the temperature and moisture variation of the area in comparison to similar sites, was determined from each site characteristics, including dominant vegetation, aspect and topography. PG stands were in the willow–wet–cool (wk1) and very-wet–cool (vk1) variants of the Sub Boreal (SBS) biogeoclimatic zone, characterized by high precipitation and cooler temperatures. FSJ stands were in the Stuart–dry–warm (dw3) variant of the SBS zone, characterized by lower snow packs and warmer temperatures [23].
Twenty dominant trees in each stand were selected for sampling. Sampled trees were at least 5 m apart to minimize spatial autocorrelation [24]. Trees with scars, fire or insect damage, split tops and abnormal growth patterns were avoided to minimize growth abnormalities in the tree series collected. Areas near roads or with open edges were also avoided to minimize non-climatic influences on tree growth [16]. Four 5 mm cores were collected from each tree at breast height and spaced 90 degrees around the stem (cores were collected at 30 cm aboveground for younger plantation trees). An additional 12 mm core from each tree was collected at the FSJ sites, from directly below one of the 5 mm cores. Surrounding vegetation, slope, elevation, flowing or standing water, diameter-at-breast-height and GPS site and tree location were recorded.
Of the 120 12 mm cores sampled in FSJ, 89 undamaged cores were selected for SilviScan analysis. Resins were removed from the cores selected via 12 h Soxhlet acetone extraction [25,26]. After extraction, the cores were conditioned at 40% relative humidity and 20 °C to obtain an 8% moisture content equilibrium. Once at 8% moisture content, the cores were cut into 2 mm × 7 mm (tangential × radial) pith-to-bark laths, using a twin-blade saw. Laths were analyzed using the SilviScan system at FPInnovations in Vancouver, BC, Canada. SilviScan analysis included (i) the image analysis of radial and tangential cell dimensions using optical microscopy, (ii) X-ray densitometry to provide measurements of wood density every 25 microns along the wood samples, and, (iii) X-ray diffractometry yielding measurements of microfibril angle at 5 mm increments [27].
The four 5 mm increment cores from FSJ and PG were dried, labelled and cross-dated using the Yamaguchi list method [28]. Two of the four 5 mm cores were sanded with progressively finer grit sand paper, and were scanned using an Epson 1640XL flatbed scanner at 1200 DPI (dots per inch) for the visual assessment of RW, EW and LW widths with WinDendro image analysis. Each core was reviewed to determine the accuracy of WinDendro RW, EW and LW auto-measurements, and corrections were performed manually. The other half of the 5 mm cores from each site were cut into 5 year increments (using only the last 30 years for the planted stands and 80 years for the natural stands) and processed for structural carbon content analysis. Although one-year increments were initially sought, annual increments did not provide enough wood mass for the percent carbon measurements. The 5 year sections of 20 cores were grouped together for each site and were analyzed as an aggregate sample. For example, all 20 cores’ sections with rings dating from 2010–2015 were grouped together to make one sample for carbon analysis. The wet weights of the aggregated samples were measured, following which the resins were extracted from samples using a Soxhlet acetone extraction, at 110 °C for 1.5 h. Once dry, the sample dry weights were recorded, and the samples were ground into a powder with a Wiley mill grinder. Four 4–5 mg replicates from each aggregate sample were created; each was mixed with 10 mg of catalyst, valdium peroxide, and placed into a small container. Each replicate was analyzed with the PerkinElmer 2400 Series II CHNS/O Elemental Analyzer (2400 Series II, PerkinElmer, Waltham, MA, USA) yielding measurements of structural carbon content as a percentage of the total dry wood matter. We averaged the replicate measurements of percent carbon content to obtain a mean value for each 5 year segment. This process was repeated for each 5 year aggregate sample across the chronology, and for all sites.
The individual mean, minimum, and maximum density and cell wall thickness measurements were obtained from the SilviScan data of all the cores from natural and planted stands in FSJ only (N1–N3; P1–P3), due to the cost of analysis. Annual RW, EW, LW, density and cell wall thickness values from each core were averaged into 5 year increment values to correspond to 5 year carbon value increments (i.e., 1937–1941 to 2012–2016). The 20 cores representing a stand were then averaged for each 5 year interval to obtain the average stand-level chronologies of RW, EW, LW, density, and cell wall thickness over the time series. Stand-level and regional-level percent carbon and average RW, EW, LW and mean, minimum, and maximum cell wall thickness and density values were tested for normality using skewness, kurtosis and Shapiro–Wilk values prior to statistical tests. Shapiro–Wilk values for percent carbon were used to determine normality rather than skewness and kurtosis due to small sample sizes. Data failing one test were assessed using histograms to determine the severity of skew. Data failing all tests were transformed where possible or assumed non-normal. Data that were unable to be normalized were removed from further analysis.
Several one-way ANOVAs with Bonferroni post-hoc (alpha = 0.05) tests were conducted to determine the significant differences of mean percent carbon content between natural (N1 vs. N2 vs. N3) and planted stands (P1 vs. P2 vs. P3) (Table 2). Residuals of ANOVA tests were checked for normality. Regional data sets were created for the natural and planted stands of percent carbon and the mean, minimum and maximum density, and cell wall thickness, where no significant differences existed, by combining the data from the three sites together. An independent t-test analysis was conducted to determine if there was a significant difference between the regional data sets of mean percent carbon content in the natural and planted stands (Table 2). Correlation statistics were calculated for the regional data sets and natural and planted stand values, comparing the mean percent carbon values to the average RW, EW, LW and mean, maximum and minimum density and cell wall thickness values over time. We used a Pearson’s or Spearman Rank correlation coefficient (R) (Table 3).
Historical climate information was obtained from the Adjusted Historical Canadian Climate Data for Fort St. James, nearest meteorological station to FSJ sites (Station #1092970, Latitude 54°45, Longitude-124°25, 686 m elevation), and Prince George, nearest meteorological station to the PG sites (Station #1096439, Latitude 53°88, Longitude-122°67, 680 m elevation). We investigated the following climate variables: monthly mean temperature, total monthly precipitation, and the winter (previous December, current January and February), spring (current March, April, May) and summer (current June, July, August), and previous autumn (previous September, November, December) seasonal averages. Random missing values within the climate data were calculated by averaging four surrounding points or filled with modelled climate data from Climate BC (http://cfcg.forestry.ubc.ca/projects/climate-data/climatebcwna/) for large gaps in data. Temperature and precipitation data were averaged into 5 year intervals for comparison with 5 year average percent carbon data.
Percent carbon measurements were correlated to the climate data (mean previous monthly May–December and mean current monthly January–September, and the previous autumn, winter, spring, and summer temperature and precipitation) values using Pearson’s correlation coefficient (R) or Spearman’s Rank coefficient for non-parametric data that could not be normalized (Table 3). In addition, correlation statistics were determined for the data from natural stands that were truncated to the last 30 years of growth (N(X)trunc). Truncated natural stand chronologies were compared with planted and entire natural stand chronologies. Partial correlation was used to determine the spurious correlations when relationships between percent carbon were found to both temperature and precipitation within the same months/seasons.
Regression analysis was completed where the significant Pearson’s correlation coefficients were detected to further elucidate the relationships between the variables investigated. Only significant R2 > 0.40 are reported [29]. Values for carbon, modelled based on the meteorological measurements were correlated back to the measured carbon values to verify the accuracy of the climate variable in predicting carbon values. Coordination between the measured and modelled carbon values were also visually assessed over time to determine the overall accuracy of the relationships modelled.

3. Results

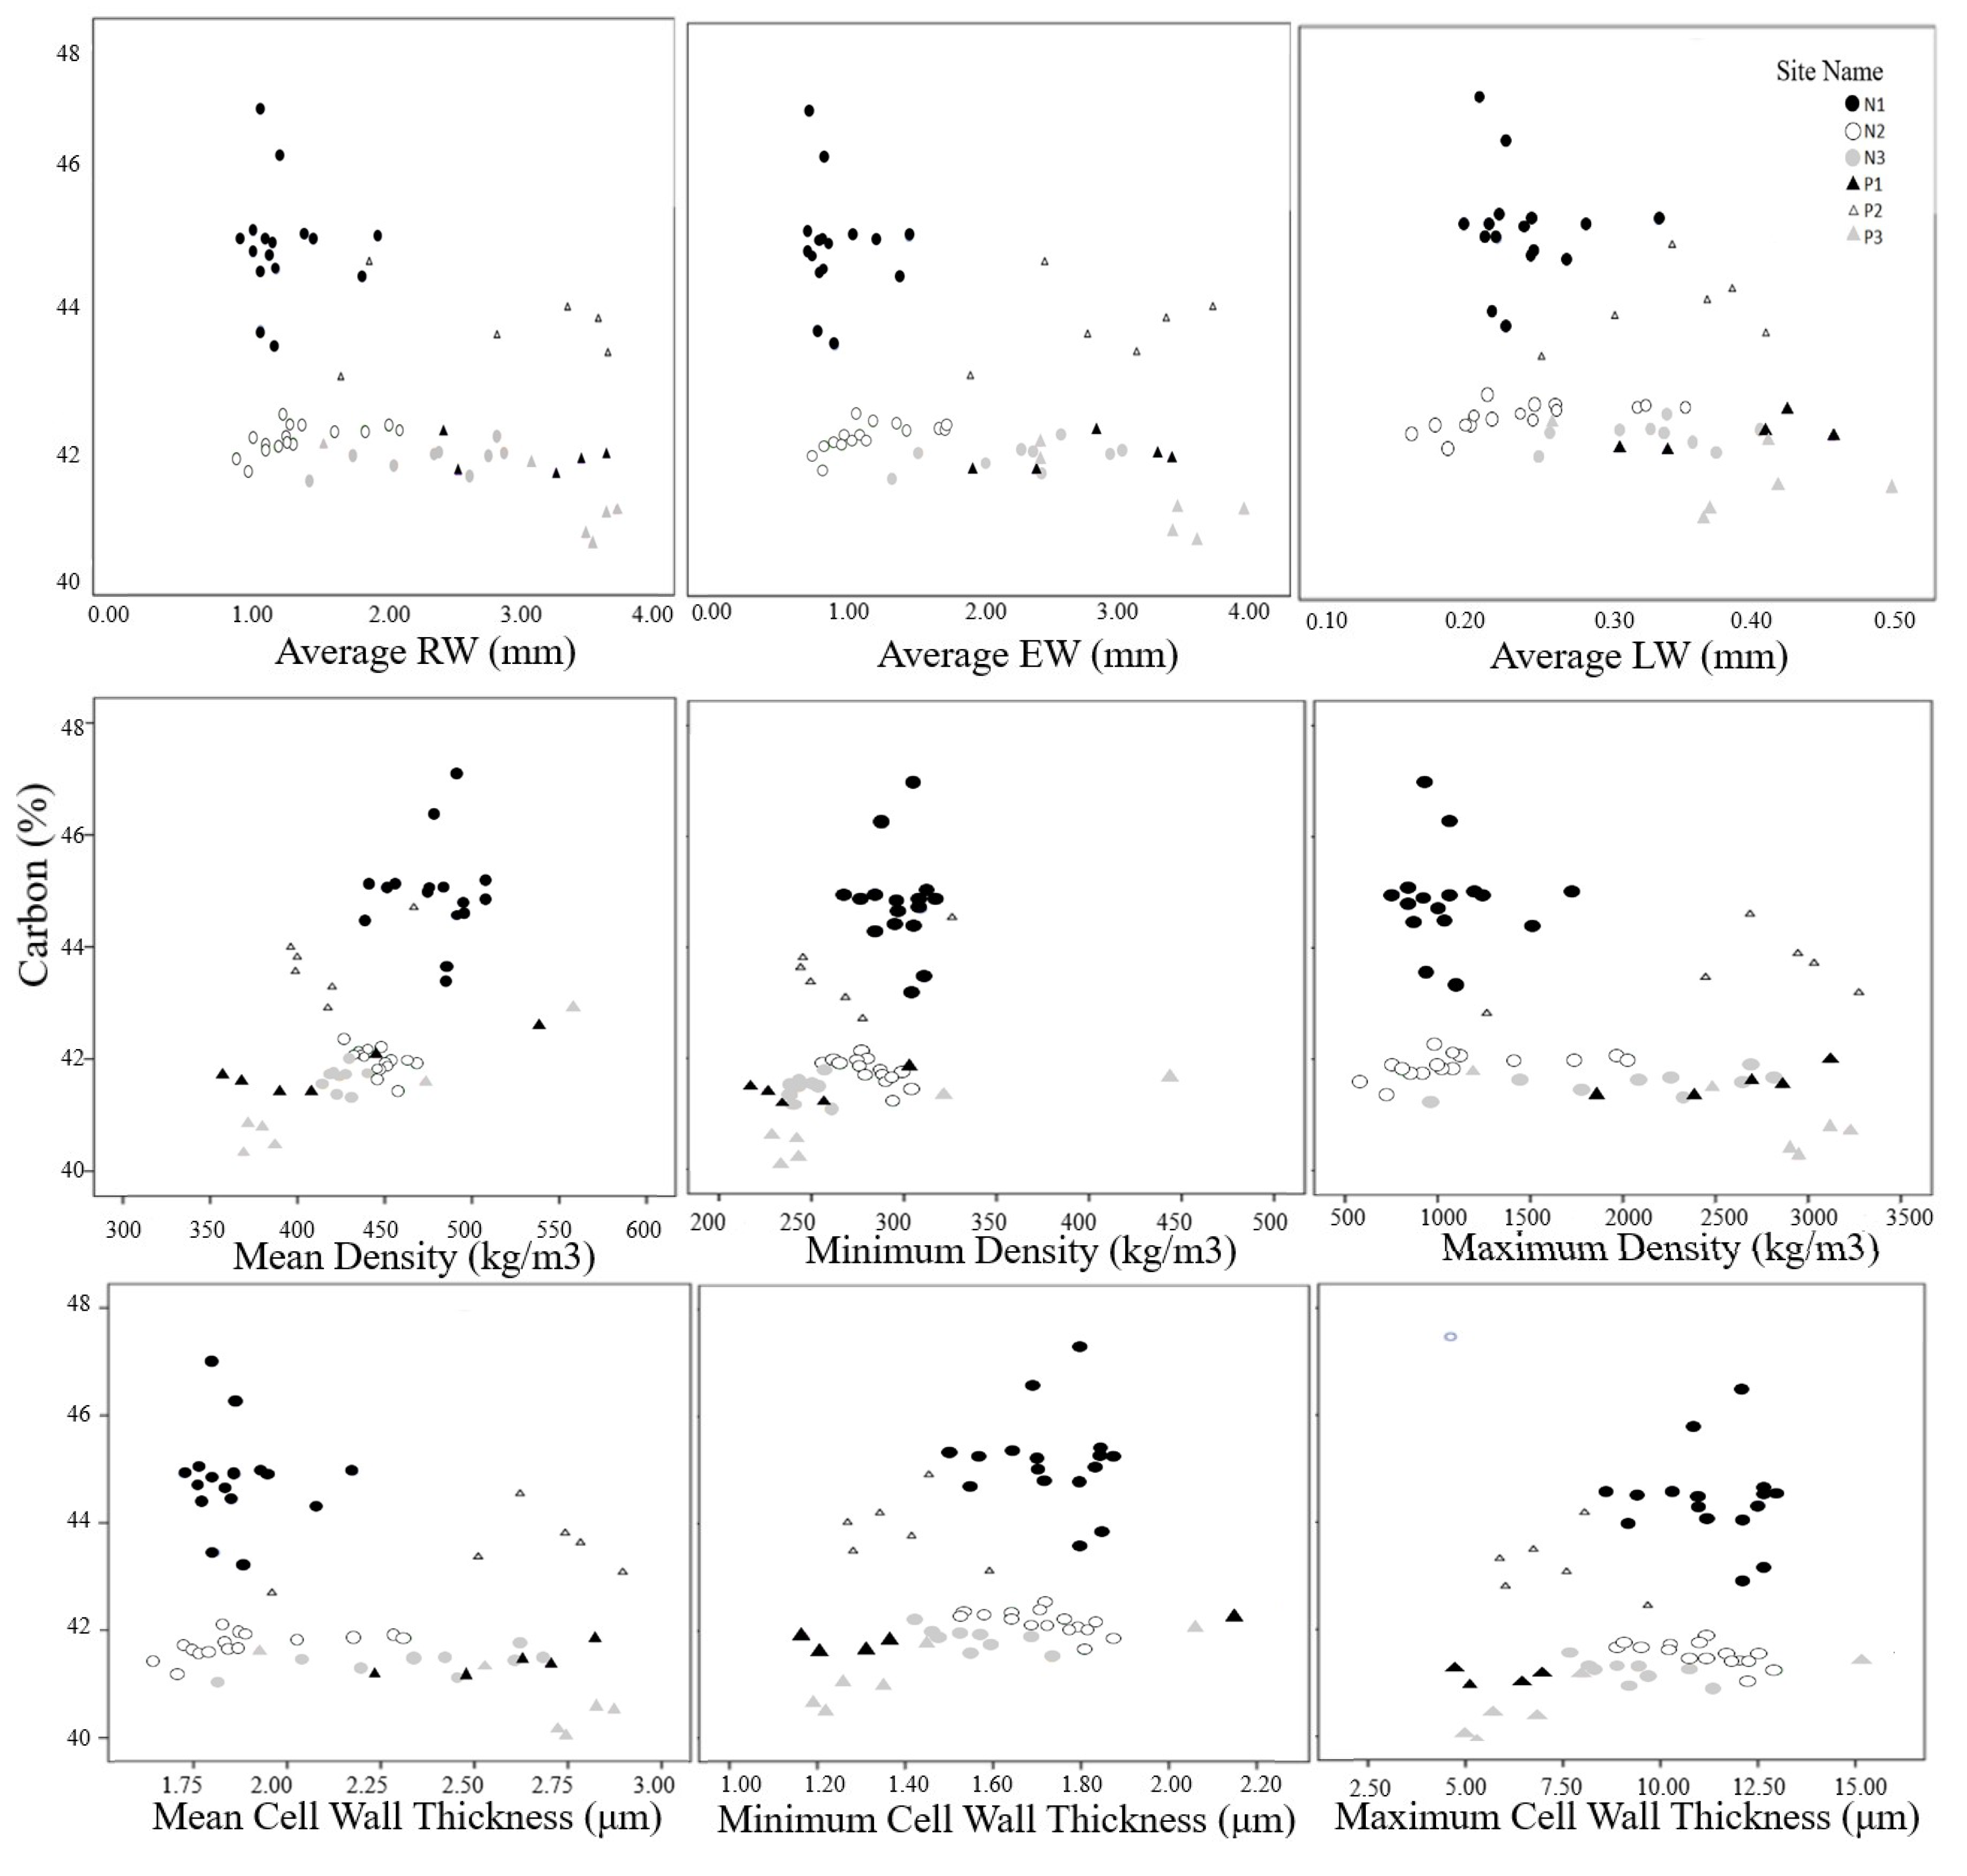
3.1. Percent Carbon vs. Radial Growth Variables

Percent carbon was only determined for 30 years of growth for the planted stands and the last 80 years of growth for the natural ones, which resulted in greater proportions of juvenile wood in planted stand chronologies. Average carbon values for the PG natural stands ranged from 42.23% (+/−1.13) to 45.21% (+/−1.27), while we measured carbon values to range between 43.24% (+/−0.75) and 41.24% (+/−0.38) for the PG planted stands. Percent carbon values for FSJ stands a shared similar range to the PG stands (Table 2) and were further explored in comparison to the wood properties.
Percent carbon FSJ chronologies were normally distributed. Average percent carbon was statistically different among natural stands at a 5% confidence level (F = 144.97); post hoc comparisons indicated that the mean percent carbon of N1 was significantly different from the mean percent carbon of N2 and N3 (p < 0.0001) with no significant difference seen between N2 and N3 (p = 0.589) (Table 2).
Planted stands showed statistically different percentages of carbon at a 5% confidence level (F = 20.98); post hoc comparisons indicated that the mean percent carbon of P2 was significantly different from mean percent carbon of P1 and P3 (p < 0.0001) with no significant difference between the P1 and P3 (p = 0.401) (Table 2). Independent sample t-test results indicated no significant difference between regional-level mean percent carbon of natural stands (average of N2 and N3) and the planted stands (average of P1 and P3) (t = 1.950, p-value = 0.070, two-tailed) in FSJ (Table 2).
Percent carbon and wood properties were significantly correlated over time in stands N2, N3, and P1 (Figure 2). Relationships between the wood properties and percent carbon values by site are shown in Figure 2. Pearson(P) and Spearman Rank(S) correlations statistics determined significant correlations (** p = 0.01; * p = 0.05) between the percent carbon and wood properties over time in stands N2, N3, and P1 as follows: C vs. RW = 0.691 ** (N2); −0.855 ** (P1); C vs. EW = 0.624 ** (N2); C vs. LW = 0.602 ** (N2); C vs. MeanD = −0.592 * (N2); C vs. MinD = −0.674 ** (N2); C vs. MaxD = 0.712 ** (N2); C vs. MeanCWT = −0.688 ** (N2); C vs. MinCWT = −0.623 * (N2); −0.673 * (N3); C vs. MaxCWT = −0.712 ** (N2) (Figure 2).

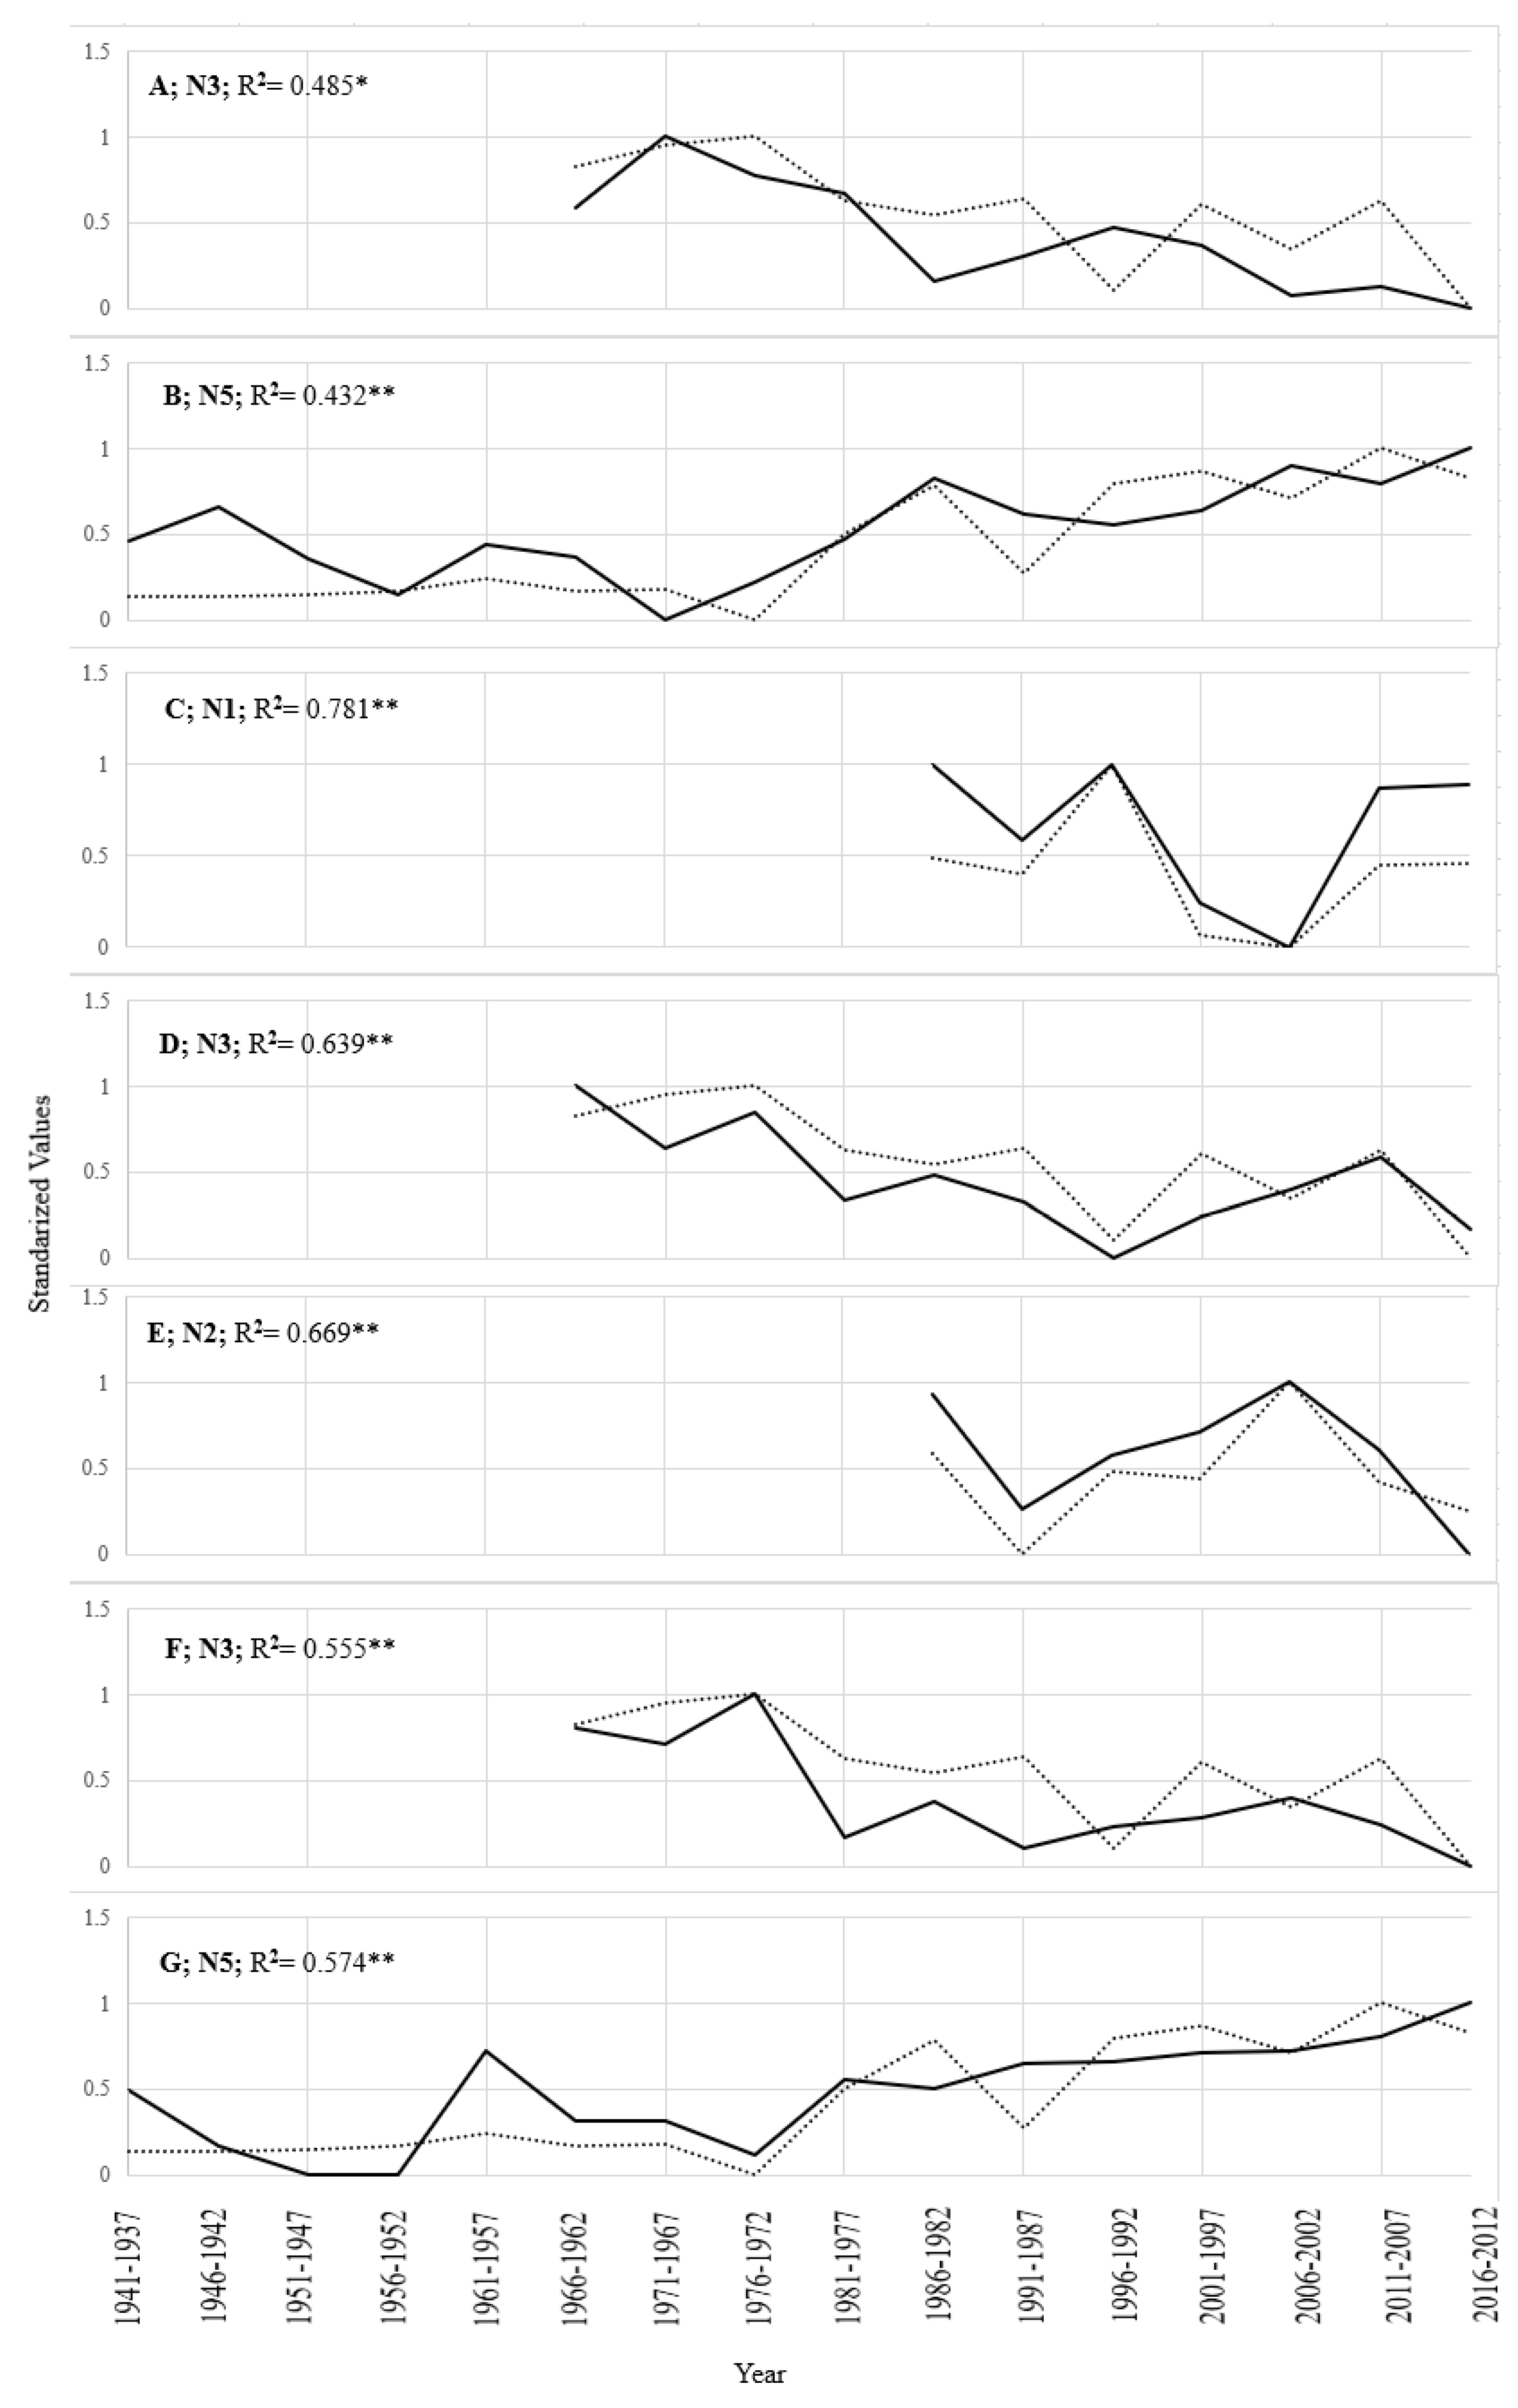
3.2. Percent Carbon vs. Climate

Climate conditions recorded at the FSJ and PG weather stations have changed over the last 100 years. Historical climate records indicate that the mean annual precipitation has ranged from 282–770 mm in FSJ, and 368–934 mm in PG. Average annual precipitation and annual average temperatures have been recorded as 465 mm and 2.8 °C for FSJ, and 633 mm and 3.7 °C for PG. Mean average temperature has increased since 1920 by 1.2 °C and 0.4 °C in Fort St James and Prince George, respectively. Total annual precipitation since 1920 has increased by 31.2 mm in PG and decreased by 24.6 mm in FSJ.
Percent carbon chronologies in the planted stands of PG were significantly negatively correlated to the previous year’s July and September, and the current year’s July and spring temperatures; whereas the planted stands of FSJ were positively correlated to the current year’s September temperature (Table 3). In the natural stands, the chronologies of the percent carbon from the FSJ were generally negatively correlated to the aforementioned climate variables, while the chronologies of percent carbon from PG were generally positively correlated to several previous and current monthly temperatures (Table 3). Only one of the truncated natural carbon chronologies was negatively correlated to the current July and August temperatures and positively correlated to the previous September temperatures (from FSJ), and no significant correlations were found between the truncated natural chronologies and temperature from PG.
Chronologies of percent carbon in the planted stands of FSJ were significantly positively correlated to the current February, May, and winter precipitation (Table 3). The chronologies of the percent carbon from natural stands of FSJ and PG were positively correlated to current June and September precipitation (Table 3); while the truncated natural chronologies of percent carbon from FSJ were significantly negatively correlated with the current year March precipitation and positively correlated with winter precipitation. We did not find any significant relationships between precipitation variables and the truncated carbon chronologies from the natural stands of PG (Table 3).
Although numerous significant relationships were found between the climate and chronologies of percent carbon from both the FSJ and PG using correlation and regression analyses, we showed only the strongest relationships found in natural stand percent carbon modelled from climate variables in Table 4 and Figure 3. Planted stand chronologies were not used for modelling carbon due to the unusually high R2 values observed, resulting from a small sample size.

4. Discussion

This study sought to understand how the structural carbon of hybrid white spruce (Picea glauca × engelmannii) in natural and planted stands varied over time, and how these variations in carbon related to RW, EW, LW, density, and the cell wall thickness properties of hybrid white spruce wood. We were also interested in determining how variations in carbon allocation in hybrid white spruce corresponded with changes in the temperature and precipitation of interior British Columbia, Canada.

4.1. Percent Carbon vs. Radial Growth Variables

We provide empirical data on the structural carbon content of hybrid white spruce trees in the interior region of British Columbia; an area that is representative of a large boreal forest region extending across the Canadian landscape [30]. These carbon measurements, and relationships with climate and cell property variables, add significantly to what is known about the carbon content of forests based on existing models that use DBH and biomass [5,6]. This type of measured data can be used to improve the modelling of wood carbon content and our understanding of the variation that exists in carbon values within the same species across the landscape. We can also better appreciate the amount of carbon that remains sequestered long term in wood products, by specifically identifying the structural carbon element, as many volatile carbon components are lost in manufacturing processes [31]. We found that the structural component of carbon made up between 41–48% of the biomass of our wood samples; this carbon will remain as fixed products, or while standing in the forest, until the wood interacts with soil decomposers and is decayed.
The relationships we identified between the wood properties and carbon indicate that the RW, EW, and LW width values may be good indicators of percent carbon variation in natural and planted stands of BC hybrid white spruce [32]. Average RW, EW, and LW are easily measured using inexpensive standard dendrochronological techniques, and are therefore an advantageous way of capturing the estimates of carbon, where the relationships between these variables indicate this possibility. Although there is evidence that in some species tree diameter at breast height (DBH) is a good variable for carbon estimations, as an increasing tree diameter allows for increased biomass and thus increased carbon [2,33,34], this trend is not consistent across studies [33,34]. Therefore, perhaps in cases where DBH is not satisfactorily accurate, RW, or EW and LW could be used as a proxy. Furthermore, the relationships between carbon and density and cell wall thickness could provide even greater accuracy in cases where structural carbon estimates are simply determined by biomass as a function of tree height and DBH [1,35,36,37,38].
By comparing the carbon content of wood to easily measured wood properties, we can better understand their relatedness in specific environments, and apply this knowledge towards the use of these properties as proxies for carbon content. We can also better understand the natural genetically and environmentally controlled variation that exists between the trees and stands in terms of their carbon content. Significant correlations between the percent carbon and average RW, EW, and LW and mean, maximum, and minimum cell wall thickness and density values of the natural and planted stands were present in three out of the six stands measured (N2, N3 and P1 stands), with the majority of the relationships found with N2. Carbon could have been respired or used in other metabolic processes at different rates in a stand specific way, creating small differences in the amount of structural carbon measured in the stems. Alternatively, the trees at N2 may have allocated carbon differently within the tree, for example, to the cells of the stem, vs. needles, branches or roots, resulting in variation in the strength of the relationships between the carbon and wood properties measured in our stem cores. Inter-stand differences in the concentrations of cellulose, lignin and non-structural carbohydrates are also possible [1]. Parameters such as crown size, crown closure, and photosynthetic rates that could be used to determine these differences were not collected within this study; future research should consider the incorporation of these measurements in the experimental design. Statistical comparisons of carbon content in some stands were insignificant, likely due to small sample size (tree age and reduction from annual to 5-year increment measurements for carbon analysis mass requirements were limiting factors).
Relationships between the percent carbon and radial growth variable values in N2 suggest that higher amounts of cellulose and lignin (as represented by a thicker cell wall and denser wood) correspond to greater proportions of percent carbon; maximum values appeared to have stronger relationships than the mean and minimum measurement values (Figure 2). These results are similar to previous work in western Canada and Alaska, showing correlations between forest productivity and LW (max) and other studies relating carbon to biomass and density, with maximum values of cell wall thickness and density as the best predictors of percent carbon [1,2,6,32,38,39]. Mean and minimum cell wall thickness and density measurements did not share the same relationships with percent carbon as shown in the maximum values. In fact, the data from the N2 and N3 stands suggested an opposite trend—that even if the minimum measurement of cell wall material, or the mean amount within a given year, is increased, if the maximum amount of cell wall material is lower in that year, then the overall cell wall thickness will correspond to reduced proportions of structural carbon. Therefore, we conclude that maximum cell wall thickness and density values are the most valuable to capture for relating to structural carbon accumulation.
We investigated the potential differences that exist between carbon contents in plantation hybrid white spruce and naturally grown hybrid white spruce in central interior BC. Carbon contents in these natural and planted stands were difficult to compare due to the differences in age and a lack of data points. The oldest plantation hybrid white spruce stands in the interior BC were approaching 40 years, while the naturally grown hybrid white spruce trees were as old as the last natural disturbance (~80–150 years). Thus, most naturally-grown, dominant, canopy spruce trees are much older than 40 years and have proportionally more mature wood to juvenile wood in comparison to the 30–40 year-old plantation trees. We were unable to sample natural hybrid white spruce stands at 40 years of age, to match the age of the plantation stands, because naturally regenerated, 40-year old hybrid white spruce are usually found in the sub-canopy of more dominant tree types, and are limited in growth by competition rather than climate. Therefore, we observed the growth rates with the climate in last 40 years of growth of natural stands as a truncated chronology, and the last 40 years of growth in the plantation stands to keep the climate period consistent, even though the juvenile wood (JW): mature wood (MW) ratio was different between the stand types.
Based on the structural cell properties alone, fast-growing, thin-walled, and low-density cells typical of JW should have a lower structural percent carbon content than denser, thicker cells, found in MW [40]. Conversely, juvenile wood can contain higher percent carbon than mature wood where larger proportions of lignin and extractive concentrations exist [41,42]. Because our samples had chemical extractives, or non-structural carbon removed, we expected the older, natural stands to contain higher proportional amounts of carbon due to higher MW: JW. However, we found an insignificant difference between the average percent of carbon in the natural vs. planted stands at the regional level. There are a few possible explanations for these findings. The first is that the duration of production of juvenile wood was shorter in the plantation trees than in the naturally grown trees, which would lead to similar MW: JW between the two stand types. Naturally regenerated hybrid white spruce would have germinated from locally adapted seed sources, while plantation trees would have genetically originated from the region, but not the specific location where they were planted, potentially leading to a slower growing tree. Furthermore, genetically improved spruce tree stock that is commonly used today, and is fast growing in cut-block openings, was not available in the 1970s when the trees we measured were planted.
Another possible reason for the lack of significant differences between the carbon contents in the natural vs. planted trees is that not all the non-structural compounds were extracted. If some extractives remained in the wood, and there were more extractives in the JW to begin with, then the differences in structural carbon could have been muted by the variation in extractives. Samples analyzed for carbon content were extracted using a Soxhlet acetone apparatus, for 1.5 h. It is suggested that future research using this technique employs a longer extraction time, which will potentially yield more significant results in comparing the structural carbon content between stands. There is a lack of standardized sampling protocols to prepare samples for carbon measurements; variations include kiln-drying [43], freeze-drying, and oven-drying at varying temperatures, such as 105 °C [3] and 70 °C [44,45]. These variations in sample preparation make cross-study comparisons difficult to interpret [31,45]. These protocols require further investigation for the development of an optimal, standard method.

4.2. Percent Carbon vs. Climate

We found variation in the percent carbon between the individual stands in the FSJ region that may be attributed to geographical and environmental factors. Factors such as latitude, elevation, and topography, or site-specific differences such as soil water volume, crown cover, and nutrient availability have been shown to influence carbon contents [1,2,39]. Significantly higher percent carbon contents were observed in P2 and N1, likely due to the differences in these sites. The warmer south-facing slope of P2 received more sunlight, which likely expedited snow-melt and soil thaw in comparison with the flat topography of P1 and P3. The site conditions at P2 may have resulted in increased growing season length, directly enabling carbon accumulation [46]. Higher proportional carbon content of N1 may be attributed to the stream at this site that could stabilize or increase the soil moisture content. Increased moisture in N1 could counteract unfavourable conditions for growth such as rising temperatures coupled with reduced precipitation, as seen in the FSJ climate. These observations have been found in other studies with similar climatic conditions, such as trees grown in wet vs. dry conditions [47,48,49].
Percent carbon accumulation in the planted and natural stands in FSJ and PG was negatively influenced by rising temperatures with some site-specific differences in relationships with spring climate variation. We found that the percent carbon component of the wood sampled in the planted stands of the PG region, and the natural stands in the FSJ region, were statistically negatively related to multiple temperature variables, including the previous year’s December, the current year’s January, average spring, and previous year and current July temperatures. Increasing temperatures during winter months can reduce the length of snow cover and reduce the accumulated winter precipitation, or insulation, leading to deeper soil freezing [50]. These conditions can prevent or reduce the absorption of melting snow thus delaying bud burst and the percent carbon accumulation in spring months [51]. Additionally, increasing spring or summer temperatures beyond optimal growth thresholds have been shown to reduce or halt growth, and subsequent carbon accumulation, in previous studies of BC interior spruce [52,53]. Conversely, percent carbon measured from N5 was positively correlated to rising winter and summer temperatures in the PG region, likely due to the favourable site-specific growing conditions, including N5’s higher elevation, relatively higher precipitation, and cooler average temperatures (SBS very–wet–cool). Thus, increasing percent carbon accumulations that coordinate with increasing temperatures are explainable in this case, and similar relationships have been found with increased forest productivity under favourable conditions [47,49].
Carbon accumulations in FSJ and PG were related to spring precipitation variation, albeit in different ways. Decreases in FSJ spring precipitation were statistically related to lower relative percent carbon values in the P2 chronology, and higher relative carbon values in the N1 chronology truncated to the last 30 years of growth (N1trunc). Lower total precipitation in May could have negatively affected the percent carbon accumulation in P2 due to the south-facing slope, which could have caused increased rates of evaporation and transpiration and reduced soil moisture, and ultimately reduced carbon accumulation relative to the other planted stands. We found that decreases in March precipitation, typically falling as snow in this region, were correlated with greater carbon proportions in N1trunc. Reduced March precipitation, or snow depth, could lead to earlier bud burst and an extension of growing season length and subsequent increased radial growth and carbon accumulation [54]. In PG, the results suggested that lower percent carbon values at P5 were related to increasing average spring precipitation. Increased and prolonged precipitation could have reduced cell production and subsequent carbon accumulation in P5, with decreased light availability for photosynthesis occurring with increased cloud cover [39].
Percent carbon measurements over the last 30 years, truncated from the natural stands in FSJ, were more strongly related to climate variation compared to full-length chronologies; these relationships were not seen in the natural stand data from the PG. This suggests that the temperature and precipitation variation in FSJ have become more influential in determining the percent carbon accumulation than earlier in the time series, an observation seen in radial growth and climate in other studies [55,56,57]. The historical climate of FSJ shows rising temperatures coupled with stark reductions in precipitation, which may explain the stronger relationships between climate variation and percent carbon in recent decades. Likely, these same relationships were not observed in the truncated percent carbon chronologies of PG natural stands because of the differences in climate regimes. Historical records of PG climate report roughly 200 mm higher average precipitation and 1 °C higher average temperature than FSJ climate. In recent decades, records in PG also show stable increases in precipitation that contrasts with stark decreases in FSJ. Higher and stable average precipitation coupled with increasing temperatures, as seen in the PG climate records, suggests that conditions are more favourable for growth than in the warmer, drier conditions of FSJ. This general difference in regional climate may explain the lack of significant relationships between the climate and natural stand chronologies around the PG. Results from this study indicate that trees in FSJ may be reaching growth–thresholds—warming coupled with a reduction in precipitation, trends that are not observed in PG [12,55,58].
We used current and one year lagged precipitation and temperature variables from the FSJ and PG climate stations to predict the percent carbon from natural hybrid white spruce stands in central interior BC. We found that these models were more difficult to apply to younger, planted stands, as small sample sizes lead to decreased reliability in the model statistics, increasing the likelihood of type II error [59]. Increased sampling error and outlier influences that question validity may also occur with small sample sizes [59]. However, the relationships presented between natural stands and carbon provide an example of a method that could form the basis for a novel approach to understanding climate effects on carbon allocation in forest stands based on a dendrochronological analysis. There are limited studies on variation in structural carbon content, and even fewer that use direct empirical measurements of structural carbon. To our knowledge, this is the only study that has used the measurements of structural carbon in dendrochronological applications to make stand-level estimates of wood carbon.

5. Conclusions

This study presents a novel approach for understanding the relationships between structural percent carbon and radial tree growth and climate. Results suggest that the maximum values of cell wall thickness and density may aid in improving the existing models of carbon estimations that are historically based on DBH and biomass. Investigation into the effect of temperature and precipitation on carbon allocation in natural and planted stands showed that rising temperatures were related to a reduction in carbon allocation; precipitation variation had site-specific differences.

Author Contributions

Conceptualization and methodology design, A.I. and L.J.W.; formal analysis, investigation, resources, data curation, writing—original draft preparation, A.I.; writing—review and editing, L.J.W. and K.L.; supervision, L.J.W. and K.W; funding acquisition, A.I. and L.J.W. All authors have read and agreed to published version of the manuscript.

Funding

This research was funded by Natural Resources Canada, Mitacs, Canfor Pulp Ltd., and UNBC.

Acknowledgments

Special thanks to Aita Bezzola for creating the site map for this manuscript.

Conflicts of Interest

The authors declare no conflict of interest.

References

  1. Weber, J.C.; Sotelo Montes, C.; Abasse, T.; Sanquetta, C.R.; Silva, D.A.; Mayer, S.; Muniz, G.I.B.; Garcia, R.A. Variation in growth, wood density and carbon concentration in five tree and shrub species in Niger. New For. 2018, 49, 35–51. [Google Scholar]
  2. Elias, M.; Potvin, C. Assessing inter- and intra-specific variation in trunk carbon concentration for 32 neotropical tree species. Can. J. Res. 2003, 33, 1039–1045. [Google Scholar]
  3. Thomas, S.C.; Malczewski, G. Wood carbon content of tree species in eastern China: Interspecific variability and the importance of the volatile fraction. J. Environ. Manag. 2007, 85, 659–662. [Google Scholar]
  4. Lachenbruch, B.; Mcculloh, K.A. Tansley review Traits, properties, and performance: How mechanical functions in a cell, tissue, or whole. New Phytol. 2014, 204, 747–764. [Google Scholar]
  5. Zabek, L.M.; Prescott, C.E. Biomass equations and carbon content of aboveground leafless biomass of hybrid poplar in coastal British Columbia. For. Ecol. Manag. 2006, 223, 291–302. [Google Scholar]
  6. Castaño-Santamaría, J.; Bravo, F. Variation in carbon concentration and basic density along stems of sessile oak (Quercus petraea (Matt.) Liebl.) and Pyrenean oak (Quercus pyrenaica Willd.) in the Cantabrian Range (NW Spain). Ann. For. Sci. 2012, 69, 663–672. [Google Scholar]
  7. Allen, C.D.; Macalady, A.K.; Chenchouni, H.; Bachelet, D.; McDowell, N.; Vennetier, M.; Kitzberger, T.; Bigling, A.; Breshears, D.D.; Hogg, E.H.; et al. A global overview of drought and heat-induced tree mortality reveals emerging climate change risks for forests. For. Ecol. Manag. 2010, 259, 660–684. [Google Scholar]
  8. Schwalm, C.R.; Williams, C.A.; Schaefer, K.; Arneth, A.; Bonal, D.; Buchmann, N.; Chen, J.; Law, B.L.; Lindroth, A.; Luyssaert, S.; et al. Assimilation exceeds respiration sensitivity to drought: A FLUXNET synthesis. Glob. Chang. Biol. 2010, 16, 657–670. [Google Scholar]
  9. Haughian, S.R.; Burton, P.J.; Taylor, S.W.; Curry, C. Expected effects of climate change on forest disturbance regimes in British Columbia. J. Ecosyst. Manag. 2012, 13, 1–24. [Google Scholar]
  10. Babst, F.; Alexander, M.R.; Szejner, P.; Bouriaud, O.; Klesse, S.; Roden, J.; Ciais, P.; Poulter, B.; Frank, D.; Moore, D.J.P.; et al. A tree-ring perspective on the terrestrial carbon cycle. Oecologia 2014, 176, 307–322. [Google Scholar]
  11. McDowell, N.G.; Allen, C.D. Darcy’s law predicts widespread forest mortality under climate warming. Nat. Clim. Chang. 2015, 5, 669–672. [Google Scholar]
  12. Lo, Y.H.; Blanco, J.A.; Seely, B.; Welham, C.; Kimmins, J.P. Relationships between climate and tree radial growth in interior British Columbia, Canada. For. Ecol. Manag. 2010, 259, 932–942. [Google Scholar]
  13. Fleming, S.W.; Whitfield, P.H. Spatiotemporal mapping of ENSO and PDO surface meteorological signals in British Columbia, Yukon, and southeast Alaska Spatiotemporal Mapping of ENSO and PDO Surface Meteorological Signals in British Columbia, Yukon, and Southeast Alaska. Can. Meteorol. Oceanogr. Soc. 2010, 48, 122–131. [Google Scholar]
  14. Jiang, X.; Huang, J.; Stadt, K.J.; Comeau, P.G.; Chen, H.Y.H. Spatial climate-dependent growth response of boreal mixedwood forest in western Canada. Glob. Planet. Chang. 2016, 139, 141–150. [Google Scholar]
  15. Millar, C.I.; Stephenson, N.L. Temperate forest health in an era of emerging megadisturbance. Science 2015, 349, 823–826. [Google Scholar]
  16. Fritts, H.C. Tree Rings and Climate; Academic Press Inc.: New York, NY, USA, 1976. [Google Scholar]
  17. Bouriaud, O.; Bréda, N.; Dupouey, J.-L.; Granier, A. Is ring width a reliable proxy for stem-biomass increment? A case study in European beech. Can. J. For. Res. 2005, 35, 2920–2933. [Google Scholar]
  18. Grünwald, T.; Bernhofer, C. A decade of carbon, water and energy flux measurements of an old spruce forest at the Anchor Station Tharandt. Chem. Phys. Meteorol. 2007, 59, 387–396. [Google Scholar]
  19. Liepiņš, J.; Lazdiņš, A.; Liepiņš, K. Equations for estimating above- and belowground biomass of Norway spruce, Scots pine, birch spp. and European aspen in Latvia. Scand. J. For. Res. 2018, 33, 58–70. [Google Scholar]
  20. Davis, S.C.; Hessl, A.E.; Scott, C.J.; Adams, M.B.; Thomas, R.B. Forest carbon sequestration changes in response to timber harvest. For. Ecol. Manag. 2009, 258, 2101–2109. [Google Scholar]
  21. Ter-Mikaelian, M.T.; Colombo, S.J.; Chen, J. Effect of age and disturbance on decadal changes in carbon stocks in managed forest landscapes in central Canada. Mitig. Adapt. Strateg. Glob. Chang. 2014, 19, 1063–1075. [Google Scholar]
  22. Meidinger, D.; Pojar, J. Ecosystems of British Columbia; BC Ministry of Forests: Victoria, BC, Canada, 1991. [Google Scholar]
  23. Delong, C.; Tanner, D.; Jull, M.J. A Field Guide for Site Identification and Interpretation for the Southwest Portion of the Prince George Forest Region; Province of Britsh Columbia Minsitry of Forests: Prince George, BC, Canada, 1992. [Google Scholar]
  24. Dale, M.R.T.; Fortin, M.J. Spatial Analysis: A Guide for Ecologists; Cambridge University Press: Cambridge, UK, 2014. [Google Scholar]
  25. Jensen, W.B. The Origin of the Soxhlet Extractor. J. Chem. Educ. 2007, 84, 1913–1914. [Google Scholar]
  26. Grabner, M.; Wimmer, R.; Gierlinger, N.; Evans, R.; Downes, G. Heartwood extractives in larch and effects on x-ray densitometry. Can. J. For. Res. 2005, 35, 2781–2786. [Google Scholar]
  27. Evans, R.; Ilic, J. Rapid prediction of wood stiffness from microfibril angle and density. For. Prod. J. 2001, 51, 53. [Google Scholar]
  28. Yamaguchi, D.K. A simple method for cross-dating cores from living trees. Can. J. Res 1991, 21, 414–416. [Google Scholar]
  29. Wood, L.J.; Smith, D.J. Climate and glacier mass balance trends from AD 1780 to present in the Columbia mountians, British Columbia, Canada. Holocene 2012, 23, 739–748. [Google Scholar]
  30. Coates, D.K.; Haeussler, S.; Lindeburgh, S.; Pojar, R.; Stock, A.J. Ecology and Silviculture of Interior Spruce in British Columbia; Government of Canada: British Columbia, BC, Canada, 1994; pp. 1–182. [Google Scholar]
  31. Jones, D.A.; Hara, K.L.O. The influence of preparation method on measured carbon fractions in tree tissues. Tree Physiol. 2017, 36, 1177–1189. [Google Scholar]
  32. Beck, P.S.A.; Andreu-Hayles, L.; D’Arrigo, R.; Anchukaitis, K.J.; Tucker, C.J.; Pinzón, J.E.; Goetz, S.J. A large-scale coherent signal of canopy status in maximum latewood density of tree rings at arctic treeline in North America. Glob. Planet. Chang. 2013, 100, 109–118. [Google Scholar]
  33. Navarro, M.; Moya, R.; Chazdon, R.; Ortiz, E.; Vilchez, B. Successional variation in carbon content and wood specific gravity of four tropical tree species. Bosque 2013, 34, 9–10. [Google Scholar]
  34. Clark, D.A.; Piper, S.C.; Keeling, C.D.; Clark, D.B. Tropical rain forest tree growth and atmospheric carbon dynamics linked to interannual temperature variation during 1984–2000. Proc. Natl. Acad. Sci. USA 2003, 100, 5852–5857. [Google Scholar]
  35. Somogyi, Z.; Cienciala, E.; Mäkipää, R.; Muukkonen, P.; Lehtonen, A.; Weiss, P. Indirect methods of large-scale forest biomass estimation. Eur. J. For. Res. 2007, 126, 197–207. [Google Scholar]
  36. Kearsley, E.; De Haulleville, T.; Hufkens, K.; Kidimbu, A.; Toirambe, B.; Baert, G.; Huygens, D.; Kebede, Y.; Defourny, P.; Bogaert, J.; et al. Conventional tree height-diameter relationships significantly overestimate aboveground carbon stocks in the Central Congo Basin. Nat. Commun. 2013, 4, 1–8. [Google Scholar]
  37. Ali, A.; Yan, E.R.; Chen, H.Y.H.; Chang, S.X.; Zhao, Y.T.; Yang, X.D.; Xu, M.S. Stand structural diversity rather than species diversity enhances aboveground carbon storage in secondary subtropical forests in Eastern China. Biogeosciences 2016, 13, 4627–4635. [Google Scholar]
  38. Zhang, Q.; Wang, C.; Wang, X.; Quan, X. Carbon concentration variability of 10 Chinese temperate tree species. For. Ecol. Manag. 2009, 258, 722–727. [Google Scholar]
  39. Martin, A.R.; Thomas, S.C. A reassessment of carbon content in tropical trees. PLoS ONE 2011, 6, e23533. [Google Scholar]
  40. Bao, F.C.; Jiang, Z.H.; Jiang, X.M.; Lu, X.; Luo, X.Q.; Zhang, S.Y. Differences in wood properties between juvenile wood and mature wood in 10 species grown in China. Wood Sci. Technol. 2001, 35, 363–375. [Google Scholar]
  41. Zobel, B.J.; van Buijtenen, J.P. Wood Variation: Its Causes and Controls; Springer: Berlin/Heidelberg, Germany, 1989. [Google Scholar]
  42. Bert, D.; Danjon, F. Carbon concentration variations in the roots, stem and crown of mature Pinus pinaster (Ait.). For. Ecol. Manag. 2006, 222, 279–295. [Google Scholar]
  43. Lamlom, S.H.; Savidge, R.A. A reassessment of carbon content in wood: Variation within and between 41 North American species. Biomass Bioenergy 2003, 25, 381–388. [Google Scholar]
  44. Gower, S.T.; Krankina, I.O.; Olson, R.J.; Apps, M.; Linder, S.; Wangi, C. Net primary production and carbon allocation patterns of boreal forest ecosystems. Ecol. Appl. 2001, 11, 1395–1411. [Google Scholar]
  45. Wang, C.; Bond-Lamberty, B.; Gower, S.T. Carbon distribution of a well- and poorly-drained black spruce fire chronosequence. Glob. Chang. Biol. 2003, 9, 1066–1079. [Google Scholar]
  46. Rossi, S.; Deslauriers, A.; Anfodillo, T.; Morin, H.; Saracino, A.; Motta, R.; Borghetti, M. Conifers in cold environments synchronize maximum growth rate of tree-ring formation with day length. New Phytol. 2006, 170, 301–310. [Google Scholar]
  47. Guehl, J.M. Étude comparée des potentialités hivernales d’assimilation carbonée de trois conifères de la zone tempérée (Pseudotsuga menziesii Mirb., Abies alba Mill. et Picea excelsa Link.). Ann. Sci. 1985, 42, 23–38. [Google Scholar]
  48. McMahon, M.S.; Parker, G.G.; Miller, D.R. Evidence for a recent increase in forest growth is questionable. Proc. Natl. Acad. Sci. USA 2010, 107, 3611–3615. [Google Scholar]
  49. Hember, R.A.; Kurz, W.A.; Metsaranta, J.M.; Black, T.; Guy, R.D.; Coops, N.C. Accelerating regrowth of temperate-maritime forests due to environmental change. Glob. Chang. Biol. 2012, 18, 2026–2040. [Google Scholar]
  50. Jarvis, P.; Linder, S. Constraints to growth of boreal forests. Nature 2000, 405, 904–905. [Google Scholar]
  51. Knudson, D.V.; Lindsey, C. Type I and Type II errors in correlations of various sample sizes. Compr. Psychol. 2014, 3, 2165–2228. [Google Scholar]
  52. Zhang, Q.; Alfaro, R.I.; Hebda, R.J. Dendroecological studies of tree growth, climate and spruce beetle outbreaks in central British Columbia, Canada. For. Ecol. Manag. 1999, 121, 215–225. [Google Scholar]
  53. Oberhuber, W.; Gruber, A.; Kofler, W.; Swidrak, I. Radial stem growth in response to microclimate and soil moisture in a drought-prone mixed coniferous forest at an inner Alpine site. Eur. J. For. Res. 2014, 133, 467–479. [Google Scholar]
  54. Peterson, D.W.; Peterson, D.L.; Ettl, G.L. Growth responses of subalpine fir to climate variability in the pacific northwest. Can. J. For. Res. 2002, 32, 1503–1517. [Google Scholar]
  55. Camarero, J.J.; Gazol, A.; Sangüesa-Barreda, G.; Oliva, J.; Vicente-Serrano, S.M. To die or not to die: Early warnings of tree dieback in response to a severe drought. J. Ecol. 2015, 103, 44–57. [Google Scholar]
  56. Martin-Benito, D.; Beeckman, H.; Cañellas, I. Influence of drought on tree rings and tracheid features of Pinus nigra and Pinus sylvestris in a mesic Mediterranean forest. Eur. J. For. Res. 2013, 132, 33–45. [Google Scholar]
  57. Peñuelas, J.; Ogaya, R.; Boada, M.; Jump, A.S. Migration, invasion and decline: Changes in recruitment and forest structure in a warming-linked shift of European beech forest in Catalonia (NE Spain). Ecography 2007, 30, 829–837. [Google Scholar]
  58. Lazarus, B.E.; Castanha, C.; Germino, M.J.; Kueppers, L.M.; Moyes, A.B. Growth strategies and threshold responses to water deficit modulate effects of warming on tree seedlings from forest to alpine. J. Ecol. 2018, 106, 571–585. [Google Scholar]
  59. Li, T.; Ren, B.; Wang, D.; Liu, G. Spatial variation in the storages and age-related dynamics of forest carbon sequestration in different climate zones-evidence from black locust plantations on the loess plateau of China. PLoS ONE 2015, 10, e0121862. [Google Scholar]
Figure 1. Overview map of the natural (squares) and planted (triangles) hybrid white spruce stands sampled for the study, near Prince George and Fort St. James, British Columbia, Canada.
Forests 11 00879 g001
Figure 2. Comparison between the average percent (%) carbon (C) and ring width (RW), earlywood (EW), latewood (LW), and mean maximum minimum cell wall thickness (CWT) (μm) and density (D) (kg/m3) values of the natural (N1, N2, N3) and planted (P1, P2, P3) hybrid white spruce stands depicted by colour and shape. Each point represents a 5 year average within each series for the percent carbon and wood properties. Note that not all the axes are at the same scale.
Forests 11 00879 g002
Figure 3. Measured (dotted line) vs. modelled (solid line) normalized percent carbon values from a natural stand of hybrid white spruce within the John Prince Research Forest (N1–N3) and near PG (N5). Data modelled from current year January temperature (A,B), current year March precipitation (C), average spring temperature (D), and current July temperature (EG) from Fort St. James and Prince George climate stations. R2 values are presented with ** p = 0.01 and * p = 0.05. Note that not all axes are at the same scale.
Forests 11 00879 g003
Table 1. Site and stand characteristics of the natural (N1–N6) and planted (P1–P6) hybrid white spruce research samples surrounding the John Prince Research Forest (FSJ) and Prince George (PG), collected in 2016–2017. Note that not all the cores collected from the FSJ sites were suitable for analysis and one 12 mm core was collected in addition to the 5 mm cores. DBH = diameter at breast height.
Geographic InformationTree Characteristics
SiteLatitudeLongitudeElevation (m)Slope (%)Mean Age (Years)Number of 5 mm Tree CoresMean DBH (cm)
FSJN154 38′50.80124 23′35.1768<21014027
N254 39′46.60124 24′36.6833<51193539
N354 36′58.21124 19′05.57270523431
P154 38′47.50124 23′68.28010284018
P254 38′48.00124 24′34.586620314022
P354 38′14.17124 20′05.58020253619
PGN454 04′58.90122 01′32.37300934041
N554 46′33.90121 29′14.6111301454048
N654 01′01.00122 24′54.570701544032
P454 04′05.90121 26′48.8843<5304026
P554 05′19.90122 01′31.8713<10304028
P654 04′01.10122 01′09.76890334023
Table 2. ANOVA and t-test results (mean (standard deviation)) between the percent carbon (% C) of natural (N1, N2, N3) and planted (P1, P2, P3) stands and the regionally averaged natural (N) and planted (P) % C from stands in the John Prince Research Forest with Bonferroni (*) post hoc. Different letters indicate significant differences among the groups (p < 0.05).
Stand LevelRegional Level
% C (SD) * % C (SD) * % C (SD)
N145.34 a (0.87)P142.21 a (0.45)N42.23 a (0.24)
N242.38 b (0.22)P244.11 b (0.62)P41.89 a (0.73)
N342.06 b (0.59)P341.57 a (0.96)
Table 3. Pearson’s correlation coefficient between the current and previous (italics) average monthly and seasonal temperature (°C) (white) and precipitation (mm) (grey shading) and percent carbon for natural (N) and planted (P) stands surrounding the John Prince Research Forest (FSJ; N1–N3, P1–P3) and Prince George (PG; N4–N6, P4–P6) ** p = 0.01; * = 0.05 level. Blank cells indicate no significant relationships.
FSJPG
P1P2P3N1truncN2N2truncN3P4P5P6N5N6
Jan------−0.70 *---0.66 *-
Mar------−0.64 *-----
Apr------−0.74 *-----
Jul-------−0.82 *-−0.87 *0.64 **-
Jul-----−0.82 *−0.75 **--−0.82 *0.76 **-
Aug------−0.66 *-----
Aug-----−0.78 *----0.64 **-
Sept-------−0.87 *----
Sept0.98 **-0.86 **---------
Nov-----0.77 *------
Dec------------
Spring------−0.8 *- ---
Summer------−0.68 *-----
Winter------−0.75 **-----
Feb--0.84 *---------
Mar---−0.85 *--------
May-0.77 *----------
Jun-----------0.79 *
Sept----0.58 **0.87 **------
Nov-------−0.78 *----
Spring--------−0.86 *---
Winter--0.97 **0.9 **--------
Table 4. R2 values from the regression analysis of percent carbon on total monthly precipitation (mm) (Precip) and average monthly temperature (°C) (Temp) for the natural stands surrounding John Prince Research Forest (N2–N3) and Prince George (N4–N6) ** p = 0.01; * = 0.05 level. Correlation coefficients (Pearson’s R) and p-values between measured (Xmea) and modelled (Xmod) percent carbon.
MonthSiteCarbon (R2)Pearson’s R (Xmea v Xmod) p-Value
Jan tempN30.485 **0.6960.017
Jan tempN50.432 **0.6570.006
Mar precipN1trunc0.718 **0.8480.016
Jul tempN2trunc0.669 *0.8180.025
Jul tempN30.555 **0.7450.009
Aug tempN50.574 **0.7580.001
Previous Aug tempN30.439 *0.6630.026
Spring tempN30.639 **0.8000.003

