Article

Impact of Stand Density and Tree Social Status on Aboveground Biomass Allocation of Scots Pine Pinus sylvestris L.

1
Faculty of Forestry, University of Agriculture in Kraków, Al. 29 Listopada 46, 31-425 Kraków, Poland
2
Faculty of Forestry, Poznań University of Life Sciences, Wojska Polskiego 28, 60-637 Poznań, Poland
3
Department of Wood Investigation and Application, Łukasiewicz Research Network—Wood Technology Institute, Winiarska 1, 60-654 Poznań, Poland
*
Author to whom correspondence should be addressed.
Forests 2020, 11(7), 765; https://doi.org/10.3390/f11070765
Submission received: 14 June 2020 / Revised: 9 July 2020 / Accepted: 15 July 2020 / Published: 17 July 2020
(This article belongs to the Special Issue Forest Stand Management and Biomass Growth)

Abstract

:
Stand density changes due to aging and thinning interventions. At the same time, the social status of trees develops and varies due to different genetic conditions as well as access to nutrients and light. Trees growing in diverse conditions gain their social status in the stand, which, in the end, influences their development and biomass allocation. The objective of this research was to discover if stand density or tree social status has an impact on a tree’s aboveground biomass allocation. The study was carried out in five premature and five mature pine stands, growing in the same soil conditions. The selected sample stands had a different growing density, from low to high. In each sample stand, 10 trees were selected to represent a different social status, according to the Schädelin classification. There were 100 trees felled in total (50 in the premature stands and 50 in the mature stands), for which the dry biomass of the stem, living and dead branches, needles, and cones was determined. The results showed that stand density only had an impact on the branches’ biomass fraction but not the stem and foliage fractions, while social status had an impact on all the fractions. Dominant and codominant trees, as well as those with developed crowns, had a smaller share of the stem and higher share of branches in comparison with trees of a lower social status.

1. Introduction

Each tree organ plays an important role in a tree’s physiological and vital processes. Since the different parts of the tree vary substantially in terms of their biomass, water, and element content, each tree part is very important not only in terms of its usefulness as potential merchandise, but it is also a key factor in the assessment of whole stand productivity and carbon balance [1,2,3].
The relative amount of biomass accumulated in different plant organs is defined as biomass allocation [4] or biomass distribution [5,6]. The specific arrangement of biomass within a tree is known as the allocation pattern [4]. The biomass allocation describes the tree or stand’s current state in terms of the share of dry biomass in the different tree parts, which occur as a result of physiological processes associated with net primary production, carbohydrate flux, and the partitioning of growth in different organs over time [7]. One of the most accepted concepts used to explain biomass allocation is known as the functional equilibrium. It assumes that plants maximize the growth (biomass allocation) of these organs, which contribute the most to gathering limited environmental resources [8,9]. In accordance with this theory, plants invest relatively more in their roots when the limiting factor is a shortage of nutrients and water, while they invest more in aboveground parts, especially in foliage, when the limiting growth factor is light and CO2. Simultaneously, in the case of trees, an increase in stem share and decrease in foliage and fine roots can be observed as a consequence of the natural aging process and the different loss rates of these trees’ parts [7]. Biomass allocation can be treated as the plant’s response to different growth drivers; therefore, discovering this phenomenon is crucial for an understanding of the growth process and dynamics of biomass allocation in different environmental conditions. It also enables the development of advanced process-based models, providing the precise prediction of plant reactions to dynamic changes in environmental conditions, such as the currently observed climate change [10,11,12,13].
Trees are biological structures, which show high adaptability to external conditions, both biotic and abiotic [14,15,16,17]. In accordance with functional equilibrium theory, the biomass allocation pattern is mostly derived from access to vital resources, which can be limited by interactions between trees, mainly by competition, manifested in the differentiation of the stand structure. Competition for light is especially important for light-demanding species, such as Scots pine (Pinus sylvestris L.), which usually form even age stands, according to the common silvicultural approach. In stands composed of light-demanding species, the competition is mainly one-sided, i.e., large trees suppress smaller ones, while small trees compete very little with larger ones [18]. Hence, individuals occupying different social positions have a highly diversified growth space and, consequently, limited access to light, water, and nutrients. The growth space of trees has been studied and defined in different ways [19,20] but is usually linked with crown characteristics, such as length, width, or form [21,22]. In addition, tree social status can be developed by allelopathy, which is a type of interaction between plants where the inhibitory effect on growth and germination can play an important role during the struggle for existence in interspecific competition. The species (or clone of one species) with a higher allelopathic potential might win the competition and place themselves in a better social position for growth [23].
Competition and stand structure differentiation change with age and rely also on stand density. The latter, as well as biomass production, can be regulated, to some extent, according to the silvicultural treatments applied, such as thinning operations of differing intensity and frequency. Thinning reduces the density, improves the resource availability for the remaining trees, and increases their growth [24,25,26]. Some long-term experiments have shown that the higher the intensity of the thinning, the lower the stand growth, hence more intense growth has been noted in unthinned stands [27,28,29]. Intensive thinning usually leads to smaller volume increments [30,31,32,33], whereas low thinning intensity results in a weak or no effect [33,34]. Some studies have shown that thinning has no influence on either stand growth [25,35] or biomass production [36]. In contrast, detailed studies devoted to the wood quality of single trees have shown that the timber from stands of low density has up to 12% higher value in comparison to the timber from stands of high density [37]. This was studied previously by Eriksson [38], who showed that a dense, unthinned regime for Scots pine was preferable if the objective was to maximize the standing biomass and carbon pool. This was also confirmed by Węgiel et al. [39], who reported that lower stand densities were more beneficial for sawmill wood production, while higher densities might be more beneficial for pulpwood and energy wood, total biomass production, and carbon sequestration.
Identifying the drivers influencing tree biomass allocation is essential for an understanding of the carbon cycle and carbon accumulation in the forest [5]. Such knowledge can also be very helpful in ascertaining the allometry of single trees and the modeling of individual tree biomass [40] and in assessing the technical properties and quality of wood [41,42]. Taking into account the impact of stand density, there exist different strategies of forest management, which are strictly connected to assumed economic goals, resulting in the shaping of different levels of within-stand competition and different biomass allocation patterns. Understanding the allocation pattern is especially important in premature stands, where silvicultural treatment can influence stand structure and density and, therefore, also differentiate stand biomass distribution.
Generally, two approaches for the investigation of biomass allocation exist: the application of biomass ratios or mass fractions, where the mass of the various organs is expressed relative to the total mass of the plant, while the second is based on elaborating so-called allometric equations, i.e., the relationship between the absolute size of one organ as a function of the size of another [43]. In Europe, where pine is a common species in forests, the impact of intraspecific competition and stand density on biomass allocation was studied by Nilsson and Albrektson [44], who discovered that in the case of trees under the stress of strong competition, the allocation of carbon to the stem wood had a higher priority than to the needles. Furthermore, Mäkinen [45] confirmed that competition clearly affected allometric relations and biomass allocation to the stem, branches, and needles. Studies of growth partitioning have also shown that suppressed trees have allocated more growth to stem wood than dominant trees [46]. Vanninen [47] indicated that competition was a significant additional explanatory variable when the stem, branch, and needle growth was estimated according to needle mass. The impact of tree social status on biomass allocation was the aim of the study by Ochał et al. [48]. The researchers showed that with a decrease in a tree’s social status, the stem fraction increased while the branches fraction decreased. On the other hand, the social status did not affect the needles fraction. Most of the above-mentioned studies were performed in young stands with a relatively small number of sample trees, and they concentrated on biomass allometric relations but did not explore the differences between the mass fractions of the different tree parts. All these studies clearly indicated that the position in the stand influenced the total biomass accumulated in different parts of the tree. However, the relationship between tree position in the stand and the fraction of the specific biomass tree part is still a topic to be explored, especially in premature and mature stands.
The social status may be a key factor in the process of differentiating the accumulation of biomass by different parts of the tree. Therefore, it was hypothesized that the mass fraction of different tree parts is related to a tree’s crown position and crown form, as a result of competition for environmental resources. Since this relation can be additionally modified by stand age and density, it was expected that this relationship would be evident in premature stands, especially those of high density, while it would be less obvious in low-density mature stands. Taking into account the above-mentioned indications, the objective of this research was to find out: (1) if stand density and tree social status have an impact on the distribution of tree biomass fractions, mainly stem and branches, and (2) if this impact is more evident in younger stands.

2. Materials and Methods
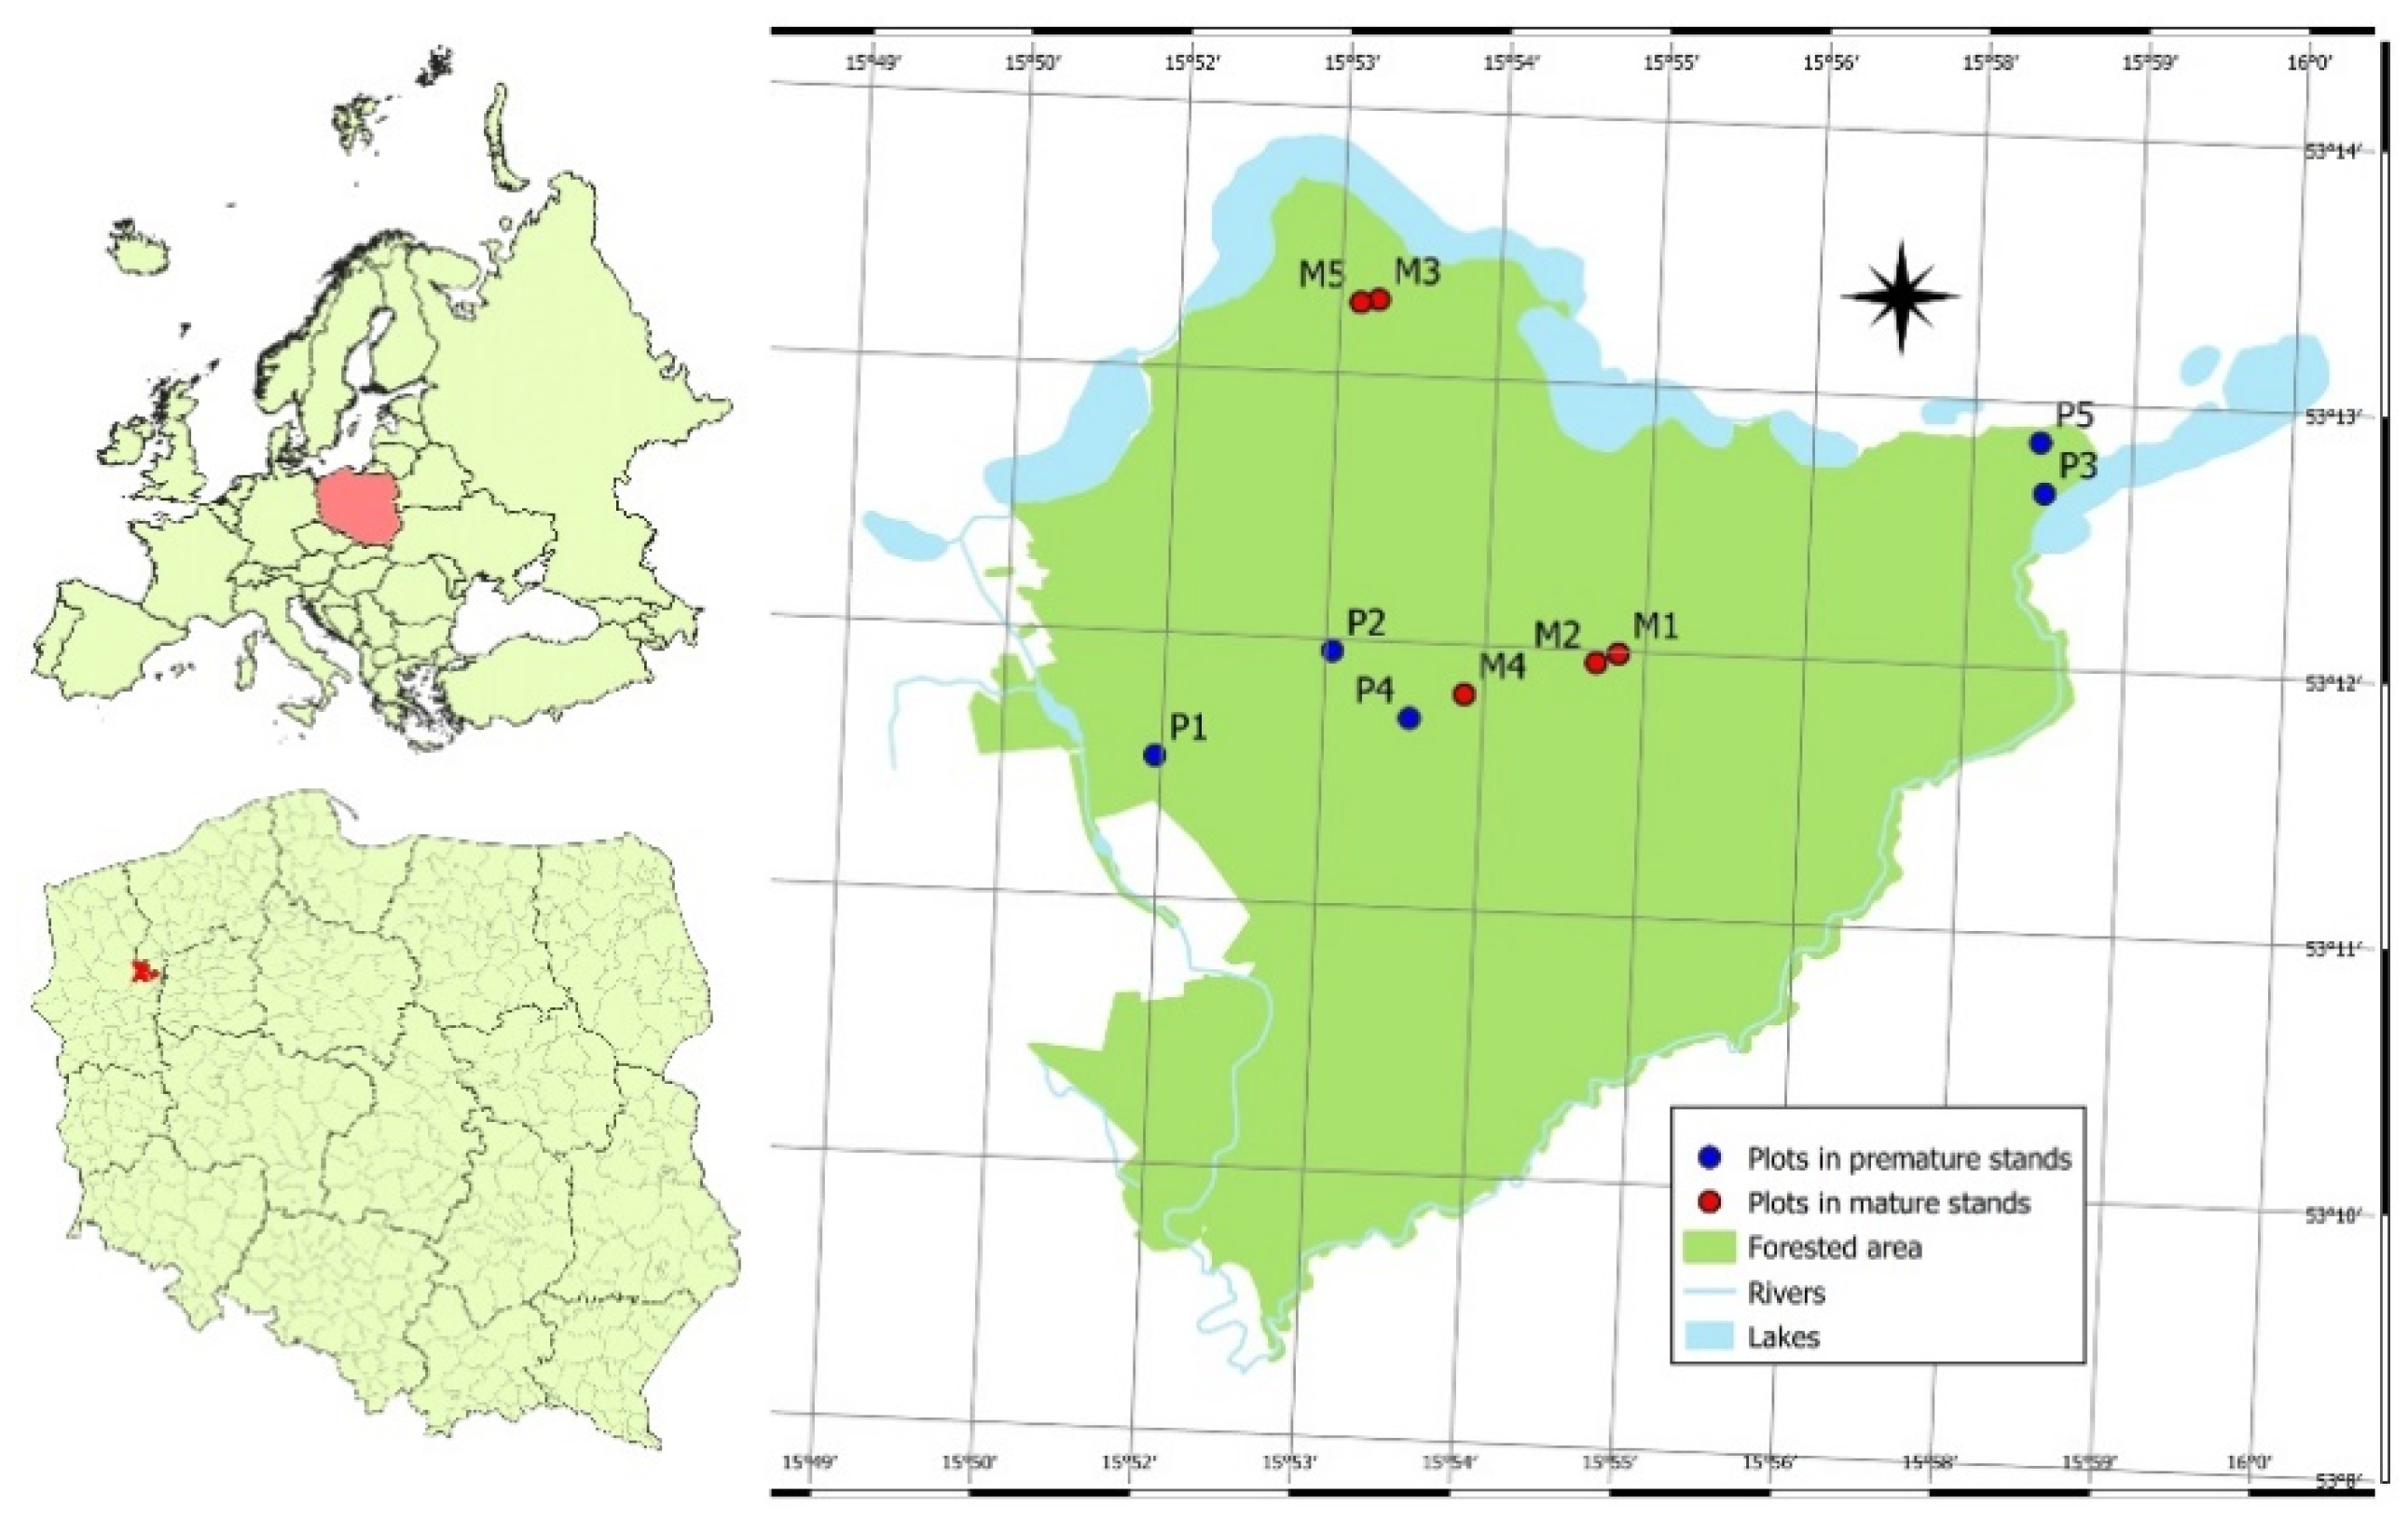
2.1. Study Area

The study was carried out on 100 trees selected from 10 stands of Scots pine (Pinus sylvestris L.), located in northwestern Poland (15°50′–16°00′ E, 53°10′–53°13′ N). This area has nutrient-poor habitats on podzolic soils, where the dominant tree species is Scots pine. It mostly forms uniform stands with a small mixture of other tree species, usually birch (Betula pendula Roth).
It was assumed that the stands had been established in a similar way (the same initial spacing) and similarly managed (the same owner and manager). Since 1945, the stands have been managed by the State Forests National Forest Holding. Standard management practice in these stands has been to perform thinning once per decade, and the selected stands had not been thinned in the previous five years.
The sample plots were located close to each other and on the same habitats in order to maintain similar tree growth conditions (Figure 1). The average annual rainfall in this area is 589 mm, the average temperature is 7 °C, and the growing season lasts on average 220 days [49].

2.2. Selection of Sample Trees

Five premature (51–60 years) and five mature (81–90 years) pure Scots pine stands were selected. The differentiating factor was the stand density, expressed firstly as the number of trees in a given area, and secondly as the stand density index, according to Reineke [50], ranging from 649 to 878 trees per hectare for the premature stands, and from 589 to 732 for the mature ones (Table 1). All the stands were characterized by the following shared attributes: single-layer, single-species, even-aged, flat terrain (without hills or pits), same soil type (Carbic Podzol), not damaged or deformed, without any gaps or undergrowth, and with forest floor plants typical of this habitat type (not grass-covered). In the selected stands, rectangular sample plots were established (one plot per stand)—0.3 hectare in the premature stands and 0.5 hectare in the mature stands (a minimum number of 200 trees per plot was assumed).
In order to select the sample trees, all diameters at breast height (DBH) were measured on each sample plot, and the height was also measured for 20% of the trees. Based on this data, Näslund’s height curves were developed to establish the height of each tree for each plot separately [51]. The tree measurements and sample collections were performed from July to September 2012.
All the trees in each sample plot were grouped into 10 classes of equal size based on their DBH. In each diameter class, one sample tree was selected at random. In this way, 10 trees were selected on each plot, representing the range of diameter. In total, 100 sample trees were selected.

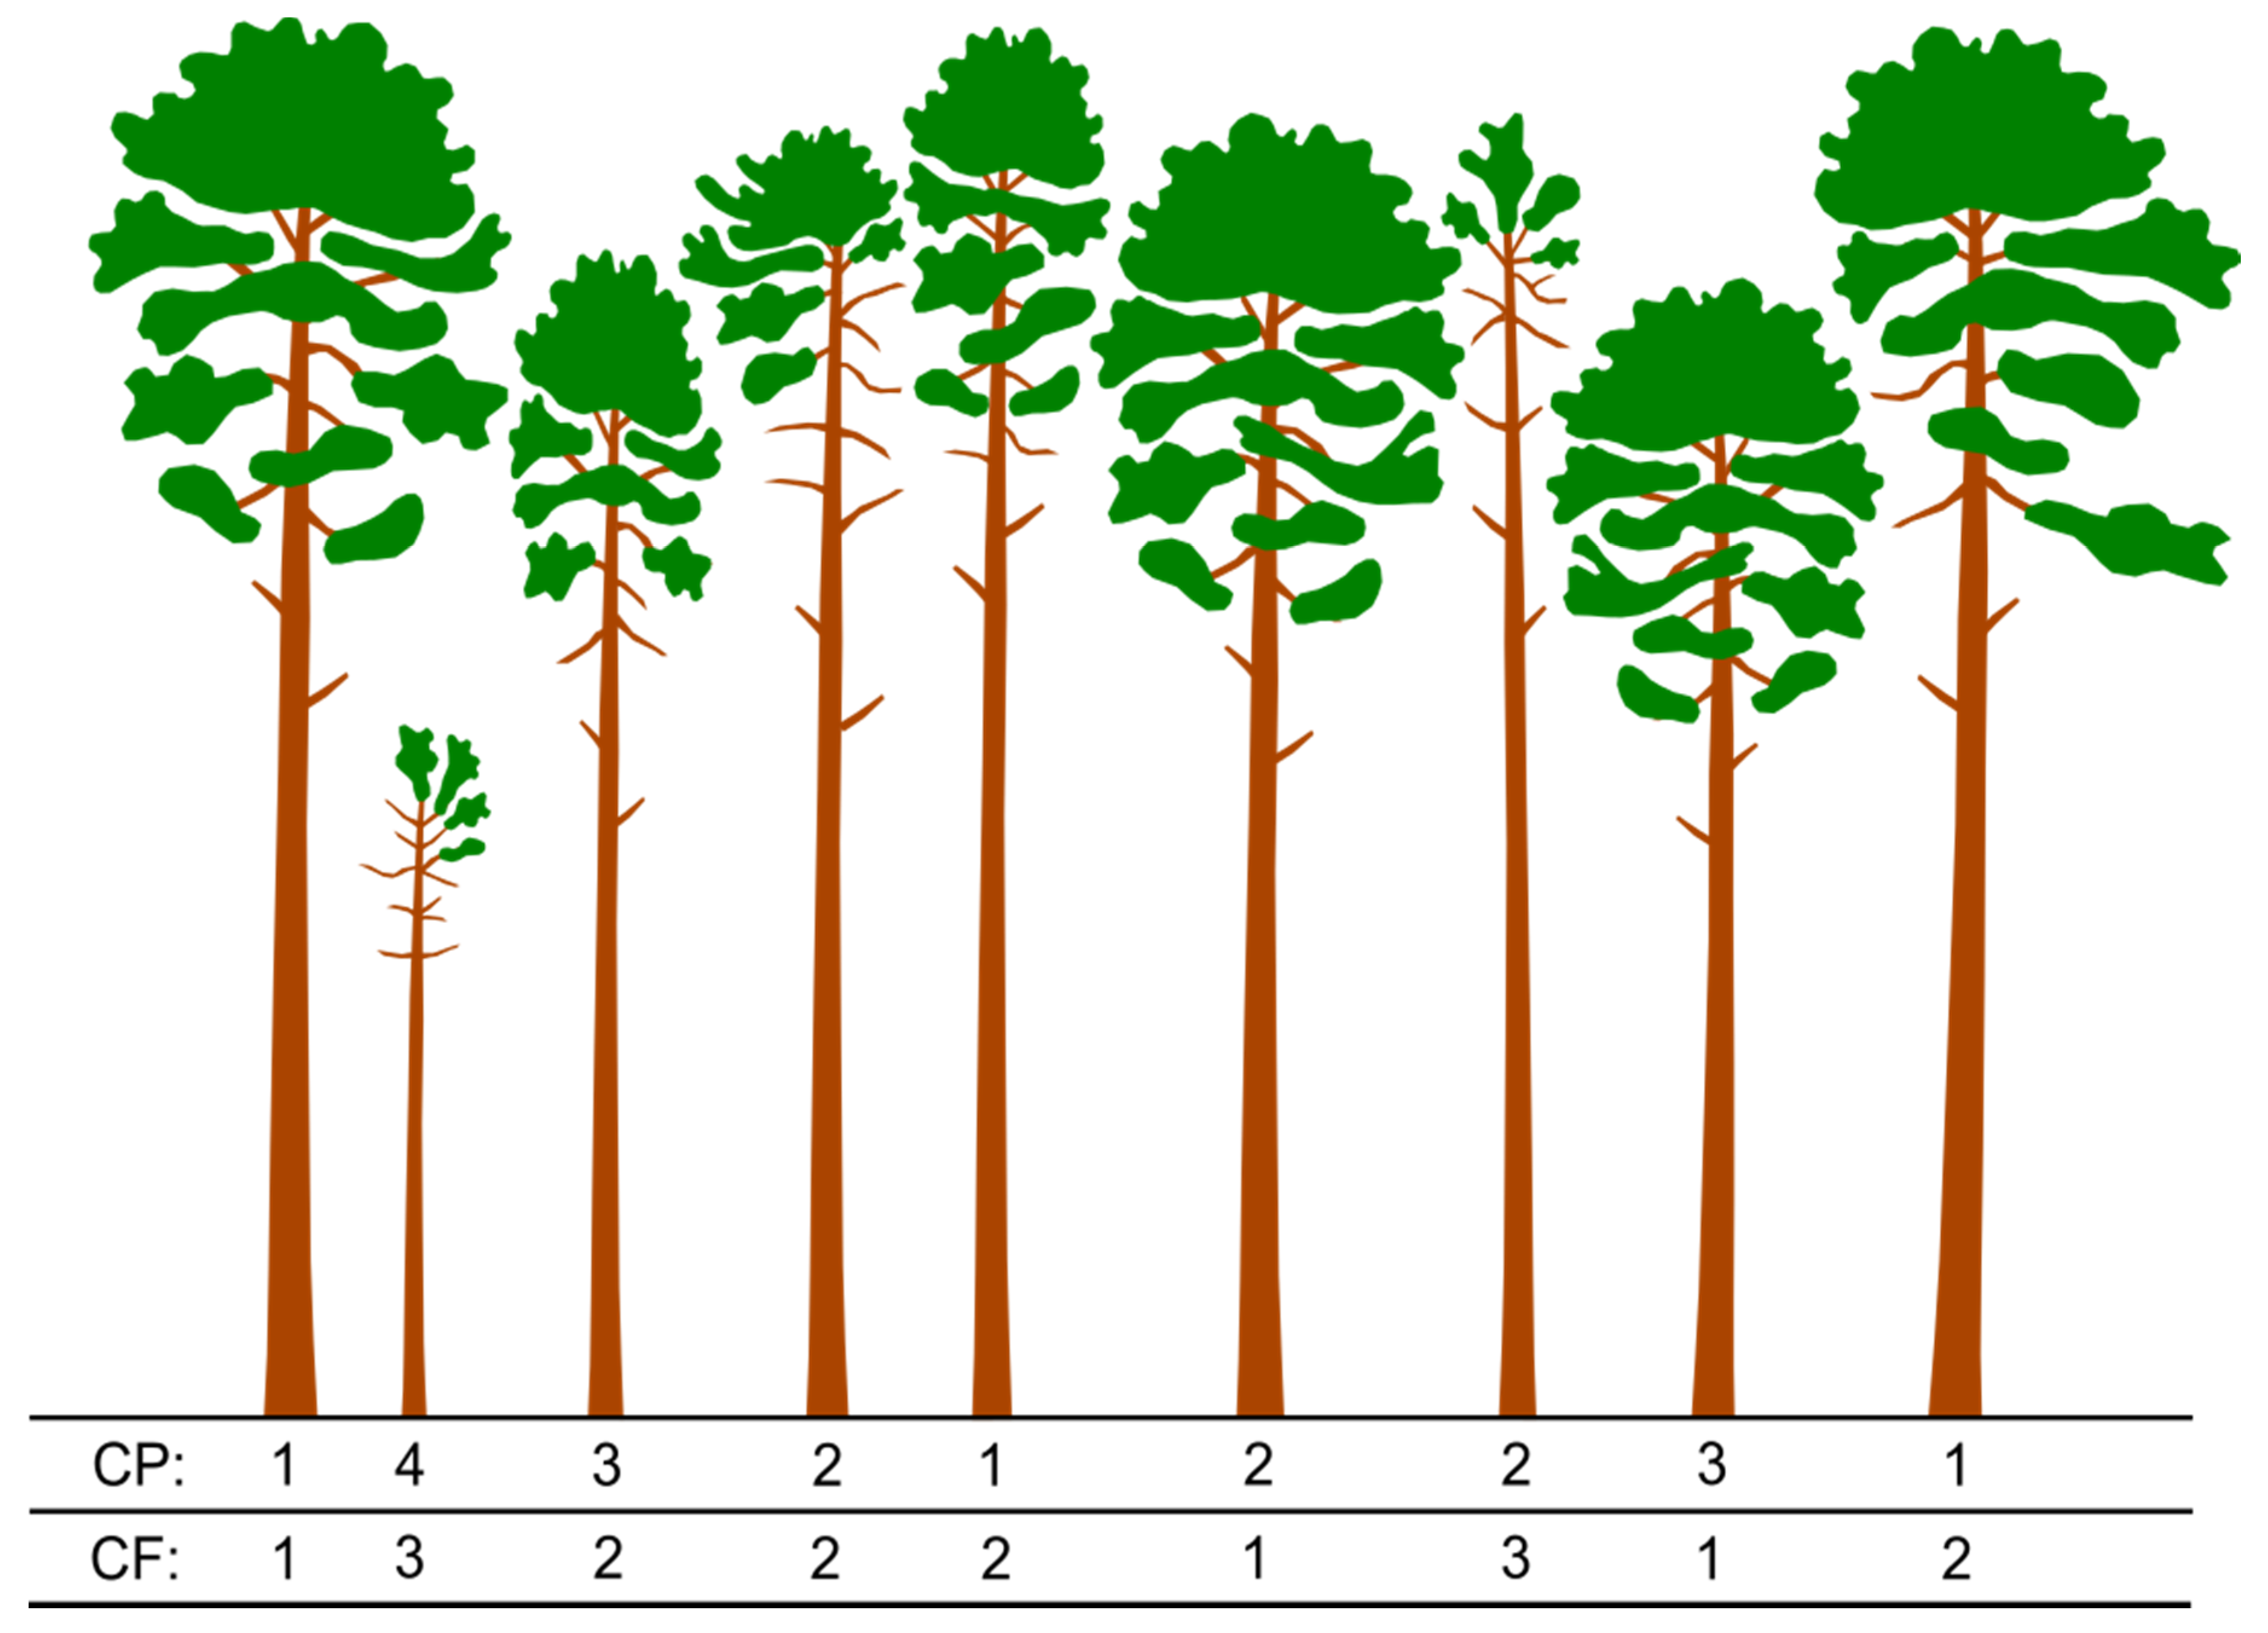
2.3. Tree Classification

The social status of the sample trees was determined based on two attributes: crown position and crown form, according to the Schädelin classification [52]. The crown position (CP) consists of 4 classes: (1) dominant, (2) co-dominant, (3) intermediate, and (4) overtopped, while crown form (CF) consists of 3 classes: (1) developed, (2) crowded, and (3) dying (Figure 2). The Schädelin classification system consists of three features. The third feature—trunk quality—was not considered in this study as it was assumed that stem quality has no impact on biomass accumulation.
The general characteristics of the sample trees, depending on the stand development phase and tree social status, showed that the differences were more evident in premature stands (Table 2). Trees with overtopped CP and with dying CF were not included in further analyses due to their single occurrence.

2.4. Biomass Assessment

The sample trees were felled and divided into the following compartments (trees’ parts): stem (wood with bark), living branches, dead branches, foliage (needles), and cones. The fresh weight of each compartment was weighed directly in the field, and a representative sample of each tree part was collected. These samples were weighed fresh, dried to a constant mass at 65 °C, and weighed again. Using the sample’s proportion of dry and fresh mass, the dry mass of each part of each sample tree was estimated.
The biomass allocation approach described by Poorter and Nagel [43], who introduced a calculation of the mass fractions of the living tree parts, was followed. The use of fractions avoids some of the complications related to ratios, and the component values always add up to 1.0 or 100, thereby providing an easy-to-understand scaling. On the basis of the dry mass of each part of the tree, the total biomass was calculated. Consequently, by dividing the mass of each specific part of the tree by the total biomass, the stem mass fraction (SMF), branches mass fraction (BMF), and foliage mass fraction (FMF) were calculated. It was decided that the fractions of the dead branches and cones would not be analyzed because both had a marginal share and very high variability. Moreover, dead branches cannot be considered as a functional tree organ, while cones are very dependent on the season of the year, flowering intensity, and the occurrence of mast years.

2.5. Statistical Analysis
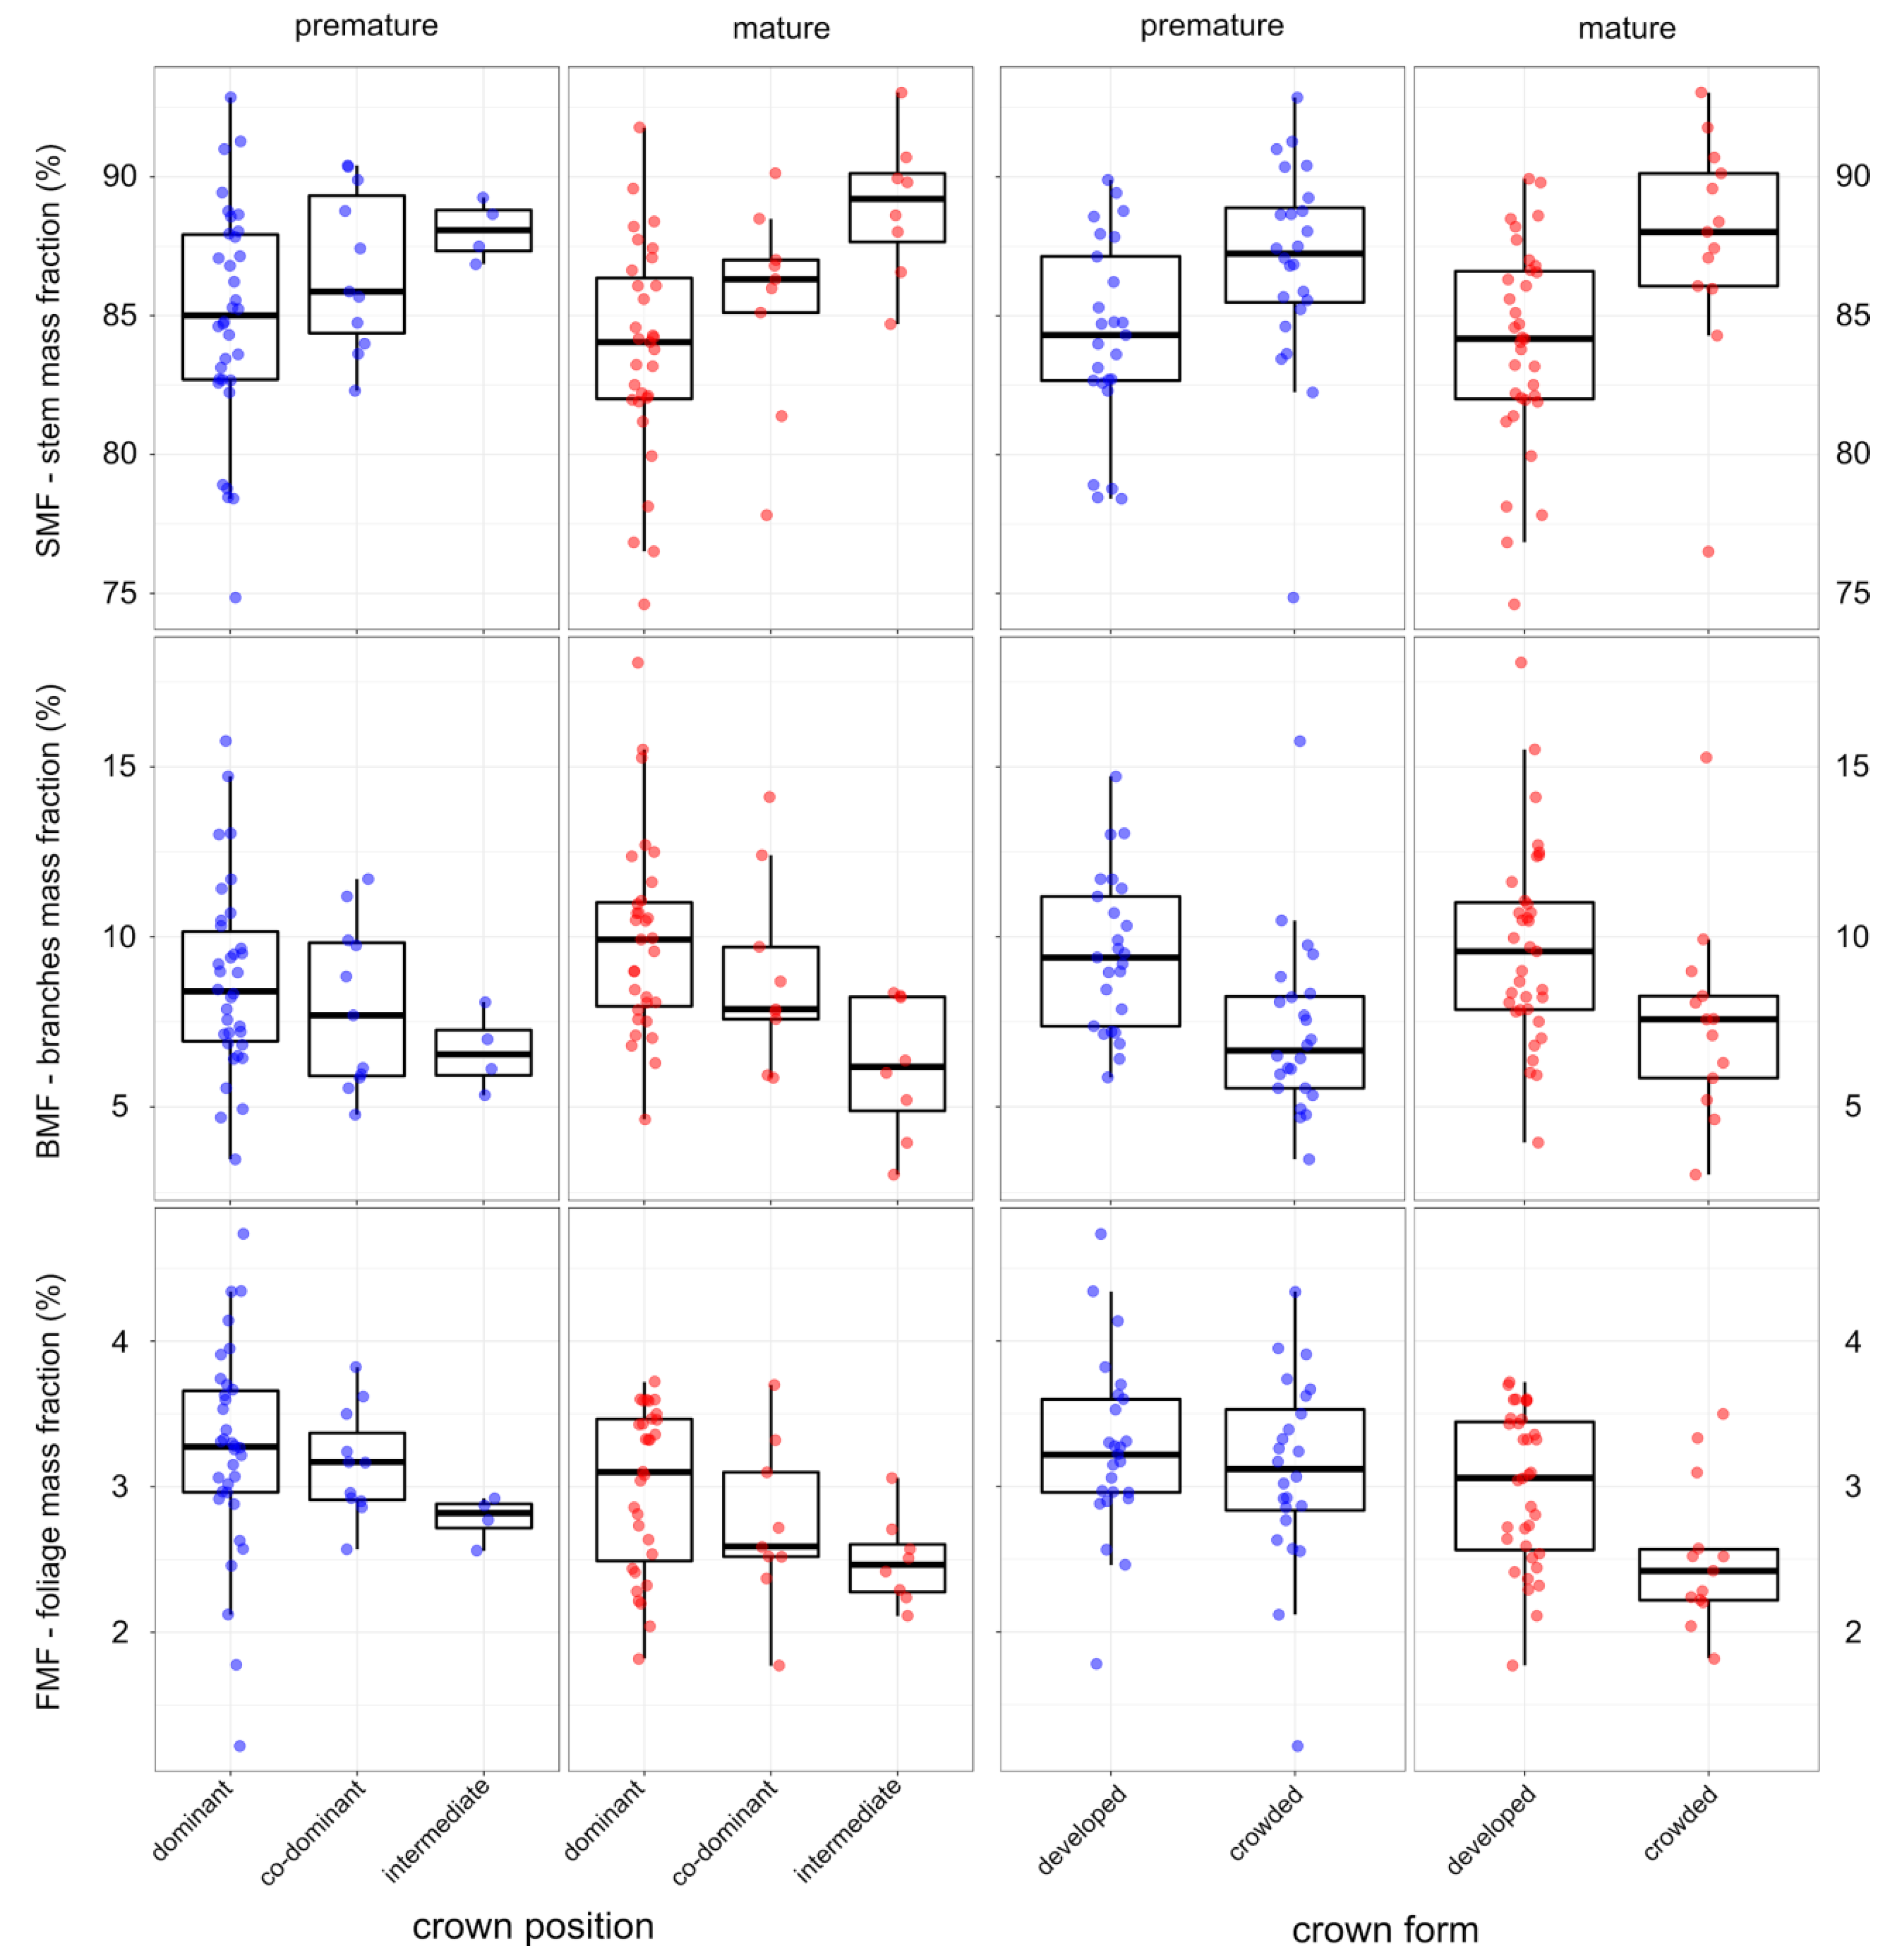
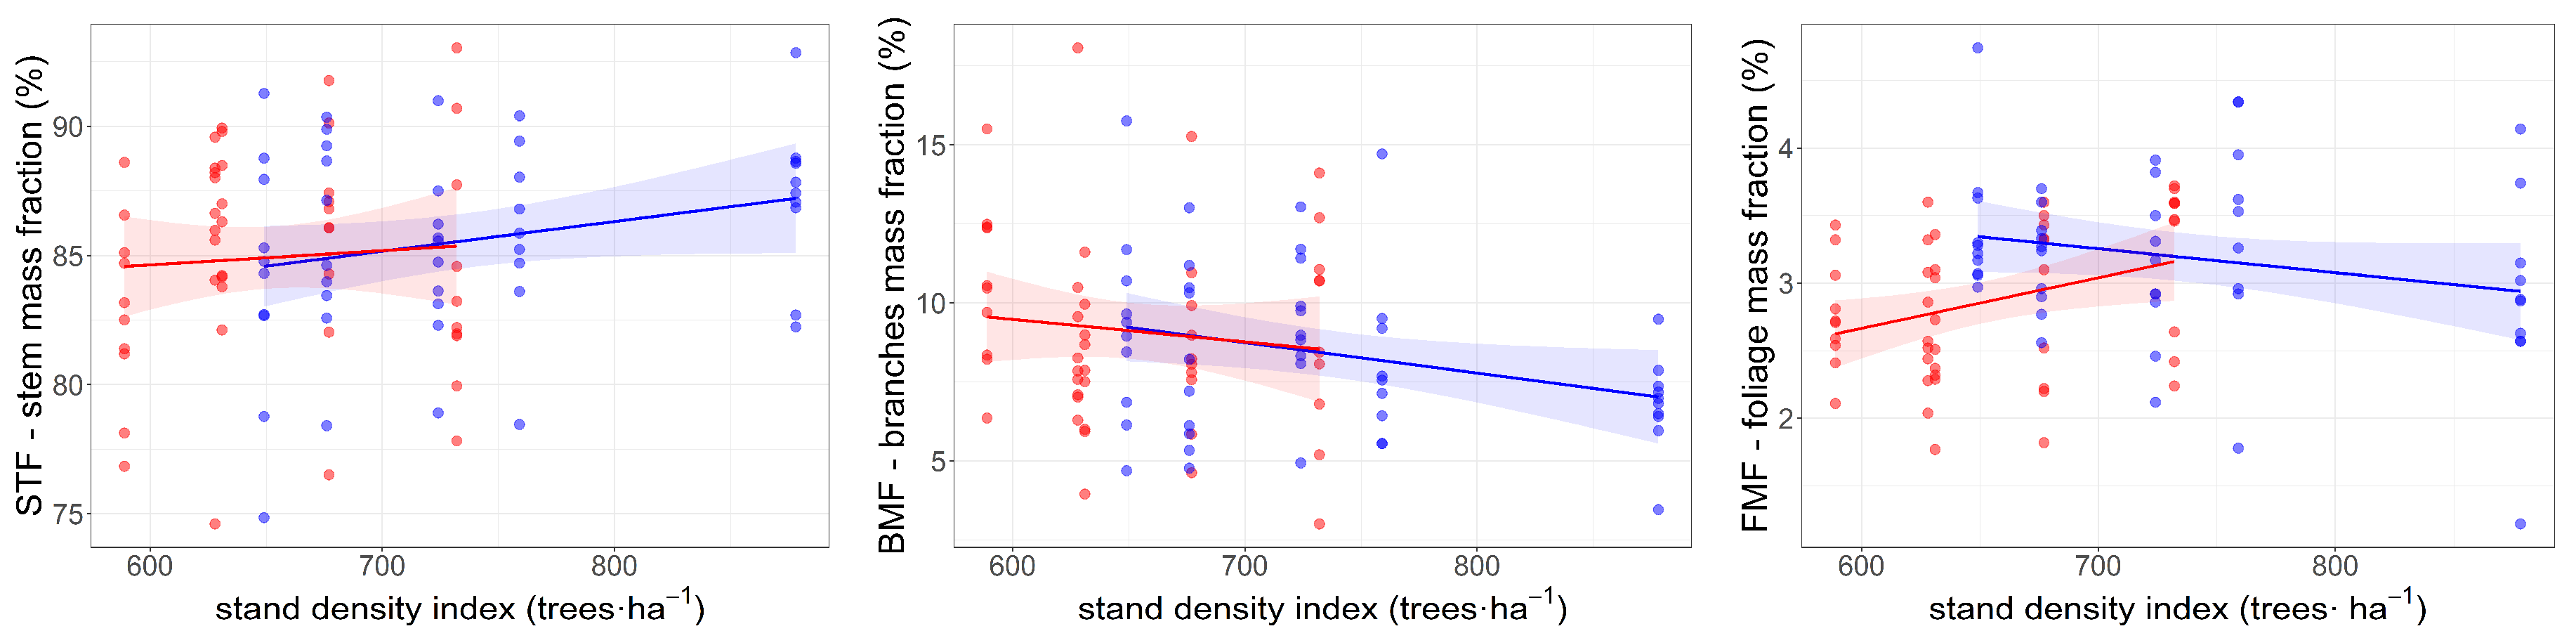
For testing the possible relationship between the specific mass fraction (SMF, BMF, or FMF) and the tree’s social status with regard to the development stage and stand density, the linear mixed model approach was selected. It made it possible to take into account the nested design of the study (trees within plots) and include different sources of variation and correlation of data. Each mass fraction was treated as a dependent variable, while the crown position, crown form, stand density index, and the stand’s stage of development were treated as fixed factors, with the sample plot introduced as a random term. The study was not oriented towards the construction of a prediction model, as in many similar studies [53,54,55]. Instead, the goal was to understand the key factors that influence tree allometry, selected at the planning stage of the study.
All statistical analyses were performed in R environment [56] with the help of packages lme4 [57], giving access to the construction and evaluation of mixed models, package lmerTest [58], providing a way to calculate the p-values and helpful for assessing the statistical importance of the tested variables, and package sjPlot [59] for the visualization of the results obtained.
The full model tested for a fraction of each biomass tree part included:
y i j = β 0 + β 1 C P i j + β 2 C F i j + β 3 D S j + β 3 S D I j + u j + ε i j
where yij represents mass fraction (SMF, BMF, or FMF) of tree i in plot j, CPij indicates crown position class of tree i in plot j, CFij means crown form class of tree i in plot j, DSj describes development stage class of plot j, SDIj is the stand density index of plot j, β0-β4 are fixed-effects parameters, uj is a random effect connected with j plot, and εij is a random error of tree i in plot j.
The fixed effects significance was assessed on the basis of a t-test, while the significance of the random effects was determined by an ANOVA test, comparing the final model with a null model without the random term [60]. For all the final models, the assumptions of homoscedasticity of residuals, normality of random error distribution, as well as the absence of collinearity for the independent variables, were assessed. The presence of potential influencing observations was also investigated on the basis of Cook’s distance.

3. Results

Total dry aboveground tree biomass ranged from 24.9 to 463.9 kg with a mean of 169.0 ± 13.4 kg in the premature plots, while in the mature stands, it ranged from 69.0 to 545.5 kg with a mean of 249.7 ± 17.4 kg (Table 3). The coefficient of variation was slightly higher in the premature stands and reached 55.9%, while in the mature stands, it was equal to 49.4%.
The trees generally had different biomass according to the tree’s social status. For the premature stands, the trees with dominant crown position (CP) had approximately a 1.78 times greater total aboveground biomass than the trees with co-dominant CP, and 3.15 times greater than the trees with intermediate CP (Table 3). In the case of the mature stands, those ratios were substantially smaller and equaled 1.56 and 1.86, respectively. On the other hand, the trees with a developed crown form (CF) in the premature stands had total aboveground biomass, which was 1.60 times greater than those with the crowded CF. This ratio in the mature stands was equal to 1.96 (Table 3).
Among all the studied tree compartments, the stem mass fraction (SMF) had, as expected, the biggest total biomass with a mean share as high as 85.4 ± 0.6% in the premature stands, while in the mature stands, it was 84.8 ± 0.6%. In the case of the dominant, co-dominant, and intermediate CP in the premature stands, the SMF reached 84.7 ± 0.7%, 86.6 ± 0.9%, and 88.1 ± 0.5%, respectively, whereas in the mature stands, it was as high as 83.6 ± 0.7%, 85.4 ± 1.2%, and 88.9 ± 0.9%, respectively. The trees with a developed CF generally had a lower SMF of the total aboveground biomass (84.3 ± 0.7% in the premature stands and 83.9 ± 0.6% in the mature stands) in comparison with the trees with a crowded CF, which reached 86.9 ± 0.8% in the premature stands and 87.6 ± 1.1% in the mature stands.
The branches mass fraction (BMF) contributed to the total aboveground biomass with a mean share as high as 8.6 ± 0.4% in the premature stands, while in the mature stands, it was 9.2 ± 0.4%. The BMF decreased with a lower CP from 9.0 ± 0.5% for the dominant CP, 7.9 ± 0.7% for the co-dominant, and 6.7 ± 0.6% for the intermediate CP in the premature stands, while it decreased from 10.0 ± 0.5% for the dominant CP, 8.9 ± 0.9% for the co-dominant to 6.2 ± 0.7% for the intermediate CP in the mature stands. As expected, the trees with a developed CF had a higher BMF, reaching 9.5 ± 0.5% in the premature stands and 9.7 ± 0.5% in the mature stands, while trees with a crowded CF had 7.2 ± 0.5% and 7.5 ± 0.8%, respectively.
In the case of the foliage mass fraction (FMF), the mean share was 3.22 ± 0.1% and 2.85 ± 0.1% in the premature and mature stands, respectively. Along with a deterioration in the relative crown position, the FMF was substantially lower, from 3.29 ± 0.1% for the dominant, 3.16 ± 0.1% for the co-dominant to 2.78 ± 0.1% for the intermediate CP in the premature stands. In the mature stands, the FMF was generally smaller and decreased from 2.99 ± 0.1% for the dominant, 2.73 ± 0.2% for the co-dominant to 2.49 ± 0.1% for the intermediate CP. In a similar way to the BMF, the FMF was higher for the trees with a developed CF where it reached 3.27 ± 0.1% and 2.99 ± 0.1% in the premature and mature stands, respectively, while for the crowded CF, it was 3.11 ± 0.1% for the premature and 2.51 ± 0.1% for the mature stands (Figure 3).
For each analyzed tree compartment, the intercept estimated the mean value of the mass fraction for the trees of the highest social status, i.e., the dominant CP and developed CF in the premature stands (Table 4). The values of the parameters expressed the mean changes in the compartment mass fraction for trees of a lower social status. For example, the mean SMF for the intermediate CP with a crowded CF in the mature stand was predicted to be 3.39% + 1.94% + 0.45% = 5.78% higher than the intercept. The values of σ2 expressed variation not explained by the model, while τ00 expressed variation explained by a random effect, connected with the nesting of the trees within the plots. ICC is the inter-correlation coefficient, Nplot describes the number of groups (plots), marginal-R2 is the part of variation explained only by fixed factors, and conditional-R2 is the part of variation explained by fixed and random factors—both expressed the overall goodness of fit of the model.
The tree’s social status had a significant impact on SMF (Table 4). Differences between the intermediate and dominant CP were found, while those between the dominant and co-dominant CP were not significant. The intermediate CP had, on average, a 3.39% higher SMF than the dominant CP. The obtained results also indicated that the CF had a slightly smaller impact on the SMF than the CP. On average, the crowded CF had a 1.94% higher SMF than the developed CF. Simultaneously, the impact of both stand density and the stand’s stage of development was not confirmed (Figure 4, Table 4). As with the SMF, the BMF depended on the CP, as well as on the CF, did not significantly depend on the stand’s stage of development but was significantly influenced by SDI. The intermediate CP had a 2.94% lower BMF than the dominant CP, and trees with a crowded CF had a 1.69% lower BMF than trees with a developed CF. In addition, a higher stand density index (SDI) contributed to a lower BMF. The FMF also differed between trees of different social status and did not depend on stand density. In contrast to other compartments, a statistically significantly lower FMF was found in the mature stands compared to the premature ones. The model indicated the non-significant effect of the random factor; therefore, there was no specific biomass allocation for a particular stand.

4. Discussion

Stand density management has been recognized as one of the tools offering forest managers an opportunity to optimize growth and yield [61], regulate tree size distributions [33], and improve the quality of forest products [62] and merchantable timber value [37]. Knowledge of the relationship between stand density and biomass allocation could have direct implications for forest management decision-making [35]. In some studies, stand density and tree social status have been identified as major drivers of growth allocation in even-aged stands of sessile oak Quercus petraea (Matt.) Liebl., while water stress has a detrimental effect on height in height-circumference growth allocation [15]. The impact of various environmental growth factors, as well as density, on biomass allocation was studied within the meta-analysis by Poorter et al. [63]. On the basis of a comprehensive number of experiments found in the literature, the authors found, with regards to the three main functional compartments for vegetative plants, that the average response to increasing plant density was a small decrease in the LMF (leaf mass fraction) and RMF (root mass fraction) and an increase in the SMF (stem mass fraction). The authors explained that these phenomena were connected to the near-unidirectional nature of light in a closed canopy, where the positioning of the leaves at the top of the canopy was of utmost importance for light interception; therefore, an increase in stem length was essential [63].
In contrast to the above, the results of this study did not confirm unambiguously the direct impact of stand density on the aboveground biomass distribution in trees. With an increase in the SDI, only a decrease in the BMF was noticed, while the SMF and the FMF did not change significantly. It can be assumed that the overall stand density is more general information than social status, the latter reflecting ‘local stand density’. In fact, locally, pine stands at the age of 50–80 years have unequal distribution of density in different parts of the stand. Even in a stand with a very high density, there still exist trees with high social status, expressing low pressure on neighboring trees, and thus ‘local density’ can be understood as low. In contrast, in stands with a low stand density, some trees are still subject to high competition; therefore, their social status remains low. Observations from the presented research showed that local density, expressed as tree social status, had a stronger impact on biomass allocation than the overall stand density.
The results obtained in the presented research indicated that stem mass fraction was smaller for pine trees representing a higher social status in comparison with suppressed trees. Consequently, intermediate and overtopped trees had a larger stem mass fraction. This confirmed the results of the previous studies performed by Bartelink [7,64] and Vanninen and Mäkelä [65], who indicated that suppressed trees had a more dry matter in the stem than average trees, and the share of crown biomass in the dry matter distribution was lower for suppressed individuals than for average trees. Moreover, Naidu et al. [66] carried out research on Pinus taeda L. and found that in suppressed trees, the stem share was greater and consisted of 75.9% of the total tree biomass in comparison with dominant trees, in which the stem consisted of 63.4% of the total biomass. Additionally, the suppressed trees were characterized by a higher share of heterotrophic components (roots, stem, and branches) in comparison with the autotrophic parts (needles).
According to functional equilibrium theory, suppressed trees should invest primarily in fractions of branches and foliage, which mostly contribute to gathering light. This theory is in line with the study by Kellomäki [67], who confirmed that the growth-share of all fractions was dependent on the within-stand light regime. In a 21-year-old pine stand, it was found that a suppressed tree position favored needle growth over the growth of the other trees’ parts. In unsuppressed conditions, branch growth increased substantially, while stem growth was greatest in moderate shade conditions [67]. The results of the present study seemed to be contrary to those findings because suppressed premature and mature pines allocated more biomass to the stem than the dominant trees. This phenomenon could be explained by the fact that smaller and shorter trees had less access to light. However, it could be assumed that their strategy was not to maximize crown development but first to try to achieve a crown position, which was as high as possible within the stand, relying therefore mostly on stem development. Moreover, it is worth remembering that it can be misleading to use the biomass share to infer either flux or partitioning in forests because trees accumulate biomass in both long- and short-lived tissues, and flux and partitioning are not proportional to retention [5].
Discovering that trees of a lower social status distribute more nutrients to the stem rather than the crown is basically fundamental, but it also has practical meaning and value. Based on this information, it can be stated that trees from a lower social status contribute well to carbon sequestration within the process of thinning, during which trees mainly from lower social positions are removed. The extracted timber (tree trunks) creates advantageous carbon mitigating conditions: proportionally, a maximal share of the tree timber is utilized and stores carbon, thereby following the policy of the well-balanced management of raw material resources [68]. In addition, branches left in the forest for decomposition enrich the soil, although they constitute proportionally smaller tree shares, releasing, respectively, smaller amounts of carbon.
Crown size, being closely related to the photosynthetic capacity of a tree, is an important parameter in studies of the growth of individual trees [19] and carbon sequestration [69,70]. In forestry and ecological modeling, crown size has been found to be a useful measure of tree vigor [71], allowing one to successfully predict tree growth [72,73] and mortality [74]. Crown dimensions have been used in ecological modeling to predict light interception of the canopy [75,76]. Average values of crown size (length, width, volume) are lower as the social tree position weakens. However, in a dominant stand, the layer values of these features increase along with tree age [77]. In the study by Ochał et al. [48], it was noted that for trees with the same stem biomass, those trees of a higher Kraft social position had much larger crown dimensions and higher crown biomass. Moreover, differences in the branches to foliage ratios within the crowns of trees of different social status were found. On the other hand, the biosocial position did not significantly affect the share of needles, dead branches, and cones [48]. In the study presented, it was found that social position had a significant impact on both the branches and foliage mass fractions. Furthermore, the foliage share seemed to be negatively related to age because a statistically significant difference between the stands of premature and mature development stage was found. Since only stands of two age classes were analyzed, this finding should be treated with caution, but on the other hand, it is supported by other studies, showing that the allocation of growth to stem and needle increases with tree age and size, while the allocation of growth to branches decreases [47,78].
Knowledge of the impact of stand density and social status on the amount and share of different tree compartments may be considered a silvicultural tool to help grow the forest in a way that a particular tree part will be developed on a larger scale. In the presented research, stand density did not have a direct impact on the biomass distribution of the trees’ parts. However, when tree social status was considered, it was found that the stems of dominant, well-developed trees had a smaller share of the whole tree biomass. The results proved that crown position and crown form influenced the allocation of the tree biomass in premature and mature pine stands.

5. Conclusions

The results obtained indicated that local density, having, in the end, an impact on tree social position, had a larger influence on biomass allocation than overall stand density. In fact, when social status was considered as a potential influencing factor, stand density had lower importance—in the presented research, statistically significant differences were only found for a fraction of branches. Along with the growth in tree social position, the stem share was smaller, although the shares taken by the branches and needles of the whole tree biomass were greater. However, these relationships were not more evident in the premature stands, where there is a bigger competition between trees. It was also confirmed that the stage of tree crown development (crown form) had a significant impact on the biomass quantity of the stem and branches. The results presented might have practical value and might be applied in silviculture when considering the type or intensity of thinning.

Author Contributions

Conceptualization, B.W., M.B., Z.K., W.O., M.S., P.S., A.W., and P.S.M.; Methods, B.W., W.O., P.S., A.W., and P.S.M.; Investigation, M.B., P.S., M.S., A.W., and P.S.M.; Formal Analysis, B.W.; Writing - Original Draft Preparation, B.W., Z.K., M.B., W.O., A.W., and P.S.M.; Writing—Review and Editing, B.W., M.B., Z.K., W.O., P.S., M.S., A.W., and P.S.M.; Visualization, B.W., P.S., and A.W. All authors have read and agreed to the published version of the manuscript.

Funding

This research was funded by the European Regional Development Fund and the Polish Ministry of Science and Higher Education (INT-09-0039). The publication is co-financed within the framework of the Ministry of Science and Higher Education program “Regional Initiative Excellence” in the years 2019–2022, project number 005/RID/2018/19, and statutory funds no. SUB/040015/D019 carried out in the Department of Forest Resources Management, Faculty of Forestry, University of Agriculture in Kraków.

Acknowledgments

The authors would like to thank the participants of the International Scientific Camps for Forestry Students, ForseenPOMERANIA, for their valuable contribution to the laborious field studies on research plots in Drawno Forest District (Pomerania Region, Poland).

Conflicts of Interest

The authors declare no conflict of interest. The financial supporters had no role in the design of the study, in the collection, analyses, or interpretation of data, in the writing of the manuscript, or in the decision to publish the results.

References

  1. Laiho, R.; Laine, J. Tree stand biomass and carbon content in an age sequence of drained pine mires in southern Finland. For. Ecol. Manag. 1997, 93, 161–169. [Google Scholar] [CrossRef]
  2. Tolunay, D. Carbon concentrations of tree components, forest floor and understorey in young Pinus sylvestris stands in north-western Turkey. Scand. J. For. Res. 2009, 24, 394–402. [Google Scholar] [CrossRef]
  3. Singh, V.; Tewari, A.; Kushwaha, S.P.S.; Dadhwal, V.K. Formulating allometric equations for estimating biomass and carbon stock in small diameter trees. For. Ecol. Manag. 2011, 261, 1945–1949. [Google Scholar] [CrossRef]
  4. Poorter, H.; Sack, L. Pitfalls and Possibilities in the Analysis of Biomass Allocation Patterns in Plants. Front. Plant Sci. 2012, 3. [Google Scholar] [CrossRef] [Green Version]
  5. Litton, C.; Raich, J.; Ryan, M. Carbon allocation in forest ecosystems. Glob. Chang. Biol. 2007, 13, 2089–2109. [Google Scholar] [CrossRef] [Green Version]
  6. Reich, P.A. Root–Shoot Relations: Optimality in Acclimation and Adaptation or the “Emperor’s New Clothes”? In Plant Roots, the Hidden Half, 3rd ed.; Waisel, Y., Eshel, A., Kafkafi, U., Eds.; Marcel Dekker Inc.: New York, NY, USA; Basel, Swterzland, 2002; pp. 205–220. [Google Scholar]
  7. Bartelink, H.H. A model of dry matter partitioning in trees. Tree Physiol. 1998, 18, 91–101. [Google Scholar] [CrossRef] [PubMed] [Green Version]
  8. Thornley, J.H.M. A Balanced Quantitative Model for Root: Shoot Ratios in Vegetative Plants. Ann. Bot. 1972, 36, 431–441. [Google Scholar] [CrossRef]
  9. Cannell, M.G.R.; Dewar, R.C. Carbon allocation in trees: A review of concepts for modelling. Adv. Ecol. Res. 1994, 59–104. [Google Scholar] [CrossRef]
  10. Mäkelä, A.; Landsberg, J.; Ek, A.R.; Burk, T.E.; Ter-Mikaelian, M.; Agren, G.I.; Oliver, C.D.; Puttonen, P. Process-based models for forest ecosystem management: Current state of the art and challenges for practical implementation. Tree Physiol. 2000, 20, 289–298. [Google Scholar] [CrossRef]
  11. Bontemps, J.-D.; Bouriaud, O. Predictive approaches to forest site productivity: Recent trends, challenges and future perspectives. For. An Int. J. For. Res. 2013, 87, 109–128. [Google Scholar] [CrossRef]
  12. Hember, R.A.; Kurz, W.A. Low tree-growth elasticity of forest biomass indicated by an individual-based model. Forests 2018, 9, 21. [Google Scholar] [CrossRef] [Green Version]
  13. Ruiz-Benito, P.; Vacchiano, G.; Lines, E.R.; Reyer, C.P.O.; Ratcliffe, S.; Morin, X.; Hartig, F.; Mäkelä, A.; Yousefpour, R.; Chaves, J.E.; et al. Available and missing data to model impact of climate change on European forests. Ecol. Model. 2020, 416, 108870. [Google Scholar] [CrossRef]
  14. Jelonek, T.; Tomczak, A.; Karaszewski, Z.; Jakubowski, M.; Arasimowicz-Jelonek, M.; Grzywiński, W.; Kopaczyk, J.; Klimek, K. The biomechanical formation of trees. Drewno 2019, 62, 5–22. [Google Scholar] [CrossRef]
  15. Trouvé, R.; Bontemps, J.-D.; Seynave, I.; Collet, C.; Lebourgeois, F. Stand density, tree social status and water stress influence allocation in height and diameter growth of Quercus petraea (Liebl.). Tree Physiol. 2015, 35, 1035–1046. [Google Scholar] [CrossRef] [PubMed] [Green Version]
  16. Grote, R.; Gessler, A.; Hommel, R.; Poschenrieder, W.; Priesack, E. Importance of tree height and social position for drought-related stress on tree growth and mortality. Trees 2016, 30, 1467–1482. [Google Scholar] [CrossRef]
  17. Tavankar, F.; Picchio, R.; Lo Monaco, A.; Nikooy, M.; Venanzi, R.; Bonyad, A.E. Wound healing rate in oriental beech trees following logging damage. Drewno 2019, 62, 5–22. [Google Scholar] [CrossRef]
  18. Perry, D.A. The competition process in forest stands. In Attributes of Trees As Crop Plants; Cannell, M.G.R., Jackson, J.E., Eds.; Institute of Terrestial Ecology: Abbots Ripton, Hunts, UK, 1985; pp. 481–506. [Google Scholar]
  19. Hemery, G.E.; Savill, P.S.; Pryor, S.N. Applications of the crown diameter–stem diameter relationship for different species of broadleaved trees. For. Ecol. Manag. 2005, 215, 285–294. [Google Scholar] [CrossRef]
  20. Lundqvist, L.; Elfving, B. Influence of biomechanics and growing space on tree growth in young Pinus sylvestris stands. For. Ecol. Manag. 2010, 260, 2143–2147. [Google Scholar] [CrossRef]
  21. Kaźmierczak, K. Selected measures of the growth space of a single tree in maturing pine stand. Sylwan 2009, 153, 298–303. [Google Scholar] [CrossRef]
  22. Turski, M.; Jaszczak, R.; Deus, R. Selected features of tree crowns and their relationship with the dbh and height in pine tree-stands of different age classes. Sylwan 2012, 156, 369–378. [Google Scholar] [CrossRef]
  23. Bielinis, E.; Kwiatkowski, J.; Boiko, S. Identification of Pinus sylvestris clones with the highest and lowest allelopathic potentials. Balt. For. 2019, 25, 52–58. [Google Scholar] [CrossRef]
  24. Kojola, S.; Ahtikoski, A.; Hökkä, H.; Penttilä, T. Profitability of alternative management regimes in Scots pine stands on drained peatlands. Eur. J. For. Res. 2012, 131, 413–426. [Google Scholar] [CrossRef]
  25. Giuggiola, A.; Bugmann, H.; Zingg, A.; Dobbertin, M.; Rigling, A. Reduction of stand density increases drought resistance in xeric Scots pine forests. For. Ecol. Manag. 2013, 310, 827–835. [Google Scholar] [CrossRef]
  26. Tahvonen, O.; Pihlainen, S.; Niinimäki, S. On the economics of optimal timber production in boreal Scots pine stands. Can. J. For. Res. 2013, 43, 719–730. [Google Scholar] [CrossRef]
  27. Curtis, R.O.; Marshall, D.D.; Bell, J.F. LOGS: A pioneering example of silvicultural research in coast Douglas-fir. J. For. 1997, 95, 19–25. [Google Scholar]
  28. Kuliešis, A.; Saladis, J.; Kuliešis, A.A. Development and productivity of young Scots pine stands by regulating density. Balt. For. 2010, 16, 235–246. [Google Scholar]
  29. Nilsson, U.; Agestam, E.; Ekö, P.-M.; Elfving, B.; Fahlvik, N.; Johansson, U.; Karlsson, K.; Lundmark, T.; Wallentin, C. Thinning of Scots pine and Norway spruce monocultures in Sweden. Studia For. Suec. 2010, 219, 1–46. [Google Scholar]
  30. Valinger, E.; Elfving, B.; Mörling, T. Twelve-year growth response of Scots pine to thinning and nitrogen fertilisation. For. Ecol. Manag. 2000, 134, 45–53. [Google Scholar] [CrossRef]
  31. Mäkinen, H.; Isomäki, A. Thinning intensity and long-term changes in increment and stem form of Scots pine trees. For. Ecol. Manag. 2004, 203, 21–34. [Google Scholar] [CrossRef]
  32. Mäkinen, H.; Hynynen, J.; Isomäki, A. Intensive management of Scots pine stands in southern Finland: First empirical results and simulated further development. For. Ecol. Manag. 2005, 215, 37–50. [Google Scholar] [CrossRef]
  33. Zhang, J.; Oliver, W.W.; Ritchie, M.W. Effect of stand densities on stand dynamics in white fir (Abies concolor) forests in northeast California, USA. For. Ecol. Manag. 2007, 244, 50–59. [Google Scholar] [CrossRef]
  34. Del Río, M.; Calama, R.; Cañellas, I.; Roig, S.; Montero, G. Thinning intensity and growth response in SW-European Scots pine stands. Ann. For. Sci. 2008, 65. [Google Scholar] [CrossRef] [Green Version]
  35. Gizachew, B.; Brunner, A. Density-growth relationships in thinned and unthinned Norway spruce and Scots pine stands in Norway. Scand. J. For. Res. 2011, 26, 543–554. [Google Scholar] [CrossRef]
  36. Routa, J.; Kellomäki, S.; Strandman, H. Effects of forest management on total biomass production and CO2 emissions from use of energy biomass of Norway spruce and Scots pine. Bioenergy Res. 2012, 5, 733–747. [Google Scholar] [CrossRef]
  37. Bembenek, M.; Karaszewski, Z.; Kondracki, K.; Łacka, A.; Mederski, P.S.; Skorupski, M.; Strzeliński, P.; Sułkowski, S.; Węgiel, A. Value of merchantable timber in Scots pine stands of different densities. Drewno 2014, 57, 133–142. [Google Scholar] [CrossRef]
  38. Eriksson, E. Thinning operations and their impact on biomass production in stands of Norway spruce and Scots pine. Biomass Bioenergy 2006, 30, 848–854. [Google Scholar] [CrossRef]
  39. Węgiel, A.; Bembenek, M.; Łacka, A.; Mederski, P.S. Relationship between stand density and value of timber assortments: A case study for Scots pine stands in north-western Poland. New Zealand J. For. Sci. 2018, 48, 1–9. [Google Scholar] [CrossRef]
  40. Lehtonen, A.; Mäkipää, R.; Heikkinen, J.; Sievänen, R.; Liski, J. Biomass expansion factors (BEFs) for Scots pine, Norway spruce and birch according to stand age for boreal forests. For. Ecol. Manag. 2004, 188, 211–224. [Google Scholar] [CrossRef]
  41. Jelonek, T.; Pazdrowski, W.; Tomczak, A.; Szaban, J. The effect of social position of tree in the stand and site on wood quality of Scots pine (Pinus sylvestris L.). Electron. J. Pol. Agric. Univ. 2008, 11, 10. [Google Scholar]
  42. Bajrakatri, A.; Pimenta, R.; Pinto, T.; Miranda, I.; Knapic, S.; Nunes, L.; Pereira, H. Stem quality of Quercus cerris trees from Kosovo for the sawmilling industry. Drewno 2018, 61, 57–69. [Google Scholar] [CrossRef]
  43. Poorter, H.; Nagel, O. The role of biomass allocation in the growth response of plants to different levels of light, CO2, nutrients and water: A quantitative review. Funct. Plant Biol. 2000, 27, 1191. [Google Scholar] [CrossRef] [Green Version]
  44. Nilsson, U.; Albrektson, A. Productivity of needles and allocation of growth in young Scots pine trees of different competitive status. For. Ecol. Manag. 1993, 62, 173–187. [Google Scholar] [CrossRef]
  45. Mäkinen, H. Effect of intertree competition on biomass production of Pinus sylvestris (L.) half-sib families. For. Ecol. Manag. 1996, 86, 105–112. [Google Scholar] [CrossRef]
  46. Vanninen, P.; Mäkelä, A. Needle and stem wood production in Scots pine (Pinus sylvestris) trees of different age, size and competitive status. Tree Physiol. 2000, 20, 527–533. [Google Scholar] [CrossRef] [PubMed] [Green Version]
  47. Vanninen, P. Allocation of above-ground growth in Pinus sylvestris–impacts of tree size and competition. Silva Fenn. 2004, 38. [Google Scholar] [CrossRef] [Green Version]
  48. Ochał, W.; Grabczyński, S.; Orzeł, S.; Wertz, B.; Socha, J. Aboveground biomass allocation in Scots pines of different biosocial positions in the stand. Sylwan 2013, 157, 737–746. [Google Scholar] [CrossRef]
  49. Ziemblińska, K.; Urbaniak, M.; Chojnicki, B.H.; Black, T.A.; Niu, S.; Olejnik, J. Net ecosystem productivity and its environmental controls in a mature Scots pine stand in north-western Poland. Agric. For. Meteorol. 2016, 228–229, 60–72. [Google Scholar] [CrossRef]
  50. Reineke, L.H. Perfecting a stand-density index for even-aged forests. J. Agric. Res. Wash. 1933, 46, 627–638. [Google Scholar]
  51. Siipilehto, J. A comparison of two parameter prediction methods for stand structure in Finland. Silva Fenn. 2000, 34, 331–349. [Google Scholar] [CrossRef] [Green Version]
  52. Schädelin, W. Die Durchforstung als Auslese- und Veredelungsbetrieb Höchster Wertleistung; Verlag Paul Haupt, Bern-Leipzig: Bern, Switzerland, 1936. [Google Scholar]
  53. Raptis, D.; Kazana, V.; Kazaklis, A.; Stamatiou, C. A crown width-diameter model for natural even-aged black pine forest management. Forests 2018, 9, 610. [Google Scholar] [CrossRef] [Green Version]
  54. Sharma, R.P.; Bílek, L.; Vacek, Z.; Vacek, S. Modelling crown width–diameter relationship for Scots pine in the central Europe. Trees 2017, 31, 1875–1889. [Google Scholar] [CrossRef]
  55. Sharma, R.P.; Vacek, Z.; Vacek, S. Individual tree crown width models for Norway spruce and European beech in Czech Republic. For. Ecol. Manag. 2016, 366, 208–220. [Google Scholar] [CrossRef]
  56. Team, R.C. R: A Language and Environment for Statistical Computing. R Foundation for Statistical Computing. Available online: https://www.R-project.org/ (accessed on 5 June 2020).
  57. Bates, D.; Mächler, M.; Bolker, B.; Walker, S. Fitting linear mixed-effects models using lme4. J. Stat. Softw. 2015, 67, 48. [Google Scholar] [CrossRef]
  58. Kuznetsova, A.; Brockhoff, P.B.; Christensen, R.H.B. lmerTest Package: Tests in Linear Mixed Effects Models. J. Stat. Softw. 2017, 82, 1–26. [Google Scholar] [CrossRef] [Green Version]
  59. Lüdecke, D. sjPlot: Data Visualization for Statistics in Social Science. R Package Version 2.8.4. Available online: https://CRAN.R-project.org/package=sjPlot (accessed on 5 June 2020).
  60. Zuur, A.; Ieno, E.N.; Walker, N.; Saveliev, A.A.; Smith, G.M. Mixed Effects Models and Extensions in Ecology with R; Statistics for Biology and Health; Springer: New York, NY, USA, 2009. [Google Scholar] [CrossRef] [Green Version]
  61. Zeide, B. Optimal stand density: A solution. Can. J. For. Res. 2004, 34, 846–854. [Google Scholar] [CrossRef]
  62. MacDonald, E.; Hubert, J. A review of the effects of silviculture on timber quality of Sitka spruce. For. Inst. For. Great Br. 2002, 75, 107–138. [Google Scholar] [CrossRef] [Green Version]
  63. Poorter, H.; Niklas, K.J.; Reich, P.B.; Oleksyn, J.; Poot, P.; Mommer, L. Biomass allocation to leaves, stems and roots: Meta-analyses of interspecific variation and environmental control. New Phytol. 2012, 193, 30–50. [Google Scholar] [CrossRef] [PubMed]
  64. Bartelink, H.H. Allometric relationships on biomass and needle area of Douglas-fir. For. Ecol. Manag. 1996, 86, 193–203. [Google Scholar] [CrossRef]
  65. Vanninen, P.; Mäkelä, A. Carbon budget for Scots pine trees: Effects of size, competition and site fertility on growth allocation and production. Tree Physiol. 2005, 25, 17–30. [Google Scholar] [CrossRef]
  66. Naidu, S.L.; DeLucia, E.H.; Thomas, R.B. Contrasting patterns of biomass allocation in dominant and suppressed loblolly pine. Can. J. For. Res. 1998, 28, 1116–1124. [Google Scholar] [CrossRef]
  67. Kellomäki, S. Effect of the within-stand light conditions on the share of stem, branch and needle growth in a twenty-year-old Scots pine stand. Silva Fenn. 1981, 15, 130–139. [Google Scholar] [CrossRef] [Green Version]
  68. Ratajczak, E.; Szostak, A.; Bidzińska, G.; Leszczyszyn, E. Market in wood by-products in Poland and their flows in the wood sector. Drewno 2018, 61, 5–20. [Google Scholar] [CrossRef]
  69. Bembenek, M.; Giefing, D.E.; Jelonek, T.; Karaszewski, Z.; Kruszyk, R.; Tomczak, A.; Woszczyk, M.; Mederski, P.S. Carbon content in juvenile and mature wood of Scots pine (Pinus sylvestris L.). Balt. For. 2015, 21, 279–284. [Google Scholar]
  70. Wegiel, A.; Polowy, K. Aboveground carbon content and storage in mature Scots pine stands of different densities. Forests 2020, 11, 240. [Google Scholar] [CrossRef] [Green Version]
  71. Hasenauer, H.; Monserud, R.A. A crown ratio model for Austrian forests. For. Ecol. Manag. 1996, 84, 49–60. [Google Scholar] [CrossRef]
  72. Biging, G.S.; Dobbertin, M. Evaluation of competition indices in individual tree growth models. For. Sci. 1995, 41, 360–377. [Google Scholar] [CrossRef]
  73. Stadt, K.J.; Huston, C.; Coates, K.D.; Feng, Z.; Dale, M.R.T.; Lieffers, V.J. Evaluation of competition and light estimation indices for predicting diameter growth in mature boreal mixed forests. Ann. For. Sci. 2007, 64, 477–490. [Google Scholar] [CrossRef] [Green Version]
  74. Monserud, R.A.; Sterba, H. Modeling individual tree mortality for Austrian forest species. For. Ecol. Manag. 1999, 113, 109–123. [Google Scholar] [CrossRef]
  75. Oker-Blom, P.; Pukkala, T.; Kuuluvainen, T. Relationship between radiation interception and photosynthesis in forest canopies: Effect of stand structure and latitude. Ecol. Model. 1989, 49, 73–87. [Google Scholar] [CrossRef]
  76. Tahvanainen, T.; Forss, E. Individual tree models for the crown biomass distribution of Scots pine, Norway spruce and birch in Finland. For. Ecol. Manag. 2008, 255, 455–467. [Google Scholar] [CrossRef]
  77. Yang, B.; Xue, W.; Yu, S.; Zhou, J.; Zhang, W. Effects of stand age on biomass allocation and allometry of Quercus acutissima in the Central Loess Plateau of China. Forests 2019, 10, 41. [Google Scholar] [CrossRef] [Green Version]
  78. Picchio, R.; Venanzi, R.; Latterini, F.; Marchi, E.; Laschi, A.; Lo Monaco, A. Corsican pine (Pinus laricio Poiret) stand management: Medium and long lasting effects of thinning on biomass growth. Forests 2018, 9, 257. [Google Scholar] [CrossRef] [Green Version]
Figure 1. Distribution of sampled Scots pine stands in northwestern Poland (Central Europe: 15°50′–16°00′ E, 53°10′–53°13′ N).
Forests 11 00765 g001
Figure 2. Visualization of the social status of the tree: crown position (CP): (1) dominant, (2) co-dominant, (3) intermediate, (4) overtopped, and crown form (CF): (1) developed (symmetric, with well-developed foliage), (2) crowded (crowded on sides or asymmetric), (3) dying.
Forests 11 00765 g002
Figure 3. Median (thick horizontal line), lower and upper quartiles (box), and range (whiskers) of mass fraction of three main tree compartments (stem, branches, and foliage) of aboveground biomass for trees sharing the same crown position and crown form in premature (blue) and mature (red) stands.
Forests 11 00765 g003
Figure 4. Relationships between stand density index and stem/branches/foliage mass fractions in premature (blue) and mature (red) stands.
Forests 11 00765 g004
Table 1. Main characteristics of sample plots established in premature and mature Scots pine stands.
Sample PlotAge
(Years)
SDI
(Trees·ha−1)
Mean DBH
(cm)
Mean Height
(m)
Basal Area
(m2·ha−1)
Standing Stock
(m3·ha−1)
P15972423.421.631.2312
P25775920.621.431.0310
P35587819.220.533.8325
P45367616.618.330.6265
P55564918.520.038.5364
M18262828.222.930.5319
M28267725.720.831.5301
M38258923.619.630.1275
M48263123.920.135.7334
M58273221.819.331.5286
Stands: P—premature; M—mature; SDI—stand density index; DBH—diameter at breast height.
Table 2. Mean ± standard error of basic characteristics of sample trees according to the stand’s stage of development and tree’s social status.
Stand’s Stage of DevelopmentTree’s Social StatusNDBH
(cm)
Height
(m)
Crown Length
(m)
Volume
(m3)
prematurecrown positiondominant3521.7 ± 0.720.8 ± 0.37.0 ± 0.30.390 ± 0.029
co-dominant1116.5 ± 0.919.2 ± 0.55.7 ± 0.30.219 ± 0.033
intermediate414.6 ± 1.716.3 ± 1.04.1 ± 0.60.134 ± 0.035
crown formdeveloped2522.2 ± 0.820.7 ± 0.37.0 ± 0.30.406 ± 0.033
crowded2417.6 ± 0.919.4 ± 0.45.8 ± 0.40.253 ± 0.033
dying122.020.69.90.395
maturecrown positiondominant3226.7 ± 0.921.6 ± 0.37.6 ± 0.40.589 ± 0.042
co-dominant921.5 ± 1.020.5 ± 0.66.4 ± 0.40.387 ± 0.051
intermediate821.7 ± 1.520.2 ± 0.95.8 ± 0.80.339 ± 0.060
overtopped116.518.75.70.182
crown formdeveloped3526.2 ± 0.821.8 ± 0.27.7 ± 0.30.574 ± 0.038
crowded1420.5 ± 1.119.3 ± 0.45.4 ± 0.50.303 ± 0.040
dying133.721.37.20.886
N—number of sample trees; DBH—diameter at breast height.
Table 3. Mean ± standard error of biomass (kg) of different tree compartments according to the stand’s stage of development and tree’s social status.
Stand’s Stage of DevelopmentTree’s Social StatusStemLiving BranchesFoliageDead BranchesConesTotal
pre-maturecrown positiondominant165.9 ± 11.919.8 ± 2.56.7 ± 0.65.8 ± 0.90.8 ± 0.2199.0 ± 15.7
co-dominant96.7 ± 13.99.4 ± 2.13.6 ± 0.52.3 ± 0.40.2 ± 0.1112.1 ± 16.5
intermediate55.8 ± 13.14.0 ± 0.81.7 ± 0.41.6 ± 0.4063.2 ± 14.6
crown formdeveloped171.8 ± 13.820.6 ± 2.46.9 ± 0.75.6 ± 0.90.9 ± 0.3205.8 ± 17.5
crowded109.4 ± 13.510.8 ± 2.94.1 ± 0.73.7 ± 1.00.4 ± 0.1128.4 ± 17.9
dying171.436.410.96.40.2225.2
maturecrown positiondominant242.9 ± 16.831.8 ± 3.58.9 ± 0.710.3 ± 1.30.7 ± 0.2294.6 ± 21.7
co-dominant160.9 ± 20.617.4 ± 3.15.1 ± 0.75.1 ± 0.80.6 ± 0.3189.1 ± 24.4
intermediate139.7 ± 23.810.5 ± 2.64.0 ± 0.83.6 ± 0.80.5 ± 0.2158.3 ± 27.8
overtopped77.26.42.12.3088.0
crown formdeveloped237.5 ± 14.929.5 ± 3.08.5 ± 0.69.3 ± 1.00.9 ± 0.2285.7 ± 19.1
crowded125.6 ± 15.912.4 ± 3.33.8 ± 0.73.8 ± 1.00.1 ± 0145.7 ± 20.3
dying345.059.612.326.50.7444.1
Table 4. Results of linear mixed-effects analysis of relationships between stem mass fraction (SMF), branches mass fraction (BMF), and foliage mass fraction (FMF) and fixed effects, i.e., tree’s social status, stand density index (SDI), stand’s stage of development with random effects defined by the nesting of trees within plots.
SMFBMFFMF
Fixed EffectsβCItβCItβCIt
(Intercept)80.3674.03 ÷ 86.6924.88 *16.0310.28 ÷ 21.785.46 *3.592.18 ÷ 5.005.00 *
co-dominant CP1.12−0.32 ÷ 2.551.53−0.94−2.25 ÷ 0.36−1.42−0.16−0.46 ÷ 0.13−1.09
intermediate CP3.391.59 ÷ 5.193.69 *−2.94−4.57 ÷ −1.30−3.52 *−0.44−0.81 ÷ −0.07−2.34 *
crowded CF1.940.70 ÷ 3.183.06 *−1.69−2.82 ÷ −0.56−2.94 *−0.25−0.51 ÷ −0.01−1.91 *
mature stands0.45−0.89 ÷ 1.800.66−0.09−1.31 ÷ 1.13−0.14−0.37−0.67 ÷ −0.07−2.42 *
SDI0.0084−0.0001 ÷ 0.01701.93−0.0083−0.0161 ÷ −0.0005−2.08 *−0.0001−0.0021 ÷ 0.0018−0.15
Random Effects
σ27.966.570.33
τ00, plot0.130.150.01
ICC plot0.020.020.02
N plot101010
observations979797
marginal-R2/conditional-R20.275/0.2880.273/0.2920.176/0.192
* significant at 0.05; CP—crown position; CF—crown form; σ2—variation not explained by the model; τ00—variation explained by a random effect; ICC—inter-correlation coefficient.

