Article

Ungulate Species and Abundance as well as Environmental Factors Determine the Probability of Terminal Shoot Browsing on Temperate Forest Trees

by
Andrea Doris Kupferschmid
1,*,
Lukas Bütikofer
2,
Torsten Hothorn
2,
Andreas Schwyzer
1 and
Peter Brang
1
1
Swiss Federal Research Institute WSL, Zücherstrasse 111, 8903 Birmensdorf, Switzerland
2
Epidemiology, Biostatistics and Prevention Institute, Department of Biostatistics, University of Zurich, Hirschengraben 84, 8001 Zurich, Switzerland
*
Author to whom correspondence should be addressed.
Forests 2020, 11(7), 764; https://doi.org/10.3390/f11070764
Submission received: 30 May 2020 / Revised: 10 July 2020 / Accepted: 12 July 2020 / Published: 16 July 2020
(This article belongs to the Special Issue Analysis and Management of Disturbance Effects on Forest Ecosystems)

Abstract

:
Ungulate browsing is a major factor influencing tree regeneration. However, it is unclear if the observed increase in ungulate abundance in Central Europe implies increased browsing, and which other factors influence the incidence of browsing. We investigated the impact of forty variables (site, climate, forest and ungulates) on the probability of leader shoot browsing of six tree species which are frequent in Switzerland. The analysis was based on a large dataset including 49 monitoring areas, each containing 25–64 circular plots, in which 10 to 130 cm tall seedlings were repeatedly assessed. Browsing probability was estimated for each plot and year by mixed effects logistic regression and used as a response in random forests to disentangle the influence of the explanatory variables. Browsing probability was positively correlated with ungulate density measures (number culled by hunting or found dead) for all six tree species. Where beyond roe deer, some red deer and/or chamois were present, the browsing probability was higher. Small timber tree stands had less browsing than young growth and thicket stands. Seedlings tended to be more frequently browsed in stands with >80% canopy shading. Browsing increased with increasing understory cover, independent of vegetation category. In conclusion, browsing is a multifactorial phenomenon and ungulate density estimates alone do not explain the whole browsing probability.

1. Introduction

Ungulates such as red deer (Cervus elaphus L.), roe deer (Capreolus capreolus L.) and chamois (Rupicapra rupicapra L.) strongly affect forest regeneration in many temperate and boreal forests (e.g., References [1,2]) since woody plants often make up a large part of their diet [3,4,5]. In central Europe, ungulate abundance has increased in recent decades and is likely to continue to do so in the future [6].
Deer and chamois are selective browsers, or at least intermediate feeders [7]. Thus, they select tree seedlings by actively choosing certain tree species [8]. The preferred ones are used disproportionately to their availability [8]. Among the coniferous tree genera, Abies are typically the most preferred in northern temperate forests of Europe, while Picea and Pinus are usually least preferred [9]. In Switzerland, annual leader shoot browsing, i.e., feeding on the apical bud or terminal shoots of tree seedlings, varied widely between the most frequent tree species from 2009 until 2013 [10]. It was highest for Quercus (39.0 ± 9.5%, mean ± standard error) and Sorbus (35.7 ± 3.4%), followed by Acer (19.3 ± 2.1%), Abies (18.9 ± 2.2%) and Fraxinus (16.6 ± 1.3%), while it was low for Larix (8.4 ± 2.4%) and Pinus (6.1 ± 3.3%), and lowest for Fagus (3.2 ± 0.5%) and Picea (2.4 ± 0.5%) [10]. As Abies alba Mill. (Abies from now on) is an important timber species, the third most frequent tree species in Swiss forests [11], it is of particular interest for forest management which factors influence ungulate browsing on Abies in comparison to other tree species.
While browsing can affect lateral and terminal plant organs, leader shoot browsing is particularly crucial for tree seedlings [12], since it often negatively affects their height growth. This process depends on a multitude of variables, including habitat characteristics, surrounding vegetation, abundance of ungulates and competition between ungulates (e.g., References [9,13]). For example, the abundance and composition of ground vegetation and the presence of seedlings of other tree species may decrease or increase the likelihood of detection by ungulate and/or the vulnerability to them [9,14,15,16,17,18]. In a meta-analysis, unpalatable neighbors decreased the likelihood of mammalian herbivory [14]. In contrast, reduced browsing on tree seedlings was assumed if blackberry (Rubus fruticosus L.) and raspberry (Rubus idaeus L.) are present [19], which are high-quality food for ungulates and consumed in particular by roe deer [20]. In studies with natural regeneration, however, the number of browsing marks on tree seedlings and the cover of Rubus spp. were found to be uncorrelated [20,21]. As small-scale habitat characteristics have a great influence on the diet composition of roe [22] and red deer [4], effects of ground vegetation on larger scales may be masked. Apart from forest type, these characteristics include, for example, the presence of forest gaps and woody debris. Forest gaps created by storms and harvesting activities are often regarded as attractive feeding places for ungulates (at least after some years [23]) because they often provide more forage than undisturbed forests [24]. Consequently, ungulates browsed on Picea rubens Sarg. seedlings in harvested stands, but largely spared seedlings in mature stands [25]. However, uncleared windthrow areas were less often used by roe deer than cleared ones or closed forests [26]. While this suggests that woody debris protects seedlings against browsing, like in post-fire stands [27], such effects were absent in deer or chamois, which even browsed more on seedlings in proximity to such obstacles (cf. References [28,29]). The factors which determine local browsing intensity in different habitats are thus still unclear.
In fact, it is even unclear whether an increased abundance of ungulates always implies more browsing on tree seedlings, or what form the relationship between ungulate density and the incidence of leader shoot browsing has (i.e., linear, exponential or rather asymptotic). Ungulate abundance often positively affected browsing occurrence [15,30,31,32,33], most clearly if paired plots inside and outside control fences were compared [34,35]. In one study, however, the rare palatable Sorbus aucuparia L. seedlings were severely browsed in all plots regardless of red deer abundance [36]. Factors like surrounding vegetation often had an influence in case of moderate browsing but not under intense browsing or grazing [18,37].
In this paper, we explore a large long-term dataset to disentangle the impact of a variety of site and forest characteristics, such as soil properties, forest type, developmental stage, canopy cover, gap size and dominant ground vegetation, on the probability of leader shoot browsing. Due to the importance of Abies in Swiss forestry, we focused on leader shoot browsing on Abies and compared it with browsing on five other species (Picea, Acer, Fagus, Fraxinus and Sorbus). Our research questions were: (i) Is browsing on tree seedlings positively correlated with the density of ungulates? (ii) Does browsing on tree seedlings depend on ungulate species? (iii) Is browsing on tree seedlings increased in early developmental stages? (iv) Does browsing on tree seedlings differ between gaps and closed canopy stands? (v) Does the presence of stumps, snags and lying logs enhance the probability of a seedling to be browsed? (vi) Do the cover of tree seedlings and ground vegetation affect browsing on tree seedlings?

2. Materials and Methods

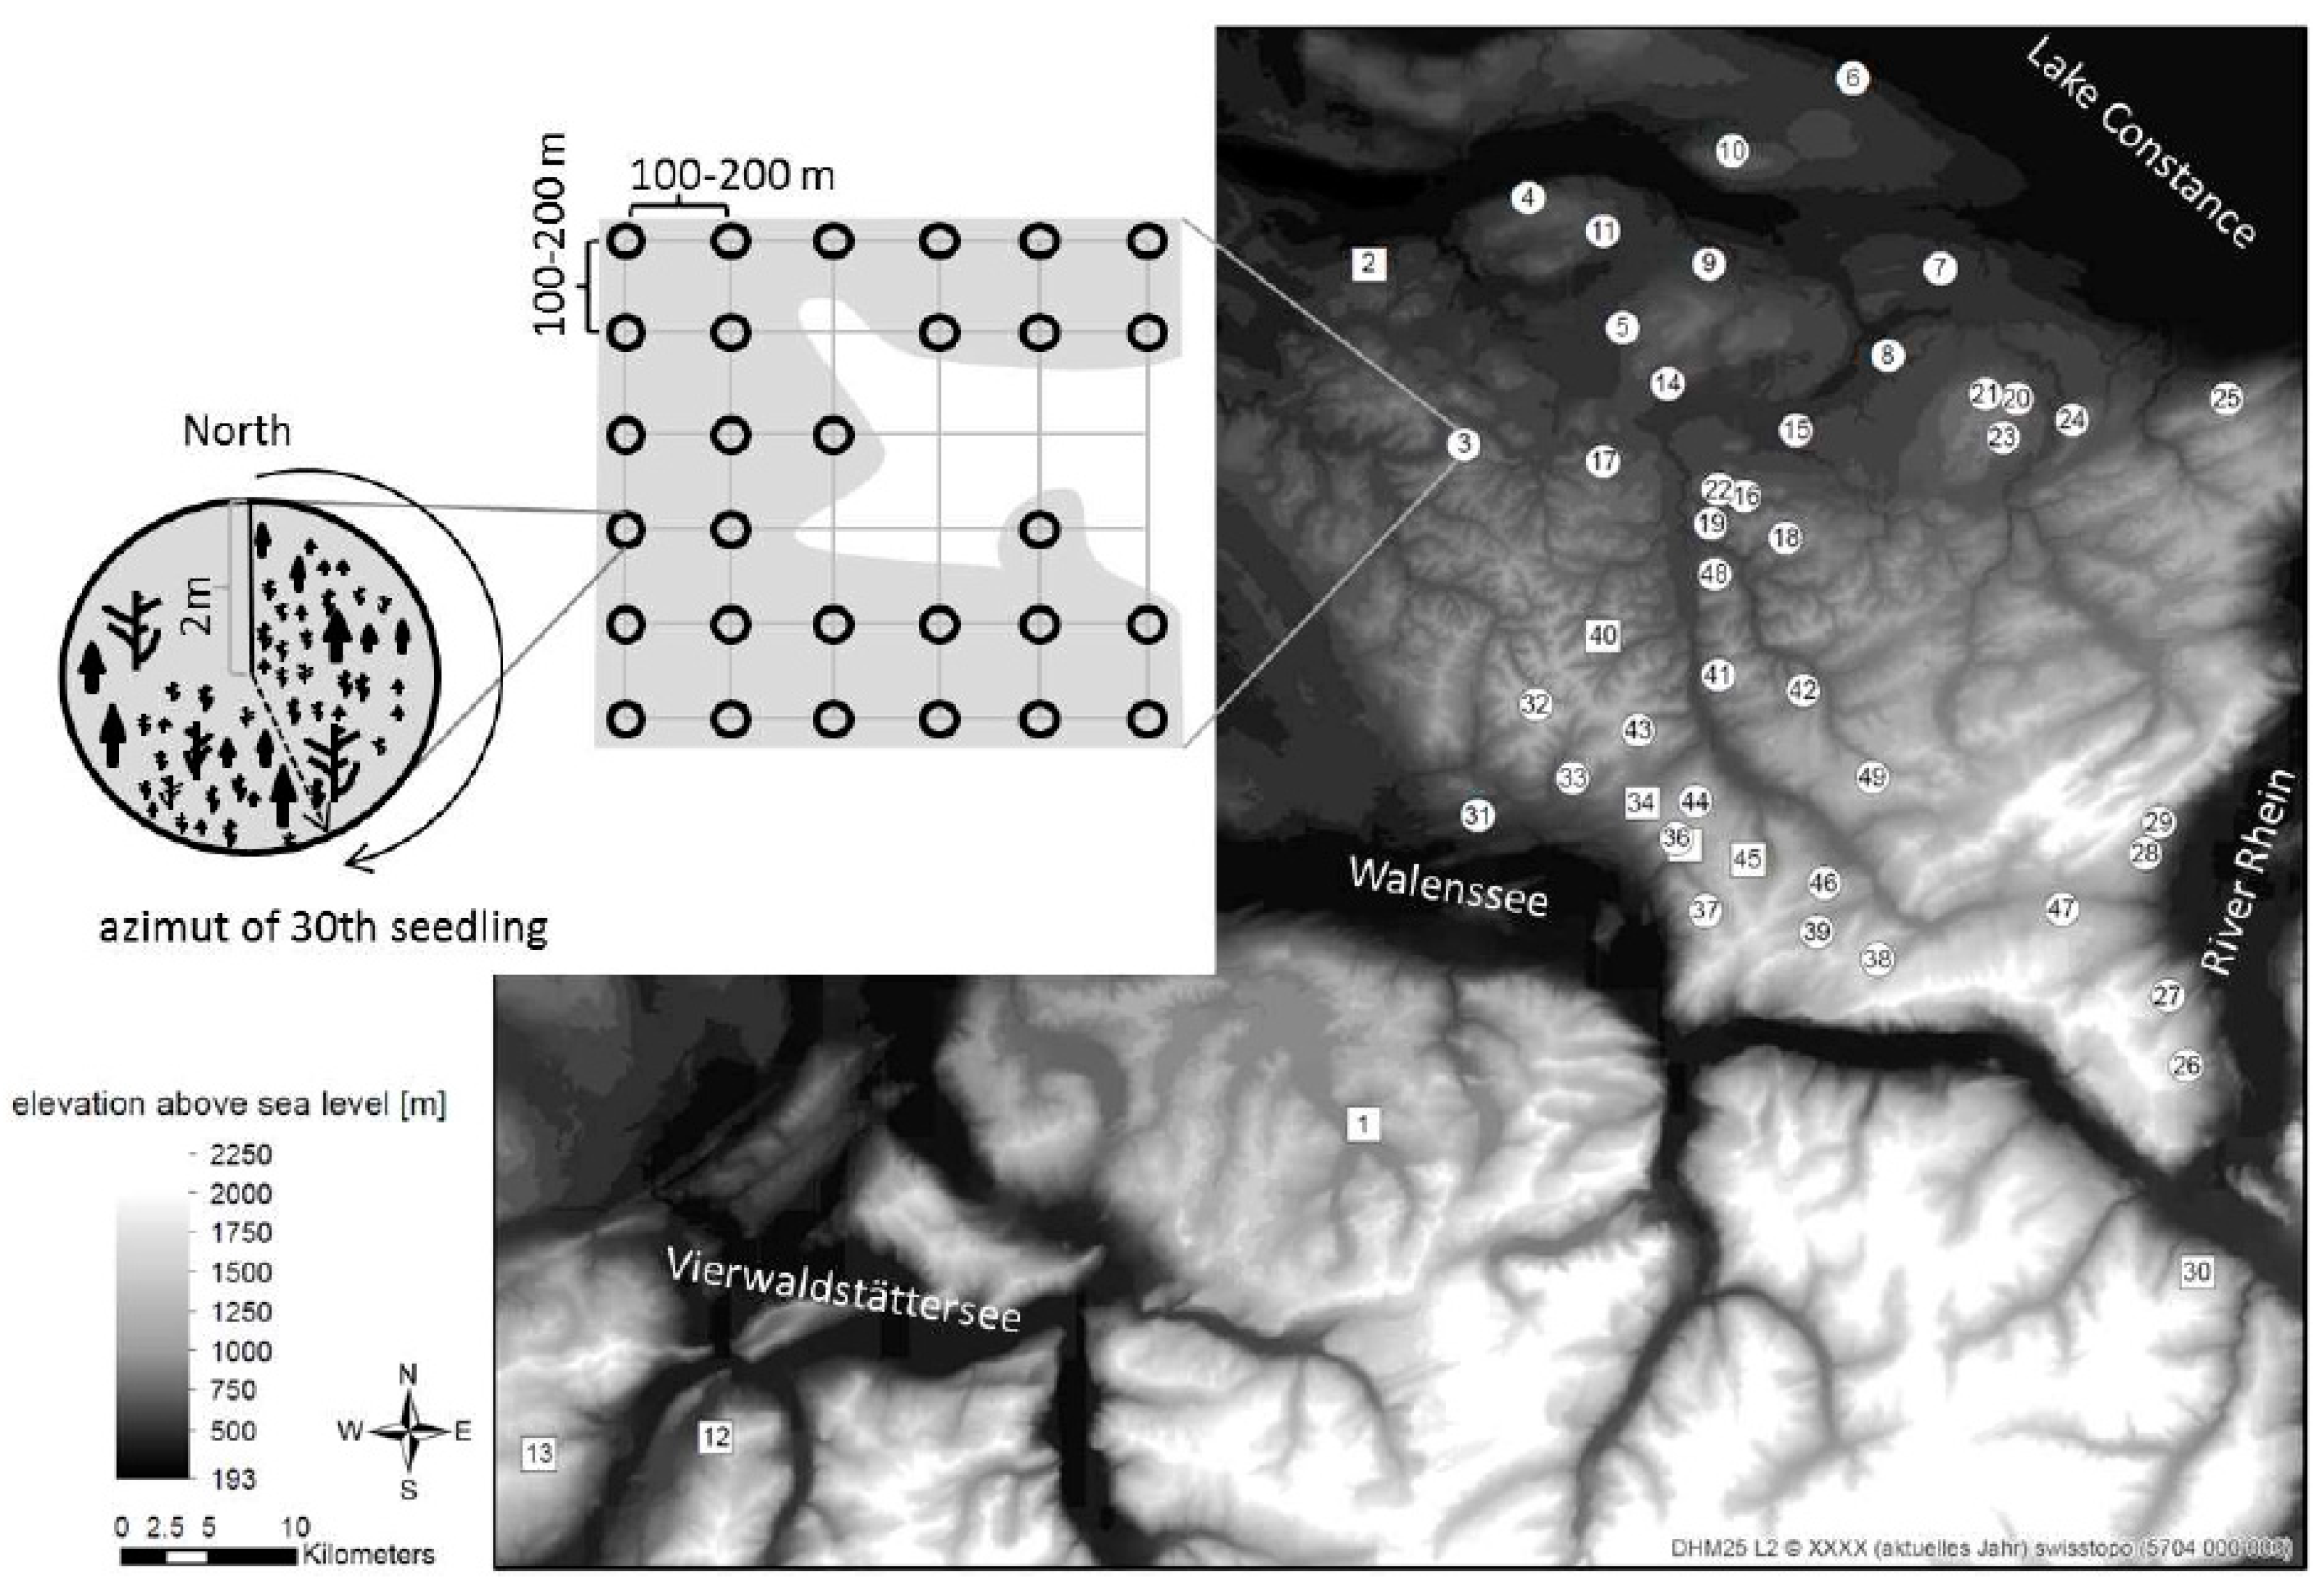
2.1. Study Sites and Sampling Design

In order to monitor the frequency of ungulate browsing on tree regeneration, leader shoot browsing has been repeatedly (i.e., annually or every second year) recorded on more than 200 indicator areas (IA) throughout Switzerland [38]. An IA typically comprises a continuous forest area with different developmental stages and forest types, which is characteristic for the respective ungulate management unit [39]. In this study, we exploit this large dataset by selecting 49 IA which (i) have been monitored for at least 10 years, (ii) have been recently monitored (2008 or later), (iii) do not have any known methodological deficits such as translocation of sampling plots and (iv) contained at least 10 sampling plots (at any point in time) with presence of Abies seedlings, among other species, in order to be able to compare browsing of the different species. The selected IA were all located in north-eastern and central Switzerland in 5 cantons (Figure 1), i.e., 36 IA in St. Gallen (SG), 10 in Thurgau (TG) and one each in Nidwalden, Obwalden and Schwyz.
In each IA, 25–64 circular sampling plots were established on a rectangular grid with a fixed distance of 100 to 200 m (Figure 1), and the plot centers were permanently marked. This resulted in a total of 1704 plots. The plot radius was either 2.0 or 5.0 m, depending on seedling abundance in an IA, and corrected for slope (Figure 1, [40]).

2.2. Long-Term Field Data Collection

Each plot was sampled yearly or every other year in late winter or early spring before budburst for 10 to 16 years, yielding 6 to 10 inventories in each plot. Tree seedlings between 10 and 130 cm were counted in four height classes (hc) (hc1: 10–40 cm, hc2: 41–70 cm, hc3: 71–100 cm and hc4: 101–130 cm), two browsing classes (leader shoot browsed or not browsed in the last year) and nine species categories. The species categories were Abies (A. alba Mill.), Picea (P. abies (L.) H.Karst.), other coniferous species, Fraxinus (F. excelsior L.), Acer (containing A. pseudoplatanus L., A. platanoides L. and rarely A. campestre L.), Fagus (F. sylvatica L.), Quercus (containing Q. petraea (Mattuschka) Liebl. and Q. robur L.), Sorbus (containing S. aucuparia and rarely S. aria (L.) Crantz) and other broad-leaved tree species. Quercus was only assessed in IA in the canton TG and Sorbus in all other cantons. As the categories ‘other broad-leaved trees’ and ‘other coniferous trees’ contained different species, they were omitted in species-specific analyses. The assessment of seedlings always started in the north direction and proceeded clockwise around the center of the sampling plot. If the number of seedlings in a plot exceeded 30, counting was stopped to save time and the azimuth was recorded (Figure 1). Thus, an observation in a certain year and at a specific location (IA:plot) consisted of the number of browsed and unbrowsed seedlings per height class and species category, as well as a radius and azimuth value.

2.3. Additional Assessment of Variables

In order to assess factors that may influence browsing, we complemented the long-term monitoring data with variables related to location, climate, forest characteristics and ungulates (Appendix A Table A1). All these variables, except ungulate-related variables, were determined at only one point in time (e.g., forest type) or as an average over time (e.g., precipitation) and were assumed to be constant over time for a specific sampling location (i.e., at IA:plot).
Location variables were derived from a geographic information system (GIS) using swisstopo data DHM25 (with a 25 m grid, [41]). Aspect was converted to a factor with four levels according to the cardinal directions. Daily climate data of the period 1990 to 2010 provided by Meteoswiss from all available climate stations was interpolated over the 100 m Digital Elevation Model of Switzerland with Daymet according to Thornton et al. [42] to get means for annual precipitation, precipitation from April to June, annual temperature and degree day sum for each plot. Degree day sums were calculated [43] with a minimum threshold of 5.56 °C.
Forest characteristics for each plot were retrieved from geographic information systems of the cantonal authorities. Maps of forest associations were used to estimate soil humidity and acidity according to the ecograms in Frehner et al. [44]. Abies-Fagus associations were classified as coniferous forests, due to their aspect in winter.
Ungulate densities in each IA were approximated with the number of roe and red deer and chamois culled by hunting or found dead for other reasons (such as traffic accidents, wounded after being shot, agricultural machinery, predators, or natural deaths like crashes, diseases, old age) per year and forest area within each hunting district (data provided by cantonal authorities). As it is not possible to identify the ungulate species responsible for leader shoot browsing in such a large repeated assessment, we looked for an ungulate density index (UDI) to represent the overall impact of all ungulate species present. This index should take into account the body mass but also the ratio of woody vegetation to total diet [31]. Following Motta [31], we calculated UDI = 1 5 roe deer + 1 4 chamois + red deer, where all densities refer to 100 ha. In addition, the ungulate composition variable quantified whether and how many red deer and chamois were present in comparison to roe deer (0%, <5%, ≥5%; Appendix A Table A1).

2.4. Supplementary Field Data Collection in 2012
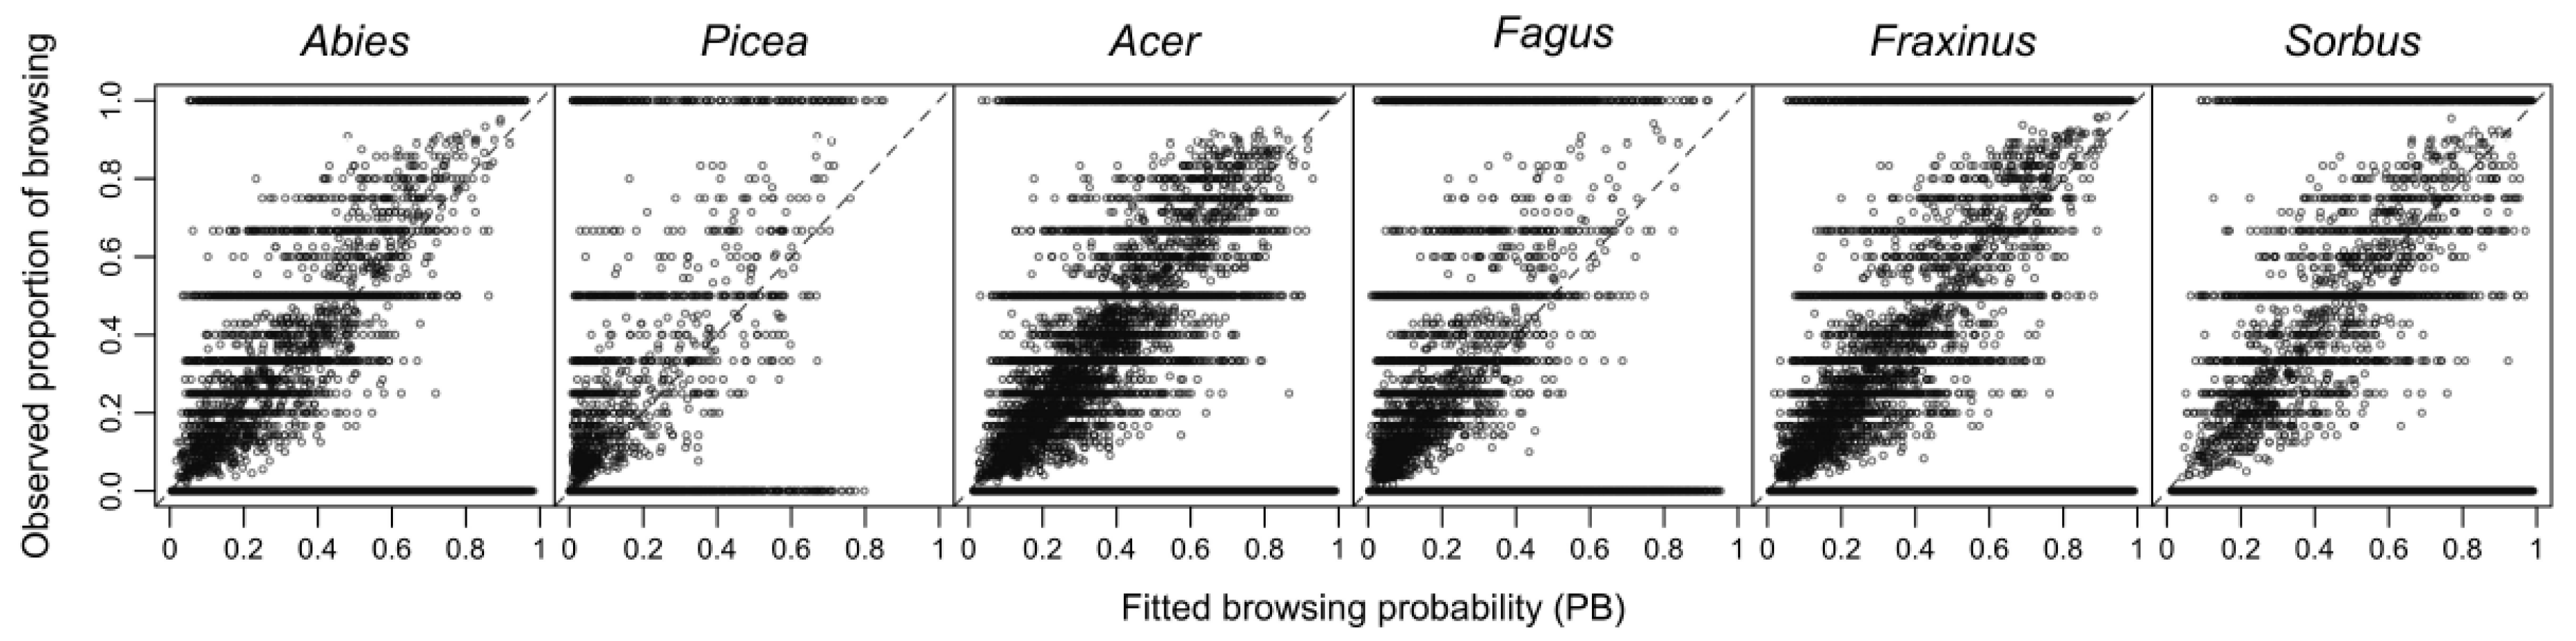
To answer the research questions (iv)–(vi), a subsample of 660 plots in 40 IA was revisited in 2012 to record light and vegetation cover (Appendix A Table A1). Due to the importance of Abies, plots were only selected if they contained at least three Abies seedlings at any point in time. Furthermore, the plots had to be in the cantons SG and TG. Some plots were irretrievable due to missing terrain marks or difficult terrain conditions after a local windthrow event.
Shading at each plot was recorded at 40 and 130 cm above ground as the proportion of the sky covered by both the canopy after complete leaf opening and the local horizon, corresponding to the proportion of black in a black and white fisheye picture taken vertically above the plot center (i.e., criterion “Shading” in the Swiss forest inventory, cf. Reference [45]).
The canopy above a plot was optically separated into eight sectors and each of these sectors was recorded as gap if less than half was covered by treetops (Supplementary Figure S1). The variable ’gap size’ is the sum of the gap sectors for each plot, i.e., zero if no opening is present in the canopy, and higher in larger gaps. Different weighting of the gap sectors was used to approximate snow depth and light transmittance. The latter was based on calculations of total transmitted light (i.e., the sum of direct and indirect transmitted light) for openings of single sectors with different slope and aspect with the Gap Light Analyzer software [46].
Basal areas of living trees, dead trees (snags and fresh lying logs) and stumps were quantified using angle count sampling with counting factor 4 [47].
Total vegetation cover, as well as the cover of blackberry, raspberry, ferns, graminoids, perennial herbs, blueberry and shrubs, were estimated within a plot radius of 2 m. All these vegetation covers and seedling cover were recorded on a scale introduced by Londo [48]. Based on this data, no statement can be made on species richness in the plots but it can tell whether ground vegetation cover affects browsing on tree seedlings.

2.5. Data Analysis

We used a two-step process to analyze the extensive data. Browsing probabilities (PB) were first estimated for each species, plot and year using a mixed effects logistic regression with proximal explanatory variables (such as species, year and height class), and accounting for the binary nature of the outcome (seedling browsed/not browsed). These PB estimates were then used as the response variables in random forest models with a large number of more distal explanatory variables (Appendix A Table A1). The two-step process combined the benefits of each method by using the mixed effects logistic regression to model the temporal and spatial correlation within the data and random forests to assess the predictive effects of a large number of explanatory variables.
Mixed effects logistic regression allowed for estimating PB for each plot, including those containing few seedlings where the inventory yielded highly stochastic browsing percentages (e.g., on plots with one seedling only, which is either browsed or not). We included fixed effects for species, height class and year (without intercept), and random intercepts for IA, IA:plot, species:IA:plot, year:IA:plot, hc:IA:plot, species:year, species:hc and year:hc. The random effect structure was chosen to model potential correlations, allowing for, e.g., species- or year-specific variations of the browsing level at a given location. It introduces rudimentary spatial and temporal correlations via the location- and year-specific random intercepts. The three-way interactions were introduced to model correlations within a specific year, species and height class at a given location (defined by plot within an IA). They were based on the assumptions that (i) seedlings at a given location of a specific species may share a common browsing level (e.g., some species could be more selected due to microsite conditions, ground vegetation or species composition), (ii) seedlings at a given location in a given year may share a common browsing level (e.g., inter-annual climatic variability could lead to small-scale shifts in the spatial use of habitats), and/or (iii) seedlings at a given location with a given height may share a common browsing level (e.g., a recurrent snow cover could affect PB of a certain height class but not the species browsed). The two-way interactions, species:year, species:hc and year:hc, were introduced to capture further correlations within species in a year or height class or between years and height class. This allowed for including the possibility that, e.g., one species (but not the others) might have been generally heavily browsed in one year at all locations. Relationships between IAs were not included, i.e., the 49 IAs were assumed to be independent.
We did not directly further add more distal explanatory variables to the mixed effects logistic regression to avoid a complicated and potentially biased variable selection process and the restriction to linear effects. Instead, we used random forests, a specialized regression method based on an ensemble of regression trees. Random forests do not make any assumptions about the distribution of the response or the effect of the explanatory variables on the response and can cope with many correlated explanatory variables [49]. Separate random forests were fitted for Picea, Abies, Fagus, Fraxinus, Acer and Sorbus (but not for Quercus, which were only present in the canton TG). We used year, height class and all variables shown in Appendix A Table A1 as explanatory variables, restricting the analysis to the 40 IAs and 660 plots where supplementary field data had been collected in 2012. To ensure that this restriction did not have a major effect on the results, additional random forests models were fitted in a sensitivity analysis, using only the subset of explanatory variables available for all 49 IAs (i.e., excluding the variables of the supplementary field data collection in 2012, cf. lower part of Appendix A Table A1).
To quantify the variation within the data, random forests were fitted to resampled datasets comprising only 25 of the 40 IAs. The predictive importance of a variable on the response was quantified using the variable importance calculated according to Breiman’s method (also called permutation importance, [50]). Marginal effects were assessed via the partial dependence function (function partialPlot of the R package randomForest, see below) and presented in partial dependence plots. This procedure was extended to more than one variable, leading to their joint marginal effects. Separate subset analyses were conducted for the three ungulate composition categories.
A sensitivity analysis was conducted to account for the uncertainty in estimating PB. The probability of an observation to be included in an individual regression tree of the random forest models was weighted by the inverse of its standard error from the mixed effects logistic regression. That is, more precise observations were selected more often and got more weight in the subsequent random forests.
We performed all statistical analyses with R version 3.0.2 [51]. The logistic mixed model was fitted using the function glmer with the family specification ‘binomial’ (link = ‘logit’) of the R package lme4, version 1.0–5 [52]. Random forests were fitted with the R package randomForest, version 4.6–7 [53], using 500 ‘trees’ and a minimal node size of 5.

3. Results

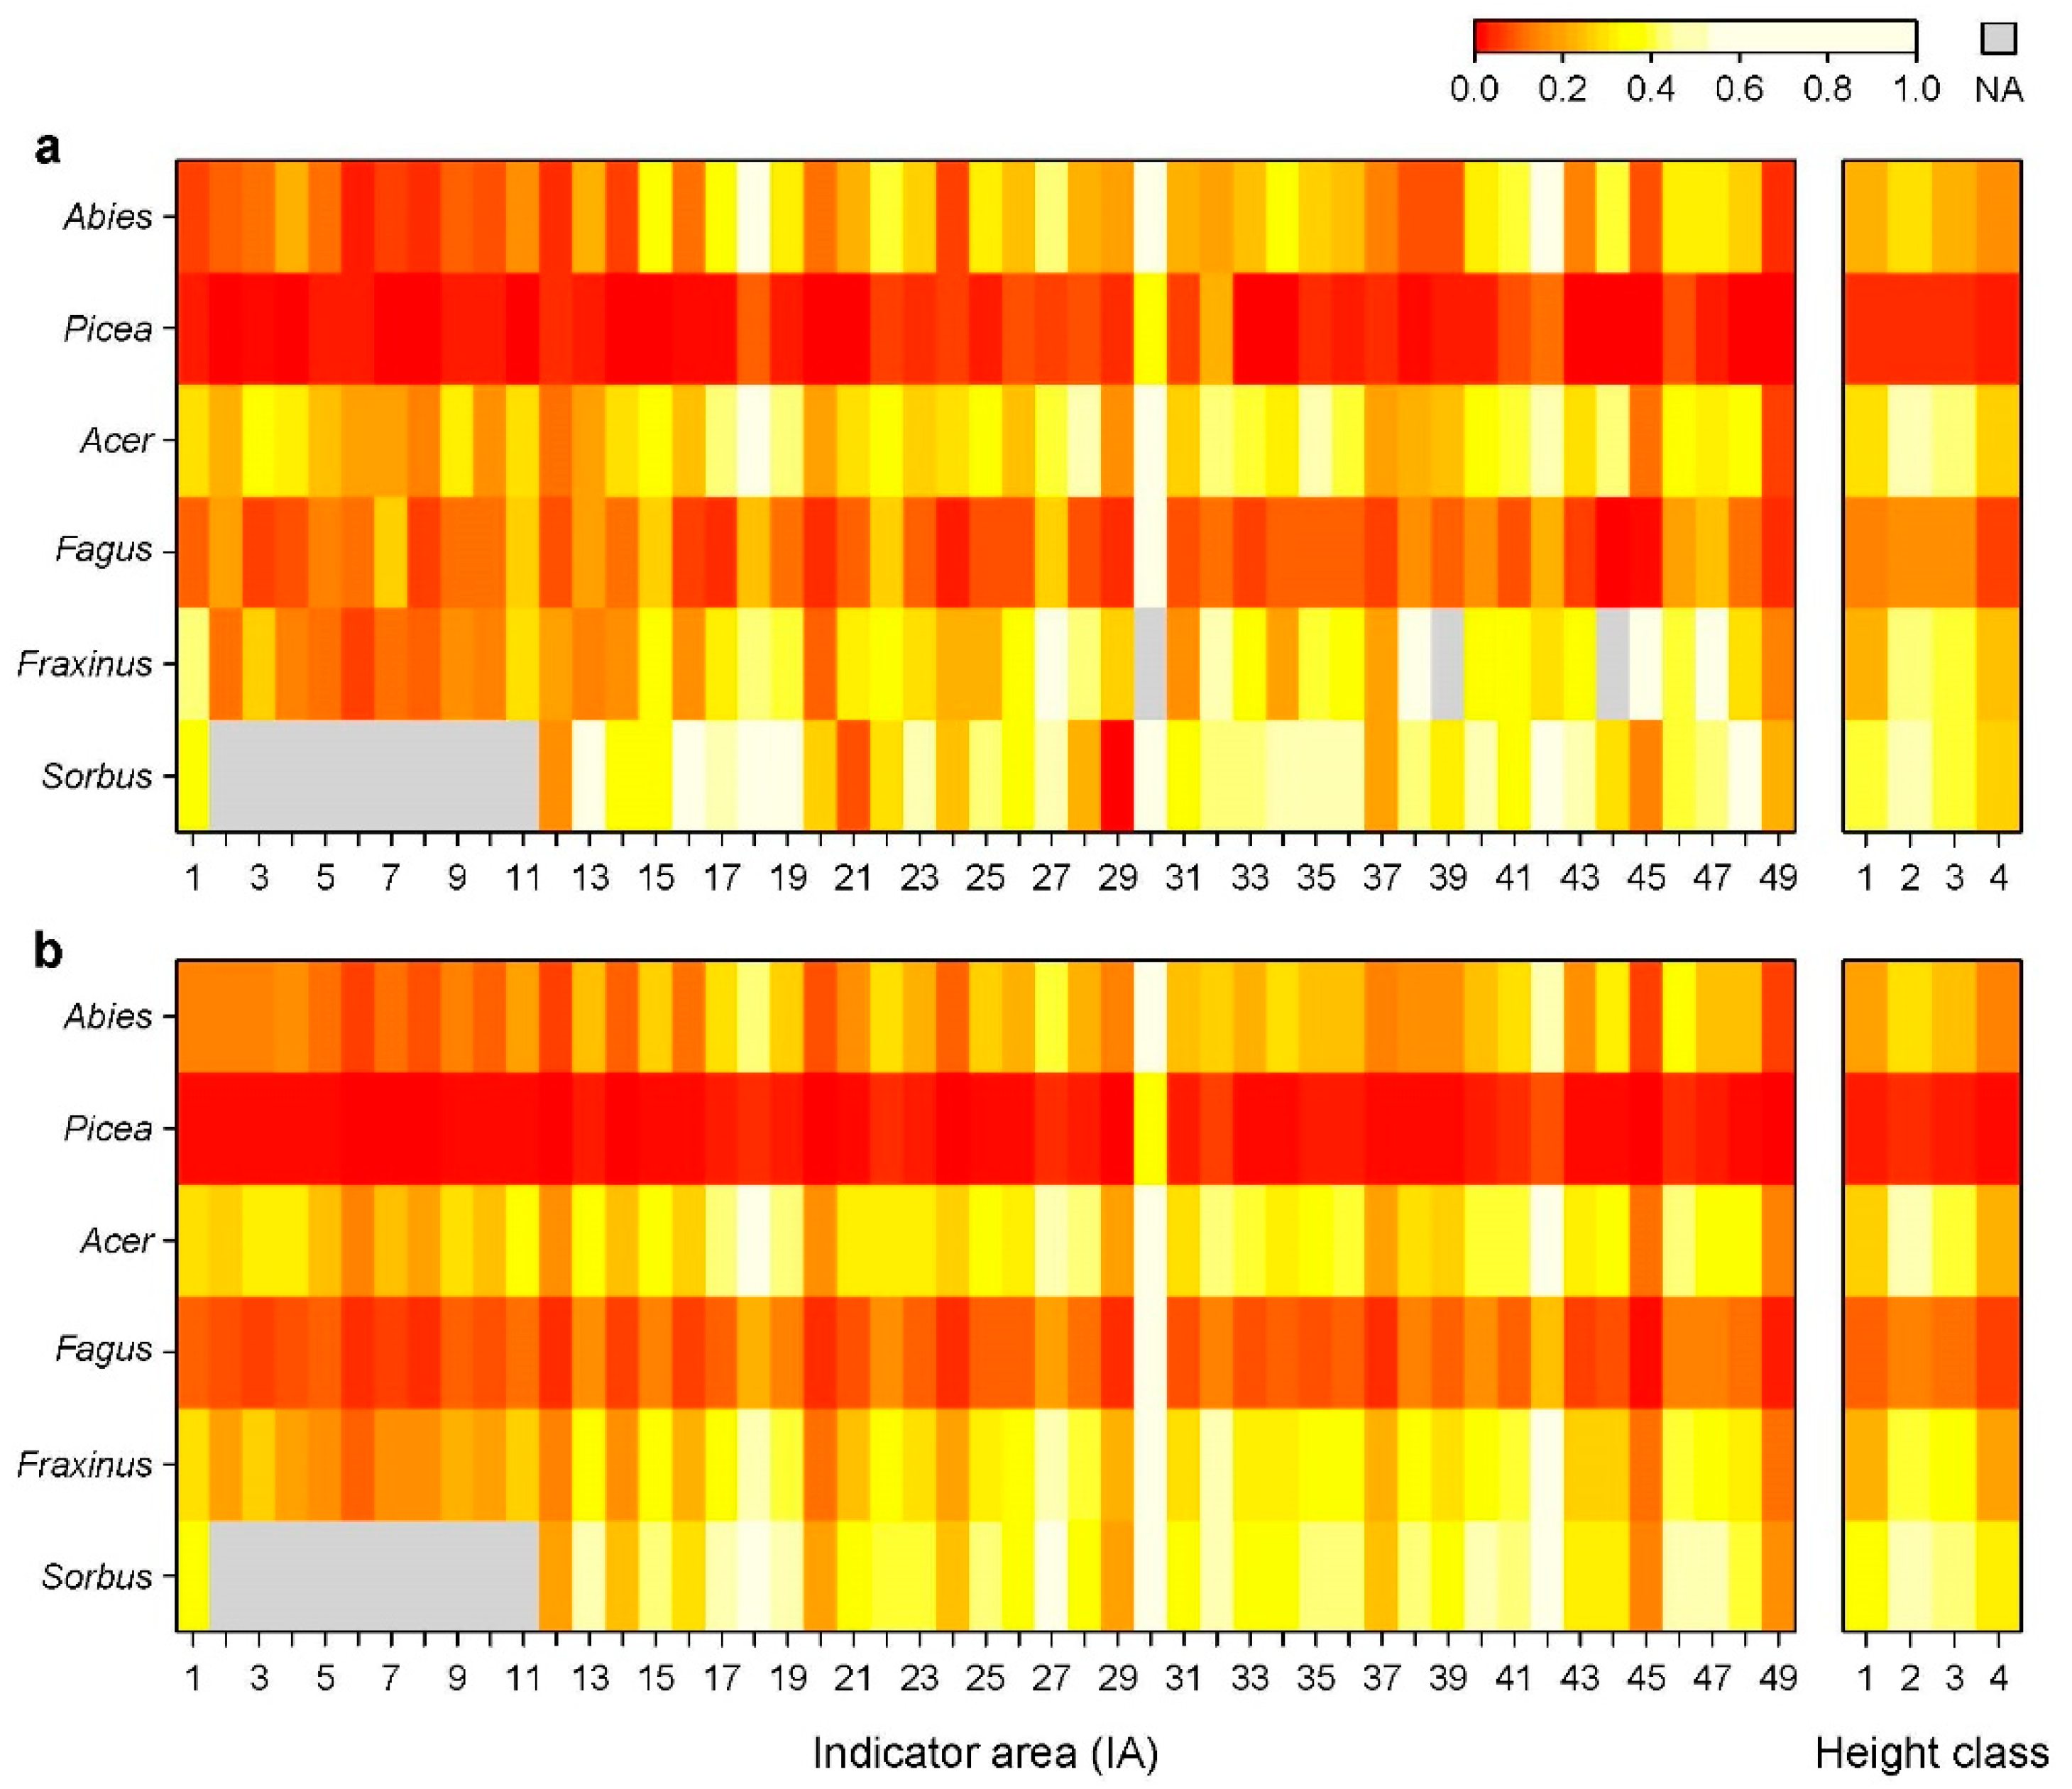
3.1. Distribution of Ungulates and Browsing Probability

The annual number of dead animals, as an indicator of abundance, varied between 0 and 27.5 km−2 in roe deer, 8 km−2 in chamois and 4 km−2 in red deer (Appendix A Table A1 and Supplementary Figure S2). Red deer and chamois were both absent in 35% of the IA. Roe deer was the only ungulate species present in 9 out of 10 IA in the canton TG and in 8 out of 36 IA in the canton SG. These IA were predominantly located in the Swiss Plateau.
In total, 275,866 seedlings (between 11,577 and 192,252 per height class) on 1704 plots were assessed for leader shoot browsing (Appendix A Table A2). Depending on tree species and height class, between 4% and 67% of the tree seedlings were browsed. Both modelled PB and observed percentage of browsing are estimates for the unknown browsing probability. If many seedlings were present, both estimates were very similar, but if only few were present, they differed considerably (Figure 2, e.g., situations with an observed proportion of 0, 0.5 or 1, which often occurred if zero, one or two seedlings were present). In such cases, PB took into account information from other years, height classes and also from plots in the same IA and other species (see estimated model parameters in Appendix A Table A3), whereas the observed percentage of browsing did not.
The estimated PB for Fagus and Picea tended to be slightly lower than the observed browsing probabilities (Figure 2). However, most of the plots with seedlings of these two species are close to the lower left corner of Figure 2 and the few strata with high observed browsing probabilities only weakly contribute to the model fit.
The observed and modelled PB highly varied between IA, and both IA with rare browsing (e.g., IA 12, 45 and 49) and frequent browsing (e.g., IA 18, 30 and 42) were observed (Figure 3, left panels). Nevertheless, the species-specificity was remarkably constant: Sorbus and Quercus were most often browsed, followed by Acer and Fraxinus, then by Abies and finally Fagus and Picea (Figure 3). This was also reflected by the odds ratios from the mixed effects logistic regression (Appendix A Table A3). Seedlings of small (hc1, 10–40 cm) and especially of tall height classes (hc4, 101–130 cm) were less often browsed than medium-sized ones (hc2, 41–70 cm and hc3, 71–100 cm; Figure 3, right panels). Accordingly, the odds for browsing were higher in hc2 and hc3 than in hc1, but smaller in hc4 (Appendix A Table A3).

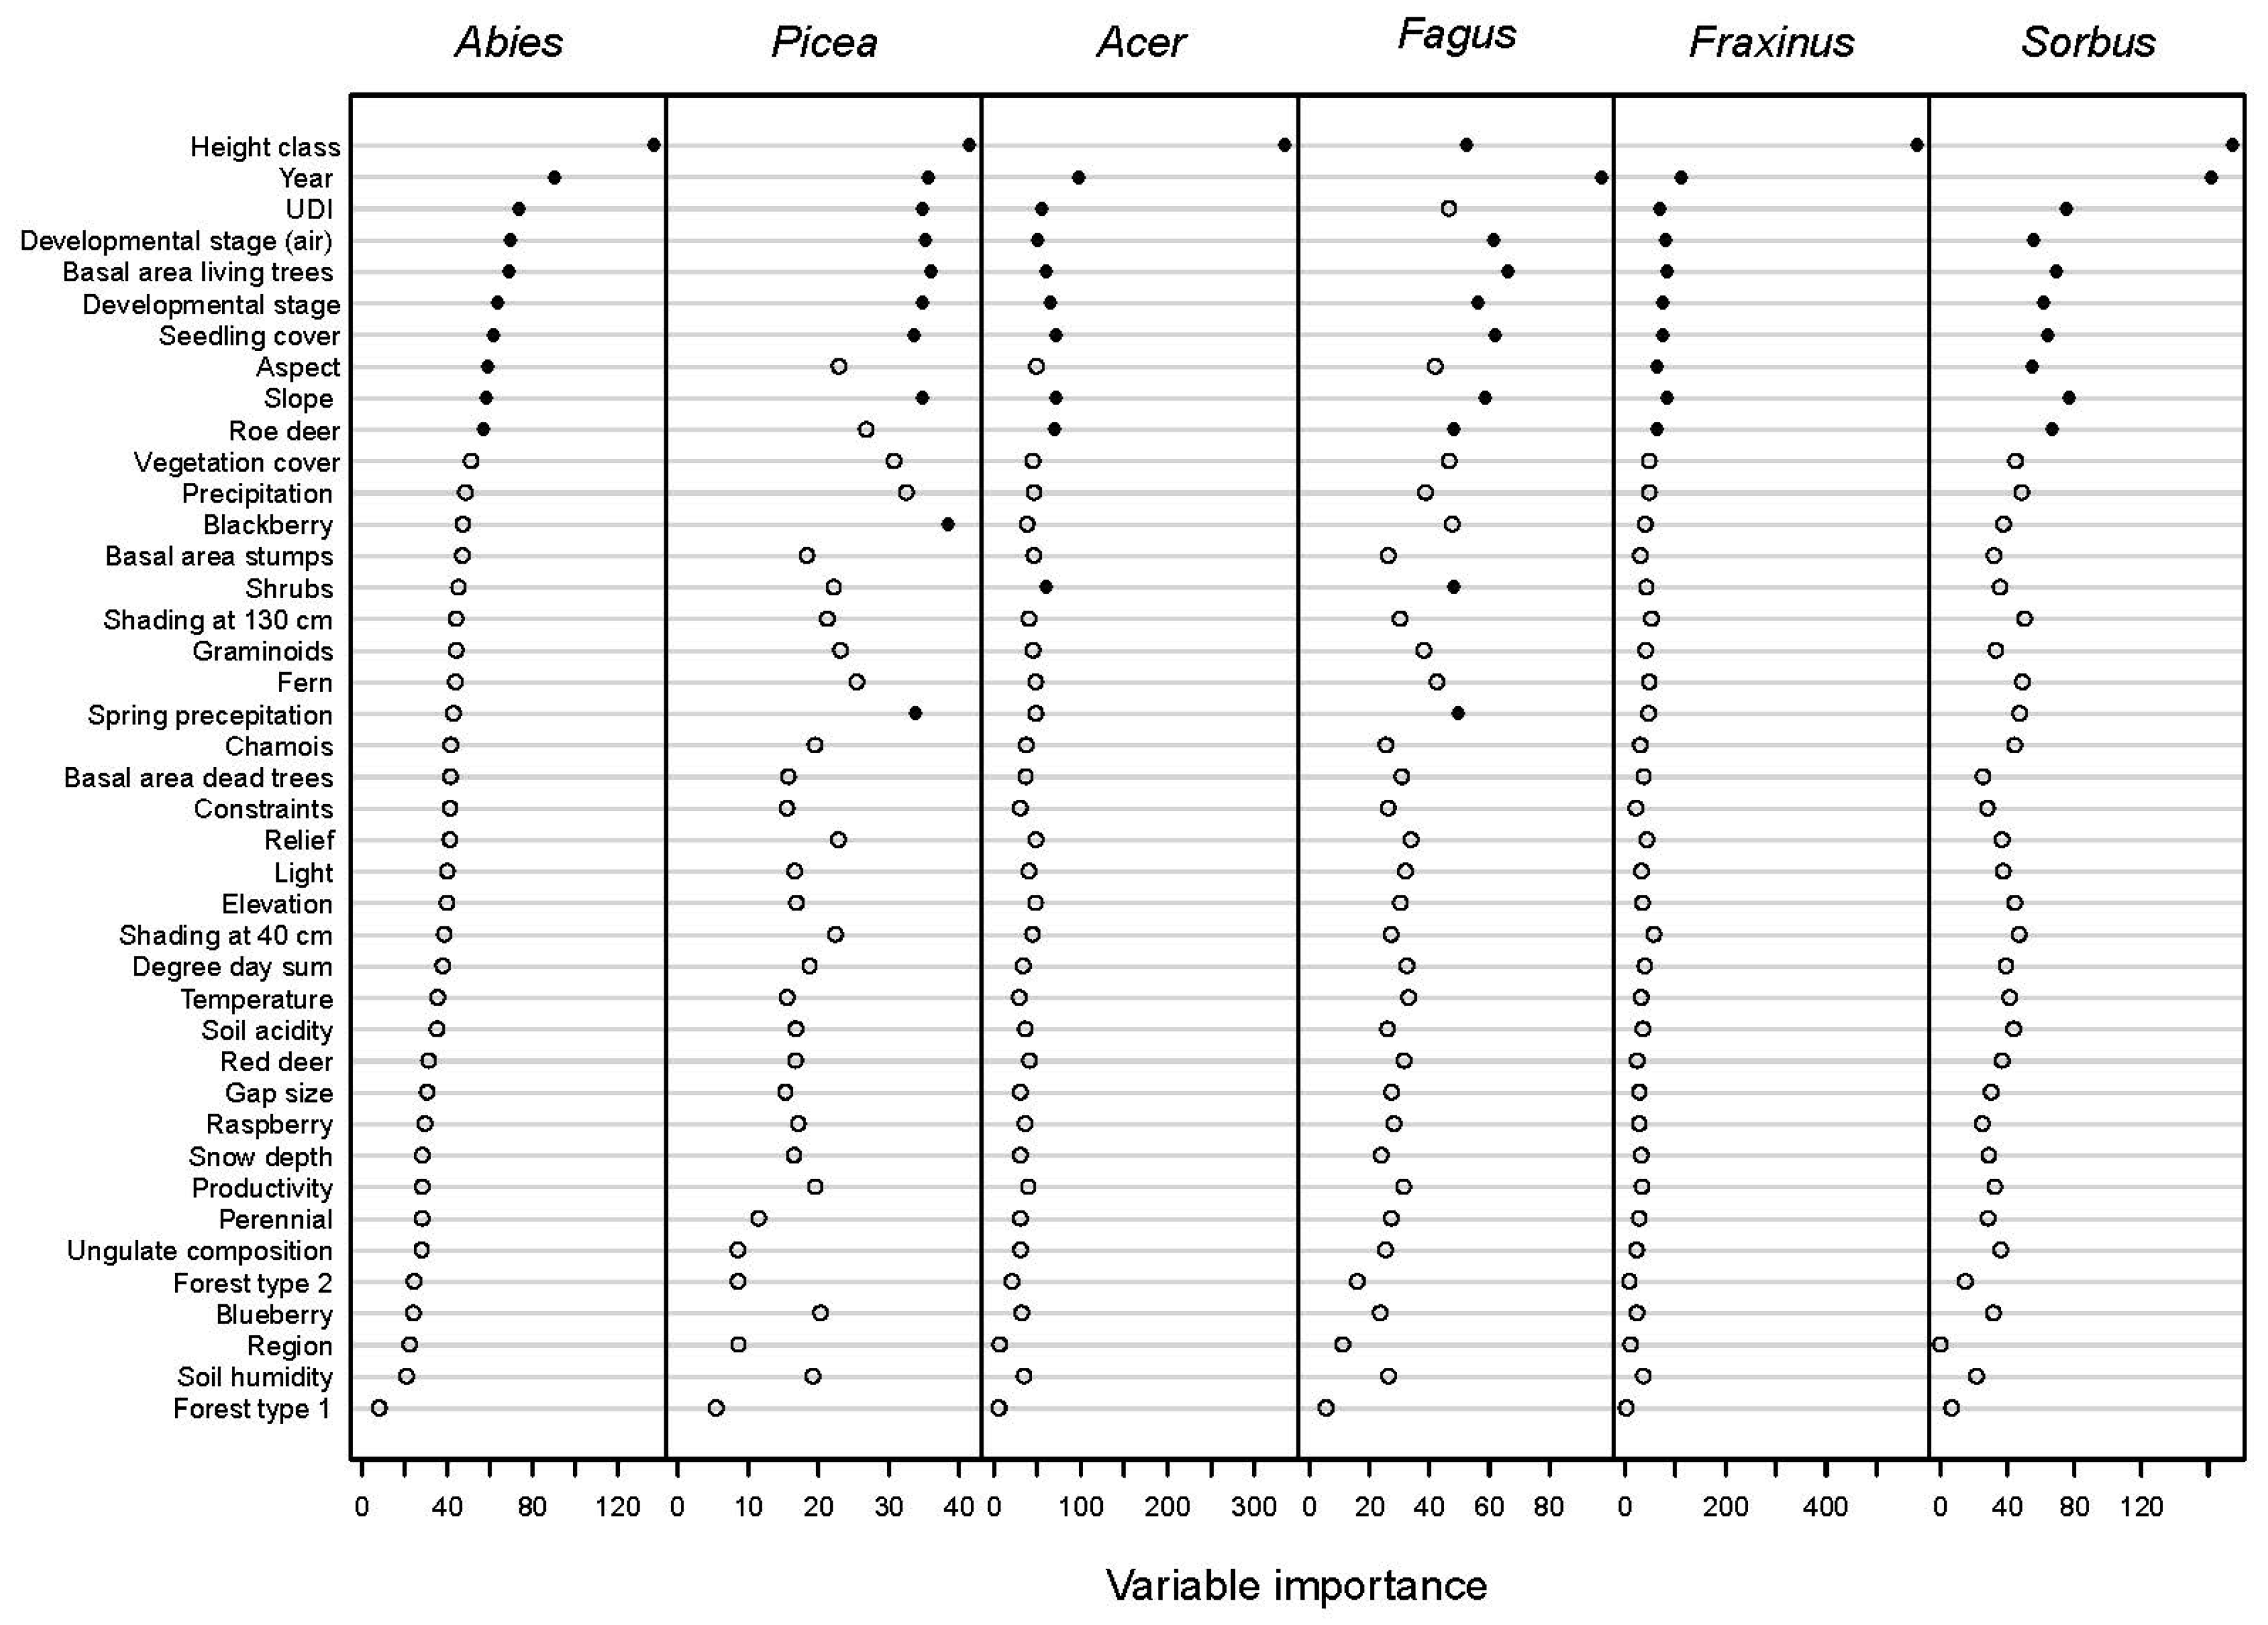
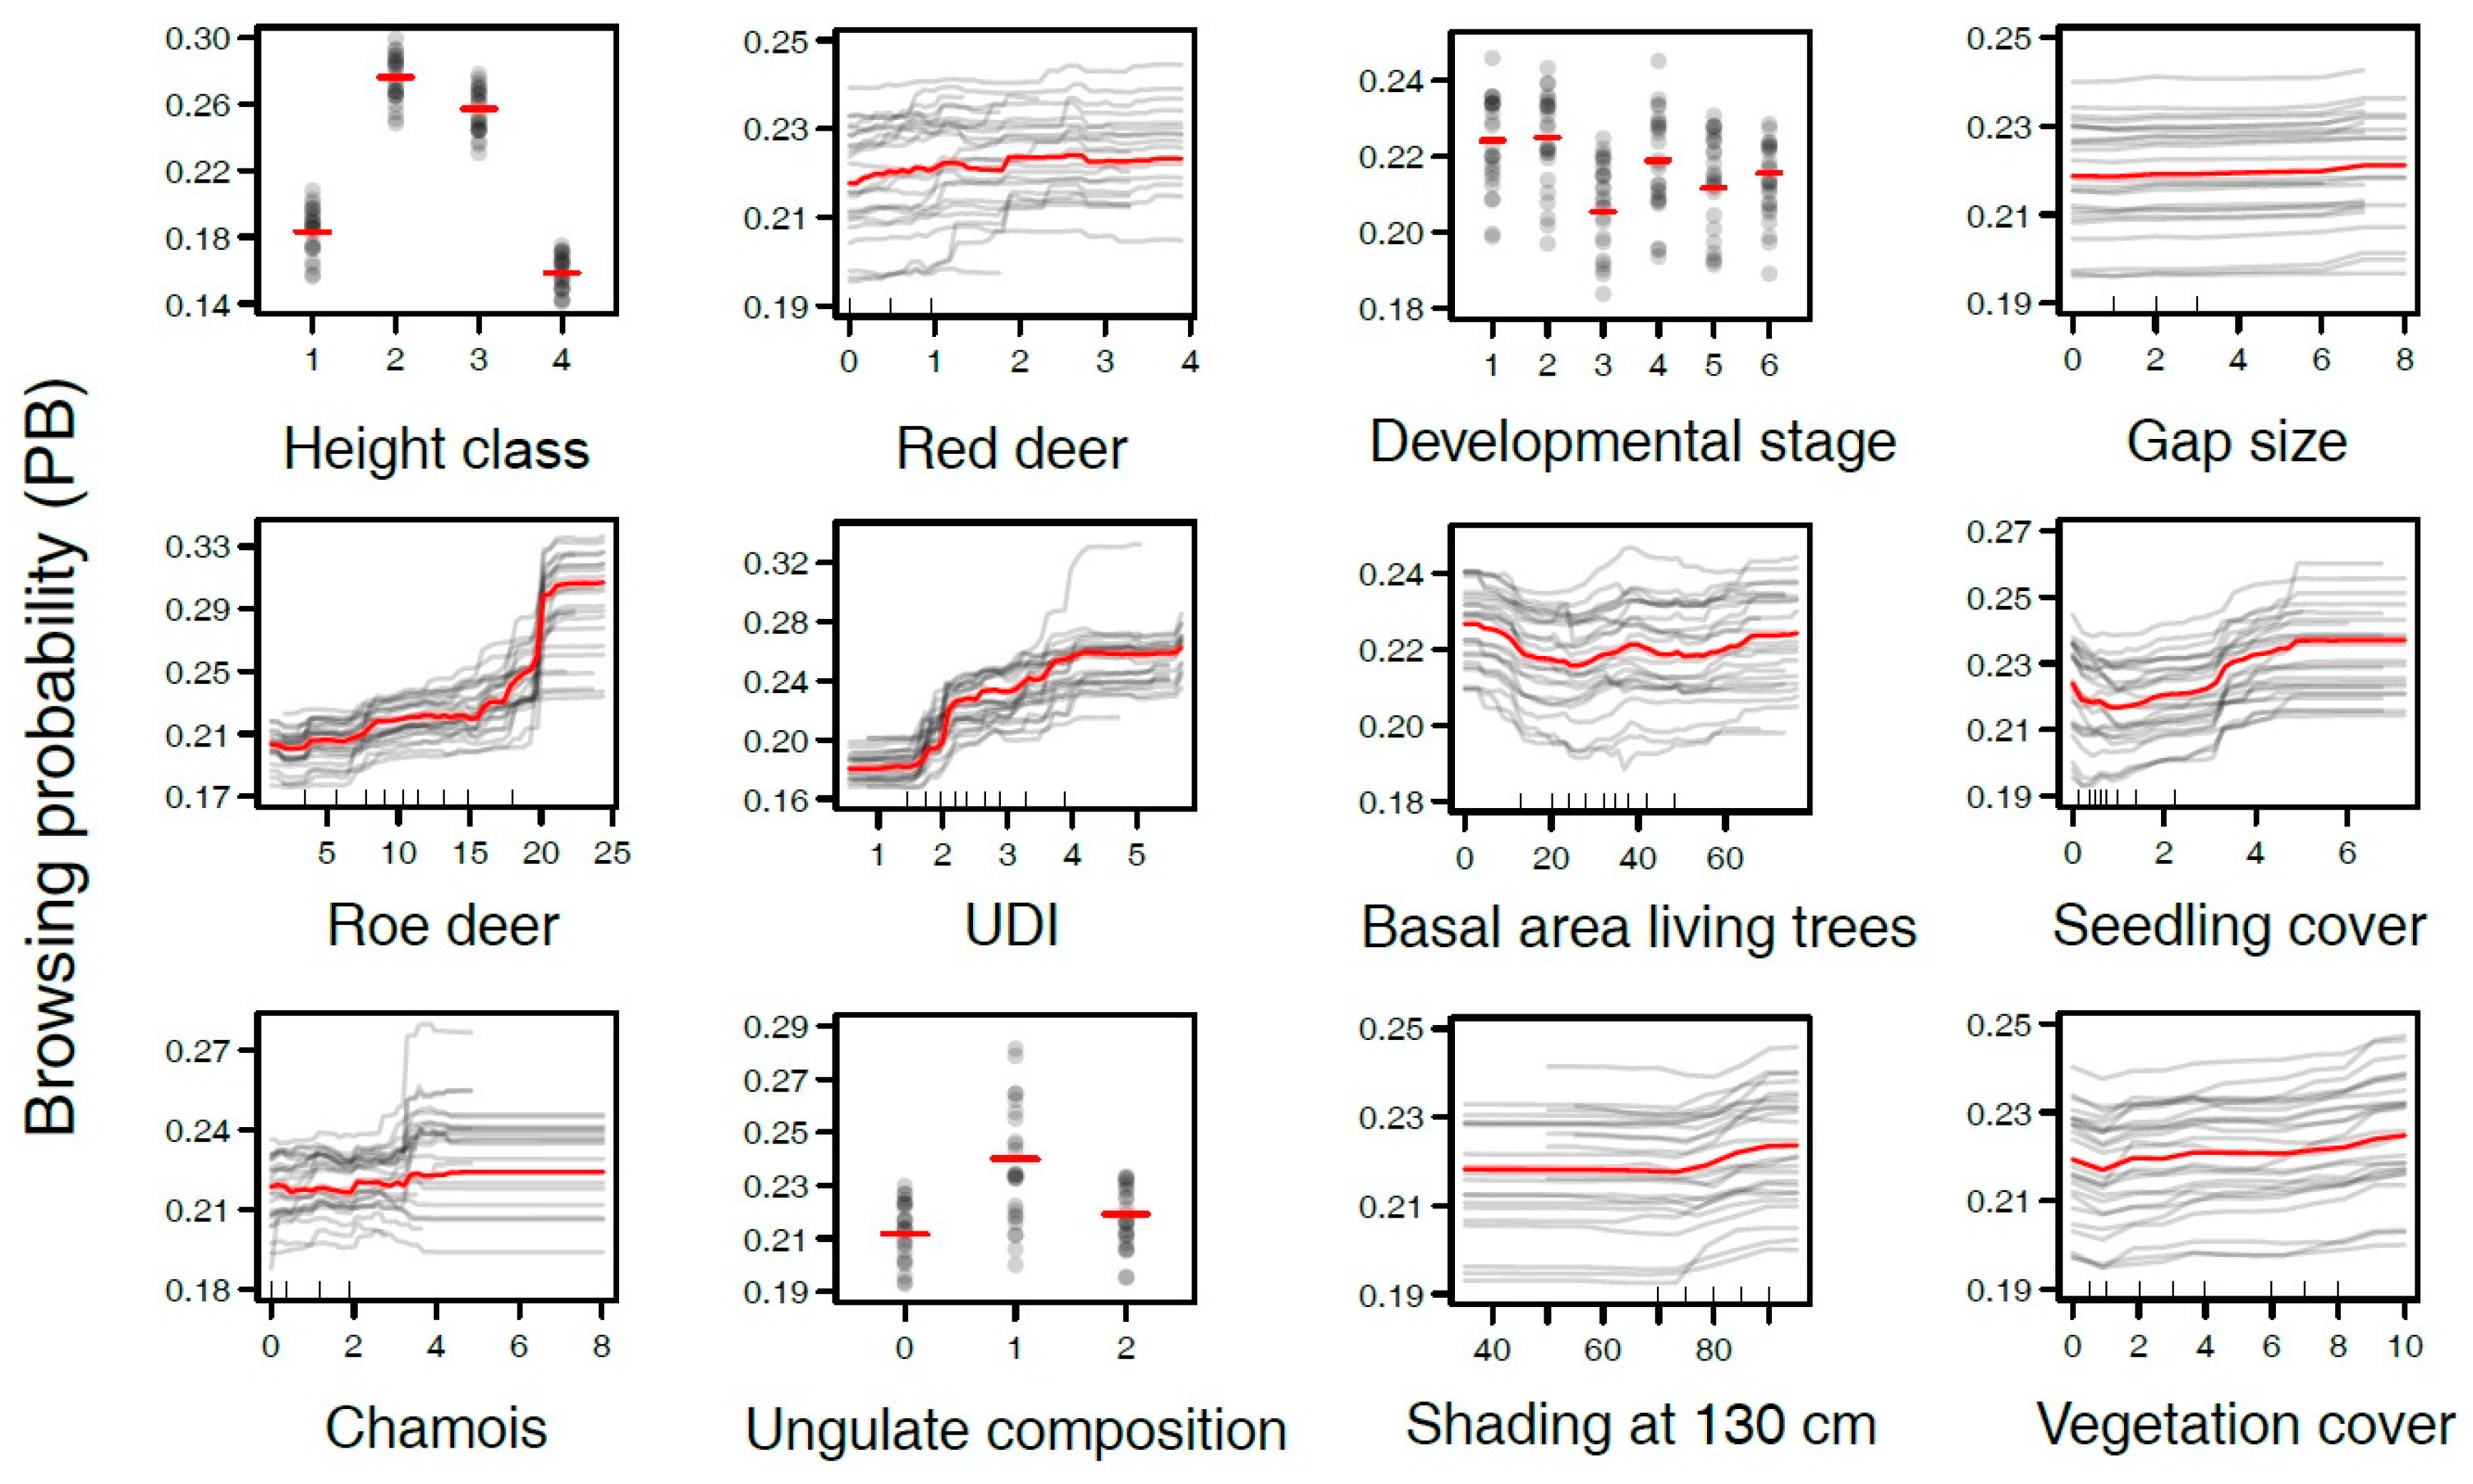
3.2. Variables Influencing Browsing Probability

For the six tree species, a similar set of variables was important for predicting PB (Figure 4), and their marginal effects on PB showed common patterns (Figure 5 for selected variables for Abies, Supplementary Figures S3–S9 for all variables and species). For the rarely browsed species Picea and Fagus (Figure 3), all variables showed a lower variable importance compared with Abies and the other more frequently browsed deciduous species (Figure 4). There were also smaller differences in the marginal effects on PB (Supplementary Figures S3–S9). This can be explained by the fewer strata with high browsing probabilities (cf. Figure 2).
The results were confirmed by both sensitivity analyses. The analysis conducted with the 18 explanatory variables available for all 49 IAs (cf. Appendix A Table A1, but with UDI excluded) showed similar patterns for predictive importance (Supplementary Figure S10) and marginal effects (not shown). The random forest models that accounted for the uncertainty of PB—by including weights relative to the precision of the PB estimates of the mixed effects logistic regression—yielded almost the same variable importance (Supplementary Figure S11) and marginal effects (Supplementary Figures S12 and S13) as the main model.
The proximal variables height class and year had the largest or second largest predictive importance for five of the six species. Medium height classes were clearly associated with higher PB (Figure 5 and Supplementary Figure S3). The effect of year may be seen as a surrogate for unobserved time-dependent variation.

3.3. Is Browsing on Tree Seedlings Positively Correlated with the Density of Ungulates?

Among the distal variables, the ungulate density index (UDI) and the approximated roe deer density were important predictors (Figure 4) and had a positive effect on PB for all species (Figure 5 and Supplementary Figure S6). PB increased almost linearly within the common range of approximated roe deer densities (between the first and ninth decile, Figure 5 and Supplementary Figure S6). The effect of chamois and of red deer was similar but weaker. The effect of UDI was similar for all height classes, as indicated by the joint marginal effects of UDI and height class (Supplementary Figure S14). Roe deer was also among the most important variables in all random forests conducted with the 18 explanatory variables (cf. Appendix A Table A1, but with UDI excluded) available for all 49 IAs (Supplementary Figure S10).

3.4. Does Browsing on Tree Seedlings Depend on Ungulate Species?

In contrast to UDI, ungulate composition was not among the most important variables (Figure 4 and Supplementary Figure S10 for all 49 IAs), but PB was always smallest if only roe deer was present (category 0 in Figure 5 and Supplementary Figure S6). Subset analysis for observations with roe deer only (category 0) compared to observations with some additional red deer and chamois (categories 1 and 2 for less or more than 5% of roe deer, respectively) revealed almost the same marginal effects, just at lower PB values for roe deer only (Supplementary Figure S15). The difference between only roe deer and few other animals reached ≥10% of PB for Abies, Acer, Fraxinus and Sorbus (Supplementary Figure S15). Furthermore, UDI had slightly higher power to explain variation in PB than roe deer density for almost all tree species (Figure 4) and PB increased more strongly in dependence of UDI than of roe deer density (Figure 5 and Supplementary Figure S6).

3.5. Is Browsing on Tree Seedlings Increased in Early Developmental Stages?

Developmental stage was an important predictor (Figure 4 and Supplementary Figure S10 for all 49 IA). PB tended to be highest in the young growth and thicket stage and lowest in small timber tree or multi-layered stands for all species (cf. developmental stage based on aerial imagery, Supplementary Figure S5, or assessed in the field data collection 2012, Figure 5 and Supplementary Figure S7). Stands dominated by medium and large timber trees, which had higher basal area (36.9 ± 12.1 m2, mean ± standard error) than stands in other developmental stages (25.2 ± 13.2 m2), had higher PB than stands of small timber trees in most species. PB often reached a minimum at an intermediate basal area (Figure 5), except in Acer, where higher basal areas were related to lower PB (Supplementary Figure S7).

3.6. Does Browsing on Tree Seedlings Differ between Gaps and Closed Canopy Stands?

Light variables were not among the most important variables (Figure 4) and no marked effects could be observed, in particular none related to gap size (Figure 5 and Supplementary Figure S7). The joint marginal effects of gap size and seedling height class did not provide evidence for an interaction, indicating that this effect was similar for all height classes. Only for the shade- or moderately shade-tolerant species Abies, Picea, Acer and Fagus [54], did PB tend to increase in closed stands (>80% canopy shading, variable ‘shading at 130 cm’, Figure 5 and Supplementary Figure S7).

3.7. Does the Presence of Stumps, Snags and Lying Logs Enhance the Probability of a Seedling to be Browsed?

Basal area of stumps and dead trees (snags and lying logs) was not among the most important variables (Figure 4). PB tended to increase with both the number of stumps and dead trees for Abies and Picea, whereas no change or rather a small decrease was observed for the other species (Supplementary Figure S8). However, the threshold-like increase for Abies (and partly for Picea and Acer) at high basal areas of stumps and dead trees was only observed for a few plots (much less than 10% of the data and not in all 25 resamples) and may have been caused by windthrow or logging.

3.8. Do the Cover of Tree Seedlings and Ground Vegetation Affect Browsing on Tree Seedlings?

Important variables explaining variation in PB were seedling and vegetation cover (Figure 4), although the effect size was very small (Figure 5, Supplementary Figures S8 and S9). Increasing seedling cover seemed to be related to decreasing PB at low densities and with the opposite or only small effects thereafter (Supplementary Figures S5 and S8). Vegetation cover was associated with increasing PB in all tree species (Figure 5 and Supplementary Figure S9), a trend also observed for the cover by individual vegetation types (e.g., blackberry, raspberry, ferns, graminoids, perennial herbs, blueberry and shrubs, Supplementary Figure S9).

4. Discussion

4.1. Browsing Is a Multifactorial Phenomenon

Using a large dataset from 49 forest areas (indicator areas) assessed over 10–16 years, we studied the simultaneous effects of many variables on the probability of ungulate browsing on seedlings of six tree species in Central Europe. Browsing turned out to be a multifactorial phenomenon. None of the explanatory variables alone had a large effect on browsing. The browsing probability varied by a few percent only if one specific variable changed.
However, two sensitivity analyses demonstrated the robustness of the results: the reduction in the dataset caused by the incomplete field data collection in 2012 did not introduce a detectable bias (Supplementary Figure S10) and neglecting the uncertainty in PB hardly influenced the results of the random forest models (Supplementary Figures S11–S13).
In our discussion, we will focus on the six research questions, although our models showed that further factors also influence PB, for example, the proximate driver’s height class (with medium-sized seedlings being more frequently browsed) and year. As tree seedlings of all species will need to grow through all height classes to survive, we think that a discussion on at which stage they are affected by browsing is not of major interest. The large influence of the factor ‘year’ probably results from the fact that most of our variables were not available on a yearly basis (e.g., local climate variables), meaning that year is very likely a surrogate for yearly changes not captured by any covariate.

4.2. Is Browsing on Tree Seedlings Positively Correlated with the Density of Ungulates?

Our analysis shows browsing to be more frequent if ungulate densities (approximated with the number of roe, red deer and chamois culled by hunting or found dead for other reasons) are higher. Likewise, the incidence of leader browsing by deer was positively associated with an index of deer density at the site scale [55] or with deer presence at the plot scale [15,30]. In addition, Hothorn et al. [56] showed that the risk of deer-vehicle collisions is positively correlated to browsing intensity and to harvest numbers of ungulates.
The ungulate density variables and PB were within the frequently observed densities linearly related. Just at very high roe deer densities (more than 20 deaths km−2), a steep increase of browsing was observed (see Abies in Figure 5). This might reflect an increased use of tree seedlings due to competition for limited resources if roe deer is abundant. However, high densities were scarce (less than 10%) in our data and the uncertainty of the marginal effects was large.
It has to be kept in mind that browsing is species-specific. A certain number of ungulates (in our study, for example, ca. 18 dead roe deer per km2) still cause occasional browsing on Picea or Fagus seedlings but can already lead to browsing of every fourth Abies and/or every third Sorbus seedling. This strong species preference may explain why in some studies with high ungulate levels, a hunting increase does not reduce browsing on the preferred species [36]. The relationships between ungulate abundance and browsing on different tree species are certainly not running in parallel.

4.3. Does Browsing on Tree Seedlings Depend on Ungulate Species?

We found higher browsing if not only roe deer but also red deer and/or chamois were present. This suggests that not only the density but also the composition of the ungulates influences the level of browsing. Onderscheka et al. [57] found more remains of coniferous trees in the stomach of red deer and chamois than in that of roe deer in the Principality of Liechtenstein, which borders our study area. In a study in the Swiss Prealps, red deer and chamois were filmed while browsing on leader shoots of tree seedlings in winter quite often, but roe deer only occasionally [58]. This was induced by seasonal shifts, as roe deer moved to lower elevations over the winter. These findings suggest that at least at certain sites, red deer and chamois browse more frequently on leader shoots than roe deer. However, ungulate diets vary largely between forest sites [4,22], and interactions between ungulate species that co-occur in an area can alter their browsing behavior [13]. We cannot exclude the alternative explanation that the roe deer in our indicator areas with multiple ungulate species browse more often on tree seedlings than do roe deer without competitors. That is, diverse ungulate assemblages could lead to more browsing on low-quality resources.
Browsing and ungulate density were more closely related for roe deer than for red deer or chamois. Indeed, roe deer occurred in all our indicator areas, and their densities covered a wider range. Thus, the roe deer effect might just have been easier to detect. More specialized studies based on DNA marker technology are needed to provide insight into which ungulate species is really browsing on tree seedlings [59,60]. This can facilitate effective targeting of management interventions when dealing with multiple ungulate communities [61].

4.4. Is Browsing on Tree Seedlings Increased in Early Developmental Stages?

Browsing was more frequent in young growth and thicket stands than in those dominated by small timber trees. However, the browsing probability was also high in stands dominated by medium or large timber trees. This may also explain why PB often reached a minimum at an intermediate basal area. We therefore have no clear evidence to support high browsing probabilities in early developmental stages. Young growth stands and thickets may not be particularly prone to browsing, whereas stands dominated by small timber trees often have little regeneration and are unattractive for ungulates.
Multi-layered stands were rare in our data but tended to have low browsing probabilities. Yet, multi-layered continuous forests are attractive habitats for ungulates [62] and are supposed to be more predisposed to silvicultural damage caused by browsing compared to other silvicultural systems [63]. Low regeneration density with a high proportion of Abies (which is more frequently browsed than Picea), rather than excessive browsing per se, might result in the supposedly high browsing damage in such stands (see also Reference [64]). Indeed, we found positive examples in Switzerland, where natural regeneration of Abies could grow up again well through ungulate browsing, almost exclusively in such multi-layered stands [65].

4.5. Does Browsing on Tree Seedlings Differ between Gaps and Closed Canopy Stands?

We did not find a clear and important association of browsing and canopy characteristics, in particular not for gap size, but seedlings in dark stands with canopy openness < 15–20% tended to be browsed more frequently. This is in agreement with studies where browsing was similar in logged windthrow gaps and adjacent forest stands [66] and along the whole gradient in between [21], or with a study in which more ungulate browsing occurred in very dark stands and more mice browsing in open conditions [34]. Similarly, but in a more pronounced way, ungulate browsing decreased with an increase in direct light [67] or was less frequent in uncleared windthrow gaps than in adjacent forest stands [26,68]. However, the relationship between PB and light is a matter of debate, as also the contrary was found. For example, the visitation frequency of ungulates was higher in gaps than in closed mature stands [69], and seedlings in gaps were therefore more frequently browsed [25]. Ungulates may select gaps if stands with high visual protection are located nearby [70], but avoid them in case of too much snow [34,71]. While our study is based on a large set of longitudinal data, detecting gap effects on browsing was probably difficult since they are often overruled by other factors such as surrounding stands or snow cover [72].

4.6. Does the Presence of Stumps, Snags and Lying Logs Enhance the Probability of a Seedling to Be Browsed?

The amount of fresh coarse woody debris (CWD; measured as basal area of snags, stumps and lying logs) neither had an important nor the same effect on PB of all tree species. Both coniferous species tended to be more frequently browsed with higher amounts of CWD. This trend is in line with a montane Picea abies snag stand, where earlier snow melt underneath or close to logs lead to seedlings in such microsites being browsed more often than seedlings distant to logs [29]. Similarly, in another study, the presence of woody debris increased deer browsing and reduced the abundance of Abies alba and Quercus spp. regeneration [28].
We found no clear interaction between snags, logs or stumps and the browsing probability in deciduous tree species. This is in agreement to findings in the Białowieża National Park outside the core area of wolves [73]. Inside the wolf core area, browsing intensity was reduced if the amount of CWD increased, suggesting that CWD can act as an ‘ungulate escape impediment’ [73]. Generally, CWD may act less as an obstacle for chamois and roe deer than for red deer [68]. Thus, the effect of logs and stumps on browsing seems to depend on several factors, including snow melt, predator presence and ungulate species, and definitively needs further research attention.

4.7. Do the Cover of Seedlings and Ground Vegetation Affect Browsing on Tree Seedlings?

Ungulate browsing tended to be more frequent if alternative food was available, i.e., if vegetation cover was higher. Browsing is generally assumed to be particularly high if palatable understory vegetation, like blackberry and raspberry, or seedlings of selected tree species are present [17,20]. However, we found the same pattern for all seven analyzed vegetation categories, although the importance ranks differed between tree species and vegetation categories.
Generally, seedlings are most easily detected and browsed in short ground vegetation, i.e., if they protrude over it [26,74]. Therefore, a dense and tall shrub layer of raspberry or ferns may reduce browsing compared to microsites dominated by mosses [29]. In heterogeneous stands, Rubus and other ground vegetation may vary in size and mask any effects of its quantity or quality on the level of browsing [20,21,23]. The height of the ground vegetation may partially explain the higher PB of medium-sized seedlings in comparison to small ones in our study, as the former standout of the vegetation for the whole year.
The connection between the presence of tree seedlings and browsing seems even less obvious. At low seedling cover, browsing tended to decrease with increasing cover, but at higher seedling cover, almost no effect or even the opposite was observed. In country-wide forest inventories in Austria and Switzerland, in which most plots contain only very few seedlings, the more browsing was found, the fewer seedlings were present [75,76]. In contrast, the incidence of conifer leader browsing by roe deer was positively associated with seedling density in plantation forests in England [55]. The relationship between browsing and seedling density may therefore indeed be curvilinear with much browsing at sites with very little regeneration, but also at sites with plenty of regeneration that stand out of the vegetation.

5. Conclusions

Quantifying ungulate densities via the numbers harvested and found dead by other causes within a certain forest area and period is a simple method frequently used in wildlife management in Switzerland. This approximation turned out to be highly positively correlated with the browsing probability (PB) for six frequent tree species in Switzerland. The ungulate density index (UDI, sensu [31]) that weighs different ungulate species had slightly higher explanatory power than single species densities. Moreover, sites in which some red deer and chamois were present had higher browsing on leader shoots than sites comprising only roe deer. Since the abundance of ungulates was one of the main factors influencing PB, focused hunting seems effective to reduce browsing in areas where tree regeneration is needed, in particular if applied over longer time spans, i.e., decades rather than just years [77].
However, browsing is a multifactorial phenomenon and ungulate density estimates alone only partly explain the variation in browsing probability. There are many other factors that also influence PB in tree seedlings of different tree species, including the important proximate driver’s height class (with medium-sized seedlings more frequently browsed) and year. Also, distal contextual drivers such as the developmental stage of the stand, its basal area, vegetation cover, seedling cover and perhaps light availability and coarse woody debris affect the incidence of leader shoot browsing. Tree seedlings in small timber stands with intermediate basal area, a canopy openness of >20%, low overall vegetation cover, medium seedling cover and low amounts of fresh woody debris were found to be less browsed on their leader shoot. Although we included a large variety of variables that may influence the probability of leader shoot browsing, we neglected some potential drivers, including all landscape and land use factors (such as fragmentation, juxtaposition of feeding and cover resources, distance to pathways and roads, housing or human population densities). These factors could further explain the differences between the 49 indicator areas.
In conclusion, this study supports and summarizes—based on an extensive long-term dataset—previous findings found in many singular studies. As the factors driving browse risk are related to both forest structure and ungulate impact, forest and wildlife management are both important and should be coordinated in order to reduce browsing impacts.

Supplementary Materials

The following are available online at https://www.mdpi.com/1999-4907/11/7/764/s1. Figure S1: Construction of canopy opening covariates, Figure S2: Distribution of the ungulate variables, Figure S3: Partial dependence plots with marginal effects of height class and year on browsing probability, Figure S4: Partial dependence plots with marginal effects of location and climate, Figure S5: Partial dependence plots with marginal effects of forest characteristics, Figure S6: Partial dependence plots with marginal effects of variables regarding ungulates, Figure S7: Partial dependence plots with marginal effects of location and light, Figure S8: Partial dependence plots with marginal effects of basal area and seedling cover, Figure S9: Partial dependence plots with marginal effects of vegetation cover, Figure S10: Variable importance in random forest with all plots of the 49 indicator areas, Figure S11: Variable importance in weighted random forests, Figure S12: Partial dependence plots in weighted random forests, Figure S13: Further partial dependence plots in weighted random forests, Figure S14: Joint marginal effects of UDI and height class on PB, Figure S15: Subset analyses for ungulate composition.

Author Contributions

Conceptualization, P.B., A.D.K. and A.S.; methodology, A.D.K., A.S. and P.B. for field work, L.B. and T.H. for analysis; software, L.B.; validation, L.B., A.D.K. and T.H.; formal analysis, L.B.; investigation, A.D.K., L.B. and A.S.; resources, A.D.K. and P.B.; data curation, L.B. and A.D.K.; writing—original draft preparation, A.D.K.; writing—review and editing, all authors; visualization, L.B.; supervision, A.S., P.B. and T.H.; project administration, P.B. and A.D.K.; funding acquisition, P.B. All authors have read and agreed to the published version of the manuscript.

Funding

The work of the first author was funded by the Bundesamt für Umwelt (Federal Office for the Environment) of Switzerland, doi 10.13039/501100003338, as part of the project ‘Auswirkung von Schalenwildverbiss auf Verjüngungsstrukturen: Analysen von Daten aus langjährigen Erhebungen auf Ebene Probeflächen’, contract No. 00.0138.PZ/K453-1046 (extension: N153-1062).

Acknowledgments

The source of all climate data was MeteoSwiss (Swiss Federal Office of Meteorology and Climatology). We would like to thank Dani Rüegg for the long-term coordination of the regeneration monitoring. We are grateful to the local foresters for collecting the data in their forest districts and to the cantonal authorities for providing ungulate and GIS data, and both for their competent assistance during the additional field data collection. The help of Stefan Fleck and Eva Hirsiger in field work in summer 2012, and of S. Dingwall for language revision is gratefully acknowledged.

Conflicts of Interest

The authors declare no conflict of interest.

Appendix A

Table A1. Summary of all explanatory variables. Categorical variables are presented as number and percentage of plots in each category, continuous variables as median, minimum (min), lower quartile (lq), upper quartile (uq), and maximum (max).
VariableCategory of Categorical Variablen (%) or Median (min, lq, uq, max)
Location (N = 1704)
CantonNidwalden (NW)31 (2%)
Obwalden (OW)31 (2%)
Schwyz (SZ)64 (4%)
St. Gallen (SG)1264 (74%)
Thurgau (TG)314 (18%)
Elevation above sea level (m) 825 (466, 687, 1115, 1641)
Slope (%) 27 (0, 16, 40, 130)
AspectNorth (N)835 (49%)
East (E)320 (19%)
West (W)250 (15%)
South (S)299 (18%)
Climate (N = 1704)
Annual precipitation (cm) 153 (95, 131, 192, 257)
Spring precipitation (cm) 41 (27, 38, 53, 72)
Annual temperature (°C) 8 (4, 6, 8, 10)
Degree day sum ≥ 5.56 °C (°C day) 1702 (869, 1364, 1856, 2130)
Forest characteristics (N = 1704)
Developmental stage (from aerial images)Young growth and thicket (1)350 (21%)
Polewood (2)228 (13%)
Dominated by small timber trees (3)200 (12%)
Dominated by medium timber trees (4)496 (29%)
Dominated by large timber trees (5)311 (18%)
Mixed stages (6)114 (7%)
Others (o)5 (0%)
Forest type 1 *Broad-leaved forest (bf)984 (58%)
Coniferous forest (cf)718 (42%)
Forest type 2 *Acer-Fraxinus-Tilia (aft)133 (8%)
Fagus (f)851 (50%)
Abies-Fagus (af)518 (30%)
Abies-Picea (ap)200 (12%)
Soil humidity *Dry (1)34 (2%)
Semi-moist (2)799 (47%)
Moist (3)656 (39%)
Wet (4)152 (9%)
Variable (v)61 (4%)
Soil acidity *Limestone debris (ld)89 (5%)
Basic (b)267 (16%)
Neutral (n)1064 (63%)
Acidic (a)282 (17%)
Productivity (timber yield) *Low (1)46 (3%)
Moderate (2)178 (10%)
High (3)701 (41%)
Very high (4)777 (46%)
Ungulates (N = 379)
Roe deer (deaths per year and km2 of forested area) 9 (0, 6, 14, 24)
Red deer (deaths per year and km2 of forested area) 0 (0, 0, 0, 4)
Chamois (deaths per year and km2 of forested area) 0 (0, 0, 1, 8)
Ungulate density index (UDI) 2 (0, 2, 3, 6)
Ungulate composition †No red deer + no chamois (0)17 (35%)
Red deer + chamois < 5% roe deer (1)11 (22%)
Red deer + chamois ≥ 5% roe deer (2)21 (43%)
Field data collected 2012 (N = 660)
ReliefFlat (1)147 (22%)
Crest (2)58 (9%)
Hillside (3)407 (62%)
Depression/hillside toe (4)39 (6%)
other (5)9 (1%)
Developmental stageYoung growth and thicket (1)99 (15%)
Polewood (2)69 (10%)
Dominated by small timber trees (3)122 (18%)
Dominated by medium timber trees (4)290 (44%)
Dominated by large timber trees (5)65 (10%)
Mixed stages (6)15 (2%)
Shading at 40 cm above ground (%) 80 (50, 75, 85, 95)
Shading at 130 cm above ground (%) 80 (35, 75, 85, 95)
Gap size (approximated from treetop openings) 0 (0, 0, 1, 8)
Snow depth (approximated from treetop openings) 0 (0, 0, 0, 6)
Light transmittance (approximated from treetop openings) 0 (0, 0, 2, 23)
Basal area of living trees (m2 ha−1) 32 (0, 20, 40, 77)
Basal area of stumps (m2 ha−1) 0 (0, 0, 4, 41)
Basal area of snags and lying logs (m2 ha−1) 0 (0, 0, 0, 13)
Regeneration constraint (paths, rocks, stems) (Londo scale) 0 (0, 0, 0, 6)
Seedling cover (Londo scale) 1 (0, 0, 1, 7)
Vegetation cover (without trees, shrubs, mosses) (Londo scale) 3 (0, 1, 6, 10)
Cover by blackberry (Rubus fruticosus) (Londo scale) 0 (0, 0, 2, 9)
Cover by raspberry (Rubus idaeus) (Londo scale) 0 (0, 0, 0, 5)
Cover by ferns (Londo scale) 0 (0, 0, 1, 9)
Cover by graminoids (Londo scale) 0 (0, 0, 1, 8)
Cover by perennial herbs (Londo scale) 0 (0, 0, 0, 4)
Cover by blueberry (Vaccinium) (Londo scale) 0 (0, 0, 0, 9)
Cover by shrubs (Londo scale) 0 (0, 0, 0, 8)
* Two sampling areas with missing data. † Ungulate composition takes ungulate data over the whole observation period into account, N = 49.
Table A2. Number of observed seedlings by species and height class in the long-term data collection in 49 indicator areas (IA) with 1704 plots.
10–40 cm
(Height Class 1)
41–70 cm
(Height Class 2)
71–100 cm
(Height Class 3)
101–130 cm
(Height Class 4)
NNbr%brNNbr%brNNbr%brNNbr%br
Abies31,282667521%5042168333%159235622%93310311%
Picea30,27113254%86506167%41333077%23441637%
Acer44,48411,83827%9770496151%2901125143%130135127%
Fagus37,102361710%10,471152915%542169713%3712658%
Fraxinus30,978723223%10,293452044%3829159242%197247424%
Sorbus13,842476834%5184269452%2071113655%102745945%
Quercus44116337%926267%241667%23730%
Other broad-leaved trees3176105733%157467543%77828437%55214226%
Other coniferous trees67612018%1502617%6235%5436%
Total192,25236,79519%51,22616,76633%20,811564227%11,577196717%
N: total number of seedlings, Nbr: number of browsed seedlings, %br: percentage of browsed seedlings.
Table A3. Summary of the mixed effects logistic regression for estimation of browsing probability based on 433,152 observations.
Fixed EffectsOdds Ratio (95% CI)
Height class
10–40 cmreference
41–70 cm1.92 (1.63–2.25)
71–100 cm1.59 (1.34–1.88)
101–130 cm0.73 (0.61–0.87)
Species
Acerreference
Abies0.52 (0.39–0.68)
Picea0.04 (0.03–0.05)
Fagus0.19 (0.15–0.25)
Fraxinus1.06 (0.80–1.40)
Quercus3.16 (2.02–4.95)
Sorbus1.30 (0.98–1.73)
Other broad-leaved trees1.33 (0.99–1.80)
Other coniferous trees0.30 (0.20–0.46)
Year
19951.16 (0.79–1.71)
19960.94 (0.64–1.39)
19970.75 (0.51–1.11)
19980.95 (0.64–1.40)
19990.47 (0.32–0.69)
20000.24 (0.17–0.35)
20010.37 (0.25–0.53)
20020.29 (0.20–0.41)
20030.35 (0.24–0.51)
20040.32 (0.22–0.46)
20050.32 (0.22–0.47)
20060.24 (0.17–0.34)
20070.20 (0.13–0.29)
20080.25 (0.18–0.36)
20090.28 (0.19–0.41)
20100.34 (0.24–0.49)
20110.23 (0.15–0.35)
Random effectsNVariance
IA490.602
IA:plot17040.057
Species:IA:plot13,6320.679
Year:IA:plot13,5360.635
Height class:IA:plot68160.246
Species:year1460.053
Species:height class360.020
Year:height class680.005
Fixed effects are presented as odds ratio with 95% confidence intervals (95% CIs), random effects with the number of strata (N) and the variances.

References

  1. Coté, S.D.; Rooney, T.P.; Tremblay, J.-P.; Dussault, C.; Waller, D.M. Ecological impacts of deer overabundance. Annu. Rev. Ecol. Evol. Syst. 2004, 35, 113–147. [Google Scholar]
  2. Putman, R.J. Ungulates in temperate forest ecosystems: Perspectives and recommendations for future research. For. Ecol. Manag. 1996, 88, 205–214. [Google Scholar] [CrossRef]
  3. Tixier, H.; Duncan, P. Are European roe deer browsers? A review of variations in the composition of their diets. Revue D’écologie 1996, 51, 3–17. [Google Scholar]
  4. Gebert, C.; Verheyden-Tixier, H. Variations of diet composition of red deer (Cervus elaphus L.) in Europe. Mammal. Rev. 2001, 31, 189–201. [Google Scholar] [CrossRef]
  5. Onderscheka, K.; Reimoser, F.; Völk, F.; Tataruch, F.; Steineck, T.; Klansek, E.; Zandl, J. Integrale Schalenwildhege im Rätikon unter besonderer Berücksichtigung der Walderhaltung; Forschungsinstitut für Wildtierkunde der Veterinärmedizinischen Universität Wien: Wien, Austria, 1990; p. 410. [Google Scholar]
  6. Apollonio, M.; Andersen, R.; Putman, R. European Ungulates and their Management in the 21th Century; Cambridge University Press: Cambridge, UK, 2010; p. 604. [Google Scholar]
  7. Hofmann, R.R. Evolutionary steps of ecophysiological adaptation and diversification of ruminants: A comparative view of their digestive system. Oecologica 1989, 78, 449–457. [Google Scholar] [CrossRef]
  8. Johnson, D.H. The comparison of usage and availability measurements for evaluating resource preference. Ecology 1980, 61, 65–71. [Google Scholar] [CrossRef]
  9. Gill, R.M.A. A review of damage by mammals in north temperate forests: 1. Deer. For. 1992, 65, 145–169. [Google Scholar] [CrossRef] [Green Version]
  10. Kupferschmid, A.D.; Heiri, C.; Huber, M.; Fehr, M.; Frei, M.; Gmür, P.; Imesch, N.; Zinggeler, J.; Brang, P.; Clivaz, J.-C.; et al. Einfluss wildlebender Huftiere auf die Waldverjüngung: Ein Überblick für die Schweiz. Schweiz. Z. Forstwes 2015, 166, 420–431. [Google Scholar] [CrossRef]
  11. Abegg, M.; Brändli, U.B.; Cioldi, F.; Fischer, C. Viertes Schweizerisches Landesforstinventar—Ergebnistabellen und Karten im Internet zum LFI 2009–2013 (LFI4b); Eidgenössische Forschungsanstalt WSL: Birmensdorf, Switzerland, 2014; Available online: http://www.lfi.ch/resultate/ (accessed on 15 July 2020).
  12. Kupferschmid, A.D. Compensation capacity of Central European tree species in response to leader shoot browsing. In Ungulates: Evolution, Diversity and Ecology; Menendez, A., Sands, N., Eds.; Nova Science Publishers: Hauppauge, NY, USA, 2017; pp. 1–63. [Google Scholar]
  13. Gordon, I.J. Facilitation of red deer grazing by cattle and its impact on red deer performance. J. Appl. Ecol. 1998, 25, 1–10. [Google Scholar] [CrossRef]
  14. Barbosa, P.; Hines, J.; Kaplan, I.; Martinson, H.; Szczepaniec, A.; Szendrei, Z. Associational resistance and associational susceptibility: Having right or wrong neighbors. Annu. Rev. Ecol. Evol. Syst. 2009, 40, 1–20. [Google Scholar] [CrossRef] [Green Version]
  15. Welch, D.; Staines, B.W.; Scott, D.; French, D.D.; Catt, D.C. Leader browsing by red and roe deer on young Sitka spruce trees in Western Scotland (UK): I. Damage rates and the influence of habitat factors. Forestry 1991, 64, 61–82. [Google Scholar] [CrossRef]
  16. Baraza, E.; Zamora, R.; Hódar, J.A. Conditional outcomes in plant–herbivore interactions: Neighbours matter. Oikos 2006, 113, 148–156. [Google Scholar] [CrossRef]
  17. Heikkilä, R.; Härkönen, S. Moose browsing in young Scots pine stands in relation to forest management. For. Ecol. Manag. 1996, 88, 179–186. [Google Scholar] [CrossRef]
  18. Smit, C.; Vandenberghe, C.; Ouden, J.D.; Müller-Schärer, H. Nurse plants, tree saplings and grazing pressure: Changes in facilitation along a biotic environmental gradient. Oecologia 2007, 152, 265–273. [Google Scholar] [CrossRef]
  19. Partl, E.; Szinovatz, V.; Reimoser, F.; Schweiger-Adler, J. Forest restoration and browsing impact by roe deer. For. Ecol. Manag. 2002, 159, 87–100. [Google Scholar] [CrossRef]
  20. Moser, B.; Schütz, M.; Hindenlang, K. Importance of alternative food resources for browsing by roe deer on deciduous trees: The role of food availability and species quality. For. Ecol. Manag. 2006, 226, 248–255. [Google Scholar] [CrossRef]
  21. Kupferschmid, A.D.; Zimmermann, S.; Bugmann, H. Browsing regime and growth response of naturally regenerated Abies alba saplings along light gradients. For. Ecol. Manag. 2013, 310, 393–404. [Google Scholar] [CrossRef]
  22. Cornelis, J.; Casaer, J.; Hermy, M. Impact of season, habitat and research techniques on diet composition of roe deer (Capreolus capreolus): A review. J. Zool. 1999, 248, 195–207. [Google Scholar] [CrossRef]
  23. Bergquist, J.; Örlander, G. Browsing damage by roe deer on Norway spruce seedlings planted on clearcuts of different ages: 1. Effect of slash removal, vegetation development, and roe deer density. For. Ecol. Manag. 1998, 105, 283–293. [Google Scholar] [CrossRef]
  24. Widmer, O.; Saïd, S.; Miroir, J.; Duncan, P.; Gaillard, J.M.; Klein, F. The effects of hurricane Lothar on habitat use of roe deer. For. Ecol. Manag. 2004, 195, 237–242. [Google Scholar] [CrossRef]
  25. Reyes, G.; Vasseur, L. Factors influencing deer browsing damage to red spruce (Picea rubens) seedlings in coastal red spruce-balsam fir stands of southwestern Nova Scotia. For. Ecol. Manag. 2003, 186, 349–357. [Google Scholar] [CrossRef]
  26. Moser, B.; Schütz, M.; Hindenlang, K. Resource selection by roe deer: Are windthrow gaps attractive feeding places? For. Ecol. Manag. 2008, 255, 1179–1185. [Google Scholar] [CrossRef]
  27. De Chantal, M.; Granström, A. Aggregations of dead wood after wildfire act as browsing refugia for seedlings of Populus tremula and Salix caprea. For. Ecol. Manag. 2007, 250, 3–8. [Google Scholar] [CrossRef]
  28. Pellerin, M.; Said, S.; Richard, E.; Hamann, J.-L.; Dubois-Coli, C.; Hum, P. Impact of deer on temperate forest vegetation and woody debris as protection of forest regeneration against browsing. For. Ecol. Manag. 2010, 260, 429–437. [Google Scholar] [CrossRef]
  29. Kupferschmid, A.D.; Bugmann, H. Effect of microsites, logs and ungulate browsing on Picea abies regeneration in a mountain forest. For. Ecol. Manag. 2005, 205, 251–265. [Google Scholar] [CrossRef]
  30. Voser, P. Einflüsse hoher Rothirschbestände auf die Vegetation im Unterengadin und im Münstertal, Kanton Graubünden; Band 16 Ergebnisse der wissenschaftlichen Untersuchungen im Schweizerischen Nationalpark; Herausgegeben von der Kommission der Schweizerischen Naturforschenden Gesellschaft zur wissenschaftlichen Erforschung des Nationalparks; Lüdin AG: Liestal, Switzerland, 1987; p. 78. [Google Scholar]
  31. Motta, R. Impact of wild ungulates on forest regeneration and tree composition of mountain forests in Western Italian Alps. For. Ecol. Manag. 1996, 88, 93–98. [Google Scholar] [CrossRef]
  32. Tremblay, J.-P.; Huot, J.; Potvin, F. Density-related effects of deer browsing on the regeneration dynamics of boreal forests. J. Appl. Ecol. 2007, 44, 552–562. [Google Scholar] [CrossRef]
  33. Boulanger, V.; Dupouey, J.L.; Archaux, F.; Badeau, V.; Baltzinger, C.; Chevalier, R.; Corcket, E.; Dumas, Y.; Forgeard, F.; Mårell, A.; et al. Ungulates Increase forest plant species richness to the benefit of non-forest specialists. Glob. Chang. Biol. 2018, 24, e485–e495. [Google Scholar] [CrossRef] [Green Version]
  34. Kupferschmid, A.D.; Wasem, U.; Bugmann, H. Light availability and ungulate browsing determine growth, height and mortality of Abies alba saplings. For. Ecol. Manag. 2014, 318, 359–369. [Google Scholar] [CrossRef]
  35. Prietzel, J.; Ammer, C. Mixed mountain forests of the Bavarian Limestone Alps: Reduction of ungulate density results not only in increased regeneration success but also in improved soil fertility. Allg. Forst Jagdz. 2008, 179, 104–112. [Google Scholar]
  36. Kamler, J.; Homolka, M.; Barančeková, M.; Krojerová-Prokešová, J. Reduction of herbivore density as a tool for reduction of herbivore browsing on palatable tree species. Eur. J. For. Res. 2010, 129, 155–162. [Google Scholar] [CrossRef]
  37. Graff, P.; Aguiar, M.R.; Chaneton, E.J. Shifts in positive and negative plant interactions along a grazing intensity gradient. Ecology 2007, 88, 188–199. [Google Scholar] [CrossRef]
  38. Odermatt, O. Ergebnisse aus Untersuchungen zum Wildtiereinfluss auf die Waldverjüngung in der Schweiz. Schweiz. Z. Forstwes. 2009, 160, 294–302. [Google Scholar] [CrossRef] [Green Version]
  39. Rüegg, D.; Nigg, H. Mehrstufige Verjüngungskontrollen und Grenzwerte für die Verbissintensität. Schweiz. Z. Forstwes. 2003, 154, 314–321. [Google Scholar] [CrossRef] [Green Version]
  40. Rüegg, D. Verjüngungskontrolle: Methoden Stichproben in Indikatorflächen; Deutscher Forstwirtschaftsrat e. V.: Kaltbrunn, Switzerland, 2008. [Google Scholar]
  41. Federal Office of Topography swisstopo. Swisstopo, Digital Height Model DHM25 is a Set of Data Representing the 3D Form of the Earth’s Surface without Vegetation and Buildings; Federal Office of Topography swisstopo: Wabern, Switzerland, 2015. [Google Scholar]
  42. Thornton, P.E.; Running, S.W.; White, M.A. Generating surfaces of daily meteorological variables over large regions of complex terrain. J. Hydrol. 1997, 190, 214–251. [Google Scholar] [CrossRef] [Green Version]
  43. Allen, J.C. Modified sine wave method for calculating degree days. Environ. Entomol. 1976, 5, 388–396. [Google Scholar] [CrossRef]
  44. Frehner, M.; Wasser, B.; Schwitter, R. Nachhaltigkeit und Erfolgskontrolle im Schutzwald. In Wegleitung für Pflegemassnahmen in Wäldern mit Schutzfunktion; Bundesamt für Umwelt, Wald und Landschaft: Bern, Switzerland, 2005; p. 564. [Google Scholar]
  45. Keller, M. (Ed.) Schweizerisches Landesforstinventar, Anleitung für die Feldaufnahmen der Erhebung 2004–2007; Eidg. Forschungsanstalt WSL: Birmensdorf, Switzerland, 2005; p. 393. [Google Scholar]
  46. Cary Institute of Ecosystem Studies. Gap Light Analyzer (GLA); Simon Fraser University, Cary Institute of Ecosystem Studies: Millbrook, NY, USA, 1999. [Google Scholar]
  47. Bitterlich, W. The Relascope Idea; Commonwealth Agricultural Bureaux: Farnham, UK, 1984. [Google Scholar]
  48. Londo, G. The decimal scale for releves of permanent quadrats. Vegetatio 1976, 33, 61–64. [Google Scholar] [CrossRef]
  49. Breiman, L. Random forests. Mach. Learn. 2001, 45, 5–32. [Google Scholar] [CrossRef] [Green Version]
  50. Neville, P.G. Controversy of variable Importance in random forests. J. Unified Stat. Tech. 2013, 1, 15–20. [Google Scholar]
  51. R Core Team. R: A Language and Environment for Statistical Computing; R Foundation for Statistical Computing: Vienna, Austria, 2014; Available online: http://www.R-project.org (accessed on 15 July 2013).
  52. Bates, D. Lme4: Linear Mixed-Effects Models Using Eigen and S4. R package, version 1.0-5. 2013. Available online: http://CRAN.R-project.org/package=lme4 (accessed on 15 July 2013).
  53. Liaw, A.; Wiener, M. Classification and Regression by RandomForest. R News 2002, 2, 18–22. [Google Scholar]
  54. Brzeziecki, B.; Kienast, F. Classifying the life- history strategies of trees on the basis of the Grimian model. For. Ecol. Manag. 1994, 69, 167–187. [Google Scholar] [CrossRef]
  55. Ward, A.I.; White, P.C.L.; Walker, N.; Critchley, C.H. Conifer leader browsing by roe deer in English upland forests: Effects of deer density and understorey vegetation. For. Ecol. Manag. 2008, 256, 1333–1338. [Google Scholar] [CrossRef]
  56. Hothorn, T.; Brandl, R.; Müller, J. Large-scale model-based assessment of deer-vehicle collision risk. PLoS ONE 2012, 7, e29510. [Google Scholar] [CrossRef] [Green Version]
  57. Onderscheka, K.; Reimoser, F.; Tataruch, F.; Steineck, T.; Klansek, E.; Völk, F.; Willing, R.; Zandl, J. Integrale Schalenwildbewirtschaftung im Fürstentum Liechtenstein unter besonderer Berücksichtigung Landschaftsökologischer Zusammenhänge; Naturkundliche Forschung im Fürstentum Liechtenstein: Vaduz, Liechtenstein, 1989; Volume 11, p. 265. [Google Scholar]
  58. Kupferschmid, A.D.; Wasem, U.; Bugmann, H. Ungulate browsing leads to height and diameter growth reduction on Abies alba saplings planted along light gradients. Eur. J. For. Res. 2015, 134, 75–87. [Google Scholar] [CrossRef]
  59. Nichols, R.V.; Königsson, H.; Danell, K.; Spong, G. Browsed twig environmental DNA: Diagnostic PCR to identify ungulate species: Browsed twig Environmental DNA. Mol. Ecol. Resour. 2012, 12, 983–989. [Google Scholar] [CrossRef] [PubMed]
  60. Schneider, M. Verbissnachweis Mittels Kriminaltechnologischer Methoden; Institut für Wildbiologie und Jagdwirtschaft (IWJ), Department für Integrative Biologie und Biodiversitätsforschung, Universität für Bodenkultur: Wien, Austria, 2017; p. 46. [Google Scholar]
  61. Calkoen, S.T.V.B.; Leigh-Moy, K.; Cromsigt, J.P.; Spong, G.; Lebeau, L.C.; Heurich, M. The blame game: Using eDNA to identify species-specific tree browsing by red deer (Cervus elaphus) and roe deer (Capreolus capreolus) in a temperate forest. For. Ecol. Manag. 2019, 451, 117483. [Google Scholar] [CrossRef]
  62. Bobek, B.; Boyce, M.S.; Kosobucka, m. Factors affecting red deer (Cervus elaphus) population density in southeastern Poland. J. Appl. Ecol. 1984, 21, 881–890. [Google Scholar] [CrossRef]
  63. Reimoser, F.; Gossow, H. Impact of ungulates on forest vegetation and its dependence on the silvicultural system. For. Ecol. Manag. 1996, 88, 107–119. [Google Scholar] [CrossRef]
  64. Brang, P.; Kupferschmid, A.D. Praxisrelevante Grundlagen: Walddynamik, in Wald und Wild—Grundlagen für die Praxis. Wissenschaftliche und methodische Grundlagen zum integralen Management von Reh, Gämse, Rothirsch und ihrem Lebensraum; Bundesamt für Umwelt BAFU: Bern, Switzerland, 2010; pp. 41–56. [Google Scholar]
  65. Bischof, T.; Thormann, J.J.; Zbinden, K.G.; Kupferschmid, A.D. Positive Beispiele der Wald-Wild-Situation bei der Weisstannenverjüngung. Schweiz. Z. Forstwesen. 2019, 170, 142–152. [Google Scholar] [CrossRef] [Green Version]
  66. Angst, C.; Bürgi, A.; Duelli, P.; Egli, S.; Heiniger, U.; Hindenlang, K.; Lässig, R. Waldentwicklung nach Windwurf in tieferen Lagen der Schweiz. Schlussbericht eines Projektes im Rahmen des Programms. In LOTHAR Evaluations-und Grundlagenprojekte; Eidg. Forschungsanstalt WSL: Birmensdorf, 2004; p. 98. [Google Scholar]
  67. Häsler, H. Impact of Browsing by Wild Ungulates on Growth and Regeneration of European Silver Fir. Ph.D. Thesis, Diss. ETH No. 179112008. University of Zürich, Zürich, Switzerland, 2008; p. 113. [Google Scholar]
  68. Jehl, H. Die Waldentwicklung auf Windwurfflächen im Nationalpark Bayerischer Wald. In 25 Jahre auf dem Weg zum Naturwald; Nationalparkverwaltung Bayerischer Wald, Ed.; Nationalparkverwaltung Bayerischer Wald: Neuschönau, Deutschland, 1995; pp. 112–146. [Google Scholar]
  69. Kuijper, D.P.J.; Cromsigt, J.; Churski, M.; Adam, B.; Jędrzejewska, B.; Jedrzejewski, W. Do ungulates preferentially feed in forest gaps in European temperate forest? For. Ecol. Manag. 2009, 258, 1528–1535. [Google Scholar] [CrossRef]
  70. Putman, R.J.; Moore, N.P. Impact of deer in lowland Britain on agriculture, forestry and conservation habitats. Mammal. Rev. 1998, 28, 141–164. [Google Scholar] [CrossRef]
  71. Stöckli, V. Die Bedeutung der winterlichen Schneedecke für junge Fichten im Gebirgswald: Ergebnisse aus dem Lusiwald bei Davos. Bauhinia 2002, 16, 23–32. [Google Scholar]
  72. Kuijper, D.P.J.; Cromsigt, J.P.G.M.; Jędrzejewska, B.; Miścicki, S.; Churski, M.; Jedrzejewski, W.; Kweczlich, I. Bottom-up versus top-down control of tree regeneration in the Białowieża Primeval Forest, Poland. J. Ecol. 2010, 98, 888–889. [Google Scholar] [CrossRef]
  73. Kuijper, D.P.J.; De Kleine, C.; Churski, M.V.; Van Hooft, P.; Bubnicki, J.; Jędrzejewska, B. Landscape of fear in Europe: Wolves affect spatial patterns of ungulate browsing in Białowieża Primeval Forest, Poland. Ecography 2013, 36, 1–13. [Google Scholar] [CrossRef]
  74. Kuijper, D.P.J.; De Kleine, C.; Churski, M.; Van Hooft, P.; Bubnicki, J.W.; Jędrzejewska, B. Liability of saplings to browsing on a red deer range in the Scottish Highlands. J. Appl. Eclol. 1982, 19, 941–951. [Google Scholar]
  75. Schwyzer, A.; Lanz, A. Verjüngungserhebung im schweizerischen Landesforstinventar. In Proceedings of the Internationale Biometrische Gesellschaft—Deutsche Region AG Ökologie und Umwelt. 22 meeting, Göttingen, Germany, 20–21 September 2010; pp. 42–67. [Google Scholar]
  76. Schweiger, J.; Sterba, H. A model describing natural regeneration recruitment of Norway spruce (Picea abies (L.) Karst.) in Austria. For. Ecol. Manag. 1997, 97, 107–118. [Google Scholar] [CrossRef]
  77. Didion, M.; Kupferschmid, A.D.; Bugmann, H. Long-term effects of ungulate browsing on forest composition and structure. For. Eco. Manag. 2009, 258, 44–55. [Google Scholar] [CrossRef]
Figure 1. Geographical position and altitude of the 49 indicator areas (IA). For orientation, the names of the large lakes and of the Rhine river are given. IAs included in the field data collection 2012 are marked with circles, those excluded with squares. The circular sampling plots were established only in forested areas (grey).
Forests 11 00764 g001
Figure 2. Probability of browsing estimated by mixed effects logistic regression (fitted values) compared to the observed proportion of browsing for each tree species. Each point represents an observation for a specific species, year, height class, IA and plot. The observed proportion of browsing was set to zero if it was undefined (i.e., if no seedling was observed).
Forests 11 00764 g002
Figure 3. Observed proportion of browsing on seedlings (a) and probability of browsing modelled with a mixed effects logistic regression (b). The values are averaged by tree species and either indicator area (left panels) or height class (right panels). Height class 1: 10–40 cm, 2: 41–70 cm, 3: 71–100 cm, 4: 101–130 cm. Missing values are indicated in grey.
Forests 11 00764 g003
Figure 4. Predictive permutation importance of each explanatory variable (variable importance) in tree species-specific random forest models for browsing probability. The variables are ordered according to decreasing importance in the Abies model. The ten most important variables for each tree species are shown as filled circles, the other variables as open circles.
Forests 11 00764 g004
Figure 5. Partial dependence plots with marginal effects of selected explanatory variables on browsing probability of Abies, as estimated by random forest models. Red lines are based on all data, grey lines are a measure for the variation among indicator areas (IAs) and were estimated from random resamples of 25 of the 40 IAs. Internal tick marks on the x-axes indicate deciles of continuous explanatory variables. Note that the scaling of the y-axis varies among the panels.
Forests 11 00764 g005

