Article

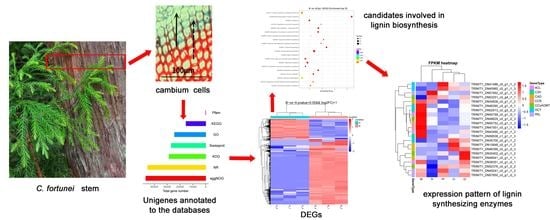
Transcriptomic Profiling of Cryptomeria fortunei Hooibrenk Vascular Cambium Identifies Candidate Genes Involved in Phenylpropanoid Metabolism

1
Key Laboratory of Forest Genetics and Biotechnology of Ministry of Education, Nanjing Forestry University, Nanjing 210037, China
2
Co-Innovation Center for Sustainable Forestry in Southern China, Nanjing Forestry University, Nanjing 210037, China
3
College of Forestry, Nanjing Forestry University, Nanjing 210037, China
*
Author to whom correspondence should be addressed.
Forests 2020, 11(7), 766; https://doi.org/10.3390/f11070766
Submission received: 1 July 2020 / Revised: 15 July 2020 / Accepted: 15 July 2020 / Published: 17 July 2020
(This article belongs to the Special Issue Genetics and Improvement of Forest Trees)

Abstract

:
Cryptomeria fortunei Hooibrenk (Chinese cedar) is a coniferous tree from southern China that has an important function in landscaping and timber production. Lignin is one of the key components of secondary cell walls, which have a crucial role in conducting water and providing mechanical support for the upward growth of plants. It is mainly biosynthesized via the phenylpropanoid metabolic pathway, of which the molecular mechanism remains so far unresolved in C. fortunei. In order to obtain further insight into this pathway, we performed transcriptome sequencing of the C. fortunei cambial zone at 5 successive growth stages. We generated 78,673 unigenes from transcriptome data, of which 45,214 (57.47%) were successfully annotated in the non-redundant protein database (NR). A total of 8975 unigenes were identified to be significantly differentially expressed between Sample_B and Sample_A after analyzing their expression profiles. Of the differentially expressed genes (DEGs), 6817 (75.96%) and 2158 (24.04%) were up- and down-regulated, respectively. 83 DEGs were involved in phenylpropanoid metabolism, 37 DEGs that encoded v-Myb avian myeloblastosis viral oncogene homolog (MYB) transcription factor (TF), and many candidates that encoded lignin synthesizing enzymes. These findings contribute to understanding the expression pattern of C. fortunei cambial zone transcriptome. Furthermore, our results provide additional insight towards understanding the molecular mechanisms of wood formation in C. fortunei.

Graphical Abstract

1. Introduction

The Cryptomeria genus consists of the species Cryptomeria fortunei Hooibrenk and Cryptomeria japonica (L.f.) D.Don (Japanese cedar). Cryptomeria fortunei Hooibrenk is an important coniferous timber species native to China. This species is a monoecious coniferous species which is widely planted in southern China due to its strong adaptability. C. fortunei has excellent properties that allow for efficient timber production, including a straight bole, soft texture, rapid growth, and ease of processing. Thus, its wood is widely used to construct wooden houses, barrels, and a large number of industrial materials. Additionally, as a photosynthesizing plant, C. fortunei is an important plant species in carbon storage and ecological restoration and is also a suitable landscaping tree due to its attractive appearance [1].
A transcriptome is a collection of all transcripts of a certain tissue or organ at a specific period or stage, including coding RNA and non-coding RNA. Based on transcriptome analysis, the molecular mechanisms of secondary growth have been elucidated in model plant [2]. In recent years, with rapid advances in RNA sequencing, it has been applied to non-model plants, for example, to develop simple sequence repeat (SSR) markers [3].
Lateral growth of tree stems occurs through cell divisions in the vascular cambium. Towards the inside, the cambium forms the secondary xylem, also called wood, while towards the outside, secondary phloem cells appear in the growing stem through the proliferation and differentiation. Wood formation is a complex biological process, including cambium cell division, cell extension, secondary cell wall formation, lignification, and finally, programmed cell death [4]. The formation of secondary cell walls is an important event during wood formation. Secondary cell walls are mainly composed of three polymers, lignin is one of the most important compounds that determine the properties of wood [5]. The main pathway of lignin biosynthesis is phenylpropanoid metabolism, which has been well described in Populus trichocarpa Torr. & A.Gray ex. Hook. [6] and Norway spruce [7]. However, the molecular mechanisms underlying this biosynthetic pathway are still uncertain in C. fortunei.
In plants, the phenylpropanoid metabolic pathway synthesizes a number of key components, including flavonoids, lignin, and others, all of which have been crucial for plants. Lignins contain 3 different components, all of which are synthesized into 3 monomers, including S-lignin, G-lignin, and H-lignin, respectively [8]. Lignins are mainly composed of G-H-lignin in conifers [9]. As a complex synthesis process, lignin biosynthesis can be roughly divided into 3 steps. Firstly, the synthesis of aromatic amino phenylalanine from photosynthetic assimilation products. Secondly, called phenylpropanoid metabolism, phenylalanine is synthesized into separate components, including phenylalanine ammonia-lyase (PAL), p-coumarate 3-hydroxylase (C3H), caffeoyl CoA O-methyltransferase (CCoAOMT), 4-(hydroxy) cinnamoyl CoA ligase (4CL). Thirdly, a specific metabolic pathway which contributes to lignin monomers biosynthesis, including enzymes such as cinnamoyl CoA reductase (CCR) and cinnamyl alcohol dehydrogenase (CAD) [10,11]. Lignins are polymerized from 3 monomers through laccase and peroxidase [9].
Previous reports have used transcriptomics to identify lignin biosynthetic genes in other woody plant species [7,12]. In this study, we conducted transcriptome sequencing of the C. fortunei cambial zone at 5 successive growth stages. Differentially expressed genes (DEGs) were identified and analyzed through analyzing the transcriptome data. Subsequently, we aimed to screen DEGs involved in phenylpropanoid metabolism and see how their expression levels would correlate to lignin deposition activity in C. fortunei. Our work lays the foundation for functionally elucidating the gene-regulated phenylpropanoid biosynthesis and molecular regulation of lignin biosynthesis in C. fortunei.

2. Materials and Methods

2.1. Plant Materials

We acquired the samples from C. fortunei trees, aged around 60 years, with no obvious presence of insect pests or disease, in the arboretum of Nanjing Forestry University, Nanjing City, Jiangsu Province, China. The exact dates of sampling were 4 April, 18 May, 10 July, 15 September, and 12 November in 2018, corresponding to 5 different growth stages. The letters A, B, C, D, and E represent these 5 successive stages, respectively. For each growth stage, three samples were taken as biological replicates, labeled as A–1, A–2, and A–3. We obtained the cambium region through scratching the stem by a sharp knife, then collected samples and immediately stored them in liquid nitrogen at −80 °C until use.

2.2. RNA Extraction and Transcriptome Sequencing

Total RNA was isolated from the samples of C. fortunei vascular cambium by a RNeasy Plant Mini Kit (Qiagen, Hilden, Germany). The integrity and concentration of total RNA were assessed by an Agilent 2100 Bioanalyzer (Agilent Technologies, Santa Clara, CA, USA) and a Thermo Scientific NanoDrop 2000 (Thermo Fisher Scientific, Wilmington, DE, USA). Library preparation and sequencing experiments were performed in accordance with the standard procedure provided by Illumina. Sequencing was then performed using an Illumina HiSeq™ 2500 system by OE biotech Co., Ltd. (Shanghai, China), generating 150 bp paired-end reads. The accession number of this project is PRJNA 644276.

2.3. Assembly and Functional Annotation

We obtained millions of clean reads after removing adaptor and low-quality sequences. Clean reads were then assembled into expressed sequence tag clusters (contigs), which were then de novo assembled into transcripts using Trinity and the paired-end method [13]. Subsequently, we described the longest transcript as a unigene using CD-HIT [14]. Unigene was chosen for subsequent analysis. Unigenes were aligned by diamond [15] and HMMER [16] to public databases NR, KOG, GO, Swiss-Prot, eggNOG, KEGG, and Pfam with the highest sequence similarity for protein functional annotation and classification.

2.4. Differential Expression Analysis

Unigene expression was quantified according to the fragments per kb per million reads (FPKM) method [17], using bowtie2 [18] and eXpress [19]. Through pairwise comparisons, DEGs of different stages were identified by DESeq [20]. A threshold of p < 0.05 and a greater than two-fold change were set [21]. To explore expression patterns, we performed a sample to sample distances cluster analysis [22]. GO and KEGG enrichment analysis of DEGs were performed using R based on the hypergeometric distribution [21].

2.5. Verification of Gene Expression Using qRT-PCR

8 unigenes were chosen for validation through qRT-PCR. RNA was extracted from the cambium region then reverse-transcribed using a HiScript III RT SuperMix (Vazyme Biotech Co., Ltd., Nanjing, China). We designed the primers using Primer Premier 5.0 software (Premier Biosoft International, Palo Alto, CA, USA) (Supplementary Table S1). Three biological replicates were run at a final volume of 20 μL, which consisted of 6 μL of ddH2O, 1 μL of primers, 2 μL of cDNA, and 10 μL of 2× ChamQ SYBR qPCR Master Mix (Vazyme Biotech Co., Ltd., Nanjing, China). The C. fortunei β-actin gene was used as reference [11]. The primers used were F: GCCATCTTTGATTGGAATGG and R: GGTGCCACAACCTTGACTT. The qRT-PCR reaction was performed on an ABI 7500 Step One Plus Real-time PCR System (Applied Biosystems, Foster City, CA, USA). Reactions were performed at 95 °C for 30 s, followed by 40 cycles of 95 °C for 10 s, and 60 °C for 30 s. The delta-delta-Ct method was used to assess the amplification results [23].

2.6. Determination of Lignin Content

The lignin content of stems of the same year was determined according to Reference [24]. We acquired the data by a GeneQuant pro ultraviolet spectrophotometer (Biochrom Ltd., England, UK).

3. Results

3.1. Statistics of Transcriptome Sequencing Results and De Novo Assembly

In order to obtain candidate genes involved in phenylpropanoid metabolism, in this study, we performed transcriptome sequencing of the C. fortunei cambial zone at 5 successive growth stages. As a result, we obtained a total of 724,452,816 raw reads from C. fortunei cambium total RNA across all of our samples. From these, we assembled five complete transcriptomes, one for each growth stage (Table 1). The percentage of raw reads with a Q-value > 30 ranged from 92.33% to 94.89% for all samples, and the average GC content (the percentage of the total number of G’s and C’s in clean bases) was 44.01%. After removing low-quality reads and adaptor sequences, a total of 706,935,392 clean reads were obtained, which were used for de novo assembly. We obtained 78,673 unigenes using Trinity software, and found the average unigene length to be 957 bp, with an N50 length of 1576 bp. The sequence length distribution is shown in Supplementary Figure S1.

3.2. Functional Annotation and Classification of All Unigenes

We next annotated all 78,673 unigenes using diamond software and HMMER software against seven public databases: NR, KOG, GO, Swiss-Prot, eggNOG, KEGG, and Pfam (Figure 1, Supplementary Table S2). Using these databases, 45,214 (57.47%), 26,866 (34.15%), 28,589 (36.34%), and 46,674 (59.33%) unigenes could be annotated in NR, Swiss-Prot, KOG, and eggNOG, respectively. Only 114 (0.14%) unigenes could be aligned to the Pfam database. We successfully annotated 24,312 (30.90%) unigenes into separate GO categories, including three functional categories: cellular component (CC), molecular function (MF), and biological process (BP), as well as 52 GO terms (Figure 2). In the ‘cellular component’ category, the most highly represented GO terms were ‘cell’ (20,396) and ‘cell part’ (20,364), while ‘binding’ (15,131) and ‘catalytic activity’ (13,131) were the two top GO terms in the ‘molecular function’ category. Additionally, regarding the ‘biological process’ category, these unigenes were clustered into 22 GO terms, with the three top terms being ‘cellular process’ (17,152), ‘metabolic process’ (14,158), and ‘biological regulation’ (6913). In total, 15,354 (19.52%) unigenes were assigned to 24 metabolic pathways (Figure 3). ‘Translation’ (1591), ‘Signal transduction’ (1515), and ‘Carbohydrate metabolism’ (1411) were the top three metabolic pathways.
Following this functional categorization, we continued analyzing transcription factor (TF) categorization across the different known plant TF families. As a result, we identified a total of 1401 TFs, which could be further classified into 66 TF families, such as WRKY, NAC, bZIP, and others (Supplementary Figure S2). We found the C2H2 family to be most abundant, with 233 unigenes, followed by AP2/ERF-ERF (115) and bHLH (100). We also found 71 and 34 unigenes encoding MYB and NAC TFs in this study.

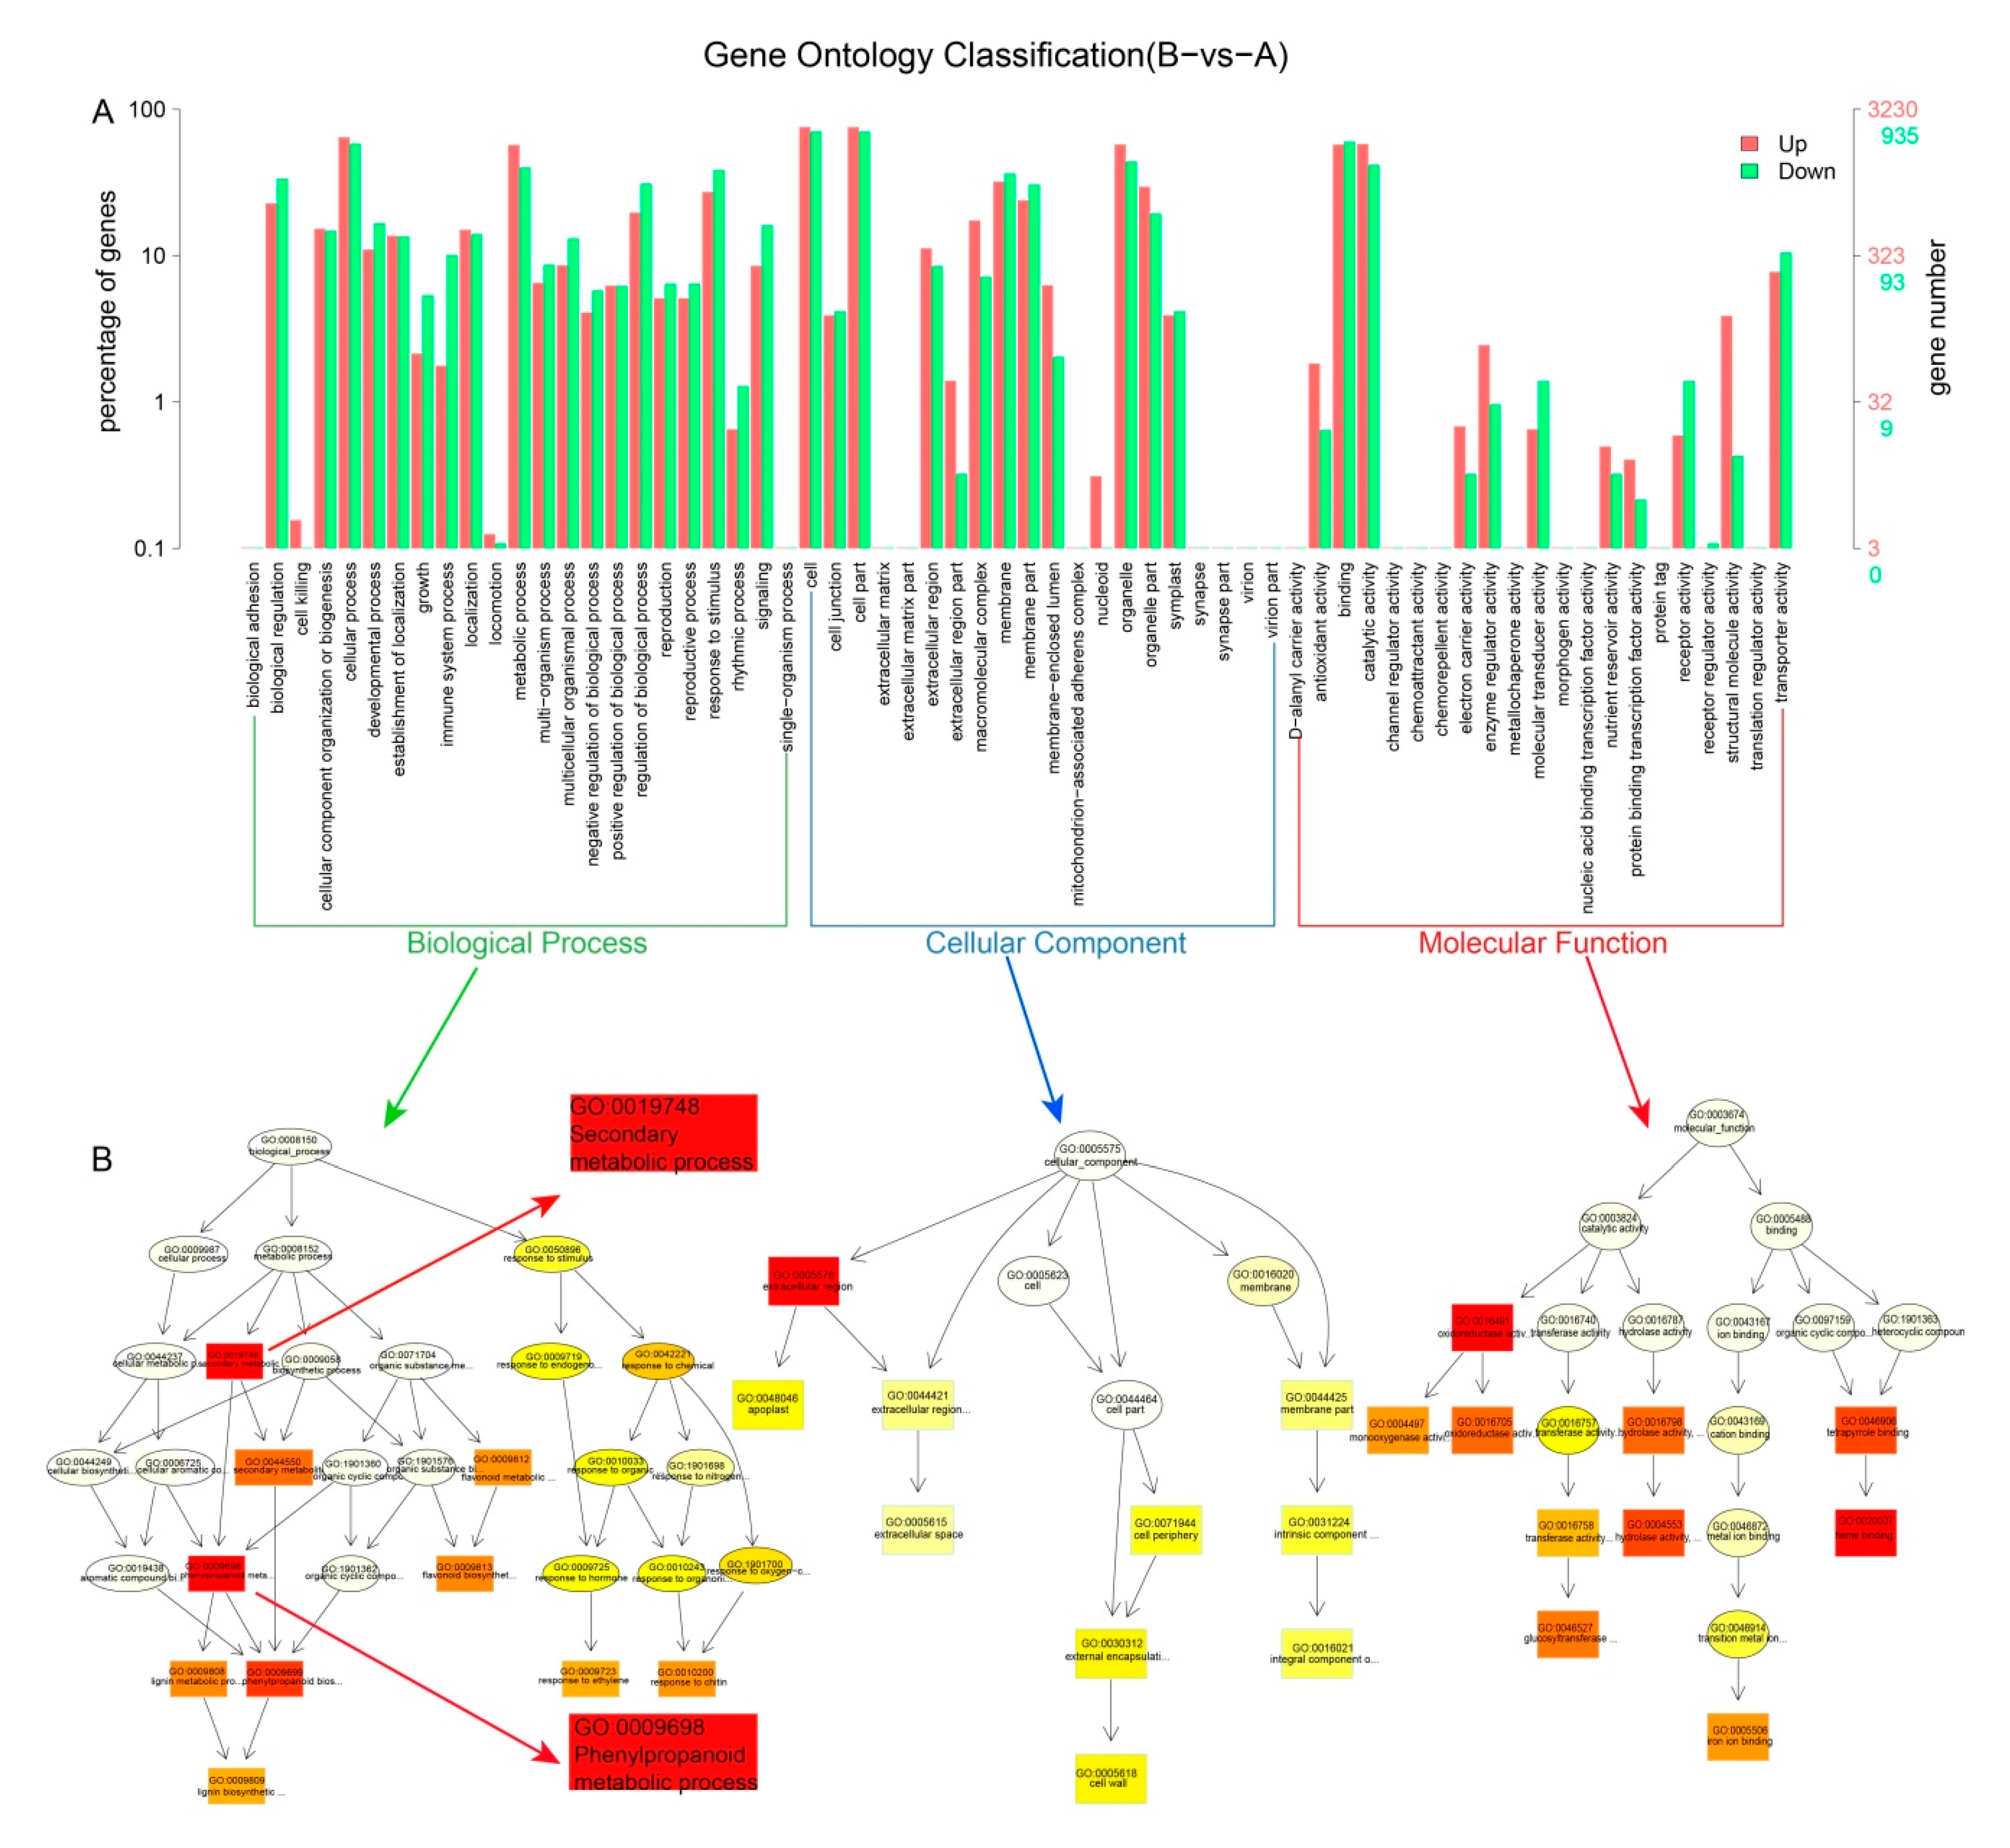
3.3. Identification of DEGs and the GO and KEGG Enrichment Analysis

In our study, we calculated unigene expression levels using the FPKM method and conducted annotation and enrichment analysis of DEGs. Firstly, we performed sample clustering analysis to obtain gene expression patterns of C. fortunei vascular cambium. The gene expression patterns of samples collected in September and November clustered together, while those from April and July did as well, making the samples collected in May their own cluster (Figure 4). These results indicate a higher sample similarity between these samples. In addition, the three biological replicates were clustered together, indicating the reliability of our transcriptome data.
We then identified all C. fortunei vascular cambium DEGs through pairwise comparisons. The amount of DEGs for each pairwise comparison is shown in Supplementary Figure S3. With A as a reference, we compared B vs. A, C vs. A, D vs. A, and E vs. A: 8975, 4432, 11,683, and 17,774 unigenes were differentially expressed in all four pairwise comparisons, respectively.
In a previous study, we observed the development of C. fortunei vascular cambium by studying their morphology using paraffin sections [25]. We found that cellular growth and development were most vigorous in May. Here, we chose B vs. A (May vs. April) as an example to explain the DEGs’ functionality. A total of 4165 DEGs were found through GO enrichment analysis in B vs. A, of which 3230 and 935 were up- and down-regulated, respectively (Figure 5A). To describe our GO annotation results, we constructed a directed acyclic graph (DAG) using topGO [26] (Figure 5B). The most significant enrichment in the ‘biological process’ category is ‘secondary metabolic process’ (GO: 0019748) and ‘phenylpropanoid metabolic process’ (GO: 0009698).
To further explore DEGs biological function, we performed a KEGG enrichment analysis: 2628 DEGs were successfully annotated into 24 pathways in B vs. A (Figure 6). We found 146 DEGs, of which 134 and 12 were up- and down-regulated, annotated to the secondary metabolism pathway, which indicates that these DEGs are involved in secondary metabolism.

3.4. Identification of Candidate Genes Involved in Phenylpropanoid Metabolism

In order to understand how gene activity changes between growth stages, we continued by comparing KEGG pathway enrichment of DEGs (Figure 7). One of the main KEGG pathways undergoing enrichment dynamics was phenylpropanoid metabolism (ko00940). We identified 83 DEGs involved in this pathway in B vs. A, of which 76 DEGs were upregulated.
Lignin is mainly synthesized through the phenylpropanoid metabolic pathway (Figure 8), phenylalanines are converted to monolignols by the enzymes phenylalanine ammonia-lyase (PAL) (4.3.1.24), shikimate O-hydroxycinnamoyl transferase (HCT) (2.3.1.133), p-coumarate 3-hydroxylase (C3H) (1.14.13.36), 4-(hydroxy) cinnamoyl CoA ligase (4CL) (6.2.1.12), caffeoyl CoA O-methyltransferase (CCoAOMT) (2.1.1.104), cinnamoyl CoA reductase (CCR) (1.2.1.44), and cinnamyl alcohol dehydrogenase (CAD) (1.1.1.195). In B vs. A, we identified 8, 5, 2, 9, 4, and 4 unigenes encoding PAL, HCT, C3H, 4CL, CCoAOMT, and CCR respectively, most of which were upregulated.
We then analyzed the expression of key enzymes involved in phenylpropanoid biosynthesis (Figure 9). All of them had different expression patterns at different stages. Five enzymes, including C3H, CCR, 4CL, PAL, and CCoAOMT, were all present at higher expression levels at stage_May. Two enzymes, including PAL and HCT, showed higher expression levels at stage_November, which indicates that these enzymes could play roles in response to cold stress. Most enzymes displayed lower expression levels at stage_April and November than at other stages, which could be caused by the seasonally cyclical pattern of dormancy and activity. Furthermore, the expression of these enzymes increased from July to September and decreased again from September to November. This finding is consistent with the general trend of lignin content. In the present study, the lignin content increased gradually from April (10.88%) to September (34.56%) and stabilized from September to November (34.75%) (Supplementary Figure S4). These phenomena revealed that key enzymes involved in phenylpropanoid biosynthesis might be responsible for the seasonal change in wood formation activity.

3.5. Quantitative Real-Time PCR Validation of Candidate Genes Involved in Phenylpropanoid Biosynthesis

In this study, we randomly selected eight unigenes involved in phenylpropanoid biosynthesis and examined their expression levels using qRT-PCR. We firstly performed the melt curve analysis. We found that all samples (including 3 replicates) have a single peak and the temperature is between 80 and 90 °C (Supplementary Figure S5), which indicates that the data is reliable. The expression profiles of these candidates are shown in Supplementary Figure S6. Although the exact fold changes between stages of each unigene varied somewhat between RNA-seq and qRT-PCR data, the trends between the different stages were overall similar. We could find just one candidate gene (TRINITY_DN57952_c0_g1_i1_3) of which the expression values were inconsistent with our RNA-seq data. Therefore, these results confirm the accurate assembly of the transcript sequences and reliability of our RNA-seq data.

4. Discussion

Wood is an important raw material with a rapidly increasing worldwide demand. As a result, more research is being devoted to analyzing the genetic regulation of wood formation. An important tool for such research is transcriptome sequencing, which can be used to discover genes that control economic traits. In a previous study, we identified the different expression pattern of reproductive genes in two conifer species through transcriptome sequencing [27]. In this study, approximately 72.44 million paired-end reads were obtained. After assembly, we obtained 78,673 unigenes, with an average length of 957 bp, significantly longer than has been reported previously for Cunninghamia lanceolata (Lamb.) Hook (449 bp) [28], Camellia sinensis (L.) O. Ktze. (355 bp) [29], and Porphyra yezoensis (Rhodophyta) (419 bp) [30], and slightly shorter than C.japonica (1069 bp) [31], and thereby providing more abundant genetic information to understand the mechanism of lignin biosynthesis.
Lignin is mainly synthesized through the phenylpropanoid metabolic pathway. We aimed to find DEGs involved in lignin biosynthesis. As a result, we obtained 83, 29, 49, and 74 DEGs in four pairwise comparisons, of which 76, 22, 43, and 46 DEGs were upregulated, respectively. We found most DEGs when comparing the growth stages May vs. April and November vs. April, which is most likely because of the seasonally cyclical pattern of dormancy and activity in wood formation. In this study, we found 8, 3, 4, and 8, and 9, 2, 1, and 1 DEGs encoding PAL and 4CL respectively, in four pairwise comparisons, most of which were upregulated. It is consistent with the expression patterns in Figure 9. Similarly, Mishima et al. [31] found the homologues, PAL4 and 4CL3, and showed an increasing expression pattern during cessation of growth. This finding indicates that PAL and 4CL might be regulated to the cold stress. We also found most DEGs encoding CAD, CCoAOMT, and CCR to be upregulated. Most enzymes were induced in April, and expression level gradually decreased from August to October in C. japonica [31]. The expression pattern corresponded to our previous study about anatomical observation of cambium cells [25]. Previous reports have found that CAD [32], CCoAOMT [11], and CCR [33] promote lignin synthesis, which is consistent with the expression patterns of these enzymes (Figure 9) and the associated corresponding changes in lignin content.
Previous studies have found that temperature plays an important role in dormancy development [34]. During our study, the daily maximum and minimum temperatures increased from 4 April to 18 May and peaked at 10 July (Supplementary Table S3). Subsequently, temperatures steadily declined from July to November. Similarly, from our previous work, we found cambium cells undergoing peri-planar divisions, with the largest number of layers, full cells, cytoplasm, and vigorous divisions in May, while the number of cell layers decreased in July and September compared to May, and with the number of cells being the least and division stopping in November [25]. Furthermore, we found that the expression of most lignin-synthesizing enzymes in C. fortunei vascular cambium changed in tandem with rising and falling temperatures, consistent with the growth season and previous studies [31]. Analogously, the growing season of Japanese cedar, another gymnosperm, runs from March until October, with lignin synthesis activity sharply increasing from March to June, then declining until dormancy in October [31]. Interestingly, Sato et al. [35] analyzed the diurnal periodicity of expression of lignin synthesizing genes in C. japonica and found that most enzymes showed different expression abundance at different times on the same day. This paper provides a good research direction for our future study.
Previous reports have found TFs involved in the regulation of lignin biosynthesis [36,37,38], response to the abiotic stress [39,40,41,42,43], and regulation of growth and developmental processes [44,45,46,47,48]. MYB TFs could regulate lignin synthesis by binding to the corresponding regulatory elements of lignin-synthesizing enzyme genes, whereas NAC TFs could regulate the corresponding MYB TFs to regulate lignin synthesis. During this study, we obtained 37, 16, 33, and 37 DEGs encoding MYB TFs in all four pairwise comparisons, of which 26, 10, 26, and 20 were upregulated. Similarly, Mishima et al. [31] found that 34 MYB were upregulated during the peak activity of xylem formation. These results are consistent with our findings in this paper. In addition, we found that these TFs regulated some metabolic pathways, including the phenylpropanoid metabolic pathway. We also analyzed the expression patterns of NAC TFs and obtained 15, 4, 12, and 12 NAC TFs showing differential expression in all four pairwise comparisons. Similarly, most TFs were upregulated. Mishima et al. [31] found a VND6 homolog and its expression was moderately decreased during peak xylem formation. According to the expression patterns of lignin-synthesizing enzymes in this study, these results imply a potential role of TFs in the regulation of lignin biosynthesis.

5. Conclusions

C. fortunei is a plant tree species that has a large number of excellent qualities, such as rapid growth, a straight bole, and ease of processing for wood production. In this study, we performed transcriptome sequencing on C. fortunei vascular cambium for 5 successive growth stages. We identified candidate genes involved in phenylpropanoid metabolism and analyzed expression patterns of lignin-synthesizing enzymes. Finally, we found the correlation of enzyme expression with different growth stages. Thus, our findings contribute to a better understanding of the molecular mechanisms underlying the phenylpropanoid biosynthesis pathway. Importantly, these results may be useful for molecular breeding of C. fortunei to improve wood characteristics.

Supplementary Materials

The following are available online at https://www.mdpi.com/1999-4907/11/7/766/s1: Figure S1: De novo transcriptome assembly, Figure S2: Distribution of TFs according to their TF family, Figure S3: Identification of DEGs. The x-axis represents the comparison groups, and the y-axis represents the number of DEGs, Figure S4: The lignin content of 5 growth stages, error bars represent standard deviation of three biological replicates, Figure S5: The melt curve of qRT-PCR, Figure S6: qPCR validation of RNA-seq data. The x-axis represents the growth stages, and the y-axis represents the fold change (log2). Table S1: Primers used for qRT-PCR, Table S2: Functional annotation of unigenes, Table S3: The daily maximum and minimum temperatures at the sampling date.

Author Contributions

Conceptualization, J.X.; formal analysis, J.Y., Y.Z., Z.G., J.M., J.C., H.H., and Y.H.; data curation, J.Y.; writing—original draft, J.Y.; writing—review and editing, J.Y. and J.M.; supervision, J.X.; funding acquisition, J.X.; project administration, J.X. All authors have read and agreed to the published version of the manuscript.

Funding

This research was funded by National Forestry and Grassland Administration of China, forestry public welfare industry research (201304104), and the Priority Academic Program Development of Jiangsu Higher Education Institutions (PAPD).

Acknowledgments

We would like to give thanks to Remco A. Mentink of Plant Research International, Wageningen University and Research Centre, for his careful scientific revision on the manuscript, and Tianci Yan of China Agricultural University for his careful revision of the figures. We also thank reviewers for insightful comments on this article.

Conflicts of Interest

The authors declare no conflict of interest.

References

  1. Zhao, H.; Mo, J.X.; Hua, H.; Guo, Z.H.; Xu, J. Meiosis process and abnormal behavior of pollen mother cells in Cryptomeria fortunei. J. Nanjing For. Univ. (Nat. Sci. Ed.) 2019, 43, 45–50. (In Chinese) [Google Scholar]
  2. Růžička, K.; Ursache, R.; Hejátko, J.; Helariutta, Y. Xylem development—From the cradle to the grave. New Phytol. 2015, 207, 519–535. [Google Scholar] [CrossRef] [PubMed]
  3. Yi, M.; Zhang, L.; Lei, L.; Cheng, Z.S.; Sun, S.W.; Lai, M. Analysis of SSR information in transcriptome and development of EST-SSR molecular markers in Pinus elliottii Engelm. J. Nanjing For. Univ. (Nat. Sci. Ed.) 2020, 44, 75–83. (In Chinese) [Google Scholar]
  4. Fagard, M.; Höfte, H.; Vernhettes, S. Cell wall mutants. Plant Physiol. Biochem. 2000, 38, 15–25. [Google Scholar] [CrossRef]
  5. Soler, M.; Plasencia, A.; Larbat, R.; Pouzet, C.; Jauneau, A.; Rivas, S.; Pesquet, E.; Lapierre, C.; Truchet, I.; Grima-Pettenati, J. The Eucalyptus linker histone variant EgH1.3 cooperates with the transcription factor EgMYB1 to control lignin biosynthesis during wood formation. New Phytol. 2016, 213, 287–299. [Google Scholar] [CrossRef]
  6. Shi, R.; Sun, Y.-H.; Li, Q.Z.; Heber, S.; Sederoff, R.; Chiang, V.L. Towards a systems approach for lignin biosynthesis in Populus trichocarpa: Transcript abundance and specificity of the monolignol biosynthetic genes. Plant Cell Physiol. 2009, 51, 144–163. [Google Scholar] [CrossRef] [Green Version]
  7. Jokipii-Lukkari, S.; Delhomme, N.; Schiffthaler, B.; Mannapperuma, C.; Prestele, J.; Nilsson, O.; Street, R.N.; Tuominen, H. Transcriptional Roadmap to Seasonal Variation in Wood Formation of Norway Spruce. Plant Physiol. 2018, 176, 2851–2870. [Google Scholar] [CrossRef] [Green Version]
  8. Boerjan, W.; Ralph, J.; Baucher, M. Ligninbiosynthesis. Annu. Rev. Plant Boil. 2003, 54, 519–546. [Google Scholar] [CrossRef] [PubMed]
  9. Li, L.; Cheng, X.F.; Leshkevich, J.; Umezawa, T.; Harding, S.A.; Chiang, V.L. the last step of syringyl monolignol biosynthesis in angiosperms is regulated by a novel gene encoding sinapyl alcohol dehydrogenase. Plant Cell 2001, 13, 1567–1586. [Google Scholar] [CrossRef] [PubMed] [Green Version]
  10. Zhang, X.-H.; Chiang, V.L. Molecular cloning of 4-coumarate:coenzyme A ligase in loblolly pine and the roles of this enzyme in the biosynthesis of lignin in compression wood. Plant Physiol. 1997, 113, 65–74. [Google Scholar] [CrossRef] [PubMed] [Green Version]
  11. Guo, Z.; Hua, H.; Xu, J.; Mo, J.; Zhao, H.; Yang, J. Cloning and Functional Analysis of Lignin Biosynthesis Genes Cf4CL and CfCCoAOMT in Cryptomeria fortunei. Genes 2019, 10, 619. [Google Scholar] [CrossRef] [Green Version]
  12. Qiu, Z.; Wan, L.; Chen, T.; Wan, Y.; He, X.; Lu, S.; Wang, Y.; Lin, J. The regulation of cambial activity in Chinese fir (Cunninghamia lanceolata) involves extensive transcriptome remodeling. New Phytol. 2013, 199, 708–719. [Google Scholar] [CrossRef] [PubMed]
  13. Grabherr, M.G.; Haas, B.J.; Yassour, M.; Levin, J.Z.; Thompson, D.A.; Amit, I.; Adiconis, X.; Fan, L.; Raychowdhury, R.; Zeng, Q.; et al. Full-length transcriptome assembly from RNA-Seq data without a reference genome. Nat. Biotechnol. 2011, 29, 644–652. [Google Scholar] [CrossRef] [PubMed] [Green Version]
  14. Li, W.; Jaroszewski, L.; Godzik, A. Clustering of highly homologous sequences to reduce the size of large protein databases. Bioinformatics 2001, 17, 282–283. [Google Scholar] [CrossRef] [PubMed]
  15. Buchfink, B.; Xie, C.; Huson, D.H. Fast and sensitive protein alignment using DIAMOND. Nat. Methods 2014, 12, 59–60. [Google Scholar] [CrossRef]
  16. Mistry, J.; Finn, R.D.; Eddy, S.R.; Bateman, A.; Punta, M. Challenges in homology search: HMMER3 and convergent evolution of coiled-coil regions. Nucleic Acids Res. 2013, 41, e121. [Google Scholar] [CrossRef] [Green Version]
  17. Roberts, A.; Trapnell, C.; Donaghey, J.; Rinn, J.L.; Pachter, L. Improving RNA-Seq expression estimates by correcting for fragment bias. Genome Boil. 2011, 12, R22. [Google Scholar] [CrossRef] [Green Version]
  18. Langmead, B.; Salzberg, S.L. Fast gapped-read alignment with Bowtie Nat. Methods 2012, 9, 357–359. [Google Scholar] [CrossRef] [Green Version]
  19. Roberts, A. Ambiguous Fragment Assignment for High-Throughput Sequencing Experiments. Ph.D. Thesis, University of California, Berkeley, CA, USA, 2013. [Google Scholar]
  20. Anders, S.; Huber, W. Differential Expression of RNA-Seq Data at the Gene Level–the DESeq Package; European Molecular Biology Laboratory (EMBL): Heidelberg, Germany, 2012. [Google Scholar]
  21. Wu, Y.; Guo, J.; Zhou, Q.; Xin, Y.; Wang, G.; Xu, L.-A. De novo transcriptome analysis revealed genes involved in flavonoid biosynthesis, transport and regulation in Ginkgo biloba. Ind. Crop. Prod. 2018, 124, 226–235. [Google Scholar] [CrossRef]
  22. Wang, L.; Feng, Z.; Wang, X.; Wang, X.; Zhang, X. DEGseq: An R package for identifying differentially expressed genes from RNA-seq data. Bioinformatics 2009, 26, 136–138. [Google Scholar] [CrossRef]
  23. Livak, K.J.; Schmittgen, T.D. Analysis of relative gene expression data using real-time quantitative PCR and the 2−ΔΔCT method. Methods 2001, 25, 402–408. [Google Scholar] [CrossRef]
  24. Rodrigues, J.; Faix, O.; Pereira, H. Improvement of the acetylbromide method for lignin determination within large scale screening programmes. Holz als Roh-und Werkst. 1999, 57, 341–345. [Google Scholar] [CrossRef]
  25. Cao, Y.T. Transcriptome Sequencing and Profiling of Expression in Vascular Cambium of Cryptomeria fortunei. Master’ s Thesis, Nanjing Forestry University, Nanjing, China, 2016. (In Chinese). [Google Scholar]
  26. Alexa, A.; Rahnenfuhrer, J. Enrichment Analysis for Gene Ontology; R Package Version 2.8; Bioconductor: Buffalo, NY, USA, 2010. [Google Scholar]
  27. Mo, J.; Xu, J.; Cao, Y.; Yang, L.; Yin, T.; Hua, H.; Zhao, H.; Guo, Z.; Yang, J.; Shi, J. Pinus massoniana Introgression Hybrids Display Differential Expression of Reproductive Genes. Forests 2019, 10, 230. [Google Scholar] [CrossRef] [Green Version]
  28. Huang, H.; Xu, L.-L.; Tong, Z.; Lin, E.; Liu, Q.; Cheng, L.J.; Zhu, M.-Y. De novo characterization of the Chinese fir (Cunninghamia lanceolata) transcriptome and analysis of candidate genes involved in cellulose and lignin biosynthesis. BMC Genom. 2012, 13, 648. [Google Scholar] [CrossRef] [PubMed] [Green Version]
  29. Shi, C.-Y.; Yang, H.; Wei, C.; Yu, O.; Zhang, Z.; Jiang, C.; Sun, J.; Li, Y.; Chen, Q.; Xia, T.; et al. Deep sequencing of the Camellia sinensis transcriptome revealed candidate genes for major metabolic pathways of tea-specific compounds. BMC Genom. 2011, 12, 131. [Google Scholar] [CrossRef] [PubMed] [Green Version]
  30. Yang, H.; Mao, Y.; Kong, F.; Yang, G.; Ma, F.; Wang, L. Profiling of the transcriptome of Porphyra yezoensis with Solexa sequencing technology. Chin. Sci. Bull. 2011, 56, 2119–2130. [Google Scholar] [CrossRef] [Green Version]
  31. Mishima, K.; Fujiwara, T.; Iki, T.; Kuroda, K.; Yamashita, K.; Tamura, M.; Fujisawa, Y.; Watanabe, A. Transcriptome sequencing and profiling of expressed genes in cambial zone and differentiating xylem of Japanese cedar (Cryptomeria japonica). BMC Genom. 2014, 15, 219. [Google Scholar] [CrossRef] [PubMed] [Green Version]
  32. Zhang, C.H.; Xiong, Z.H.; Wu, W.L.; Li, W.L. CAD enzyme activity and gene expression in connection with lignin synthesis during fruit development and ripening process of blackberry. J. Nanjing For. Univ. (Nat. Sci. Ed.) 2018, 42, 141–148. (In Chinese) [Google Scholar]
  33. Douglas, C.J. Phenylpropanoid metabolism and lignin biosynthesis: From weeds to trees. Trends Plant Sci. 1996, 1, 171–178. [Google Scholar] [CrossRef]
  34. Heide, O.M. Growth and dormancy in norway spruce ecotypes (Picea abies) i. interaction of photoperiod and temperature. Physiol. Plant. 1974, 30, 1–12. [Google Scholar] [CrossRef]
  35. Sato, S.; Yoshida, M.; Ashizaki, Y.; Yamamoto, H. Diurnal periodicity of the expression of genes involved in monolignol biosynthesis in differentiating xylem of cryptomeria japonica. Am. J. Plant Sci. 2016, 7, 2457–2469. [Google Scholar] [CrossRef] [Green Version]
  36. Zhong, R.; Ye, Z. Transcriptional regulation of lignin biosynthesis. Plant Signal. Behav. 2009, 4, 1028–1034. [Google Scholar] [CrossRef] [PubMed] [Green Version]
  37. Lv, Y.Z.; Zheng, J.; Chen, J.H.; Shi, J.S. Cloning transcription factor ClMYB4 involving in secondary cell wall biosynthesis from Cunninghamia lanceolata (Lamb) Hook and expressing in E. coli. Mol. Plant Breed. 2012, 10, 512–519. (In Chinese) [Google Scholar]
  38. Cassan-Wang, H.; Goué, N.; Saidi, M.N.; Legay, S.; Sivadon, P.; Goffner, D.; Grima-Pettenati, J. Identification of novel transcription factors regulating secondary cell wall formation in Arabidopsis. Front. Plant Sci. 2013, 4, 189. [Google Scholar] [CrossRef] [Green Version]
  39. Movahedi, A.; Zhang, J.; Yin, T.; Zhuge, Q. Functional Analysis of Two Orthologous NAC Genes, CarNAC3, and CarNAC6 from Cicer arietinum, Involved in Abiotic Stresses in Poplar. Plant Mol. Boil. Rep. 2015, 33, 1539–1551. [Google Scholar] [CrossRef]
  40. Wang, J.; Xu, M.; Gu, Y.; Xu, L. Differentially expressed gene analysis of Tamarix chinensis provides insights into NaCl-stress response. Trees 2016, 31, 645–658. [Google Scholar] [CrossRef]
  41. Liu, X.; Yu, W.; Zhang, X.; Wang, G.; Cao, F.-L.; Cheng, H. Identification and expression analysis under abiotic stress of the R2R3-MYB genes in Ginkgo biloba L. Physiol. Mol. Boil. Plants 2017, 23, 503–516. [Google Scholar] [CrossRef]
  42. Wang, Y.; Qiu, W.M.; Li, H.; He, X.L.; Liu, M.Y.; Han, X.J.; Qu, T.B.; Zhuo, R.Y. Research on the response of SaWRKY7 gene to cadmium stress in Sedum alfredii Hance. J. Nanjing For. Univ. (Nat. Sci. Ed.) 2019, 43, 59–66. (In Chinese) [Google Scholar]
  43. Tian, X.Y.; Zhou, J.; Wang, B.S.; He, K.Y.; He, X.D. Cloning and expression pattern analysis of NAC genes in Salix. J. Nanjing For. Univ. (Nat. Sci. Ed.) 2020, 44, 119–124. (In Chinese) [Google Scholar]
  44. Yang, C.; Xu, M.; Xuan, L.; Jiang, X.; Huang, M. Identification and expression analysis of twenty ARF genes in Populus. Gene 2014, 544, 134–144. [Google Scholar] [CrossRef]
  45. Bi, C.; Xu, Y.; Ye, Q.; Yin, T.; Ye, N. Genome-wide identification and characterization of WRKY gene family in Salix suchowensis. PeerJ 2016, 4, e2437. [Google Scholar] [CrossRef] [PubMed] [Green Version]
  46. Wang, P.; Cheng, T.; Lu, M.; Liu, G.; Li, M.; Shi, J.; Lu, Y.; Laux, T.; Chen, J. Expansion and Functional Divergence of AP2 Group Genes in Spermatophytes Determined by Molecular Evolution and Arabidopsis Mutant Analysis. Front. Plant Sci. 2016, 7, 1585. [Google Scholar] [CrossRef] [PubMed] [Green Version]
  47. Mo, Z.H.; Li, F.D.; Su, W.C.; Cao, F.; Peng, F.R.; Li, Y.R. Cloning and expression analysis of CiMYB46 in the graft healing process of Carya illinoinensis. J. Nanjing For. Univ. (Nat. Sci. Ed.) 2019, 43, 156–162. (In Chinese) [Google Scholar]
  48. Chen, G.; Wang, L.; Li, L.; Li, Y.; Li, H.; Ding, W.; Shi, T.; Yang, X.; Wang, L. Genome-Wide Identification of the Auxin Response Factor (ARF) Gene Family and Their Expression Analysis during Flower Development of Osmanthus fragrans. Forests 2020, 11, 245. [Google Scholar] [CrossRef] [Green Version]
Figure 1. Unigenes functional annotation. The numbers on the top bar represent the results of the intersection of databases with black dots in the matrix below, and the columns on the left represent the total number of genes annotated to each database.
Forests 11 00766 g001
Figure 2. Functional distribution of Gene Ontology (GO) annotation. The x-axis represents the different GO functional classifications, the y-axis on the left and right respectively represent the percentage and absolute number of unigenes being annotated with each classification.
Forests 11 00766 g002
Figure 3. Functional distribution of Kyoto Encyclopedia of Genes and Genomes (KEGG) annotation. The x-axis represents the number of genes, and the y-axis represents the name of the KEGG metabolic pathway.
Forests 11 00766 g003
Figure 4. Gene expression analysis. Sample clustering of 5 growth stages. Sample correlation is based on their gene expression profile. The color scale represents the correlation coefficient. The sample clustering was used to investigate the expression patterns of genes at 5 successive growth stages in C. fortunei vascular cambium.
Forests 11 00766 g004
Figure 5. Gene Ontology (GO) functional classification of Differentially Expressed Genes (DEGs). (A) The x-axis represents the enriched GO terms. The y-axis represents the number and percentage of up- and down-regulated DEGs. (B) Directed acyclic graphs (DAGs) of Biological Process (BP), Cellular Component (CC), and Molecular Function (MF). The nodes are colored based on the q-value, and red indicates a high confidence level. The GO terms are presented at the horizontal node position. The red arrows represent ‘secondary metabolic process’ (GO: 0019748) and ‘phenylpropanoid metabolic process’ (GO: 0009698), respectively.
Forests 11 00766 g005
Figure 6. KEGG enrichment analysis of DEGs. The x-axis represents the percentage of genes. The y-axis represents the name of the KEGG metabolic pathway. Red arrow indicates ‘Biosynthesis of other secondary metabolites’.
Forests 11 00766 g006
Figure 7. Bubble chart of KEGG enrichment. The x-axis represents the enrichment score. The y-axis represents the name of the KEGG metabolic pathway. The dot size indicates the number of DEGs, and the dot color indicates the p-value; the smaller the p-value, the greater the significance. Red arrow indicates the ‘ko00940: Phenylpropanoid biosynthesis’ pathway.
Forests 11 00766 g007
Figure 8. Pathway assignments based on the Kyoto Encyclopedia of Genes and Genomes (KEGG). A schematic representation of the phenylpropanoid biosynthesis pathway. The number in the rectangle indicates the corresponding enzyme. Red indicates upregulated unigenes, green indicates downregulated, yellow indicates unigenes that were both up- and down-regulated, and gray indicates no DEGs. Red arrows indicate H-type lignin, G-type lignin, and S-type lignin, respectively.
Forests 11 00766 g008
Figure 9. Expression levels of candidate genes associated with phenylpropanoid biosynthesis. PAL: Phenylalanine ammonia-lyase, HCT: Shikimate O-hydroxycinnamoyl transferase, C3H: Coumaroylquinate-3′-monooxygenase, 4CL: 4-coumarate-CoA ligase, CCoAOMT: Caffeoyl-CoA O-methyltransferase, CCR: Cinnamoyl-CoA reductase, CAD: Cinnamyl-alcohol dehydrogenase.
Forests 11 00766 g009
Table 1. Statistics of sequencing quality.
SampleRaw_ReadsClean_ReadsClean_BasesValid_Bases (%)Q30 1 (%)GC 2 (%)
A_146,571,82645,283,7066,697,931,98295.8893.6443.53
A_253,925,37852,724,4827,839,827,40596.9293.9643.81
A_353,242,13451,808,6587,669,074,71096.0393.5543.83
B_146,927,20045,482,6266,725,348,97095.5493.1144.00
B_252,320,20450,588,0507,464,083,43695.1192.9143.84
B_347,901,25846,465,5806,850,549,71195.3492.3344.10
C_148,353,95647,494,4127,067,068,80097.4494.4544.15
C_249,948,00049,090,1227,312,542,13197.6094.3344.56
C_348,035,40447,186,3287,004,509,88597.2194.3044.44
D_146,718,04645,434,5226,720,860,26895.9193.0144.09
D_248,454,58647,792,5307,068,774,36297.2694.8544.03
D_343,553,00242,426,0726,280,307,49096.1392.9943.71
E_147,230,76446,004,0166,795,292,53895.9293.2044.04
E_247,250,80045,758,2166,745,283,33595.1792.5144.04
E_344,020,25843,396,0726,443,702,33697.5994.8944.03
1 Q30 represents the percentage of bases whose phred number is greater than 30 in raw bases. 2 GC represents the percentage of the total number of G’s and C’s in clean bases.

