Plus Tree Selection of Quercus salicina Blume and Q. glauca Thunb. and Its Implications in Evergreen Oaks Breeding in Korea


Abstract
1. Introduction
2. Materials and Methods
2.1. Selection of Base Populations
2.2. Selection Criteria and Methods
2.3. Data Analysis
3. Results and Discussion
3.1. Characteristics of Base Populations
3.2. Selection of Candidate Trees
3.3. Data Analysis and Plus Tree Selection
3.4. Implications is Evergreen Oak Breeding
4. Conclusions
Author Contributions
Funding
Acknowledgments
Conflicts of Interest
References
- Nixon, K.C. Global and neotropical distribution and diversity of oak (genus Quercus) and oak forests. In Ecology and Conservation of Neotropical Montane Oak Forests; Kappelle, M., Ed.; Springer Publication: Berlin, Germany, 2006; pp. 3–13. [Google Scholar]
- Tantray, Y.R.; Wani, M.S.; Hussain, A. Genus Quercus: An overview. Int. J. Adv. Res. Sci. Eng. 2017, 6, 1880–1886. [Google Scholar]
- Korea National Arboretum. Distribution Maps of Vascular Plants in Korea; Korean National Arboretum: Pocheon, Korea, 2016. [Google Scholar]
- National Institute of Forest Science. Economic Tree Species ② Oaks; Research New Book; National Institute of Forest Science: Seoul, Korea, 2012; Volume 60. [Google Scholar]
- National Institute of Forest Science. Predicting the Changes of Productive Areas for Major Tree Species under Climate Change in Korea; Research Report No. 14-21; National Institute of Forest Science: Seoul, Korea, 2014. [Google Scholar]
- Park, S.U.; Koo, K.A.; Kong, W.S. Potential impact of climate change on distribution of warm temperate evergreen broad-leaved trees in the Korean peninsula. J. Korean Geogr. Soc. 2016, 51, 201–217. [Google Scholar]
- Williams, M.I.; Dumroese, R.K. Growing assisted migration: Synthesis of a climate change adaptation strategy. In National Proceedings: Forest and Conservation Nursery Association-2012; Haase, D.L., Pinto, J.R., Wilkinson, K.M., Eds.; Proceedings RMRS-P-69; USDA, Forest Service, Rocky Mountain Research Station: Fort Collins, CO, USA, 2013; pp. 90–96. [Google Scholar]
- Benito-Garzon, M.; Fernandez-Manjarres, J.F. Testing scenarios for assisted migration of forest trees in Europe. New For. 2015, 46, 979–994. [Google Scholar] [CrossRef]
- Lee, H.J.; Park, S.N. Antioxidative effect and active component analysis of Quercus salicina Blume extracts. J. Soc. Cosmet. Sci. Korea 2011, 37, 143–152. [Google Scholar]
- Moon, S.H.; Song, C.K.; Kim, T.K.; Oh, D.E.; Kim, H.C. Antifungal activity on the water extracts of five Fagaceae plants. Korean J. Org. Agric. 2017, 25, 295–310. [Google Scholar]
- Son, S.G.; Kim, H.J.; Kang, Y.J.; Oh, C.J.; Kim, C.S.; Byun, K.O. Establishment of breeding population for Quercus glauca and climate factors. Korean J. Agric. For. Meteorol. 2011, 13, 109–114. [Google Scholar] [CrossRef][Green Version]
- White, T.L.; Adams, W.T.; Neal, D.B. Forest Genetics; CABI International Publication: London, UK, 2007. [Google Scholar]
- Falconer, D.S. Introduction to Quantitative Genetics, 2nd ed.; Longman Group Ltd.: London, UK, 1981. [Google Scholar]
- Morgenstern, E.K. Tree selection techniques in the Northeast: Some problems and questions. In Proceedings of the Northeastern Forest Tree Improvement Conference; Eckert, R.T., Ed.; Institute of Natural and Environmental Resources, Univ. of New Hampshire Durham: Durham, NH, USA, 1982; pp. 145–157. [Google Scholar]
- Van Damme, L. Plus-tree Selection of Black Spruce in Northwestern Ontario for Superior Growing Space Efficiency; School of Forestry, Lakehead University: Thunder Bay, ON, Canada, 1985. [Google Scholar]
- Zobel, B.; Talbert, J. Applied Forest Tree Improvement; John Wiley & Sons: New York, NY, USA, 1984. [Google Scholar]
- Stringer, J.W.; Wagner, D.B.; Schlarbaum, S.E.; Houston, D.B. An analysis of phenotypic selection in natural stands of northern red oak (Quercus rubra L.). In Proceedings of the 10th Central Hardwood Forest Conference, Morgantown, WV, USA, 5–8 March 1995; pp. 226–237. [Google Scholar]
- Lee, T.B. Illustrated Flora of Korea; Hyangmunsa: Seoul, Korea, 1989. [Google Scholar]
- Han, D.H.; Kim, J.Y.; Choi, I.T.; Lee, K.J. Vegetation structure of evergreen broad-leaved forest in Dongbaekdongsan(Mt.), Jeju-Do, Korea. Korean J. Environ. Ecol. 2007, 21, 336–346. [Google Scholar]
- Yun, J.H.; Hukusima, T.; Kim, M.H.; Yoshikawa, M. The comparative study on the distribution and species composition of forest community in Korea and Japan around the east sea. Korean J. Ecol. 2011, 25, 327–357. [Google Scholar]
- Jeong, H.M.; Kim, H.R.; Cho, K.T.; Lee, S.H.; Han, Y.S.; You, Y.H. Aboveground biomass estimation of Quercus glauca in evergreen forest, Kotzawal wetland, Cheju Island. Korea J. Wetl. 2014, 16, 245–250. [Google Scholar]
- Jeon, C.H.; Won, H.K.; Kim, H.S.; Cho, Y.J. The vegetation structure of evergreen broad-leaved forest of Jeju experimental forest, Korea. J. Korean Isl. 2016, 28, 221–238. [Google Scholar]
- National Institute of Forest Science. Genetic Tests and Improvement of Genetic Gain in Major Tree Species; Research Report No. 19-11; National Institute of Forest Science: Seoul, Korea, 2019. [Google Scholar]
- Morgenstern, E.K. Review of the principles of plus-tree selection. In Plus-tree Selection: Review and Outlook; Morgenstern, E.K., Holst, M.J., Teich, A.H., Yeatman, C.W., Eds.; Department of the Environment, Canadian Forestry Service Publication: Ottawa, ON, Canada, 1975; pp. 1–27. [Google Scholar]
- Han, J.W.; Kamber, M.; Pei, J. Data Mining: Concepts and Techniques, 3rd ed.; Morgan Kaufmann Pub.: New York, NY, USA, 2012. [Google Scholar]
- Suarez-Alvarez, M.M.; Phan, D.T.; Prostov, M.Y.; Prostov, Y.I. Statistical approach to normalization of feature vectors and clustering of mixed datasets. Proc. R. Soc. A 2012, 468, 2630–2651. [Google Scholar] [CrossRef]
- Muralidharan, K. A note on transformation, standardization and normalization. Int. J. Oper. Quant. Manag. 2014, 9, 116–122. [Google Scholar]
- Khan, A.; Rayner, G.D. Robustness to non-normality of common tests for the many-sample location problem. J. Appl. Math. Decis. Sci. 2003, 7, 187–206. [Google Scholar] [CrossRef]
- Wright, J.W. Introduction to Forest Genetics; Academic Press Inc.: New York, NY, USA, 1976. [Google Scholar]
- Dupuy, J.M.; Chazdon, R.L. Interacting effects of canopy gap, understory vegetation and leaf litter on tree seedling recruitment and composition in tropical secondary forests. For. Ecol. Manag. 2008, 255, 3716–3725. [Google Scholar] [CrossRef]
- Tang, C.Q.; Ohsawa, M. Ecology of subtropical evergreen broad-leaved forests of Yunnan, southwestern China as compared to those of southwestern Japan. J. Plant Res. 2009, 122, 335–350. [Google Scholar] [CrossRef] [PubMed]
- Ito, S.; Ohtsuka, K.; Yamashita, T. Ecological distribution of seven evergreen Quercus species in southern and eastern Kyushu, Japan. Veg. Sci. 2007, 24, 53–63. [Google Scholar]
- Kim, G.U.; Jang, K.S.; Lim, H.W.; Kim, E.H.; Lee, K.H. Genetic diversity of Quercus gilva in Je-ju Island. J. Korean Soc. For. Sci. 2018, 107, 151–157. [Google Scholar]
- Rosvall, O.; Mullin, T. Introduction to breeding strategies and evaluation alternatives. In Best Practice for Tree Breeding in Europe; Mullin, T.J., Lee, S.J., Eds.; Skogforsk Publication: Uppsala, Sweden, 2013; pp. 7–27. [Google Scholar]


| Region | Stand | Latitude (°N) | Longitude (°E) | Altitude (m) | Target Species | Mean Annual Temperature (MAP, °C) | Mean Annual Precipitation (MAP, mm) | Relative Humidity (RH, %) |
|---|---|---|---|---|---|---|---|---|
| Jindo | 1. Sacheon1 | 34.4701 | 126.3087 | 108 | Q. salincina | 139 | 1568.5 | 78.2 |
| 2. Sacheon2 | 34.4618 | 126.3211 | 154 | Q. salincina | ||||
| Wando | 3. Yesong | 34.1555 | 126.5744 | 58 | Q. salincina | 14.1 | 1532.7 | 72.5 |
| 4. Jeongja | 34.1612 | 126.5095 | 37 | Q. salincina Q. glauca | ||||
| 5. Buhwang | 34.1507 | 126.5348 | 72 | Q. salincina | ||||
| 6. Jangjoa | 34.3555 | 126.7177 | 86 | Q. glauca | ||||
| 7. Daeya | 34.3655 | 126.7160 | 80 | Q. salincina | ||||
| Boseong | 8. Yulpo | 34.6791 | 127.0846 | 62 | Q. salincina | 13.6 | 1779.9 | 70.7 |
| Goheung | 9. Sayang | 34.4627 | 127.4493 | 33 | Q. glauca | 13.6 | 1453.4 | 69.7 |
| Jeju-si | 10. Seonhul | 33.5191 | 126.7129 | 113 | Q. salincina Q. glauca | 15.5 | 1456.9 | 73.3 |
| 11. Napup | 33.4339 | 126.3304 | 90 | Q. glauca | ||||
| 12. Cheongsu | 33.2969 | 126.2534 | 105 | Q. salincina Q. glauca | ||||
| Seguipo-si | 13. Gamsan | 33.2573 | 126.3565 | 125 | Q. salincina Q. glauca | 16.2 | 1850.8 | 70.7 |
| 14. Seoho | 33.3018 | 126.5250 | 602 | Q. salincina | ||||
| 15. Sanghyo | 33.3294 | 126.5857 | 465 | Q. salincina |
| Category (Weight) | Characteristic (Weight) | Remark |
|---|---|---|
| Growth (0.5) | Superiority of Growth (SG) (0.30) | Determined by considering growth status of shoot, branch, crown, and stem. |
| Superiority of Tree form (STF) (0.2) | Determined by considering number of stem, stem straightness, and timber height. | |
| Adaptability (0.2) | Adaptability to Disturbance (AD) (0.08) | Determined by considering adaptability to disturbance or damage by abiotic and biotic stresses |
| Adaptability to Environment (AE) (0.12) | Determined by considering vitality and adaptability to the environments of the site. | |
| Seed production (0.3) | Superiority of seed production (SSP) (0.18) | Determined by considering current status and recent history of seed production including buried or stand floor seed. |
| Potential of seed production (PSP) (0.12) | Determined by considering seed production capacity reflecting the advantages and disadvantages of current micro-environmental conditions affecting seed production. |
| Q. salicina | Q. glauca | ||||||
|---|---|---|---|---|---|---|---|
| Stand | No. of Candidates | Group | Remark | Stand | No. of Candidates | Group | Remark |
| Seonhul | 11 | A | Seonhul | 15 | A | ||
| Cheongsu | 9 | B | +Gamsan | Cheongsu | 33 | B | +Gamsan |
| Seoho | 14 | C | +Sanghyo | Napup | 10 | C | |
| Sacheon | 26 | D | Sacheon1 + Sacheon2 | Jeongja | 9 | D | |
| Yesong | 10 | E | Jangjoa | 12 | E | ||
| Buhwang | 8 | F | +Jeongja | Sayang | 3 | F | |
| Daeya | 6 | G | |||||
| Yulpo | 3 | H | |||||
| Total | 87 | 8 | 82 | 6 | |||
| Species | Group | Characteristics Used for Candidate Tree Selection | Growth Arranged after Finishing of Selection | ||||||
|---|---|---|---|---|---|---|---|---|---|
| Superiority of Growth (SG) | Superiority of Tree Form (STF) | Adaptability to Disturbance (AD) | Adaptability to Environment (AE) | Superiority of Seed Production (SSP) | Potential of Seed Production (PSP) | Height (HT) | Diameter at Breast Height (DBH) | ||
| Q. salicina | A | 4.45ab | 4.09a | 4.18ab | 4.45a | 3.36c | 3.73ab | 14.8bc | 30.1bc |
| B | 4.67ab | 4.11a | 3.89b | 4.33a | 3.78abc | 4.00ab | 13.9c | 28.8cd | |
| C | 4.88a | 4.14a | 4.57a | 4.42a | 3.43bc | 3.36b | 16.9c | 37.4ab | |
| D | 4.58ab | 4.50a | 4.19ab | 4.42a | 3.92ab | 4.27ab | 13.9c | 29.7c | |
| E | 4.50ab | 4.40a | 4.10ab | 4.60a | 3.80abc | 3.70ab | 13.7c | 23.1cd | |
| F | 4.00b | 4.25a | 3.88b | 4.25a | 3.63abc | 4.00ab | 10.5d | 20.3d | |
| G | 4.33ab | 4.33a | 3.83b | 4.33a | 4.17ab | 4.67a | 11.3d | 24.7cd | |
| H | 4.33ab | 4.33a | 3.67b | 4.33a | 4.37a | 4.33ab | 16.7ab | 50.0a | |
| Pr.(>F) | * | ns | ** | ns | ** | ** | ** | ** | |
| Mean | 4.53 | 4.30 | 4.14 | 4.41 | 3.76 | 3.97 | 14.1 | 29.6 | |
| Q. glauca | A | 4.33a | 4.00ab | 3.80ab | 4.00a | 3.53b | 3.60b | 14.7a | 26.8bc |
| B | 4.33ab | 4.24a | 4.03ab | 4.15a | 3.91ab | 3.91ab | 12.4b | 23.6c | |
| C | 4.20ab | 3.60ab | 4.30a | 4.20a | 4.30a | 4.50a | 15.2a | 40.7a | |
| D | 3.67b | 4.11ab | 3.56b | 3.89a | 3.89ab | 3.67ab | 8.8c | 17.3d | |
| E | 4.33a | 4.17ab | 3.92ab | 4.33a | 4.17ab | 4.58a | 10.8bc | 22.9cd | |
| F | 4.33ab | 4.33a | 3.67ab | 4.33a | 3.67ab | 3.67ab | 11.0bc | 33.7ab | |
| Pr.(>F) | * | * | ** | ns | * | ** | ** | ** | |
| Mean | 4.24 | 4.10 | 3.94 | 4.13 | 3.92 | 3.99 | 12.5 | 25.9 | |
| Variable | Superiority of Growth (SG) | Superiority of Tree Form (STF) | Adaptability to Disturbance (AD) | Adaptability to Environment (AE) | Superiority of Seed Production (SSP) | Potential of Seed Production (PSP) | Height (HT) | Diameter at Breast Height (DBH) |
|---|---|---|---|---|---|---|---|---|
| SG | - | −0.087 ns | 0.320 ** | 0.114 ns | −0.052 ns | −0.171 ns | 0.330 ** | 0.350 ** |
| STF | −0.050 ns | - | 0.010 ns | 0.332 ** | −0.049 ns | 0.094 ns | 0.021 ns | 0.043 ns |
| AD | 0.257 * | 0.083 ns | - | −0.099 ns | −0.354 ** | −0.279 ** | 0.321 ** | 0.178 ns |
| AE | 0.235 * | 0.086 ns | 0.140 ns | - | −0.035 ns | −0.076 ns | 0.071 ns | 0.088 ns |
| SSP | −0.057 ns | −0.132 ns | 0.149 ns | 0.250 * | - | 0.434 ** | 0.170 ns | 0.083 ns |
| PSP | −0.051 ns | −0.300 ** | 0.152 ns | 0.300 ** | 0.441 ** | - | 0.273 ** | 0.040 ns |
| HT | 0.353 ** | −0.215 ns | 0.227 * | 0.069 ns | −0.122 ns | −0.080 ns | - | 0.713 ** |
| DBH | 0.256 ns | −0.298 ** | 0.228 * | 0.197 ns | 0.225 ns | 0.267 ** | 0.597 ** | - |
| Q. salicina | Q. glauca | ||||
|---|---|---|---|---|---|
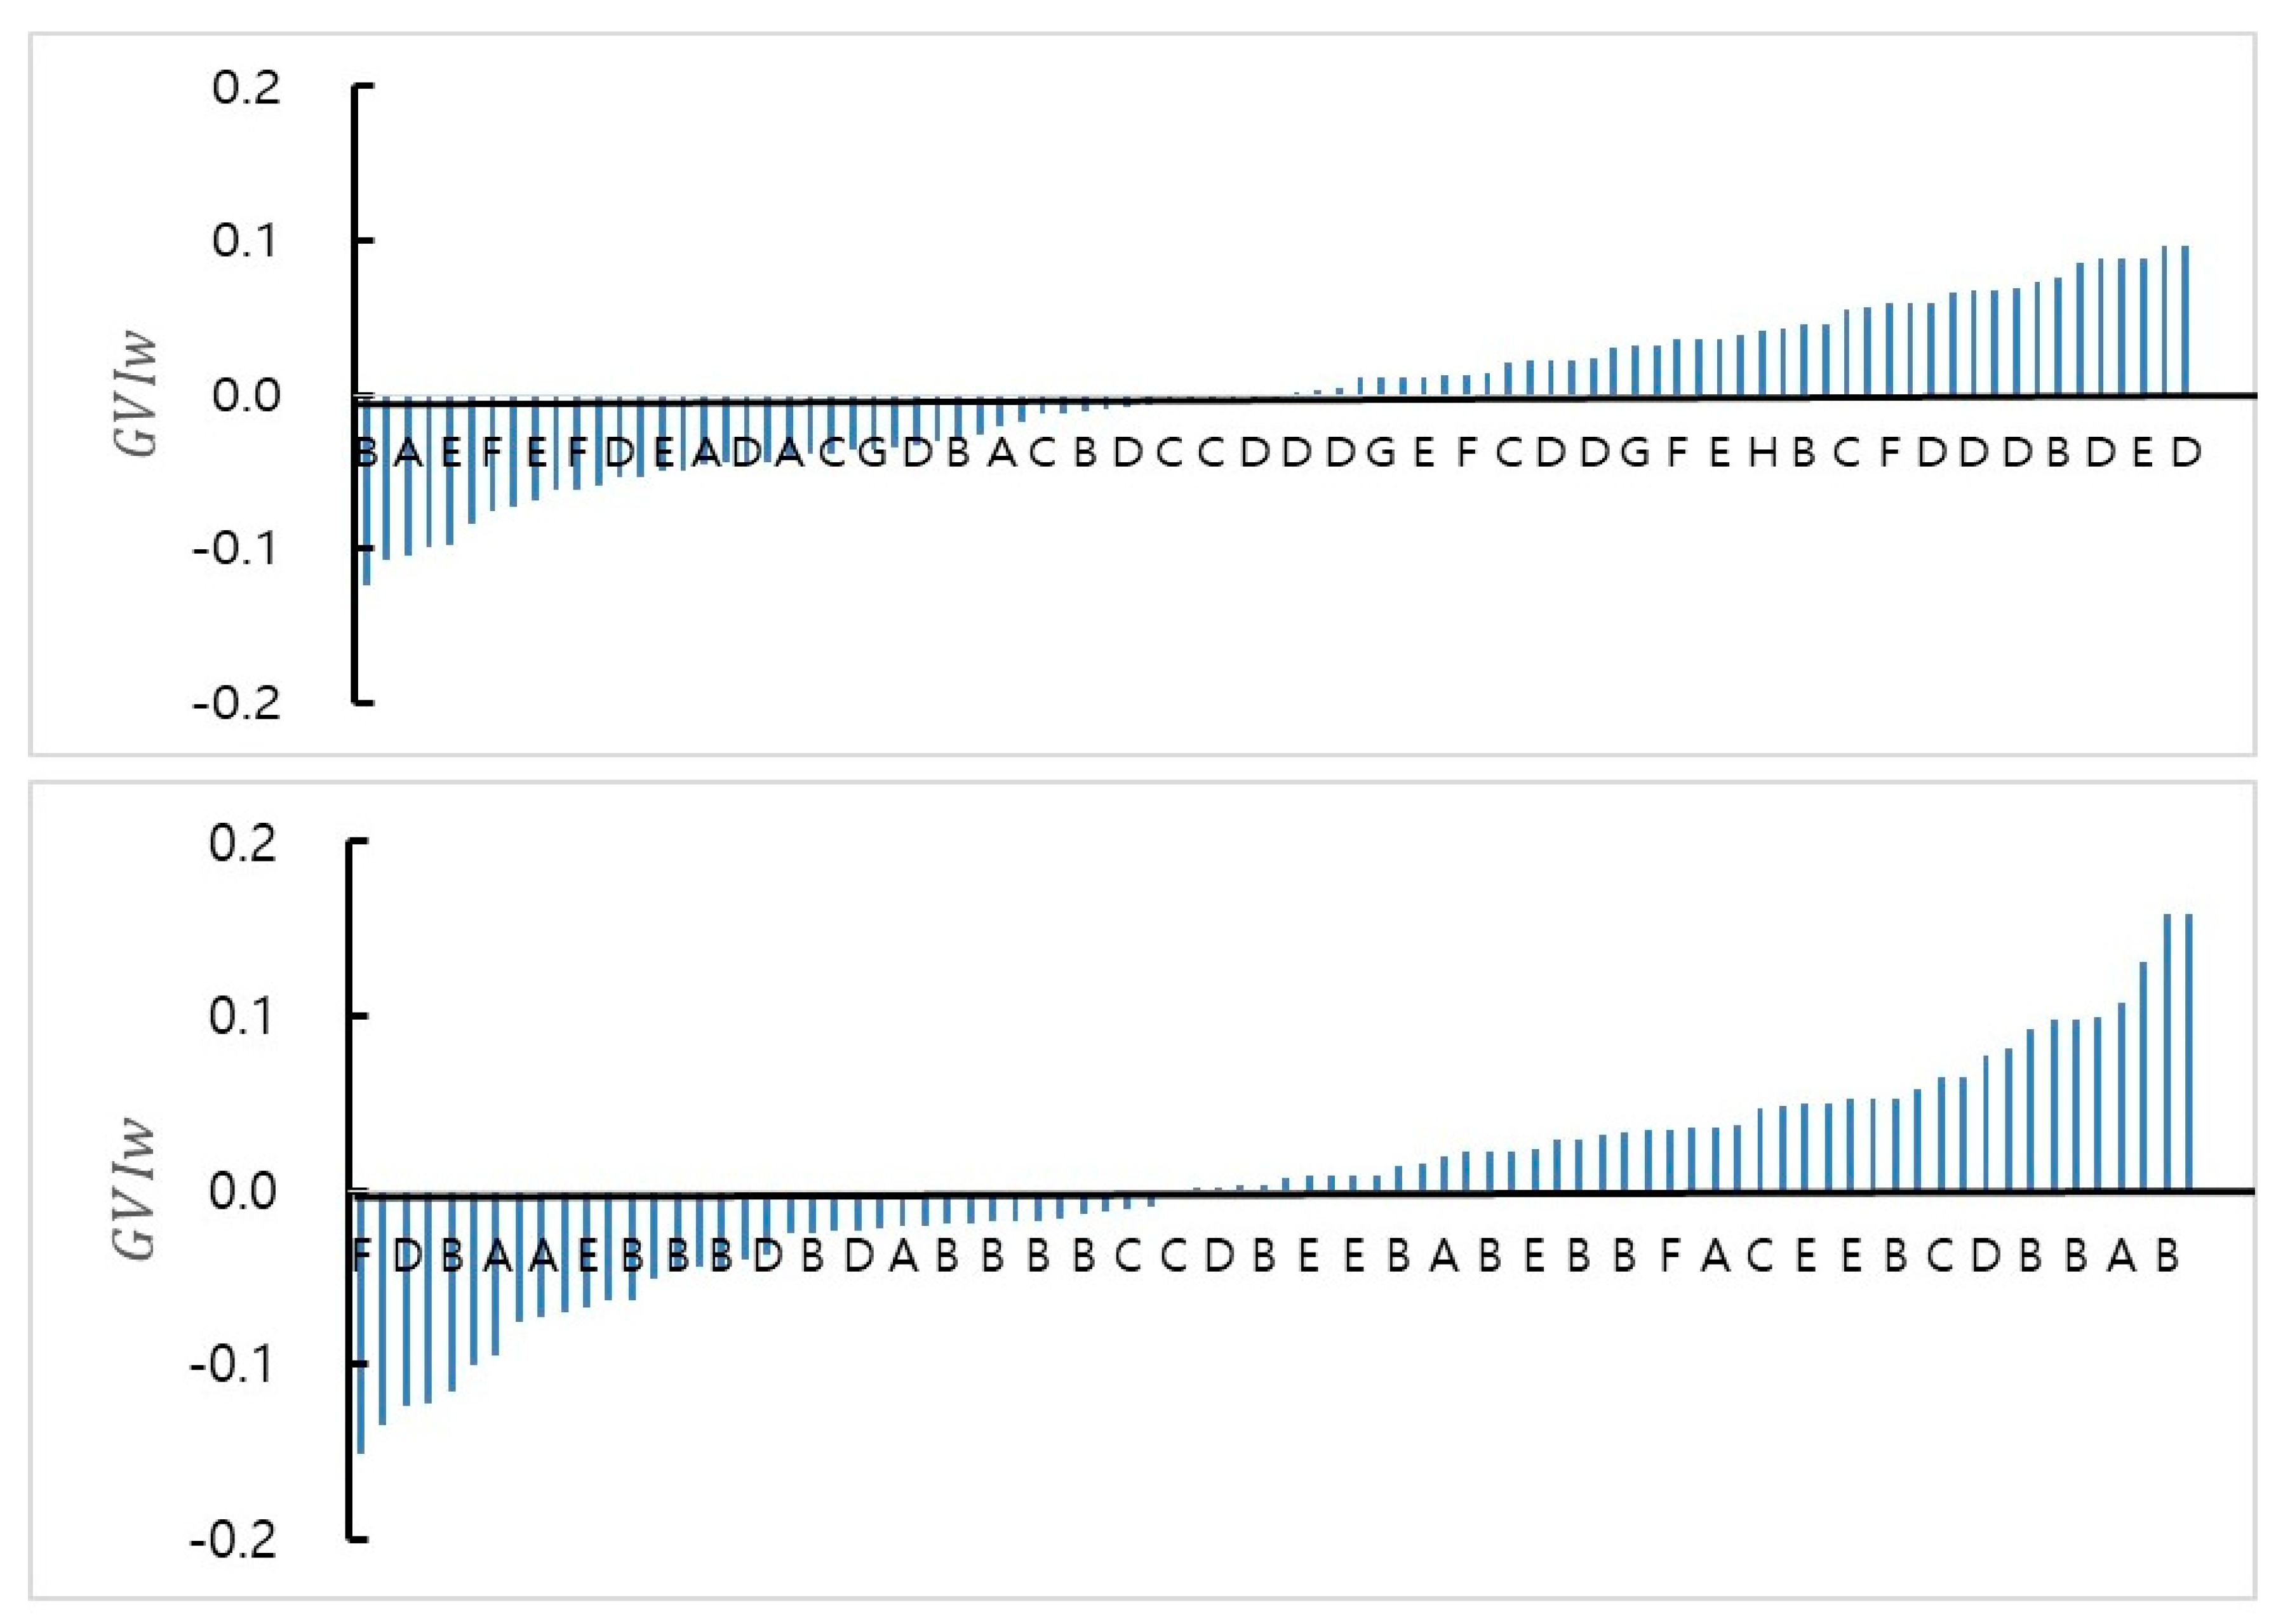
| Group | Accepted by Truncation (GVIw > 0) | Final Selection by Adjustment | Group | Accepted by Truncation (GVIw > 0) | Final Selection by Adjustment |
| A | 1, 4, 11 | 1, 4, 6, 8, 11 | A | 1, 5, 7, 10, 11, 12, 15 | 1, 3, 5, 7, 10, 12, 15 |
| B | 1, 2, 3, 8 | 1, 2, 3, 8 | B | 2, 5, 8, 9, 10, 12, 13, 14, 15, 17, 20, 21, 22, 23, 24, 27, 29 | 2, 4, 5, 8, 9, 12, 13, 15, 17, 20, 21, 22, 23, 24, 27, 29 |
| C | 2, 3, 4, 9, 12 | 2, 3, 4, 8, 9, 12, 14 | C | 1, 4, 6, 7, 8 | 1, 4, 6, 7, 8 |
| D | 2, 3, 4, 5, 6, 7, 8, 9, 10, 11, 13, 19, 20, 22, 25 | 2, 3, 4, 6, 8, 9, 10, 11, 13, 19, 20, 22, 25 | D | 2, 6, 7, 9 | 2, 4, 6, 7, 9 |
| E | 1, 5, 6, 7, 8, 10 | 1, 5, 7, 8, 10 | E | 2, 3, 4, 7, 8, 9 | 2, 4, 7, 8, 9, 12 |
| F | 1, 3, 4, 8 | 1, 3, 4, 8 | F | 1, 3 | 1, 3 |
| G | 2, 3, 4, 5 | 2, 3, 4, 5 | Total | 42 | 41 |
| H | 1, 2 | 1, 2 | |||
| Total | 43 | 44 | |||
| Species | Class | Mean Values of Each Characteristic | Height (HT) | Diameter at Breast Height (DBH) | |||||
|---|---|---|---|---|---|---|---|---|---|
| Superiority of Growth (SG) | Superiority of Tree Form (STF) | Adaptability To Disturbance (AD) | Adaptability to Environment (AE) | Superiority of Seed Production (SSP) | Potential of Seed Production (PSP) | ||||
| Q.salicina | Accepted (A) | 4.72 | 4.48 | 4.20 | 4.57 | 3.89 | 4.20 | 14.1 | 30.9 |
| Rejected (R) | 4.33 | 4.12 | 4.07 | 4.26 | 3.63 | 3.72 | 14.0 | 28.3 | |
| A/R (%) | 109.0 | 108.7 | 103.2 | 107.3 | 107.2 | 112.9 | 100.7 | 109.2 | |
| Q.glauca | Accepted (A) | 4.49 | 4.20 | 4.05 | 4.34 | 4.15 | 4.10 | 12.9 | 27.2 |
| Rejected (R) | 4.00 | 4.00 | 3.83 | 3.93 | 3.68 | 3.88 | 12.1 | 24.5 | |
| A/R (%) | 112.3 | 105.0 | 105.7 | 110.4 | 112.8 | 105.7 | 106.6 | 111.0 | |
© 2020 by the authors. Licensee MDPI, Basel, Switzerland. This article is an open access article distributed under the terms and conditions of the Creative Commons Attribution (CC BY) license (http://creativecommons.org/licenses/by/4.0/).
Share and Cite
Kim, I.S.; Lee, K.M.; Shim, D.; Kim, J.J.; Kang, H.-I. Plus Tree Selection of Quercus salicina Blume and Q. glauca Thunb. and Its Implications in Evergreen Oaks Breeding in Korea. Forests 2020, 11, 735. https://doi.org/10.3390/f11070735
Kim IS, Lee KM, Shim D, Kim JJ, Kang H-I. Plus Tree Selection of Quercus salicina Blume and Q. glauca Thunb. and Its Implications in Evergreen Oaks Breeding in Korea. Forests. 2020; 11(7):735. https://doi.org/10.3390/f11070735
Chicago/Turabian StyleKim, In Sik, Kyung Mi Lee, Donghwan Shim, Jin Jung Kim, and Hye-In Kang. 2020. "Plus Tree Selection of Quercus salicina Blume and Q. glauca Thunb. and Its Implications in Evergreen Oaks Breeding in Korea" Forests 11, no. 7: 735. https://doi.org/10.3390/f11070735
APA StyleKim, I. S., Lee, K. M., Shim, D., Kim, J. J., & Kang, H.-I. (2020). Plus Tree Selection of Quercus salicina Blume and Q. glauca Thunb. and Its Implications in Evergreen Oaks Breeding in Korea. Forests, 11(7), 735. https://doi.org/10.3390/f11070735