Article

Landscape Patterns of Rare Vascular Plants in the Lower Athabasca Region of Alberta, Canada

by
Scott E. Nielsen
1,*,
Jacqueline M. Dennett
1 and
Christopher W. Bater
2
1
Department of Renewable Resources, University of Alberta, Edmonton, AB T5K 2M4, Canada
2
Forest Stewardship and Trade Branch, Alberta Agriculture and Forestry, Edmonton, AB T5K 2M4, Canada
*
Author to whom correspondence should be addressed.
Forests 2020, 11(6), 699; https://doi.org/10.3390/f11060699
Submission received: 30 May 2020 / Revised: 19 June 2020 / Accepted: 22 June 2020 / Published: 24 June 2020
(This article belongs to the Special Issue Forest Biodiversity Conservation with Remote Sensing Techniques)

Abstract

:
Predicting habitat for rare species at landscape scales is a common goal of environmental monitoring, management, and conservation; however, the ability to meet that objective is often limited by the paucity of location records and availability of spatial predictors that effectively describe their habitat. To address this challenge, we used an adaptive, model-based iterative sampling design to direct four years of rare plant surveys within 0.25 ha plots across 602 sites in northeast Alberta, Canada. We used these location records to model and map rare plant habitats for the region using a suite of geospatial predictors including airborne light detection and ranging (LiDAR) vegetation structure metrics, land cover types, soil pH, and a terrain wetness model. Our results indicated that LiDAR-derived vegetation structural metrics and land cover were the most important individual factors, but all variables contributed to predicting the occurrence of rare plants. For LiDAR variables, rarity was negatively related to maximum canopy height, but positively related to canopy relief ratio. Rarity was therefore more likely in places with shorter canopy heights and greater structural complexity. This included fens, which overall had the highest rates of rare plant occurrence. Model-based allocation of sampling led to detections of uncommon species at nearly all sites, while the rarest species in the region were detected at an average encounter rate of 8%. Landscape predictions of rare plant habitat can improve our understanding of environmental limits in rarity, guide local management decisions and monitoring plans, and provide regional tools for assessing impacts from resource development.

1. Introduction

A key tool in biodiversity conservation is mapping where species are most likely to occur. This allows for the understanding of patterns in species occurrence, identification of biodiversity hotspots, and provides needed visualizations for managers. However, creating these products and understanding broad patterns in the spatial distribution of taxa require field data that can be difficult and costly to acquire. Furthermore, spatial models of plant richness, occurrence, or abundance require environmental predictors that have been collected over broad spatial extents at an adequate resolution [1]. Sampling and modeling of rare species (i.e., those of high conservation value) is complicated by the fact that they are often cryptic in nature, associated with uncommon habitats, or are largely data-deficient [2]. These factors contribute to knowledge gaps on rare species including information on where they are most likely to occur, how they may respond to disturbances, and where best to allocate limited conservation resources.
One approach to tackling this challenge and to increase the probability of locating rare species during surveys is to use a model-based sampling design rather than the traditional random or systematic designs that dominate many monitoring and survey efforts [2,3]. In essence, a spatial model representing empirical relationships between species occurrence and environmental variables (often derived from remote sensing data) is used to direct sampling and thereby increase the likelihood of encountering the species of interest [2,3,4]. This approach has been used successfully for rare or uncommon taxa [5,6,7] including for specialists with narrow geographic ranges, which are challenging to model [5,8]. This design can be applied iteratively when the model used to conduct initial sampling is updated with new information (e.g., data from additional surveys), as a result, the model and subsequent predictions are adaptive. In addition to creating efficiencies of up to 70% in cost savings [3], adaptive designs provide up-to-date products that can be used to guide future sampling and inform management decisions related to the original monitoring objectives. An iterative modeling and sampling design follows the approach of Guisan et al. (2006) [3] and has been used successfully in invasive plant species detection and mapping [9].
Spatial models require accurate predictors of environmental variables, and recent advances in the resolution, quality, and availability of remote sensing products have been highly advantageous to landscape ecologists [10]. High resolution remotely sensed products have the capacity to not only allow for predictive mapping at broad scales, but are also expected to improve model accuracy over those that do not include such metrics [1]. In particular, the use of airborne light detection and ranging (LiDAR) has grown rapidly. Airborne LiDAR systems can simultaneously map vegetation vertical structure and terrain morphology with decimeter accuracies at high spatial resolutions, making LiDAR-derived datasets ideal for ecological applications [10,11]. Model-based sampling, as described above, can now be applied across larger areas and a greater number of taxa, thereby improving sampling efficacy [3]. LiDAR metrics have been shown to correlate with rare species occurrence and have been used to identify suitable habitats for threatened species in a small number of studies [6,12,13]. For example, LiDAR data were used to identify sheltered topographic depressions that correlated to the occurrence of six rare plant species in Hawaii; the resulting habitat suitability maps are meaningful tools that can be used to guide targeted sampling and management activities including reintroduction efforts for those species [13]. LiDAR metrics were also shown to accurately predict the occurrence of a rare coastal plant species strongly associated with a specific sand dune type, and moreover, the resulting model accurately identified unsuitable habitats [12], which has significant value in improving the efficacy of field surveys for rare species. Broadly, the application of LiDAR to predicting rare plant habitats remains largely unexplored [1], but may make a meaningful contribution to understanding patterns in rarity at landscape to regional scales.
Predicting and understanding rare plant occurrence and habitat is of particular importance in rapidly developing landscapes. Land clearance and anthropogenic-induced factors such as the introduction of invasive species [14] and altered disturbance regimes threaten rare species persistence, and thus regional biodiversity [15]. The Lower Athabasca region of northeast Alberta is rich in oil and gas, with rapid development of these resources in the past few decades; this has resulted in losses of sensitive peatland habitats as well as upland areas [16]. Although significant efforts have been made toward the reclamation of oil sands developments and determining the responses of individual plant species to both disturbance and reclamation treatments [17,18,19,20], major knowledge gaps remain in understanding regional patterns of rarity and the relationships between oil sands disturbances and rare plants. It is clear that plants and associated habitats are lost directly to oil sands mining [21] and that fragmentation from smaller-footprint in situ operations affects plants [20], but the extent to which rare plants are threatened by these landscape changes is currently unknown, and large-scale resource extraction is ongoing. Therefore, efficient and effective sampling and the development of mapping tools that represent rare species or rare species habitats are needed for this region. LiDAR data are available for this region, and derived vegetation structural metrics represent powerful predictors that can be tested and used toward this goal [22,23]. Our purpose here was to develop and apply an adaptive, model-based sampling design that defines rare plant habitat for a suite of rare species in the Lower Athabasca region of northeast Alberta. Specifically, our objectives were to: (1) identify the landscape factors that most affect presence of rare vascular plants regionally; and (2) predict (map) rare plant habitat across the Lower Athabasca region. Understanding habitat relationships and the development of spatial tools and maps for the area provides an opportunity to improve land use decision-making, regional monitoring, and stewardship.

2. Materials and Methods

2.1. Background to Initial Model Building, Field Methods, and Data Sources

We adopted a model-based approach to surveying and predicting rare plant habitat within the Lower Athabasca region (south of Lake Athabasca) in northeast Alberta, Canada (Figure 1) using the following three steps: (1) creating an initial model of potential rare plant habitat using existing data on rare plant species occurrences and readily available landscape predictors in the study region, in particular Ducks Unlimited Enhanced Wetland Classification (DU-EWC) land cover types [24] and terrain-derived measures from a 50 m digital elevation model (see Section 2.4 for more details); (2) stratifying field sampling based on model predictions and more heavily weighting visits to sites that were predicted to have rare plants, while still including predicted non-habitats to ensure widely distributed sampling and testing of the model; and (3) re-developing the rare plant model using new field data to improve predictions and the locations of subsequent sampling sites (i.e., we iterated this process for each year of sampling). Further details of each of these three steps are given below. The definitions of rare plants followed sub-national status ranks (S-ranks) assigned by the Alberta Conservation Information Management System (ACIMS), following the globally applied NatureServe methodology [25]. Specifically, we used any species ranked S1 and S2 as ‘rare’ and those ranked S3 as ‘vulnerable’ or uncommon.
Field sampling took place across a four-year period from 2012 to 2015, and in each year, steps 2 and 3, as described above, were repeated to improve sampling efficiency. A detailed field sampling methodology is provided elsewhere [26,27]. Briefly, plot size was 0.25 ha (50 × 50 m), which was selected to align with the plot sized used by a provincial-scale biodiversity monitoring program [28]. Experienced observers (i.e., individuals with multiple years of survey experience, n = 18 across all years) who underwent region-specific training were asked to survey the plot by walking parallel lines without time constraints. Surveys were completed during the growing season (mid-June to mid-August). Observers worked in pairs, but surveyed plots independently. Although the emphasis was rare plants, observers recorded the presence of all vascular plants within plots to fully describe assemblages. Given the large plot size, no effort was made to estimate cover or abundance of common species. Sites were constrained to be within 2.5 km of roads to ensure accessibility, but in one year of sampling helicopter support was used to access remote sites. Although the geographic extent of sampling was therefore limited in some areas, this did not appear to affect the environmental space of what was sampled, which was of primary concern here. In total, 602 sites were sampled over the four-year period at approximately similar sample sizes per year.
Site selection for field sampling in 2012 was weighted toward places that were predicted to have rare species based on species distributions predicted using maximum entropy models [20] for 66 regionally rare plants that used regional sources of existing occurrence data (~14,000 ACIMS records; ~1100 records from other sources). Once initial field data were collected in 2012, we adjusted our approach to use only our field observations to ensure consistent protocols, a consistent plot size (0.25 ha), and recent data. We also focused on S1 and S2 ranked species, since nearly all sites encountered at least one S3 species. Rather than focus on individual species with limited numbers of observations, we instead coded any plots with at least one S1 or S2 species as ‘present’ (1) and those sites without a S1 or S2 species as ‘absent’ (0). This emphasized our objective of identifying potential rare plant habitat and not necessarily numerous models of individual species. Logistic regression [29] was then used to model the probability of a site having a rare plant (S1 and/or S2) present using STATA 14 software [30]. Again, the DU-EWC layer was used in all years, with additional terrain variables included as predictors. A map of potential rare plant habitat was then estimated annually from the best supported model, determined using Akaike’s information criteria (AIC) comparison [31], and sampling sites for subsequent years were directed by map predictions (described further in Section 2.2).

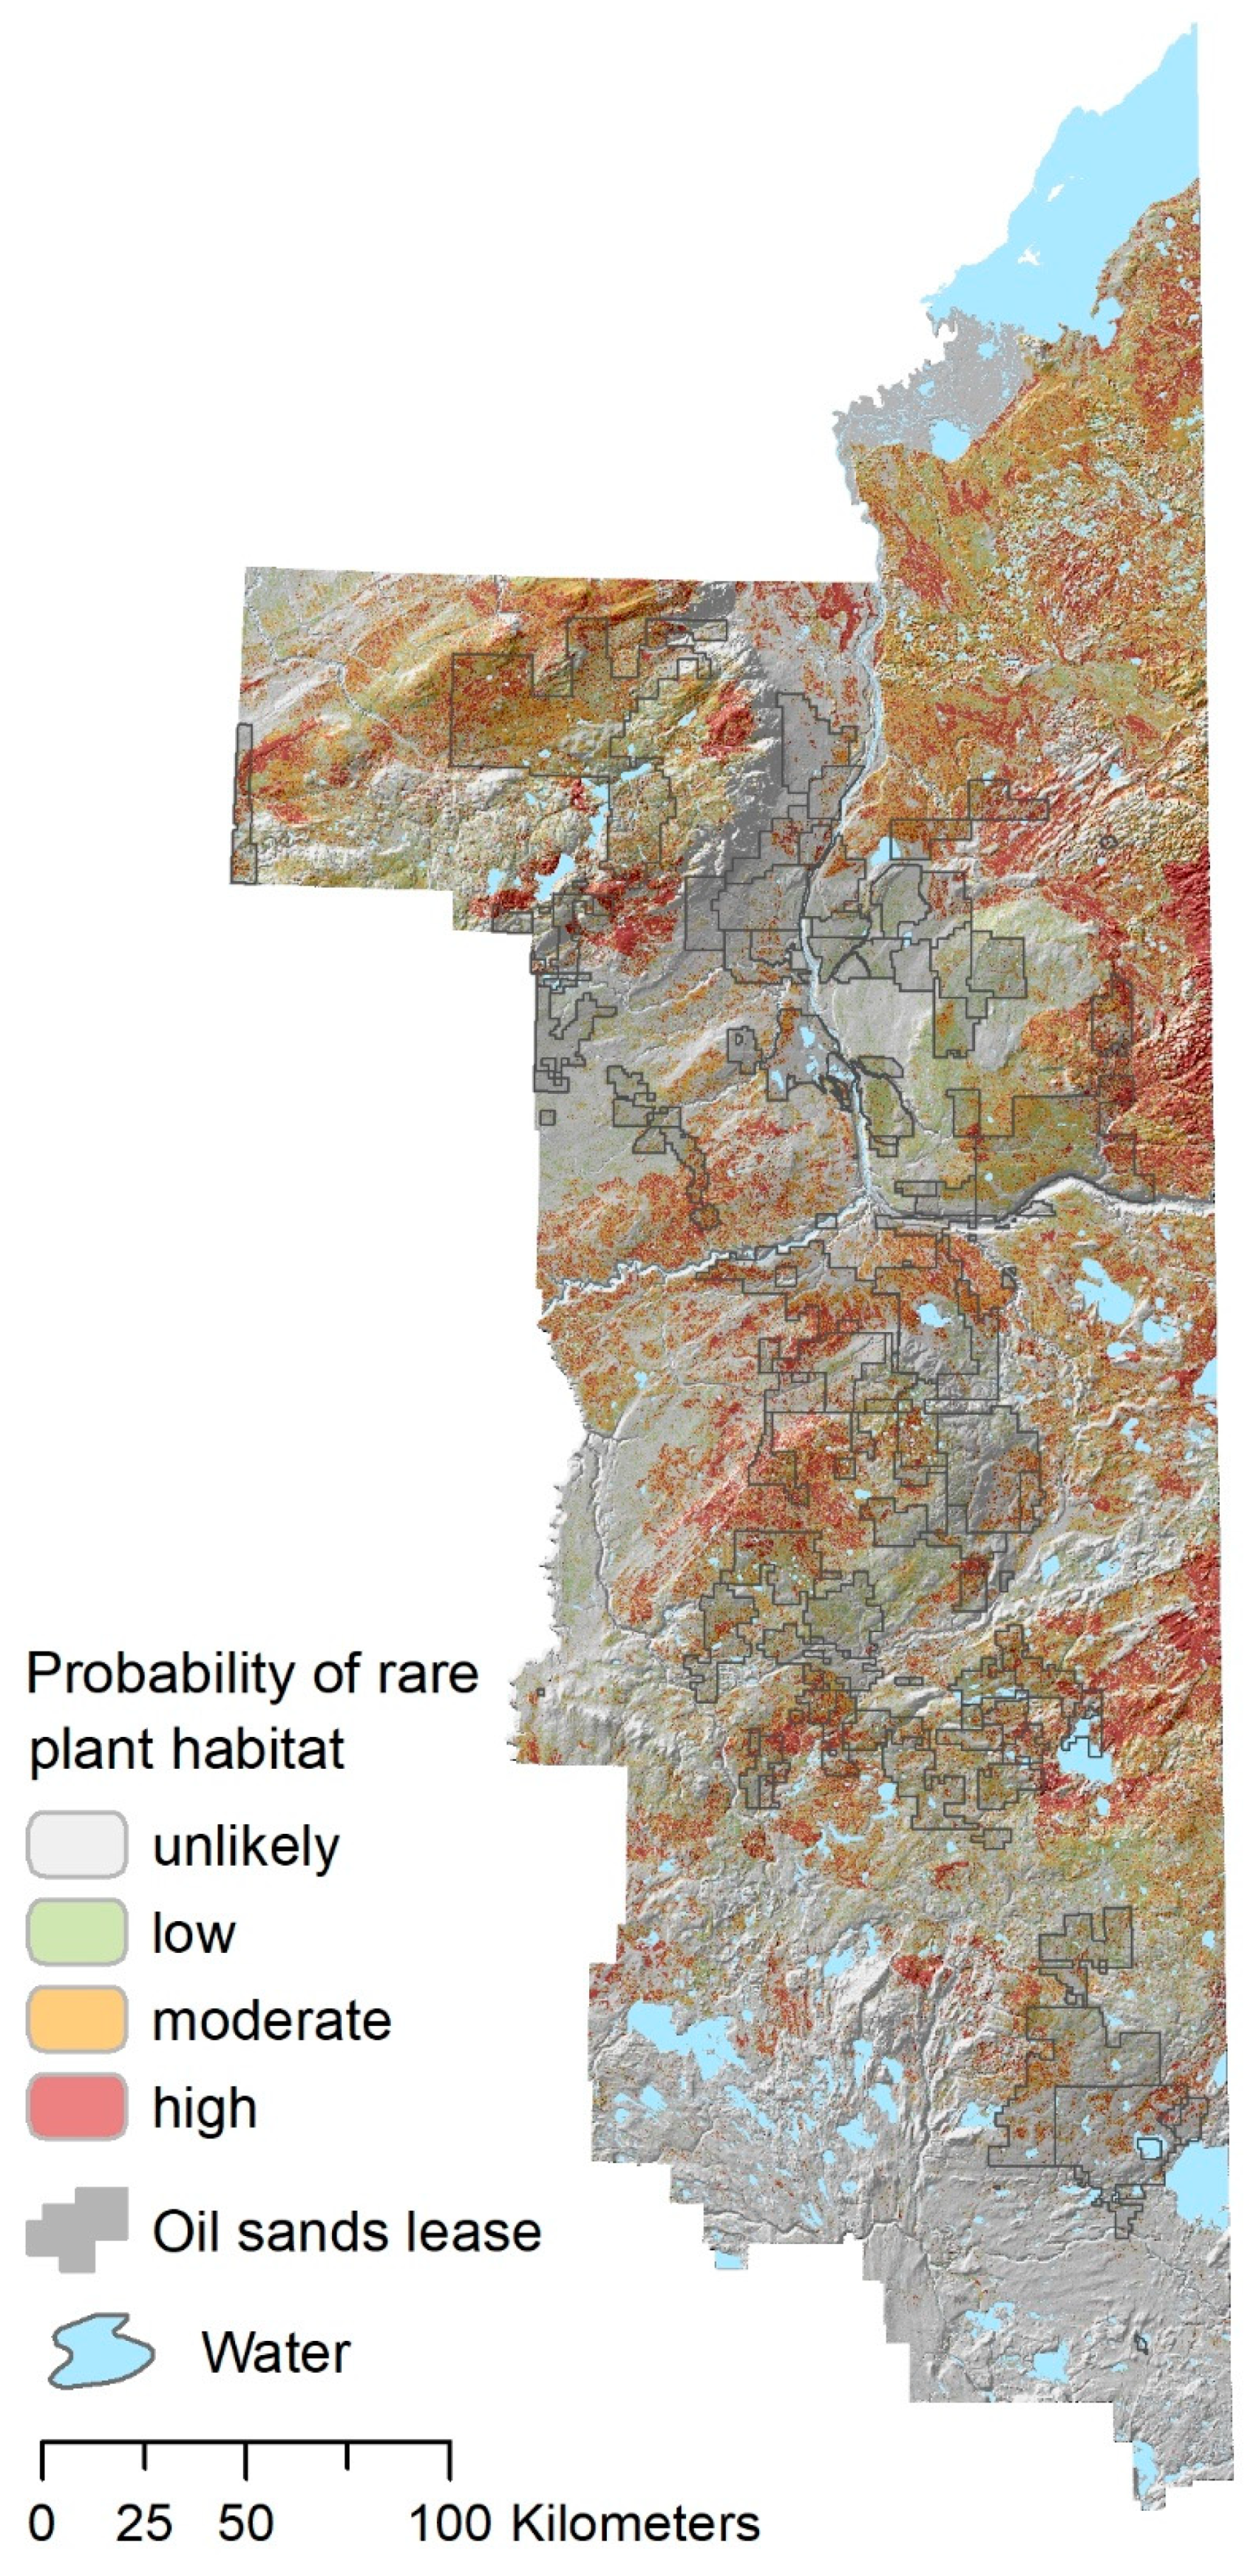
2.2. Final Landscape Map of Rare Plant Habitat

The final model predicting rare plant habitat compared all field observations from four years of sampling (n = 602 plots) to the DU-EWC land cover classification (Figure 2a), a terrain-derived moisture index (2b), soil characteristics (soil pH) (2c), and LiDAR-derived vegetation structure metrics (2d). LiDAR-derived metrics represented vertical vegetation structure because initial tests indicated that these measures were stronger predictors of plant rarity than horizontal measures such as canopy cover. Climate variables were not considered since the study region is small relative to variations in climate.
The DU-EWC land cover classification included a number of detailed wetland classes (Table 1), for example, graminoid rich fen. Separation of wetland types (e.g., treed bog, graminoid poor fen) was needed given the prevalence and importance of these land cover types in the Lower Athabasca, where some areas are 60–70% wetland (primarily peatlands and much of it treed peatlands) [32]. Anthropogenic habitats (clear cuts, agriculture, industry developments) as well as aquatic habitats dominated by open water were not considered and thus masked in the final model by assuming absence of terrestrial rare plant species.
Terrain-derived variables included a moisture index estimated from a 50-m digital elevation model (DEM) [33] using the Compound Topographic Index (CTI) method [34,35]. Although a one meter LiDAR-based depth-to-water (DTW) metric [36] was available for part of the study region, comparisons within that area indicated that the 50 m DEM-derived CTI model performed as well or better than the more detailed DTW predictions, and thus CTI was subsequently used in all models. Soil characteristics of the region were described by soil pH obtained from Soil Landscapes of Canada version 3.2 [37]. Although other soil variables were available, they were either highly correlated with soil pH or did not correlate well with rare plant locations.
LiDAR-derived metrics was available for most, but not all, parts of the study area (see gray areas in Figure 1d) effectively representing crown lands outside of the Cold Lake Air Weapons Range. Models using LiDAR data therefore represented a subset of plots (469 sites). We first developed models that covered the area of LiDAR extent (n = 469) and then applied the same model structure, minus LiDAR variables, for the full dataset (n = 602), thus allowing us to fill in those areas without LiDAR data with similar models. LiDAR point cloud metrics were summarized for the region at the same scale of the plot (50 m raster resolution) using FUSION software [38]. Final LiDAR-derived variables used for rare plant models included canopy relief ratio (CRR) [39,40] and maximum canopy height (95th centile, shown in Figure 1b) as the other variables were highly correlated (r > |0.7|) and/or had little predictive value based on univariate tests. CRR is simply the mean height minus the minimum height divided by the maximum height minus the minimum height. Final predictor variables had a 50-m raster cell size to ensure that they corresponded to the plot size and were checked to ensure low between-variable correlations (r < |0.7|) to minimize problems with multicollinearity. Non-linear responses for continuous variables such as soil pH were considered and included if initial univariate tests demonstrated an improved model fit. Finally, AIC was used to compare combinations of variables as single-factor models (i.e., Soils [S], Terrain wetness [T], Land cover [L], and Vegetation structure [V]), two-factor models that had combinations of these single factors (note that single factor models could include more than one variable such as non-linear variables or multiple measures of the same factor such as vegetation structure), three-factor models that combined three of the four factors, and finally a single global model that included all four factors.
Models were fit for both datasets (with and without LiDAR). The lowest AIC was considered the most supported model. We then used the reported coefficients to map predictions using the ArcGIS (version 10.5, ESRI, 2016) raster calculator. Model performance and the predictive accuracy of final models were reported as percent deviance explained (pseudo-R2) and Area-Under-the-Curve Receiver Operating Characteristic (AUC-ROC). Although ecological models often have poor explanatory power (2–5% R2, [41]), we considered models with pseudo-R2 > 0.2 as being reasonably good in explanatory power and predictive accuracy assessed by AUC-ROC values based on the criteria of ROC < 0.7 being poor model accuracy, 0.7–0.9 good model accuracy, and > 0.9 high model accuracy [42,43]. As airborne LiDAR data describing vegetation structure were not available across the entire study area (Figure 1d), but we were interested in using the best available information (predictions), the final map of potential rare plant habitat used the LiDAR-based model where available, with the remaining areas filled in with predictions from the non-LiDAR model using the Conditional tool in ArcGIS (see the grey hillshade area in Figure 2d).

3. Results

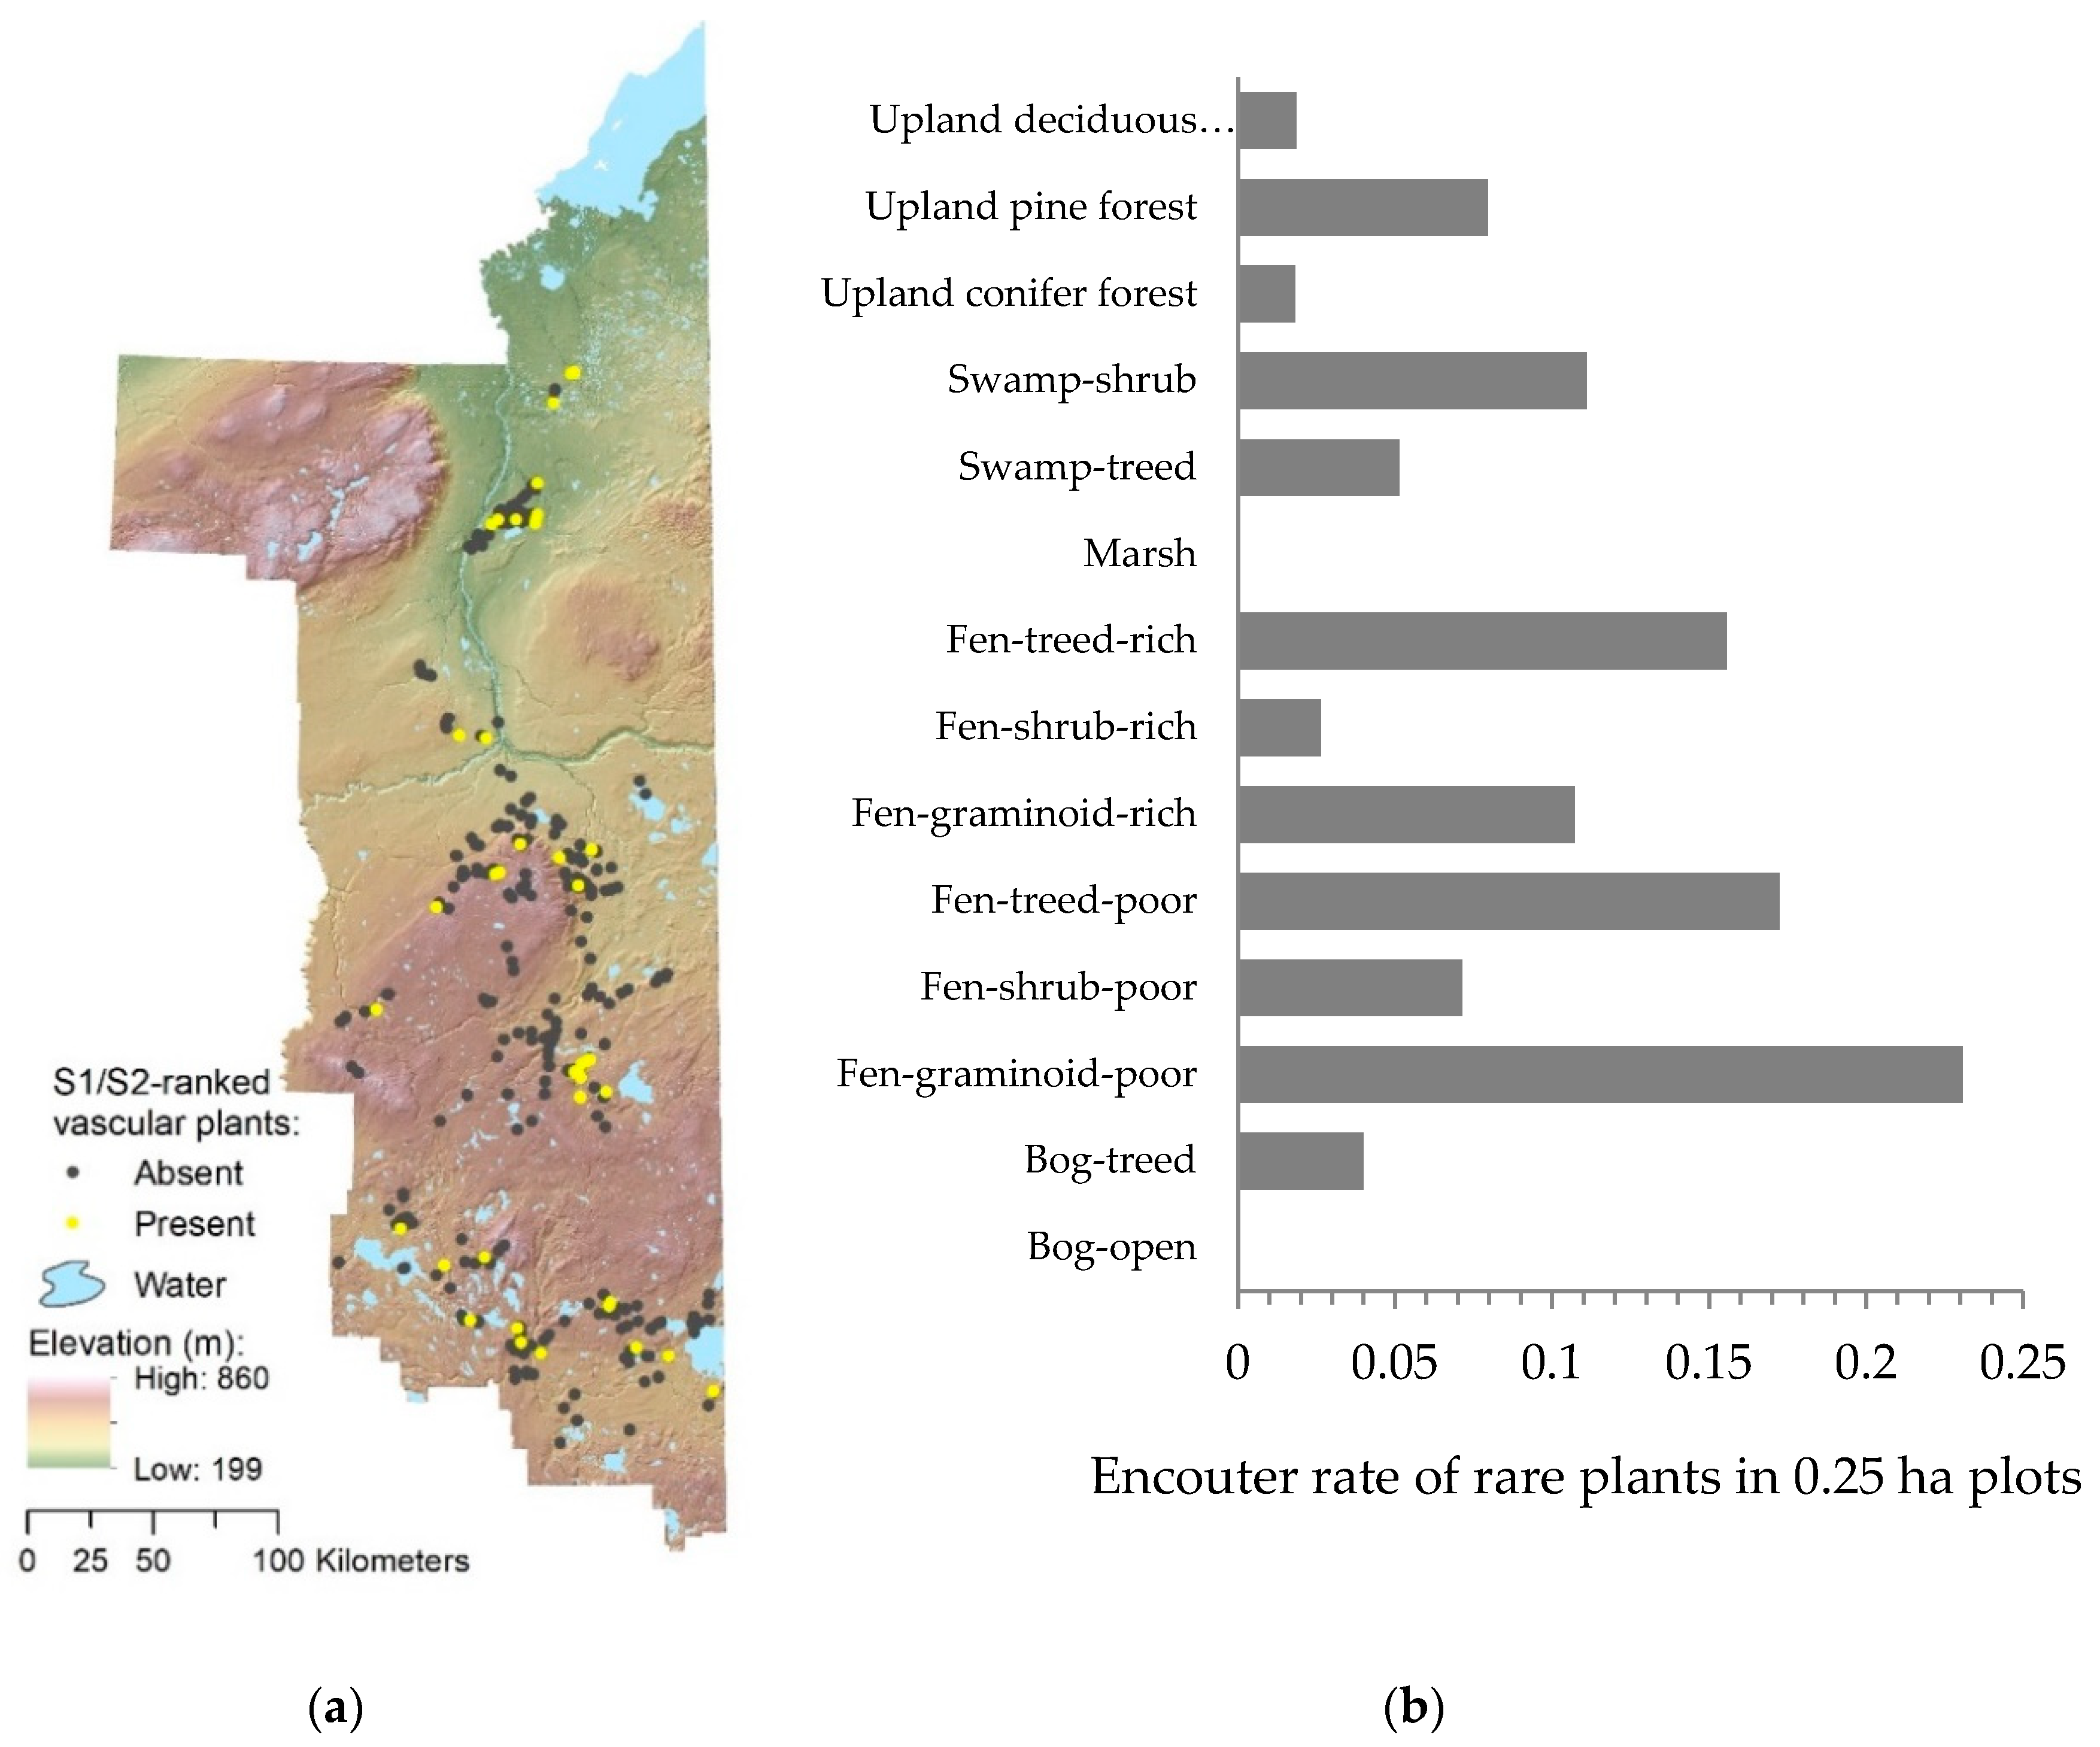
3.1. General Patterns in Plant Rarity

A total of 59 observations of 17 rare vascular plant species (i.e., those with S1 or S2 status, Appendix A, Table A1) were detected within 47 of the 602 plots (~8% of sites with at least one S1 or S2 species; 39 plots when limited to the extent of available LiDAR data) (Figure 3a). Vulnerable species (i.e., those ranked S3) were located at nearly 100% of plots. Encounter (detection) rate of rare plants (S1 and S2) varied substantially among land cover classes with the highest encounter rates found in fens and lowest encounter rates in some of the upland forest types, marshes, and open bogs (Figure 3b), although some of these classes had lower sample sizes. In particular, graminoid and treed fens had high encounter rates of rare plants, at >10% of sites, more than 3-fold higher than that of upland deciduous and upland conifer (non-pine dominated) stands which averaged <3%. Indeed, the highest encounter rate of rare species (e.g., Carex heleonastes, Malaxis paludosa, and Juncus stygius) was found within graminoid poor fens at 23% of sites. Interestingly, although upland pine forest is considered to be species-poor in vascular plant composition, it contains a number of rare species (e.g., Spiranthes lacera, Carex umbellata, and Carex adusta) that reach presence in nearly 10% of survey sites.

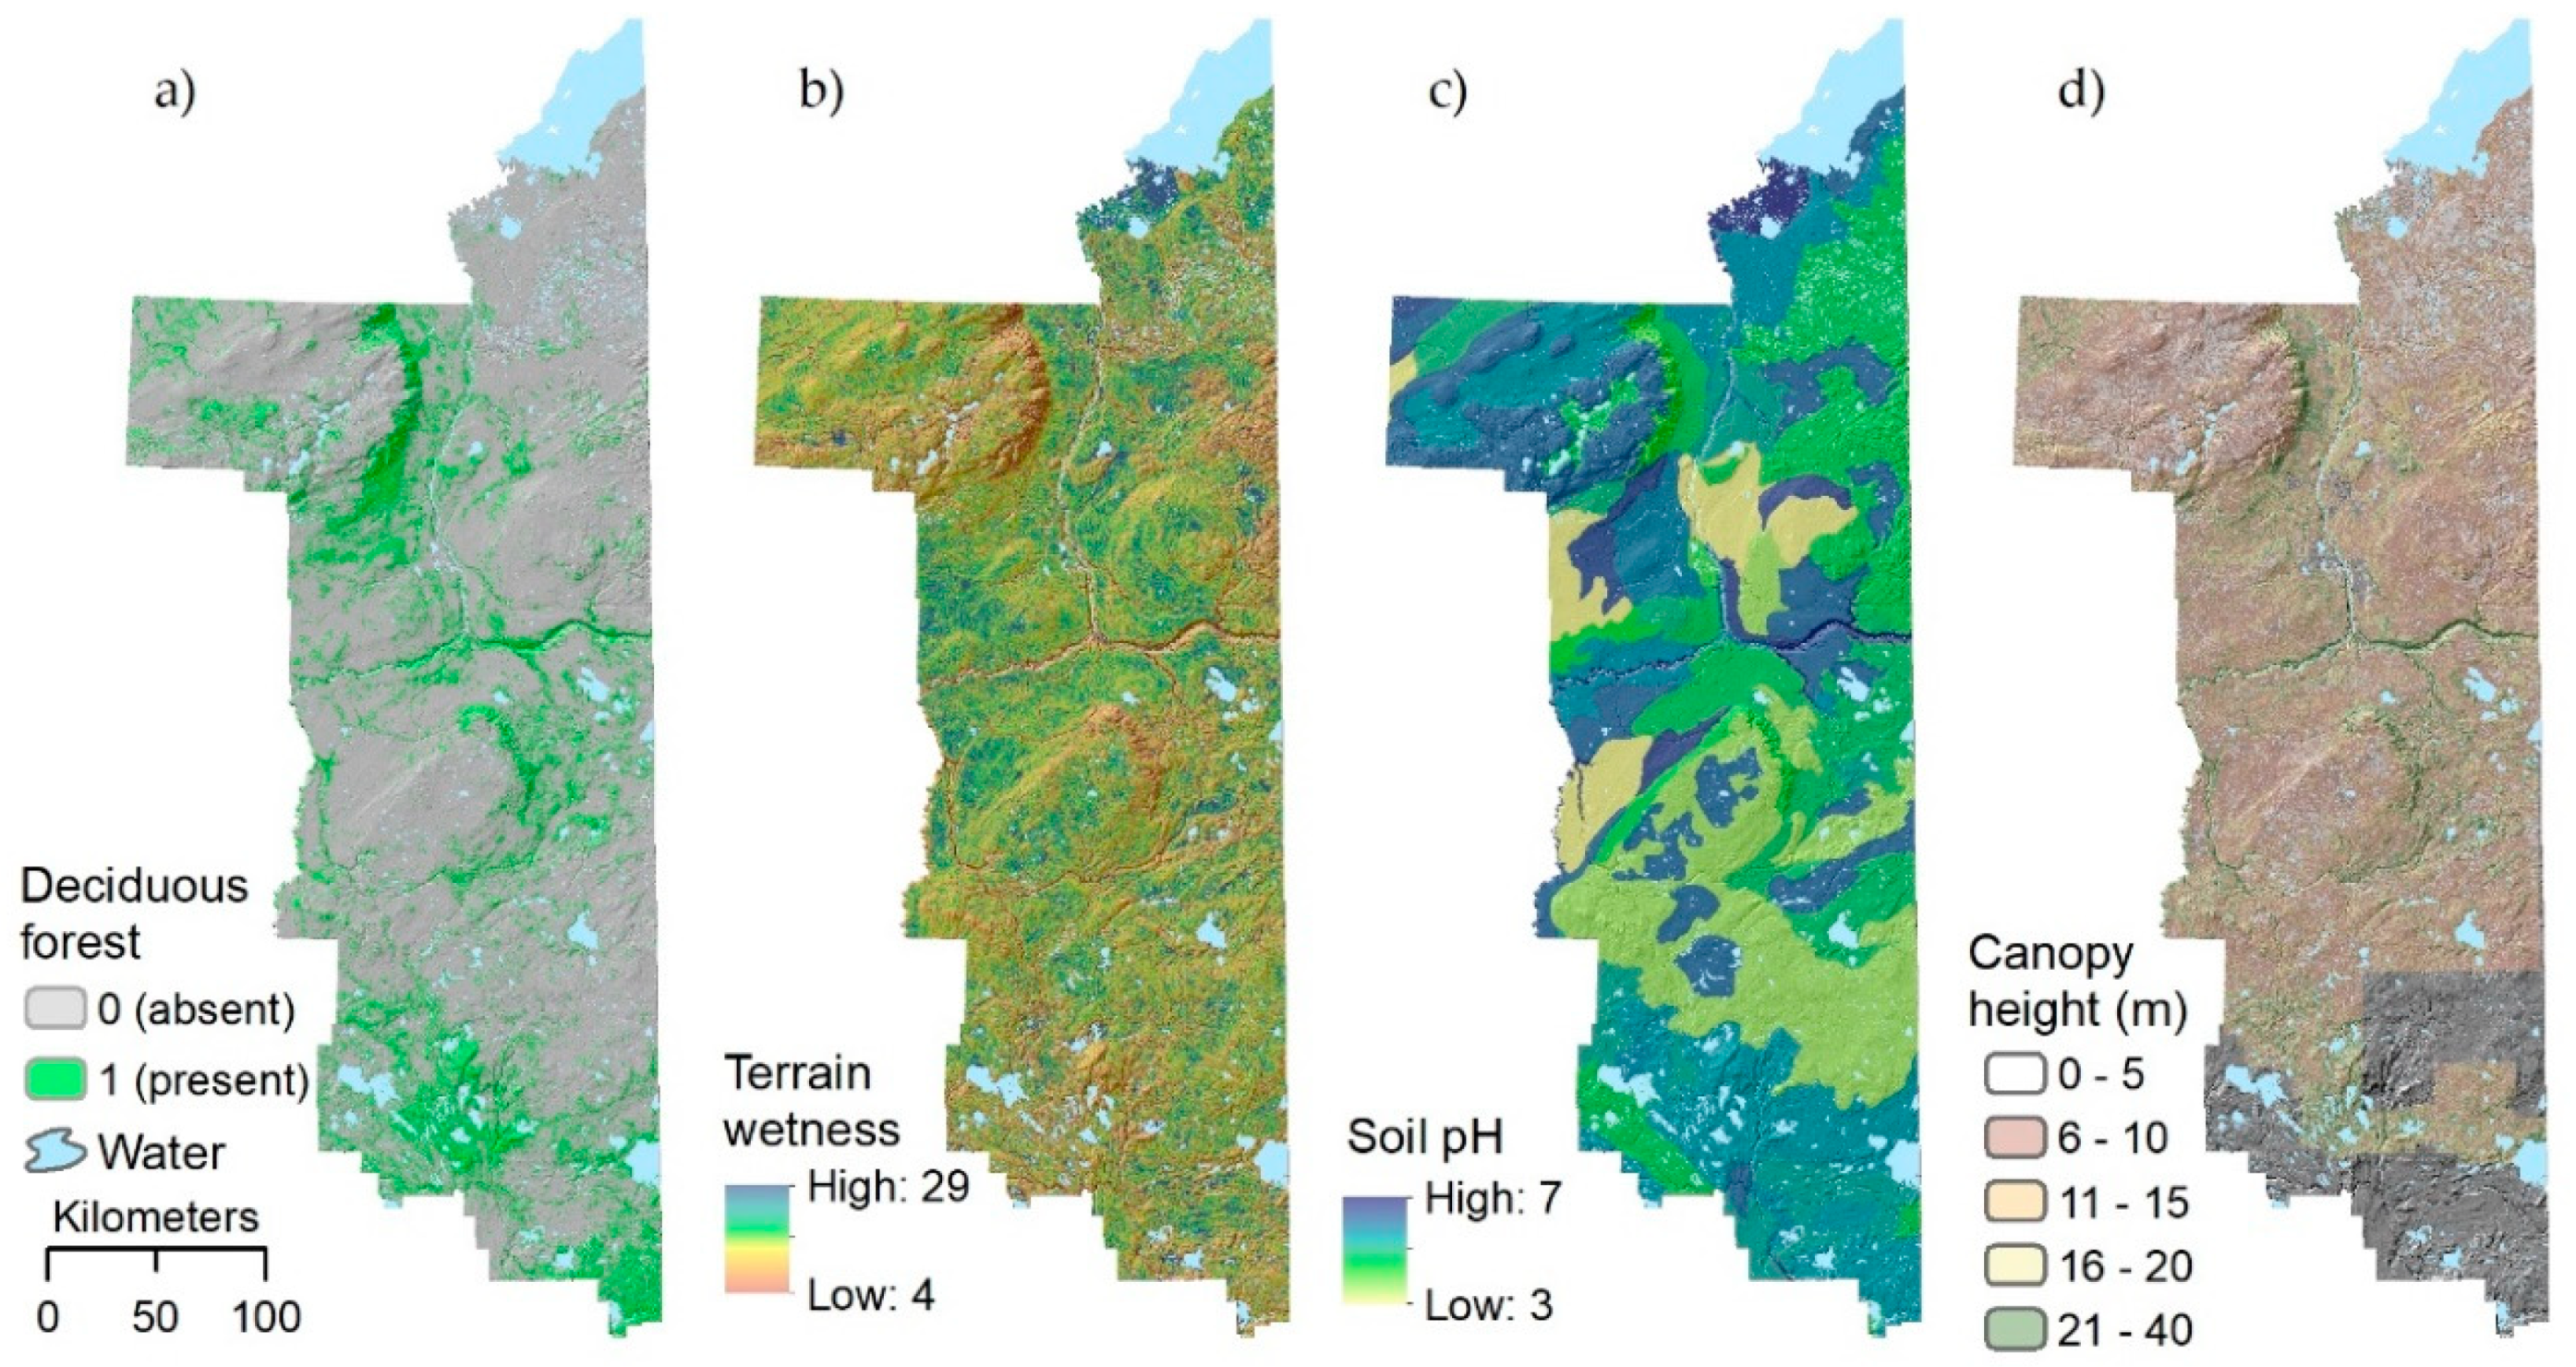
3.2. Landscape Predictors of Plant Rarity

The most supported model (lowest AIC) predicting rare plant presence for S1 and S2 species included all individual landscape factors related to soils, terrain wetness, land cover, and vegetation structure (Table 2). When considering individual (single) factors, LiDAR-derived vertical vegetation structure, as measured by maximum canopy height (95th centile) and canopy relief ratio, was more supported (∆AIC > 4) than soils, terrain wetness, or land cover alone. Land cover alone was ranked second, terrain wetness third, and last, soil pH that was similar to the null model suggesting no support when considered individually. Although land cover was less supported than vegetation structure, this could be due to classification errors in the land cover product or simply from greater model complexity since model accuracy (ROC) was similar between the two and fit was marginally higher for the more complicated land cover model (Table 2). The most supported two-factor model included vegetation structure and land cover and this model was more supported than vegetation structure alone (single factor model). Interestingly, when considering the three combined landscape factors (more supported in AIC than the 2-factor model), soil pH was added to vegetation structure and land cover before that of terrain wetness, despite being initially neutral when alone. The final adjusted global model contained all four landscape factors, suggesting that the additional model complexity of including all four factors was important in predicting rare plant presence. Overall, the final (global) model had good model fit (pseudo-R2 of 0.228) and model accuracy (ROC = 0.841; Table 2).
When examining model coefficients (β), the ranking of land cover type coefficients was similar to those illustrated in Figure 3b as raw encounter rates. For example, graminoid poor fens had the highest adjusted predicted presence of rare plants, being 205-times (odds ratio, exp(β)) more likely to encounter rare plants in this land cover type than the reference category (most common land cover type) of deciduous forests (Table 3). Non-linear responses of plant rarity to soil pH and terrain wetness (CTI) were supported with peak occurrence of rare plants at moderate levels of both variables. Finally, for vegetation structure, canopy relief ratio (CRR) was positively related to rare plant occurrences, whereas vegetation height (95th centile) was negatively related to rare plant occurrences (Table 3). Parameters included in the model without LiDAR metrics were similar to those with LiDAR variables (Table 3), while still maintaining moderately good model fit (pseudo-R2 = 0.182) and similar overall model accuracy (ROC = 0.812).
Predictions of S1 and S2 ranked vascular plant habitat are illustrated as patchy patterns of habitat throughout the region at both local and meso-scales, reflecting the importance of different land cover types, vegetation structure, soils, and terrain wetness (Figure 4). Some of the larger blocks of unsuitable habitat in the center and north of the study area appear to be due to soil limitations (soil pH), whereas localized variation of low, moderate, and high rare plant habitat appears to be more related to stand type and history (vegetation structure), land cover, and terrain wetness. Variation in hotspots of rare plant habitat throughout the area illustrate differential conservation values and threats across the region. Some notable sites with higher probability rare plant habitat occurrence include the southern parts of the Birch Mountains, the area around Winfred Lake east of Conklin, and the Marguerite River Wildland along the Saskatchewan border east of Fort McKay (see Figure 1 for place names).

4. Discussion

Rare plant habitat in the Lower Athabasca region is best related to land cover type, soil pH, terrain, and vegetation structure metrics. When considering landscape predictors of rarity, we found that not only was the DU-EWC effective in predicting the occurrence of rare species, but so were LiDAR-derived vegetation structure metrics [23], particularly vegetation height (95th percentile) and canopy relief ratio (CRR). In fact, when considered individually, the LiDAR-derived vegetation metrics were similar to or better than land cover in predicting rare plant habitat. This suggests that remote-sensing based proxies of rare plant habitat may be used to not only predict current habitat, but also potentially used for monitoring change. The value of model-directed sampling for rare species was also clearly demonstrated in our study; we encountered “vulnerable” (S3) species at nearly 100% of plots and encountered rare species, here including “critically imperiled” (S1) and “imperiled” (S2) species at 3.6% and 5.3% of sites, respectively (see Appendix A, Table A1).
For the LiDAR metric CRR, higher values (i.e., more vertically complex vegetation with more emphasis of structure above mean height) correlated with increasing probability of rare plant occurrence. This may relate to forest age, where older stands may have more variation in their canopy height, or canopy patchiness may be reflective of variable stand history due to processes such as fire. Vegetation height had an inverse relationship with rare plant occurrence, where shorter canopies were more related to the occurrence of rare plants. This is logical given that fens were found to support more rare species occurrences, and these land-cover types have shorter canopy heights, with either stunted trees due to saturated growing conditions or shrubs and graminoids as the dominant vegetation layer. Rare plant occurrence was highest at intermediate values of both terrain wetness and pH. This is interesting given that some notable rare species in the region occur in ‘extreme’ habitats such as fens (e.g., Malaxis paludosa, Carex heleonastes, and Juncus stygius), where pH and wetness are high, or in jack pine forests (e.g., Spiranthes lacera and the Athabasca sand-plain endemic Lechea intermedia var. depauperata) where pH is high and wetness is very low, although many species included in modeling occurred at more mesic sites. Undoubtedly, models developed for individual species would demonstrate such idiosyncrasies in niche space.
Previous work that used remotely sensed data to predict rare plant habitat had similar predictive success to what was observed here, but more often focused on single species or very small groups [6,12], and very rarely on suites of rare species in a specific landcover type [6]. For example, de Queiroz et al. (2012) found that LANDSAT data in combination with LiDAR had stronger predictive ability for locating gyposphytes given the presence of gypsum mounds. Working also in Alberta, Nijland et al. (2015) combined a LiDARr-derived wetness index (DTW) and a Landsat-derived vegetation index to model site productivity [44]. In Brazil, da Silveira et al. (2018) combined Sentinel-2 and LiDAR metrics to better understand relationships between soils and vegetation [45]. In Florida, a LiDAR-derived digital terrain model was used in combination with other remote sensing products to map plant communities, with the management goal of monitoring change in a community strongly associated with an endangered plant species [46]. Our results further demonstrate the value of LiDAR, in combination with other variables representing important aspects of species niches, in both detecting new rare plant occurrences through field surveys and identifying important habitat associations. In addition, we note that rare plant species may respond at even more local scales than what was considered here (0.25 ha), as shown in previous examples that have linked rare plant occurrence to microtopographic features at scales <10 m [6,12]. Data obtained at an even finer resolution therefore could improve model predictions. However, at our scale of analysis, clear patterns between land cover types (e.g., fens, pine forests) and vegetation structure were observed and these relationships provide a basis for understanding regional patterns in rarity and conserving rare species.
Further to this, recent work has demonstrated that some rare plant species in our study area occur in species-poor sites like pine forests and poor fens, and thus approaches to conserving the most diverse communities will not satisfy the conservation of rare species and principles of complementary need to be considered [47]. Moreover, these habitats are scattered across the region, and mapping areas that are likely to contain rare plants shows a highly patchy distribution, particularly over areas that are leased to oil and gas companies for oil and natural gas extraction. This overlap is of concern given the known effects of oil and gas development on habitats, and in particular, the challenges associated with reclaiming peatlands [16,20], which were highlighted as important habitats for rare species in this study. This demonstrates the real-world applicability of regional mapping tools in species conservation and management; models employing spatial data such as LiDAR can guide management at regional to local scales and potentially aid in minimizing impacts to important rare plant habitats. Here, we show an overlap of areas where the probability of rare plant occurrence is high with oil and gas lease boundaries (i.e., areas where resource extraction and resulting land alternation are actively occurring). At the lease level, our rare plant model could be used to guide pre-development surveys, avoid areas of high rare plant habitat value, and plan for mitigation strategies.
Finally, in late 2015, as part of an effort to update the conservation status (ranks) of species in Canada, ACIMS published updated conservation status ranks for all species known to occur in the province based on observations and data collected since the time of their last assessment including data from this project. This resulted in a change in species status for some rare species in our study region. Given that our goal was to demonstrate the applicability and efficacy of employing remotely sensed variables in adaptive, model-based sampling, and that all field sampling and models were based on conservation status ranks published prior to 2015, we do not discuss how this change in status may change model predictions. However, this raises an important point that rarity status is in large part a product of our present understanding of species occurrence, distribution, and population trends, and thus are not static for any species over long-time frames, particularly for regions that lack significant sampling and thus knowledge gaps about rarity. Future applications of this method should consider the best available data of conservation status at the time of model building and sampling, as we have done here.

5. Conclusions

Although the majority of applications mapping rare plant habitat create landscape predictions for single species [3,4,6], we modeled the occurrence of any rare species (S1 & S1) within our study region, and demonstrated that environmental factors and LiDAR metrics can successfully predict the occurrence of a suite of species. Specifically, we found rare plant habitat to be associated with short and varied canopies, certain land cover types, especially fens, and areas with intermediate pH and terrain wetness. Although single species applications are valuable for modeling the realized niche of a species across space [3,12], multi-species approaches such as this allow for regional conservation planning and identification of landscape patterns in rarity by highlighting habitats that are most likely to house rare species [3]. We consider the application of an adaptive, model-based sampling method to be an efficient and effective approach to identifying rare elements and the availability and use of LiDAR products provide a unique opportunity to monitor rare plant habitat. Our success in detecting rare and vulnerable species using this approach may create a feedback loop wherein as more detections of rare species are made, we better understand niche associations, allowing for more accurate predictions, or conversely better understand that some species are less rare than originally perceived, particularly in poorly sampled landscapes. Therefore, use of this approach for sampling rare species and the use of its final products (landscape predictions of rarity) should be considered in regional environmental assessments and lease-level management, particularly since spatially explicit information on conservation values for plants is often lacking, especially when compared to wildlife.

Author Contributions

Conceptualization, S.E.N.; Methodology, S.E.N. and J.M.D.; Software, C.W.B.; Validation, S.E.N. and J.M.D.; Formal analysis: S.E.N.; Investigation, S.E.N. and J.M.D.; Resources, S.E.N., J.M.D., and C.W.B.; Data Curation, J.M.D. and C.W.B.; Writing—Original Draft Preparation, S.E.N. and J.M.D.; Writing—Review & Editing, C.W.B.; Visualization, S.E.N. and J.M.D.; Supervision, S.E.N.; Project Administration, S.E.N. and J.M.D.; Funding Acquisition, S.E.N. All authors have read and agreed to the published version of the manuscript.

Funding

This research received funding from the Ecological Monitoring Committee for the Lower Athabasca, Joint Oil Sands Monitoring, Alberta Environmental Monitoring, Evaluation, and Reporting Agency, The Environmental Monitoring and Science Division of Alberta Environment and Parks, and a joint grant from the Natural Sciences and Engineering Research Council (NSERC) and Canada’s Oil Sands Innovation Alliance (COSIA) as Grant #: CRDPJ 498955-16 (Nielsen).

Acknowledgments

Ducks Unlimited provided in-kind support by making available the Enhanced Wetland Classification of the Lower Athabasca layer.

Conflicts of Interest

The authors declare no conflicts of interest. Project funders had no role in the design of the study; in the collection, analyses, or interpretation of data; in the writing of the manuscript, and in the decision to publish the results.

Appendix A

Table A1. Rare (S1 and S2-ranked) vascular plant species encountered across 602 field plots (0.25 ha) in northeastern Alberta, Canada. Rare species were encountered at 54 sites. The number of plots where each species was detected is reported along with the species conservation status rank as of 2014.
SpeciesSub-National Conservation Status Rank (S-Rank)Number of Observations
Carex adustaS17
Carex hystericinaS11
Lechea intermedia var. depauperataS11
Malaxis paludosaS19
Spiranthes laceraS13
Utricularia cornutaS11
Botrychium simplexS21
Carex heleonastesS28
Carex lacustrisS22
Carex umbellataS22
Diphasiastrum sitchenseS25
Hypericum majusS21
Juncus brevicaudatusS25
Juncus stygiusS26
Lactuca biennisS22

References

  1. He, K.S.; Bradley, B.A.; Cord, A.F.; Rocchini, D.; Tuanmu, M.N.; Schmidtlein, S.; Turner, W.; Wegmann, M.; Pettorelli, N. Will Remote Sensing Shape the Next Generation of Species Distribution Models? Remote Sens. Ecol. Conserv. 2015, 1, 4–18. [Google Scholar] [CrossRef] [Green Version]
  2. Edwards, T.C.; Cutler, D.R.; Zimmermann, N.E.; Geiser, L.; Alegria, J. Model-Based Stratifications for Enhancing the Detection of Rare Ecological Events. Spec. Featur. Ecol. 2005, 86, 1081–1090. [Google Scholar] [CrossRef] [Green Version]
  3. Guisan, A.; Broennimann, O.; Engler, R.; Vust, M.; Yoccoz, N.G.; Lehmann, A.; Zimmermann, N.E. Using Niche-Based Models to Improve the Sampling of Rare Species. Conserv. Biol. 2006, 20, 501–511. [Google Scholar] [CrossRef] [PubMed]
  4. Bourg, N.A.; Mcshea, W.J.; Gill, D.E. Putting a Cart before the Search: Successful Habitat Prediction for a Rare Forest Herb. Ecology 2005, 86, 2793–2804. [Google Scholar] [CrossRef]
  5. Williams, J.N.; Seo, C.; Thorne, J.; Nelson, J.K.; Erwin, S.; O’Brien, J.M.; Schwartz, M.W. Using Species Distribution Models to Predict New Occurrences for Rare Plants. Divers. Distrib. 2009, 15, 565–576. [Google Scholar] [CrossRef]
  6. De Queiroz, T.F.; Baughman, C.; Baughman, O.; Gara, M.; Williams, N. Species Distribution Modeling for Conservation of Rare, Edaphic Endemic Plants in White River Valley, Nevada. Nat. Areas J. 2012, 32, 149. [Google Scholar] [CrossRef]
  7. Peterman, W.E.; Crawford, J.A.; Kuhns, A.R. Using Species Distribution and Occupancy Modeling to Guide Survey Efforts and Assess Species Status. J. Nat. Conserv. 2013, 21, 114–121. [Google Scholar] [CrossRef]
  8. Rabinowitz, D. Seven Forms of Rarity. In The Biological Aspects of Rare Plant Conservation; Synge, H., Ed.; John Wiley & Sons Ltd.: Somerset, NJ, USA, 1981; pp. 205–217. [Google Scholar]
  9. Wang, O.; Zachmann, L.J.; Sesnie, S.E.; Olsson, A.D.; Dickson, B.G. An Iterative and Ttargeted Sampling Design informed by Habitat Suitability Models for Detecting Focal Plant Species over Extensive Areas. PLoS ONE 2014, 9. [Google Scholar] [CrossRef]
  10. Lefsky, M.; Cohen, W.; Parker, G.; Harding, D. Lidar Remote Sensing for Ecosystem Studies. Bioscience 2002, 52, 19–30. [Google Scholar] [CrossRef]
  11. Beland, M.; Parker, G.; Sparrow, B.; Harding, D.; Chasmer, L.; Phinn, S.; Antonarakis, A.; Strahler, A. On Promoting the Use of Lidar Systems in Forest Ecosystem Research. For. Ecol. Manag. 2019, 450, 117484. [Google Scholar] [CrossRef]
  12. Sellars, J.D.; Jolls, C.L. Habitat Modeling for Amaranthus Pumilus: An Application of Light Detection and Ranging (LIDAR) Data. J. Coast. Res. 2007, 23, 1193–1202. [Google Scholar] [CrossRef]
  13. Questad, E.J.; Kellner, J.R.; Kinney, K.; Cordell, S.; Asner, G.P.; Thaxton, J.; Diep, J.; Uowolo, A.; Brooks, S.; Inman-Narahari, N.; et al. Mapping Habitat Suitability for At-Risk Plant Species and its Implications for Restoration and Reintroduction. Ecol. Appl. 2014, 24, 385–395. [Google Scholar] [CrossRef] [PubMed]
  14. West, A.M.; Evangelista, P.H.; Jarnevich, C.S.; Kumar, S.; Swallow, A.; Luizza, M.W.; Chignell, S.M. Using Multi-Date Satellite Imagery to Monitor Invasive Grass Species Distribution in Post-Wildfire Landscapes: An Iterative, Adaptable Approach that Employs Open-Source Data and Software. Int. J. Appl. Earth Obs. Geoinf. 2017, 59, 135–146. [Google Scholar] [CrossRef]
  15. Burgman, M.A.; Keith, D.; Hopper, S.D.; Widyatmoko, D.; Drill, C. Threat Syndromes and Conservation of the Australian Flora. Biol. Conserv. 2007, 134, 73–82. [Google Scholar] [CrossRef]
  16. Rooney, R.C.; Bayley, S.E.; Schindler, D.W. Oil Sands Mining and Reclamation Cause Massive Loss of Peatland and Stored Carbon. Proc. Natl. Acad. Sci. USA 2012, 109, 4933–4937. [Google Scholar] [CrossRef] [Green Version]
  17. Price, J.S.; McLaren, R.G.; Rudolph, D.L. Landscape Restoration After Oil Sands Mining: Conceptual Design and Hydrological Modelling for Fen Reconstruction. Int. J. Min. Reclam. Environ. 2010, 24, 109–123. [Google Scholar] [CrossRef]
  18. Renault, S.; Lait, C.; Zwiazek, J.; MacKinnon, M. Effect of High Salinity Tailings Waters Produced from Gypsum Treatment of Oil Sands Tailings on Plants of the Boreal Forest. Environ. Pollut. 1998, 102, 177–184. [Google Scholar] [CrossRef]
  19. Purdy, B.G.; Macdonald, S.E.; Lieffers, V.J. Naturally Saline Boreal Communities as Models for Reclamation of Saline Oil Sand Tailings. Restor. Ecol. 2005, 13, 667–677. [Google Scholar] [CrossRef]
  20. Dabros, A.; James Hammond, H.E.; Pinzon, J.; Pinno, B.; Langor, D. Edge Influence of Low-Impact Seismic Lines for Oil Exploration on Upland Forest Vegetation in Northern Alberta (Canada). For. Ecol. Manag. 2017, 400, 278–288. [Google Scholar] [CrossRef]
  21. Rooney, R.C.; Bayley, S.E. Setting reclamation targets and evaluating progress: Submersed Aquatic Vegetation in Natural and Post-Oil sands Mining Wetlands in Alberta, Canada. Ecol. Eng. 2011, 37, 569–579. [Google Scholar] [CrossRef]
  22. Guo, X.; Coops, N.C.; Tompalski, P.; Nielsen, S.E.; Bater, C.W.; Stadt, J.J. Regional Mapping of Vegetation Structure for Biodiversity Monitoring Using Airborne Lidar Data. Ecol. Inform. 2017, 38, 50–61. [Google Scholar] [CrossRef]
  23. Coops, N.C.; Tompaski, P.; Nijland, W.; Rickbeil, G.J.M.; Nielsen, S.E.; Bater, C.W.; Stadt, J.J. A Forest Structure Habitat Index Based on Airborne Laser Scanning Data. Ecol. Indic. 2016, 67, 346–357. [Google Scholar] [CrossRef]
  24. Ducks Unlimited Canada. Enhanced Wetland Classification Inferred Products User Guide Version 1.0; Ducks Unlimited Canada: Edmonton, AB, Canada, 2011. [Google Scholar]
  25. Master, L.L.; Faber-Langendoen, D.; Bittman, R.; Hammerson, G.A.; Heidel, B.; Ramsay, L.; Snow, K.; Teucher, A.; Tomaino, A. NatureServe Conservation Status Assessments: Factors for Evaluating Species and Ecosystem Risk; NatureServe: Arlington, VA, USA, 2012. [Google Scholar]
  26. Zhang, J.; Nielsen, S.E.; Grainger, T.N.; Kohler, M.; Chipchar, T.; Farr, D.R. Sampling Plant Diversity and Rarity at Landscape Scales: Importance of Sampling Time in Species Detectability. PLoS ONE 2014, 9, e95334. [Google Scholar] [CrossRef] [PubMed]
  27. Nielsen, S.E.; Dennett, J.; Denny, C.; Kohler, M.; Farr, D. Terrestrial Vascular Plant Monitoring Project for the Lower Athabasca (2012–2016); Applied Conservation Ecology Laboratory: Edmonton, AB, Canada, 2017. [Google Scholar]
  28. Alberta Biodiversity Monitoring Institute. ABMI 10-Year Science and Program Review v. 8.1; Alberta Biodiversity Monitoring Institute: Edmonton, AB, Canada, 2019. [Google Scholar]
  29. Hosmer, D.W.; Lemeshow, S. Applied Logistic Regression, 2nd ed.; John Wiley & Sons Ltd.: Hoboken, NJ, USA, 2000. [Google Scholar]
  30. StataCorp. Stata Statistical Software: Release 14; StataCorp: College Station, TX, USA, 2015. [Google Scholar]
  31. Akaike, H. A New Look at the Statistical Model Identification. IEEE Trans. Automat. Contr. 1974, 19, 716–723. [Google Scholar] [CrossRef]
  32. Natural Regions Committee. Natural Regions and Subregions of Alberta; Pub. No. T/852; Downing, D.J., Pettapiece, W.W., Eds.; Government of Alberta: Edmonton, AB, Canada, 2006; ISBN 0778545725.
  33. Natural Resources Canada. CanTopo Digital Elevation Model; Natural Resources Canada: Ottawa, ON, Canada, 2014. [Google Scholar]
  34. Moore, I.; Gessler, P.; Nielsen, G.; Petersen, G. Terrain Attributes: Estimation Methods and Scale Effects. In Modeling Change in Environmental Systems; Jakeman, A., Beck, M., McAleer, M., Eds.; Wiley: London, UK, 1993; pp. 189–214. [Google Scholar]
  35. Gessler, P.; Moore, I.; McKenzie, N.; Ryan, P. Soil-Landscape Modelling and Spatial Prediction of Soil Attributes. Int. J. Geogr. Inf. Syst. 1995, 9, 421–432. [Google Scholar] [CrossRef]
  36. White, B.; Ogilvie, J.; Campbell, D.M.H.; Hiltz, D.; Gautheir, B.; Chisholm, H.K.H.; Wen, H.K.; Murphy, P.N.C.; Arp, P.A. Using the Cartographic Depth-to-Water Index to Locate Small Streams and Associated Wet Areas across Landscapes. Can. Water Resour. J. 2012, 37, 333–347. [Google Scholar] [CrossRef]
  37. Soil Landscapes of Canada Working Group. Available online: https://open.canada.ca/data/en/dataset/5ad5e20c-f2bb-497d-a2a2-440eec6e10cd (accessed on 1 January 2014).
  38. McGaughey, R. FUSION/LVD: Software for LIDAR Data Analysis and Visualization; US Forest Service: Washington, DC, USA, 2016.
  39. Parker, G.G.; Russ, M.E. The Canopy Surface and Stand Development: Assessing Forest Canopy Structure and Complexity with Near-Surface Altimetry. For. Ecol. Manage. 2004, 189, 307–315. [Google Scholar] [CrossRef]
  40. Mura, M.; McRoberts, R.E.; Chirici, G.; Marchetti, M. Estimating and Mapping Forest Structural Diversity Using Airborne Laser Scanning Data. Remote Sens. Environ. 2015, 170, 133–142. [Google Scholar] [CrossRef]
  41. Møller, A.; Jennions, M. How Much Variance can be explained by Ecologists and Evolutionary Biologists? Oecologia 2002, 132, 492–500. [Google Scholar] [CrossRef]
  42. Swets, J. Measuring the Accuracy of Diagnostic Systems. Science 1988, 240, 1285–1293. [Google Scholar] [CrossRef] [Green Version]
  43. Manel, S.; Williams, H.; Ormerod, S. Evaluating Presence-Absence Models in Diversity on the Roof of the World: Spatial Patterns and Environmental Determinants. J. Appl. Ecol. 2001, 38, 921–931. [Google Scholar] [CrossRef]
  44. Nijland, W.; Coops, N.C.; Macdonald, S.E.; Nielsen, S.E.; Bater, C.W.; White, B.; Ogilvie, J.; Stadt, J.J. Remote Sensing Proxies of Productivity and Moisture Predict Forest Stand Type and Recovery Rate Following Experimental Harvest. For. Ecol. Manage. 2015, 357, 239–247. [Google Scholar] [CrossRef]
  45. Da Silveira, H.L.F.; Galvão, L.S.; Sanches, I.D.; de Sá, I.B.; Taura, T.A. Use of MSI/Sentinel-2 and Airborne Lidar Data for Mapping Vegetation and Studying the Relationhips with Soil Attributes in the Brazilian Semi-Arid Region. Int. J. Appl. Earth Obs. Geoinf. 2018, 73, 179–190. [Google Scholar] [CrossRef]
  46. Wendelberger, K.S.; Maschinski, J. Assessing Microsite and Regeneration Niche Preferences through Experimental Reintroduction of the Rare Plant Tephrosia Angustissima Var. Corallicola. Plant Ecol. 2016, 217, 155–167. [Google Scholar] [CrossRef]
  47. Crisfield, V.E.; Dennett, J.M.; Denny, C.K.; Mao, L.; Nielsen, S.E. Species Richness is a Surrogate for Rare Plant Occurrence, but not Conservation Value, in Boreal Plant Communities. Biodivers. Conserv. 2020, 29, 99–114. [Google Scholar] [CrossRef]
Figure 1. Location of Alberta in western Canada and the study area within North America (a); and terrain, elevation, major water features, and place names (towns) for the Lower Athabasca region (south of Lake Athabasca) (b).
Forests 11 00699 g001
Figure 2. Example landscape variables used to predict locations of rare vascular plants (S1 or S2): (a) land cover (deciduous forest example; Ducks Unlimited Enhanced Wetland Classification (DU-EWC)); (b) terrain wetness from 50 m digital elevation model (DEM); (c) soil pH; and, (d) airborne light detection and ranging (LiDAR)-derived canopy height (95th percentile; note that gray areas of hillshade represent locations without LiDAR data).
Forests 11 00699 g002
Figure 3. (a) Distribution of field plots (n = 602) relative to the region terrain and the location (presence) of detected rare (S1 and/or S2 ranked) vascular plants (shown as yellow locations) within 0.25 ha plots in the Lower Athabasca region of Alberta, Canada; (b) encounter rate of rare (S1 and/or S2 ranked) vascular plants by dominant land cover type based on the classification from the DU-EWC.
Forests 11 00699 g003
Figure 4. Predicted distribution of rare vascular plant (S1 or S2 conservation rank) habitat within the Lower Athabasca of northeast Alberta, Canada. Prediction classes are based on model sensitivity (true positive rate), specificity (true negative rate), and optimal threshold classification probability where sensitivity and specificity are equalized. Both ‘unlikely’ and ‘low’ classes had model probabilities lower than the optimal threshold; the ‘unlikely’ class had a model specificity ≥0.9, while the ‘low’ class had model specificity <0.9. In contrast, the ‘moderate’ and ‘high’ classes both had model probabilities higher than the optimal threshold probability, with the ‘moderate’ class having sensitivity <0.9 and the ‘high’ class having a model sensitivity >0.9 indicating higher confidence in a rare plant being present. Oil and gas lease boundaries, which represent areas wherein rights have been granted to companies by the crown for exploration and resource development, current to 2015, are shown.
Forests 11 00699 g004
Table 1. Ducks Unlimited Enhanced Wetland Classification (DU-EWC) land cover types considered in models of rare plant habitat (occurrence) in the Lower Athabasca region of northeast Alberta, Canada (source: Ducks Unlimited). Note that some classes were combined in the analysis given their similarity and lower sample sizes. Number of plots (n) and percent coverage within study area by land cover class is provided.
Class Namen (% of Area)Type of CommunitySoil MoistureHydro-DynamicsNutrient Regime
Emergent Marsh8 (0.6%)Mineral WetlandVery HydricVery DynamicVery Rich
Meadow Marsh1 (0.5%)Mineral WetlandHydricVery DynamicVery Rich
Graminoid Rich Fen28 (0.5%)Peat WetlandHydricMovingRich
Graminoid Poor Fen13 (0.9%)Peat WetlandHydricSlow MovingPoor
Shrubby Rich Fen39 (3.8%)Peat WetlandSub HydricMovingRich
Shrubby Poor Fen28 (0.8%)Peat WetlandSub HydricSlow MovingPoor
Treed Rich Fen44 (7.7%)Peat WetlandSub HydricMovingRich
Treed Poor Fen58 (9.1%)Peat WetlandHygricSlow MovingPoor
Open Bog1 (0.02%)Peat WetlandSub HygricStagnantVery Poor
Shrubby Bog7 (0.7%)Peat WetlandSub HygricStagnantVery Poor
Treed Bog25 (6.2%)Peat WetlandSub HygricStagnantVery Poor
Shrub Swamp18 (2.5%)Mineral WetlandHydricDynamicRich
Hardwood Swamp3 (0.9%)Mineral WetlandHygricDynamicRich
Mixedwood Swamp3 (0.7%)Mineral WetlandHygricDynamicRich
Tamarack Swamp5 (0.6%)Mineral WetlandHygricSlow MovingMedium
Conifer Swamp30 (5.0%)Mineral WetlandSub HygricStagnantMedium
Upland Conifer54 (8.7%)UplandMesic to XericUplandUpland
Upland Deciduous109 (18.4%)UplandMesic to XericUplandUpland
Upland Mixedwood3 (0.4%)UplandMesic to XericUplandUpland
Upland Pine113 (13.0%)UplandXericUplandUpland
Burn4 (5.6%)OtherOtherOtherOther
Table 2. Comparison of candidate models describing the presence of rare plants (S1 or S2 rank) within 0.25 ha plots (n = 469) in the Lower Athabasca region based on soils (S), terrain (T), land cover (L), and vertical vegetation structure (V). AIC values in bold font represent the most-supported model (lower AIC) within single, two, three, and four-factor sets. Model complexity is represented by number of parameters (K). ROC represents predictive accuracy based on Receiver Operating Characteristic, while model fit (R2) was measured by percent deviance explained.
ModelAICKROCR2
Single factor models:
S-Soils270.4830.6000.016
T-Terrain wetness266.7930.5940.029
L-Land cover254.54110.7690.134
V-Vegetation structure250.6040.7650.097
Null (constant)270.6510.5000.000
Two-factor models:
S + T267.5550.6380.041
S + L251.07130.8040.162
S + V249.660.7780.116
T + L252.33130.7880.158
T + V248.6360.7770.119
L + V247.09140.8290.185
Three-factor models:
S + T + L249.89150.8120.182
S + T + V248.6980.7920.134
S + L + V243.70160.8370.212
T + L + V244.56160.8380.209
Four-factor model:
Global (S + T + L + V)241.45170.8410.228
Table 3. Logistic regression coefficients (β), standard errors (SE), and significance (P) of the most-supported (AIC) model (with and without LiDAR data) describing the probability of a S1 or S2 vascular plant being present within 0.25 ha plots in the Lower Athabasca region of Alberta, Canada. Land cover variables are in comparison to the reference category of deciduous forest.
w/LiDAR Variables (n = 469)w/o LiDAR Variables (n = 602)
VariableβSEpβSEp
S-Soil pH5.7062.7880.0416.1832.6860.021
S-Soil pH2−0.5810.2980.051−0.6410.2870.026
T-CTI (wetness)41.5321.530.05439.0020.640.059
T-CTI2 (wetness)−8.6794.490.053−8.1944.310.057
L-Treed bog3.1611.4530.032.5561.3810.064
L-Graminoid poor fen5.3241.458<0.0015.6161.353<0.001
L-Shrub poor fen3.8511.3690.0054.1681.2550.001
L-Treed poor fen3.9281.2120.0013.941.1420.001
L-Graminoid rich fen3.3571.5510.033.8271.5280.012
L-Shrub rich fen2.4261.4010.0832.6811.3290.044
L-Treed rich fen4.2631.197<0.0014.0981.126<0.001
L-Conifer swamp3.1741.4740.0313.0311.4660.039
L-Upland burn4.8931.7080.0044.5441.6780.007
L-Upland pine2.5201.0050.0122.8081.0240.006
V-Canopy relief ratio (CRR)5.8721.7990.001
V-Canopy height (p95)−0.1160.0530.028
Constant (intercept)−69.2926.190.008−65.77250.009

