Article

Implications of Reduced Stand Density on Tree Growth and Drought Susceptibility: A Study of Three Species under Varying Climate

1
Chair of Forest Growth and Yield Science, TUM School of Life Sciences Weihenstephan, Technical University of Munich, Hans-Carl-v.-Carlowitz-Platz 2, 85354 Freising, Germany
2
Forests and Woodland Ecosystems Science Program, Rocky Mountain Research Station, Forest Service, United States Department of Agriculture, Fort Valley Experimental Forest, 2500 S. Pine Knoll Drive, Flagstaff, AZ 86001, USA
3
Department of Forest Dynamics and Management, Forest Research Center, INIA, Ctra. A Coruña Km 7.5, 28040 Madrid, Spain
4
Sustainable Forest Research Institute, University of Valladolid and INIA, Avda. Madrid 44, 34004 Palencia, Spain
*
Author to whom correspondence should be addressed.
Forests 2020, 11(6), 627; https://doi.org/10.3390/f11060627
Submission received: 4 May 2020 / Revised: 25 May 2020 / Accepted: 28 May 2020 / Published: 2 June 2020
(This article belongs to the Section Forest Ecology and Management)

Abstract

:
A higher frequency of increasingly severe droughts highlights the need for short-term measures to adapt existing forests to climate change. The maintenance of reduced stand densities has been proposed as a promising silvicultural tool for mitigating drought stress. However, the relationship between stand density and tree drought susceptibility remains poorly understood, especially across ecological gradients. Here, we analysed the effect of reduced stand density on tree growth and growth sensitivity, as well as on short-term drought responses (resistance, recovery, and resilience) of Scots pine (Pinus sylvestris L.), sessile oak (Quercus petraea (Matt.) Liebl.), and ponderosa pine (Pinus ponderosa Douglas ex C. Lawson). Tree ring series from 409 trees, growing in stands of varying stand density, were analysed at sites with different water availability. For all species, mean tree growth was significantly higher under low compared with maximum stand density. Mean tree growth sensitivity of Scots pine was significantly higher under low compared with moderate and maximum stand density, while growth sensitivity of ponderosa pine peaked under maximum stand density. Recovery and resilience of Scots pine, as well as recovery of sessile oak and ponderosa pine, decreased with increasing stand density. In contrast, resistance and resilience of ponderosa pine significantly increased with increasing stand density. Higher site water availability was associated with significantly reduced drought response indices of Scots pine and sessile oak in general, except for resistance of oak. In ponderosa pine, higher site water availability significantly lessened recovery. Higher site water availability significantly moderated the positive effect of reduced stand density on drought responses. Stand age had a significantly positive effect on the resistance of Scots pine and a negative effect on recovery of sessile oak. We discuss potential causes for the observed response patterns, derive implications for adaptive forest management, and make recommendations for further research in this field.

1. Introduction

Climatic extremes, such as severe droughts, are expected to become more frequent and increase in intensity as a result of climate change [1]. Drought occurs under low levels of available water, relative to a site’s mean condition, being caused by reduced precipitation and/or increased atmospheric evaporative demand combined with low available soil water [2,3]. Forest ecosystems have, in the recent past, proven to be particularly vulnerable to such drastic changes in growing conditions due to their slow natural adaptation rates, ultimately resulting in widespread tree mortality and decreased tree and forest growth [4,5]. Silvicultural strategies, such as growing more drought-resistant tree species and converting monocultures into mixed, uneven aged forests, are seen as promising long-term options for adaptation, to cope with the increasing threat of climate change to forest ecosystem health and functioning [6,7,8]. However, there is still uncertainty regarding which short-term measures are feasible to mitigate the adverse effects of drought stress in existing stands, still far from rotation age, and to aid the transitioning into more stable forest compositions. Stand density, as a measure of tree abundance in a given area, is a primary driver of competition, with significant implications on tree growth and mortality [9]. Increasing evidence suggests that the reduction of stand density, in addition to accelerating tree growth [10] and increasing the growth responsiveness to environmental conditions [11], can be a mechanism for moderating the effects of drought-induced stress by increasing the vigour of individual trees due to increased average resource availability [12,13,14,15,16,17]. Reduced stand transpiration due to lower leaf area [18], as well as the formation of more extensive root systems [19], have been reported as contributing factors that may increase tree water availability under reduced competition. However, several studies have also shown detrimental effects of managing lower stand densities, reporting decreased water availability resulting from increased transpiration and evaporative losses that are caused by higher wind speeds and deeper penetration of solar radiation in recently thinned stands [20,21,22], as well as increased competition for soil moisture [23]. The inconsistency of the current body of knowledge is likely related to several confounding factors that complicate the derivation of generalized reaction patterns. For example, species have been found to react differently to drought under different levels of competition, as a result of varying adaptation strategies between coniferous and broadleaved species [24]. Furthermore, the benefits of reduced competition on drought tolerance have also been found to decrease with stand age due to higher water demands of larger trees in open compared with denser stands [25]. Finally, the effect of stand density on tree drought responses might be modified by climatic factors, such as long-term site aridity [24]. Despite a growing scientific interest in recent years, the relationship between stand density and tree drought susceptibility remains poorly quantified, especially across climatic growing conditions. In addition, under most site conditions, stand density reductions in favour of resource supply and growth of remaining trees, may ultimately cause a loss of stand productivity [26]. Thus, it appears important to know and quantify whether and how much density reductions really mitigate any growth losses that are caused by drought.
To improve the state of knowledge, this study focuses on tree growth and tree drought reactions of Scots pine (Pinus sylvestris L.), sessile oak (Quercus petraea (Matt.) Liebl.), and ponderosa pine (Pinus ponderosa Douglas ex C. Lawson) under different stand density levels and climatic growing conditions. Scots pine and sessile oak constitute two fundamental European tree species that are economically important [27,28] and have proven to exhibit a relatively high drought tolerance as compared with other European tree species, such as European beech (Fagus sylvatica L.) and Norway spruce (Picea abies (L.) H. Karst.) [29,30,31]. Scots pine is protected against drought due to embedded stomata and a waxy layer on the epidermis [32], as well as a pronounced stomatal control that helps to regulate transpiration in early stages of drought [33]. However, Scots pine has more recently been found to suffer growth depression and decline in some parts of its natural distribution due to increasing drought stress [34,35,36,37,38]. Furthermore, Scots pine is widely represented on dry, poor, and formerly degraded sites, where it in the past was introduced for afforestation purposes [39]. On these marginal sites, the adverse effects of drought may be particularly pronounced [40]. Sessile oak is often equipped with deep-reaching tap roots that improve the accessibility of water under drought [41] and found to exhibit considerable resistance and resilience to episodic drought stress in mixtures and monocultures [42,43]. In contrast to the drought avoiding isohydric Scots pine, the anisohydric oak is found to keep its stomata open for longer during drought [33], resulting in differing drought reaction patterns of both species [43,44]. Previous studies have revealed positive effects of mixing both species in terms of productivity and growth responses to episodic drought stress over broad ecological gradients [43,45,46]. In Europe, both species endure acute drought stress under episodic water shortage. However, current climate projections indicate that many parts of Europe, in particular southern and western Europe, will have a chronically lower water supply (higher temperature, lower or constant precipitation) by the end of the 21st century [47]. Therefore, forest managers now face the overwhelming task of adapting existing forests, which are still far from rotation age, to unprecedented climatic growing conditions. Thus, it becomes increasingly important to study indigenous tree species growing at the fringes or beyond their natural distribution (e.g., [48]), as well as comparing them with similar tree species, growing under conditions that may resemble future climate scenarios. Against this background, we analogously study ponderosa pine (Pinus ponderosa Douglas ex C. Lawson) in Arizona, USA, which, in this region, typically incurs more chronic drought stress conditions and less constant precipitation than Scots pine and sessile oak in Europe. Ponderosa pine is one of the most important timber species in the western United States and also used for a wide range of other applications, including erosion control and ethnobotanic use [49]. Ponderosa pine is able to survive hot and dry conditions, exhibiting a high drought tolerance that is, in part, resulting from deep reaching tap roots that are developed in early stages of tree ontogenesis [50]. Within the southern part of its distribution range, which encompasses the studied sites, it grows at higher elevations up to 3000 m. Regional evidence suggests beneficial effects of reduced stand density on drought responses of Scots pine [39,51,52], sessile oak [53], and ponderosa pine [9,16,54,55], although drought has also been reported to have more negative impacts on radial growth of larger ponderosa pines growing under low stand densities [56].
The objective of this study was to analyse the effect of reduced stand density on the species-specific mean tree growth and mean tree growth sensitivity, as well as on short-term tree growth responses (resistance, recovery, and resilience) to episodic drought stress on sites with different water availability for two of the most important commercial European tree species. We included data from chronically water stressed sites in the U.S. Southwest, analysing the growth behaviour of ponderosa pine, in order to better understand how stand density interacts with tree growth and tree growth responses to episodic drought stress.
To address the research objective, we tested the following hypotheses for each species:
Hypothesis 1 (H1): 
Mean tree growth and mean tree growth sensitivity increase under reduced stand density.
Hypothesis 2 (H2): 
Reduced stand density improves tree drought responses.
Hypothesis 3 (H3): 
The benefit of reduced stand density on tree drought responses is moderated by site water availability.

2. Material and Methods

2.1. Study Sites and Sampling Design

This study is based on individual tree sampling, carried out in monospecific, even-aged, and more or less mono-layered stands of Scots pine and sessile oak in southern Germany (Bavaria) and ponderosa pine stands in the U.S. Southwest (Arizona) (Figure 1). In order to study the influence of stand density on tree growth, trees on each site were sampled from one untreated control stand, exhibiting the site-specific maximum stand density, as well as from two adjacent stands, growing under same site conditions, but providing moderate and low stand densities, respectively. Study sites reflect different levels of site water availability, as represented by the Global Aridity Index ( I A ) (cf. 2.4). In Bavaria, the trees were sampled within the framework of existing long-term thinning and spacing trials, maintained by the Chair of Forest Growth and Yield Science, Technical University of Munich. In Arizona, trees were sampled in stands located within the research areas of Fort Valley and Long Valley Experimental Forests, managed by the United States Forest Service. In the sampled stands, the density levels have mostly been maintained for many decades by thinning intervention at certain intervals (Table A1 provides information on the treatment history). Table 1 gives an overview of the site and stand characteristics for all nine study sites. The Bavarian sites are located at elevations of between 380 and 495 m a.s.l. (mean = 433 m a.s.l.), while sites in Arizona are found at elevations of 2079 to 2280 m a.s.l. (mean = 2203 m a.s.l.). The stand age varied from 47 to 68 years (mean = 60 years) in Scots pine, from 34 to 153 years (mean = 93 years) in sessile oak, and from 100 to 105 years (mean = 102 years) in ponderosa pine. The age ranges sampled can be considered to be typical for the species-specific rotation periods in the respective study regions.

2.2. Data Collection and Preparation

All fieldwork was carried out at the end of the growing season of 2017, using a standardized protocol, described in the following. At least 15 dominant to co-dominant living trees were selected randomly in stands representing three different levels of stand density (low, moderate and maximum; ≥3 × 15 = 45 trees per site). Stand basal area ( B A , m2 ha−1) was measured via angle count sampling [57] at each tree, by use of a level relascope (Spiegel-Relaskop, Relaskop-Technik, Vetriebsges. m.b.H., Salzburg, Austria) in order to confirm stand density levels of selected trees in the field and to gather information on local competition. For each tree, the diameter at breast height ( d b h , cm) and height ( h , m) were measured (see Table A2 for information on mean tree dimensions). In addition, two increment cores were taken from north and east cardinal directions at breast height, using a 5.15 mm diameter increment borer (Haglöf Sweden AB, Långsele, Sweden). The annual ring widths were measured with an accuracy of 0.01 mm from each increment core, using a Type II digital positioning table after Johann [58] (Biritz and Hatzl GmbH, Vienna, Austria). Cross-dating of the raw ring width series was visually performed for each plot, guided by narrow ring widths in species-specific pointer years [59].

2.3. Dendrochronological Evaluation

The assessment of mean tree growth, mean tree growth sensitivity, and tree growth responses to episodic drought stress was based on the tree basal area increment ( b a i , cm2 yr−1), which was calculated from the mean annual ring width of both increment cores as b a i n = ( d n 2 d n 1 2 ) π 4 , where d n is the tree’s d b h for year n . The two-dimensional b a i is preferably used, as it better reflects the growth of the whole tree rather than the one-dimensional stem diameter or stem radius increment [60].
A double detrending procedure [61] was applied in order to standardize the b a i series. In a first step, we applied a Hugershoff function [62], which was found to better reflect the nature of the observed b a i age trend, as compared with a negative exponential function or linear regression, traditionally used for detrending purposes. In a second step, we applied a smoothing cubic spline with a frequency cutoff of 50% at 2/3 of the curve length [63]. This resulted in a dimensionless series of basal area indices for each series, being calculated as the ratio between the actual measured increment and the fitted values. The applied detrending procedure allowed for us to remove long-term trends due to age, size, and stand dynamics [64]. The resulting index series contained only year-to-year variability associated with fluctuations in climate [64,65]. We calculated the mean inter-series correlation ( R b a r ) and the mean expressed population signal ( E P S ) for each site-specific stand density level to assess the signal strength of the corresponding chronologies [66].
We employed the package d p l R [67] from the statistical environment R , version 3.6.1 for descriptive statistics of b a i series and all detrending procedures [68].

2.4. Meteorological Data and Selection of Drought Events

Meteorological data (monthly mean temperature and monthly precipitation total) were obtained from gridded datasets provided by the German Meteorological Service (Deutscher Wetterdienst, DWD) [69,70] for the study sites in Bavaria and by PRISM (Parameter elevation Regression on Independent Slopes Model) [71] for the study sites in Arizona. We calculated the mean annual meteorological variables (mean annual temperature ( T , °C) and mean annual precipitation total ( P , mm)) over a period of 40 years (1978–2017) (Table 1), based on the acquired monthly data, in order to characterize the general climatic site conditions. The mean annual temperature ranged from 8.3 to 8.9 °C (mean = 8.5 °C) on study sites of Scots pine, from 8.1 to 8.3 °C (mean = 8.2 °C) in the case of sessile oak and from 7.1 to 9.0 °C (mean = 7.7 °C) in the case of ponderosa pine. The mean annual precipitation total ranged from 714 to 756 mm (mean = 731 mm) on study sites of Scots pine and from 767 to 1021 mm (mean = 923 mm) for sessile oak, while on study sites of ponderosa pine it ranged from 575 to 728 mm (mean = 638 mm). We used the Global Aridity Index ( I A ) by the United Nations Environmental Programme (UNEP) [72] as a measure of meteorological site water availability, which determines the relation of moisture supply versus moisture demand (Equation (1)).
I A = P / P E T
I A is calculated as the ratio between P and the mean annual potential evapotranspiration (PET, mm). P E T was computed from monthly meteorological data, using the Thornthwaite equation [73]. Higher I A values indicate a better site water availability and improved growing conditions. For sampled sites of Scots pine, the I A values ranged from 1.16 to 1.20 (mean = 1.18), while for sites of sessile oak and ponderosa pine the corresponding values ranged from 1.26 to 1.70 (mean = 1.53) and from 1.07 to 1.24 (mean = 1.16), respectively (Table 1).
Figure S1 (Supplementary Material) provides information on the average climatic growing conditions throughout the calendar year (climate diagrams according to Walter and Lieth [74] based on the reference period 1978–2017). In Bavaria, precipitation and temperature patterns showed a significant peak in July; however, throughout a typical year, there was a more or less constant relationship between temperature and precipitation without any water deficit. In contrast, the study sites in Arizona exhibited a bimodal precipitation pattern that peaked in winter (December–March) and the summer monsoonal season (July–August); a considerable water deficit was common prior to the start of the monsoonal season. According to Kerhoulas et al. [75], winter precipitation can be considered to be the dominant water source for ponderosa pine trees growing in the studied region.
Tree growth responses to episodic drought were investigated by considering a series of well-reported drought events that occurred in 1976, 2003, and 2015 across Europe [42,76,77,78,79] and in 1989, 2002, and 2009 across the U.S. Southwest [9,16,80,81]. In these years, the mean monthly Standardized Precipitation Evapotranspiration Index ( S P E I ) [82], as experienced during the growing season (all months with a mean temperature of ≥10.0 °C [83]), ranged from −1.0 to −2.2 (Table A1), indicating a range of moderate to extreme drought intensities according to the classification by Potop et al. [84].

2.5. Quantification of Tree Population Density

We calculated the weighted mean relative stand basal area ( M R B A ) (Equation (2)) as a continuous measure of tree population density and inter-individual competition.
M R B A = M B A o b s / M B A m a x
Here, M B A o b s and M B A m a x represent Assmann’s periodical mean basal area level [85] in m2 ha−1 for the observed stand and the corresponding untreated control stand, respectively. M B A was determined as the mean of the stand basal area between the beginning ( B A b ) and the end ( B A e ) of the 1⋯ n survey periods, weighted by the length of the survey period ( m ) (Equation (3)).
M B A = B A 1 b + B A 1 e 2 m 1 + + B A n b + B A n e 2 m n m 1 + + m n
This concept of quantifying mean relative stand density has proven useful for analysing density-growth relationships over longer time periods [26]. For example, M R B A = 0.7 indicates that the stand under scrutiny was, on average, kept at a level of 70% of the local maximum during the entire survey time. Information on historic stand density development was sourced from long-term records of existing experiments (DE 1, DE 2, DE 3, DE 4, DE 6, DE 7), based on reoccurring complete inventories of research plots that are associated with the trees sampled, according to the DESER-Norm 1993 by Johann [86]. In other cases, this information was not available for the trees sampled (DE 5, US 1–US 3). Here, the relative stand basal area was derived from the angle count samples taken during the field survey. Table A2 provides information on the M R B A values for each stand. In the case of Scots pine, M R B A ranged from 0.6 to 0.7 (mean = 0.6) and from 0.3 to 0.5 (mean = 0.4) in stands with moderate and low stand density, respectively. Sessile oak stands exhibited M R B A values of between 0.7 and 0.9 (mean = 0.7) and 0.4 to 0.8 (mean = 0.6) in stands with moderate and low stand density, respectively. Moderate stand density in ponderosa pine was characterized by M R B A values of between 0.5 and 0.6 (mean = 0.6), while corresponding values under low stand density levels amounted to 0.3 on average.

2.6. Assessment of Mean Tree Growth, Mean Tree Growth Sensitivity and Short-Term Growth Responses to Episodic Drought Stress

We used two dendrochronological standard characteristics to quantify the average species-specific tree growth behaviour under different levels of stand density. Firstly, the mean raw b a i ( M e a n , cm2 yr−1), which provides a measure of the general tree growth level or potential [87], and secondly, the mean coefficient of variation ( C V , %) of the standardized b a i index series, which provides information on the high-frequency year-on-year variability that is caused by environmental growing conditions [64,67]. M e a n and C V were both calculated based on a 30-year time frame (1988–2017). Short-term tree growth responses to selected drought events were individually assessed for each species by use of drought response indices as proposed by Lloret et al. [88], which were calculated from the standardized b a i index series. Resistance R t (Equation (4)) is calculated as the ratio between tree growth during the drought event ( G D r ) and the mean growth during the pre-drought period ( G P r e D r ). Recovery R c (Equation (5)) is calculated as the ratio between the mean growth during the post-drought period ( G P o s t D r ) and the growth during the drought event ( G D r ). Resilience R s (Equation (6)) is defined as the ratio between the average growth after ( G P o s t D r ) and before ( G P r e D r ) the drought event. Resistance highlights the tree’s ability to maintain growth levels during drought, while recovery can be seen as the ability to restore a level of growth after drought. Resilience exhibits the tree’s capacity to recover to pre-drought growth levels.
R t = G D r G P r e D r
R c = G P o s t D r G D r
R s = G P o s t D r G P r e D r
G P r e D r and G P o s t D r were calculated as the average growth during the two years before, or after, respectively, the selected drought events. This time frame was used, as it represented the best trade-off between a sufficiently long time, in order to ensure a good estimation of the mean growth before and after the drought event, and the opportunity to study the year 2015, which constitutes a severe drought event in recent European history, characterized by SPEI values that range from −1.5 to −1.8 on the studied sites (Table A1). We considered every drought event as a single stress event for each site. Drought events that coincided with thinning interventions in the same year were not considered in the analysis. In cases where local angle count samples were used to determine relative stand density, the time frame was limited to a maximum of 30 years (1988–2017) and to periods without any recent thinning intervention, in order to ensure low variations in stand structure and inter-individual competition. The final number of site-specific drought events ranged from one to three, as outlined in Table A1.

2.7. Statistical Testing

In this study, we applied linear mixed-effects models to account for nesting in the data, thereby accounting for pseudo-replication, potentially resulting in too progressive significances [89]. A separate model was fitted for each species and response variable ( M e a n , C V , R t , R c , and R s ). All of the fitted models were visually checked for homoscedasticity and normal distribution of the residuals. We compared least-squares means of stands with different stand densities (low, moderate, maximum), as specified by the sampling design, to test the overall effect of stand density on mean tree growth and mean tree growth sensitivity (H1). In a next step, we used the weighted mean relative stand basal area ( M R B A ) as a continuous predictor of short-term tree growth responses to episodic drought stress (H2, H3). Statistical analyses were conducted by use of the R -function l m e from the package n l m e [90].
In the following, we present model equations used to test H 1 H 3 .
H1: 
Mean tree growth and mean tree growth sensitivity increase under reduced stand density.
Equation (7) was used to test the influence of different stand density levels, represented by the categorical variable S D (low stand density: S D l o w ; moderate stand density: S D m o d ; maximum stand density: S D m a x ), as specified by the sampling design, on the species-specific mean tree growth ( M e a n ) and mean tree growth sensitivity, represented by the mean coefficient of variation of the standardized b a i index series ( C V ). The covariate tree size was included in form of the tree basal area ( b a ) at the time of sampling.
Y i j k = a 0 + a 1 b a i j k + a 2 S D m o d i j + a 3 S D m a x i j + b i + ε i j k
In Equation (7), Y i j k is the species-specific response variable, i.e., M e a n or C V . The indices represent site ( i ), stand ( j ) and tree ( k ), respectively. Terms a 0 , a 1 , a 2 , and a 3 represent the coefficients of fixed effects. The term b i represents the random effect on the level of site ( b i ~ N ( 0 , τ 1 2 ) ). Finally, ε i j k is an independent and identically distributed error ( ε i j k ~ N ( 0 , σ 2 )). Tukey HSD multiple comparison ( R -package l s m e a n s [91]) was performed for contrasting all levels within S D , as obtained from the linear mixed model, against each other.
H2: 
Reduced stand density improves tree drought responses.
H3: 
The benefit of reduced stand density on tree drought responses is moderated by site water availability.
Equation (8) constitutes the full model to test the influence of the weighted mean relative basal area ( M R B A ) on the species-specific short-term tree growth responses to episodic drought stress and to analyse how this influence might be modified by site water availability, represented by the Global Aridity Index ( I A ), and stand age ( A g e ). In addition, we included the covariate tree size ( b a ) at the time of the drought event.
Y i j k l = a 0 + a 1 b a i j k l + a 2 M R B A i j + a 3 I A i + a 4 A g e i j + a 5 M R B A i j I A i + a 6   M R B A i j A g e i j + b i j k + ε i j k l  
In Equation (8), Y i j k l represents the species-specific tree growth response to drought in form of the drought response indices resistance ( R t ), recovery ( R c ), or resilience ( R s ) on the level of site ( i ), stand ( j ), tree ( k ), and drought event ( l ). Terms a 0 a 6 represent the coefficients of fixed effects. The term b i j k denotes the random effect on the level of tree ( b i j k ~ N ( 0 , τ 1 2 ) ). Finally, ε i j k l is an independent and identically distributed error ( ε i j k l ~ N ( 0 , σ 2 )). The selection of potentially less complex final models nested in Equation (8) was based on the Akaike Information Criterion ( A I C ) [92] and biological plausibility of the results. The selection was made with additional help by an automated A I C -based model selection procedure (function d r e d g e from the R -package M u M I n [93]).

3. Results

3.1. Tree Ring Series and Their Basic Statistics

On the nine sites studied, the sampled Scots pine, sessile oak, and ponderosa pine trees covered a representative range of diameter at breast height and tree height (Table A2). Tree ring series were successfully cross-dated and converted into b a i series, ultimately resulting in the establishment of chronologies for each site-specific stand density level. Table A2 shows the basic statistics for each chronology. In almost all cases, E P S was well above the critical value of 0.85, proposed by Wigley et al. [66], indicating that the sampled trees accurately represented a hypothetical population. R b a r values of 0.46, on average, also indicate a good common signal across the individuals sampled in each group [94].

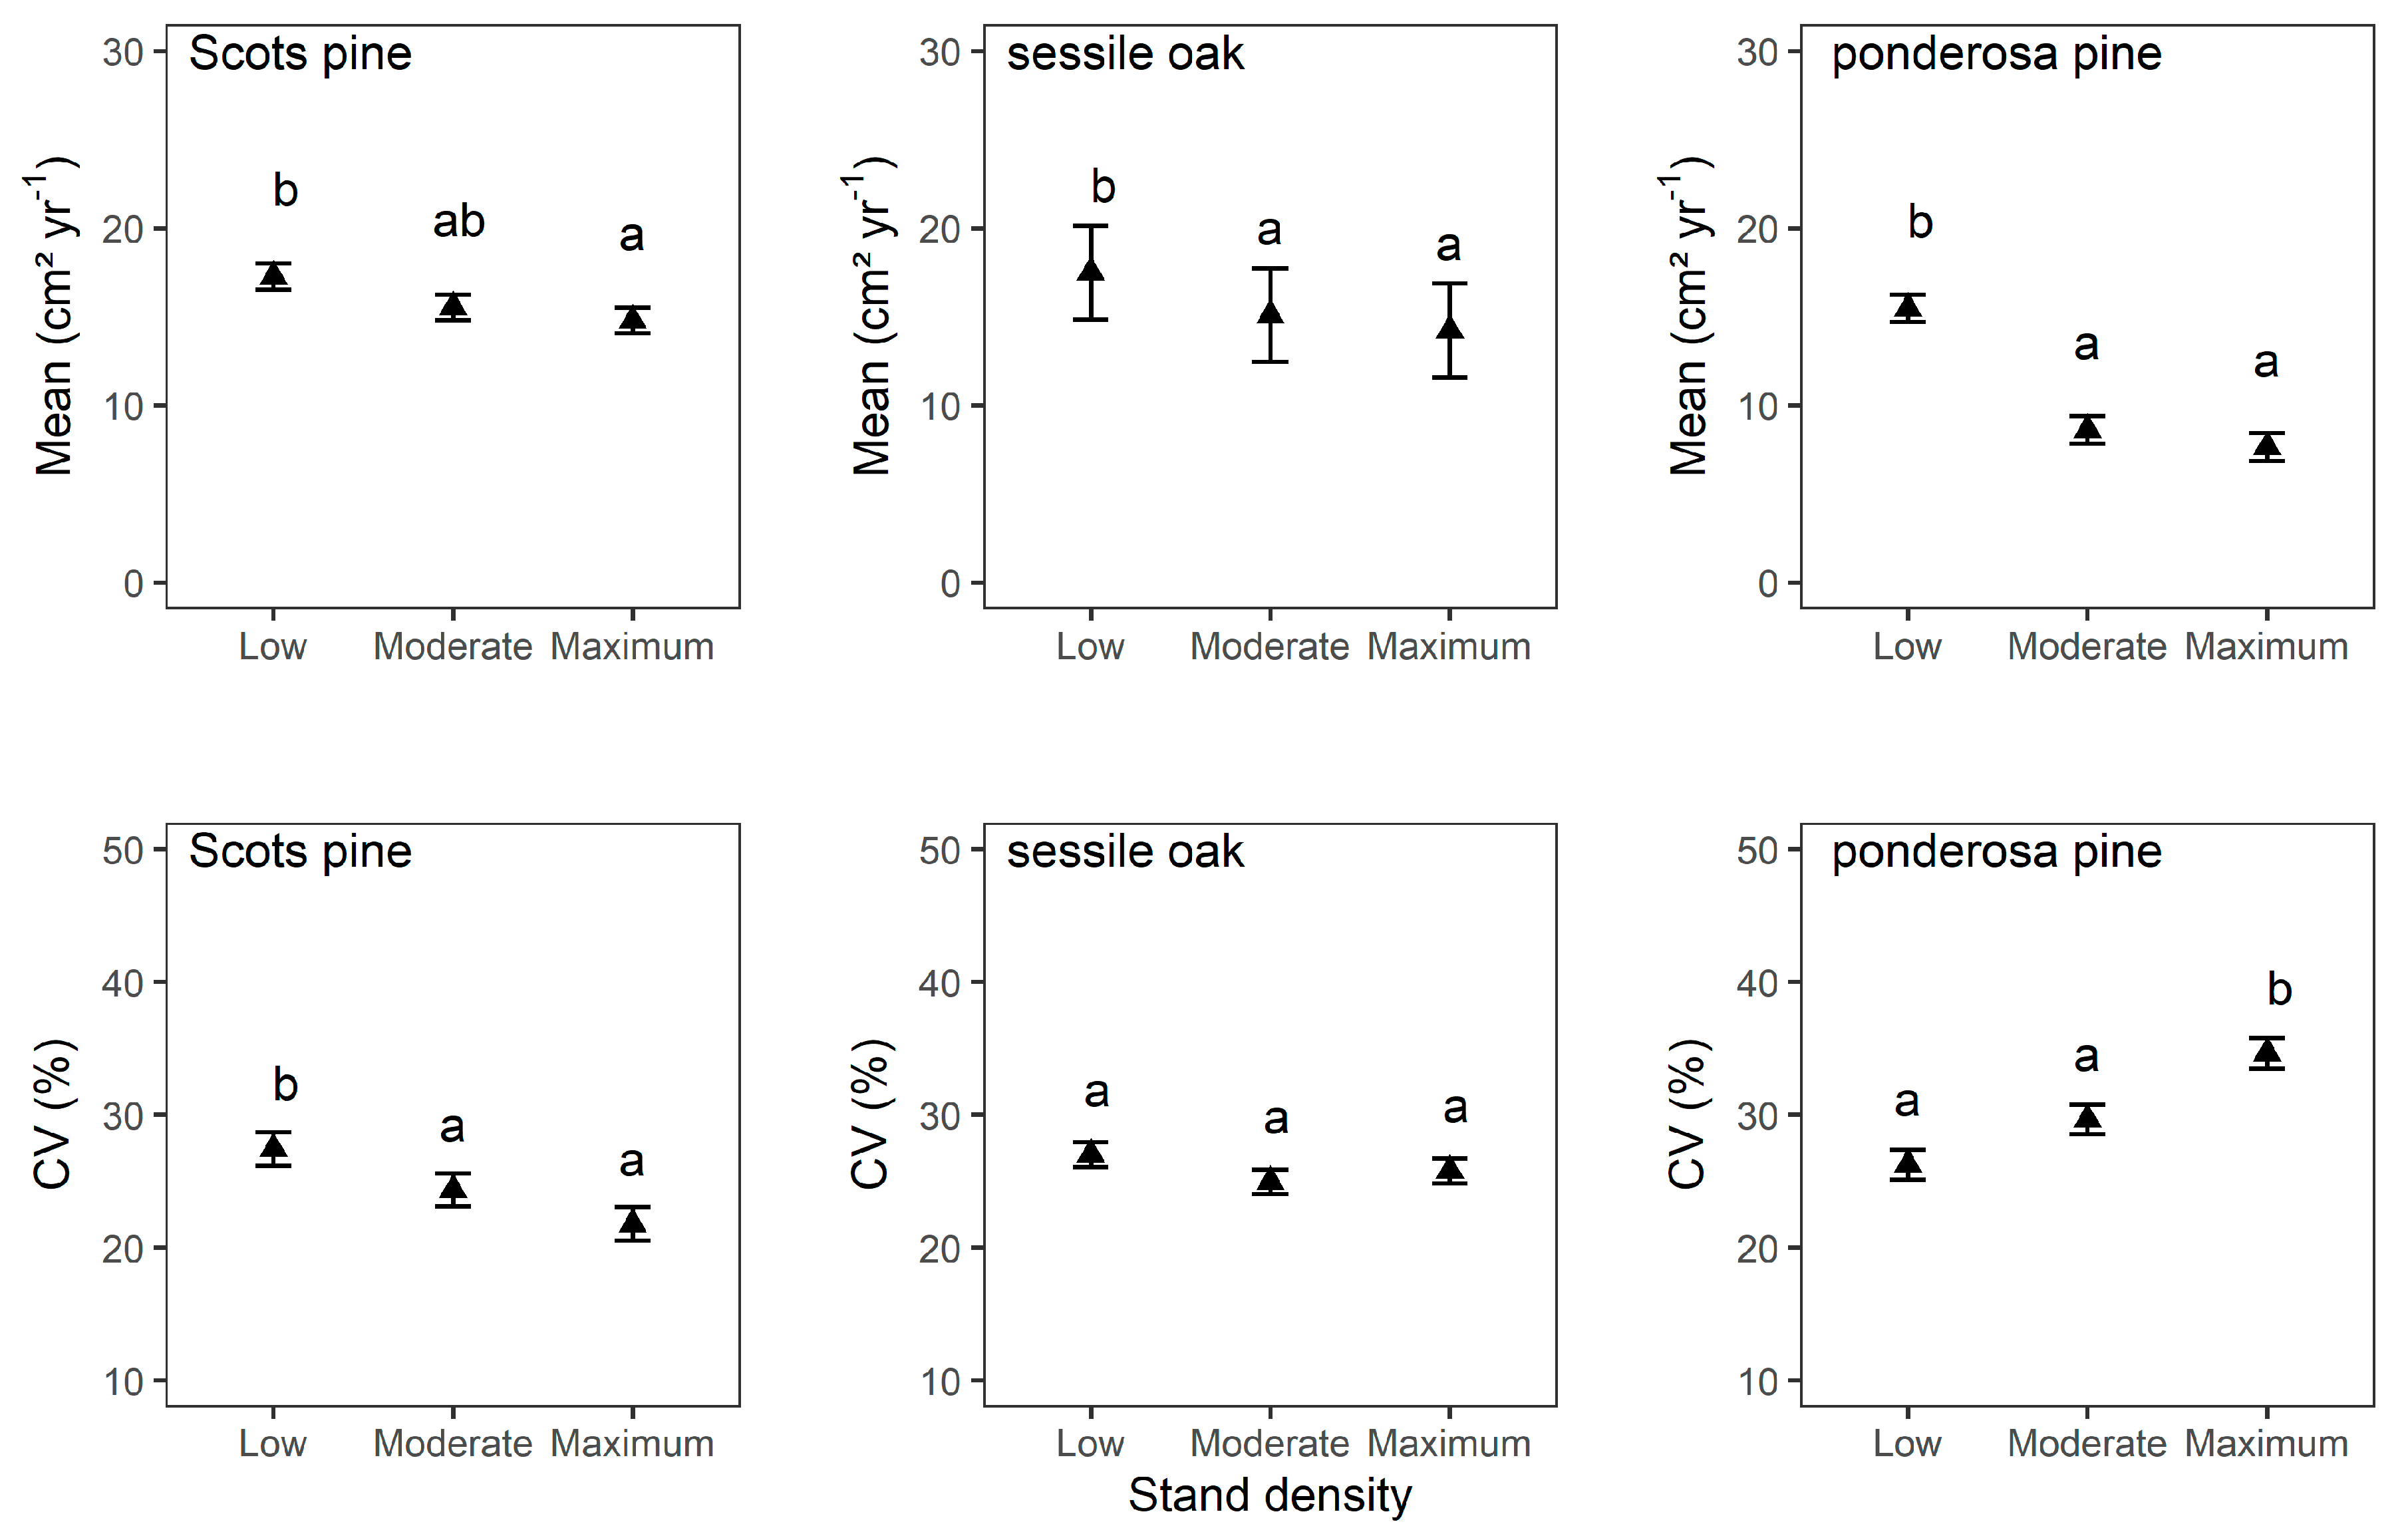
3.2. Mean Tree Growth and Mean Tree Growth Sensitivity

The analysis of tree growth characteristics ( M e a n , C V ) according to Equation (7) revealed considerable differences in mean tree growth and mean tree growth sensitivity in stands of differing stand density (Figure 2, Table A3). For Scots pine trees growing under low stand density levels, the mean basal area increment (17.3 cm2 yr−1) was significantly higher than in the untreated controls (14.8 cm2 yr−1), but not significantly different from the moderately dense stands (15.6 cm2 yr−1). The mean tree growth of sessile oak was significantly higher under low (17.5 cm2 yr−1) compared with moderate (15.1 cm2 yr−1) and maximum stand density levels (14.2 cm2 yr−1). For ponderosa pine, there was a particularly pronounced significant difference between mean growth under low (15.5 cm2 yr−1) versus moderate (8.6 cm2 yr−1) and maximum (7.6 cm2 yr−1) stand densities.
For Scots pine, the mean coefficient of variation of basal area increment ( C V ), i.e., mean tree growth sensitivity, was significantly higher in stands with low stand densities (27%) compared with moderate (24%) and maximum (22%) stand densities. In contrast, C V of ponderosa pine was significantly higher under maximum (35%) compared with low (26%) and moderate (30%) stand density. No significant differences in C V were observed for sessile oak trees growing in stands exhibiting low ( C V = 27%), moderate ( C V = 25%) and maximum ( C V = 26%) stand density.

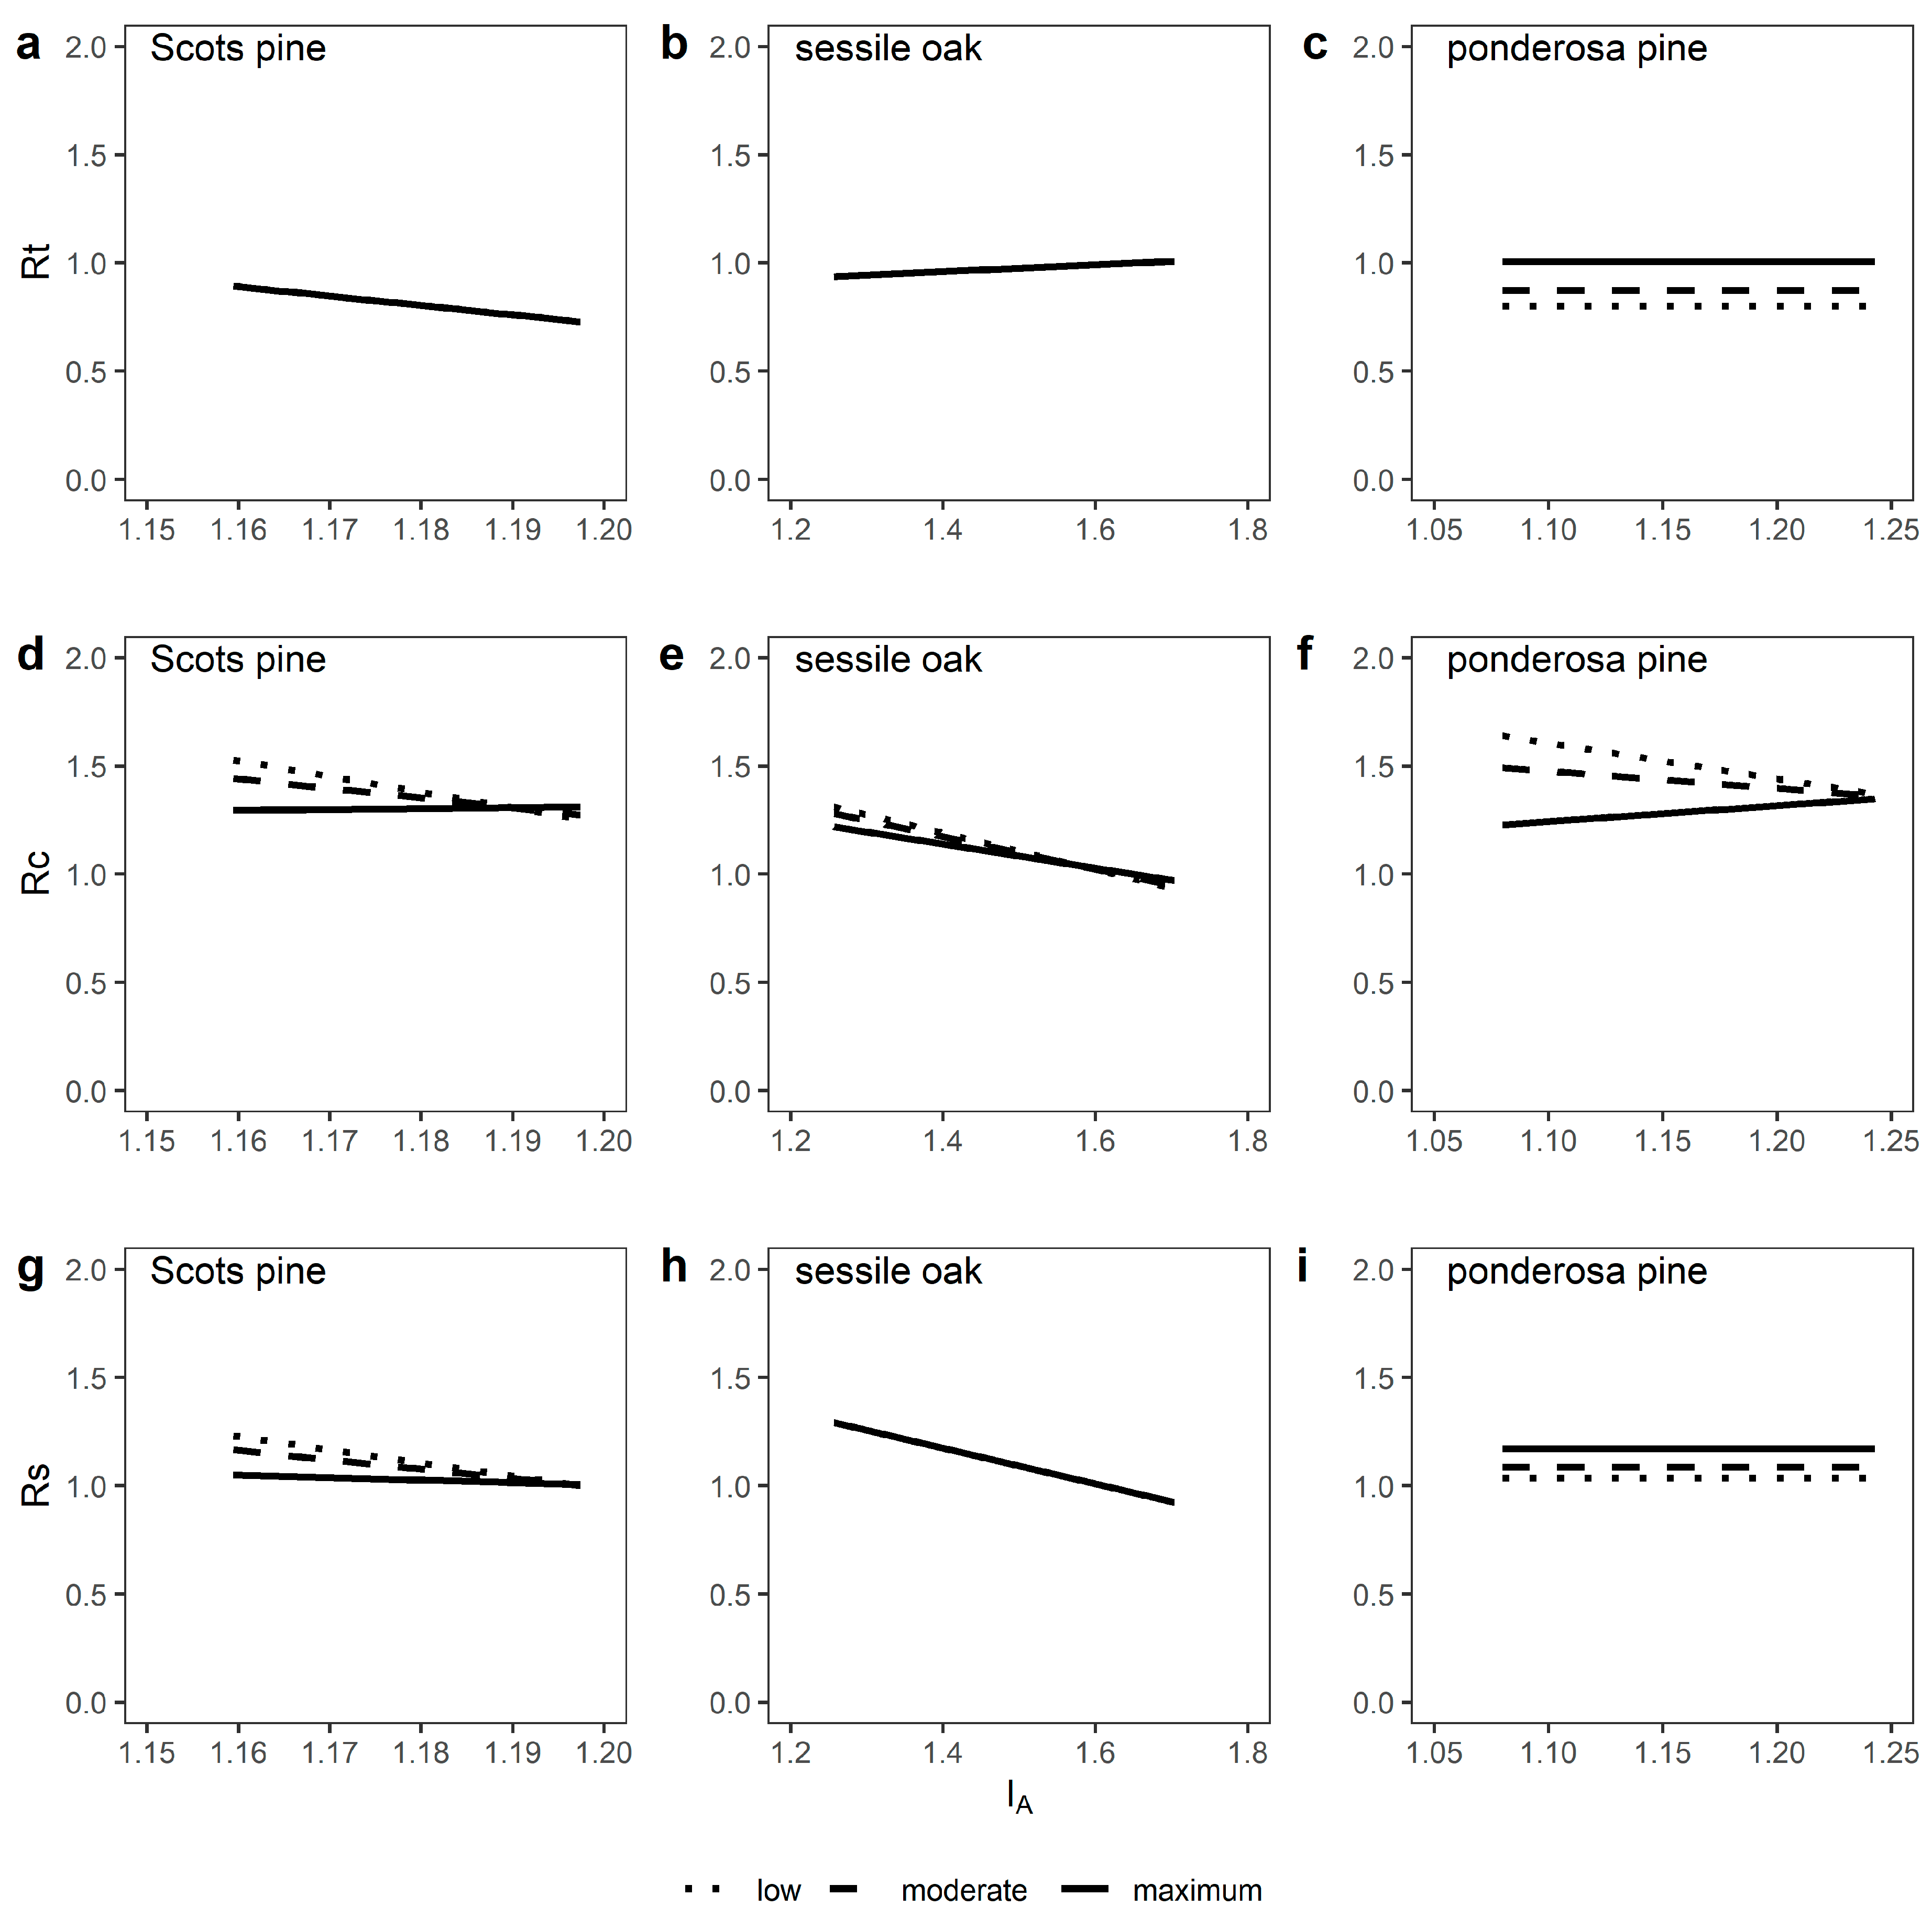
3.3. Growth Responses to Episodic Drought Stress

As expected, growth decreased during the studied drought events in all species, as witnessed by resistance values of less than 1 on average (Table 2). Average recovery and resilience values of more than 1 indicate a full recovery to above average pre-drought conditions within the time frame of two years. On average, sessile oak seemed only little affected by the drought events studied (1% average growth reduction) when compared with Scots pine (18% average growth reduction) and ponderosa pine (11% average growth reduction).
The estimated species-specific tree growth responses to selected episodic drought events are apparent from the results of linear mixed-effects regression modelling according to Equation (8) (Table 3). Higher weighted mean relative stand basal area ( M R B A ) significantly lessened recovery ( R c ) and resilience ( R s ) of Scots pine, while its resistance ( R t ) increased with increasing stand age. Site water availability, represented by the Global Aridity Index ( I A ), had a significantly negative effect on the resistance, recovery, and resilience of Scots pine. The effect of stand density on drought responses of Scots pine was significantly influenced by site water availability; the advantage of reduced stand density in terms of drought recovery and resilience gradually decreased with increasing site water availability (Table 3, Figure 3d,g). In the case of sessile oak, a higher M R B A significantly lessened drought recovery, as did higher stand age. Furthermore, the recovery and resilience of sessile oak significantly decreased with increasing site water availability. Analogously to Scots pine, increasing site water availability gradually decreased the advantage of reduced stand density in terms of drought recovery of sessile oak (Table 3, Figure 3e). Resistance and resilience of ponderosa pine significantly increased with increasing M R B A , while recovery decreased. In addition, the recovery of ponderosa pine significantly decreased with increasing site water availability. In line with Scots pine and sessile oak, the advantage of reduced stand density in terms of recovery of ponderosa pine significantly decreased with increasing site water availability (Table 3, Figure 3f).

4. Discussion

Our study reveals significant species-specific differences in mean tree growth and mean tree growth sensitivity in accordance with prevalent stand density levels. In addition, species-specific short-term tree growth responses to episodic drought stress were found to be significantly influenced by relative stand density, site water availability, and, to a lesser degree, stand age. Of particular interest is the finding that increasing site water availability significantly moderated the positive effect of reduced stand density on drought responses in all species.
The revealed growth patterns are well substantiated, owing to the ecological gradient covered, the investigation of site-specific drought events, characterized by considerable climatic drought stress, as confirmed by the metric S P E I , and the detailed information on tree and site characteristics.

4.1. Stand Density Influences Mean Tree Growth and Mean Tree Growth Sensitivity

Mean tree growth was estimated to be higher under low compared with maximum stand densities for all species studied (Figure 2). Scots pine and sessile oak trees growing under low stand densities showed an estimated 17% and 23% higher mean basal area increment, respectively, when compared with fully stocked control stands. For the studied ponderosa pine trees, the stand density effect was even more pronounced, resulting in an estimated 104% higher mean basal area growth in stands with low compared with maximum stand densities. Mean growth in moderately dense stands was in no case significantly different from growth in the fully stocked control plots. Our findings are in line with the general view that tree population density reductions result in accelerated tree growth and that the magnitude of growth increase is directly related to the intensity of the density reduction (e.g., [10]). Previous studies have also reported increasing diameter growth with thinning and reduced inter-individual competition in Scots pine [51,52,95,96,97,98], sessile oak [18,99,100], and ponderosa pine [16,51,56,101,102,103,104,105,106]. Stand density reductions can improve the growth of remaining trees by release from inter-individual competition for above and belowground resources, such as light, water, and nutrients [19,26,40], and are therefore often used as a silvicultural measure to maximize diameter growth and tree value on relatively short rotation [10]. At the same time, yield, defined as the entire stand biomass produced since stand establishment [107], might be lower under heavy compared with moderate stand density reductions or untreated controls [95,97,100,103], often prompting a trade-off between enhanced tree growth and stand productivity [26].
Growth sensitivity of trees can be seen as an indicator of the general responsiveness to prevailing environmental conditions, such as fluctuations in annual climate [64]. Mean tree growth sensitivity, measured here as the coefficient of variation of the detrended b a i index series, was estimated to be 23% greater for Scots pine trees in low stand density environments as compared with fully stocked stands (Figure 2). This general response of growth sensitivity to reduced stand density was also observed by Sánchez-Salguero et al. [98], who reported a higher growth responsiveness to climate under low competition levels for Scots pine along an altitudinal gradient in Spain. Correspondingly, Guillemot et al. [11] found higher inter-annual growth sensitivity with increasing thinning intensity of Atlas cedar (Cedrus atlantica (Endl.) Manetti) in the southern French Alps. These and our findings underline the idea that inter-individual competition determines climate sensitivity of individual tree growth. We can hypothesize that in the studied Scots pine stands in Bavaria, where water is not the limiting factor under average growing conditions, competition for light is more relevant. Therefore, the mean climate signal may not be as pronounced in fully stocked stands, while the responsiveness of trees to show a growth reaction in response to annual climate is higher in stands with lower stand densities, where, in addition, a more asymmetric mode of competition might be present [108,109,110]. This idea is consistent with Pérez-de-Lis et al. [111], who reported increasing climate sensitivity of Canary pine (Pinus canariensis Sweet ex Spreng.) with thinning intensity on wet, but not on dry sites. In contrast to Scots pine, we found that mean tree growth sensitivity of ponderosa pine increased with stand density and was 35% higher in the untreated controls compared with low stand densities. In the case of ponderosa pine, growing under chronically water stressed conditions with a more irregular seasonal water supply and a higher frequency of drought events, water can be seen as the principle limiting factor for tree growth. Here, larger trees in the more heavily thinned stands may suffer more from hydraulic constraints and water/nutrient limitations may become more important [98,112]; competition for below-ground resources might be higher due to larger average tree size and associated root systems. Growth sensitivity of sessile oak was not significantly influenced by stand density, which might indicate that inter-individual competition for resources was comparatively low under average growing conditions.
Based on our results, we partly confirm H1, as mean tree growth was positively affected by reduced stand density in all species, but the effect on mean tree growth sensitivity was insignificant in oak and inconsistent when considering the studied pine species.

4.2. Tree Growth Reactions to Episodic Drought Stress are Shaped by Relative Stand Density, Site Water Availability and Stand Age

Water stress endured during the studied drought events on average reduced tree growth in all species (Table 2). The observed growth reductions were, on average, lower than previously reported for these species [42,44,81] and considerably more moderate than reported for other commercial European tree species, such as European beech and Norway spruce [42,113], confirming a comparatively high drought resistance of the species studied. However, it is possible that the smoothing led to and underestimation of the magnitude of possible climate-related effects due to the double detrending procedure used in our study [cf. 43]. Furthermore, differing criteria for selection of drought events may explain the differences between the studies [cf.39]. Differences in the average drought responses between sessile oak and both pine species could be attributed to different water uptake strategies under drought; while anisohydric species, such as sessile oak [30,114], are known to continue transpiration until water resources are depleted [115], isohydric species, such as Scots pine [30,33,114] and ponderosa pine [116], reduce water consumption and growth at an early stage of drought by closure of stomata and reduced photosynthesis [115]. The preventive drought response strategy of isohydric species can reduce stress damage (defoliation, fine root loss, and cavitation of xylem tissue), often resulting in a higher recovery after drought when compared with anisohydric species [117]. Our results confirm the often reported high drought resistance of oak [30,42,43,114], which, in line with the literature, seems to come at the expense of a lower recovery (Table 2).
We found evidence that tree growth responses to drought can be significantly improved by reduced stand density. However, we can only partly confirm H2, as the effect was not always beneficial and it varied between the species studied. Overall, our results suggest that the effect of stand density on drought responses might be correlated with climate sensitivity (cf. 4.1); the higher the climate signal in tree growth, the higher the potential for reduced drought susceptibility. The drought responses of Scots pine were significantly improved by the maintenance of reduced stand density, as recovery and resilience were higher under lower compared with higher stand densities (Table 3), indicating the enhanced ability of Scots pine trees under lower inter-individual competition to recover after drought and reach or exceed pre-drought growth levels. A similar effect was observed in sessile oak, which also exhibited significantly higher recovery under lower compared with higher stand densities (Table 3). In accordance with our findings, previous studies have reported beneficial effects of reduced stand density on post-drought growth responses of Scots pine and sessile oak. For example, studying long-term thinning experiments in Germany, Sohn et al. [39] found that the thinning of Scots pine significantly improved growth recovery and resilience. Accordingly, Giuggiola et al. [51] reported an increase in leaf area to sapwood ratio in response to thinning in a xeric Scots pine forest in Switzerland, indicating reduced competition for water. Based on growth models that were developed from two thinning experiments in Spain, Fernández-de-Uña et al. [52] predicted lessened impacts of climate change under low levels of competition. The positive effects of reduced stand density on Scots pine drought responses could be attributed to decreased transpiration rates and increased hydraulic resistance, as reported for a Scots pine spacing trial in north-eastern Scotland by Whitehead et al. [118]. In the case of sessile oak, only little research has been devoted to studying density effects on growth responses to drought, but, based on a long-term experiment in France, Trouvé et al. [53] found that resilience was significantly lower for suppressed trees in higher density stands. In our study, ponderosa pine showed a distinctly different response pattern in relation to drought under different stand densities; resistance and resilience increased with increasing stand density, while, in line with Scots pine and oak, recovery was reduced (Table 3). In accordance with our findings, McDowell et al. [56] showed that ponderosa pine trees growing in open stands in Arizona, USA were bigger and exhibited a greater relative growth decline under drought than trees growing at a slower rate in high competition environments under high stand densities. They concluded that trees growing in highly competitive environments were less likely to benefit from wet or average growing conditions, but also less vulnerable under drought conditions. Furthermore, particularly strong reductions in stand density, such as those observed on the low density ponderosa pine plots of our study ( M R B A = 0.30–0.32), have been reported to counteract generally positive effects of reduced stand density on drought resistance and resilience over time [25]. This was attributed to significantly greater tree sizes being attained within the lower-density stands through stand development, resulting in higher hydraulic constraints and water demand compared with smaller trees. It is also likely that smaller trees and regeneration, which, under more favourable average growing conditions, may not be a significant factor for larger trees growing in the canopy, can constitute considerable competition for limited water resources on chronically water stressed sites, such as those sampled in Arizona, where large ponderosa pine trees may be more reliant on deep soil water than smaller trees [75]. Among the causality mechanisms reported for explaining negative effects of reduced stand density on drought responses, it is likely that increased evaporation and stand transpiration following stand density reductions [20,21,22] may prove particularly disadvantageous under arid growing conditions, such as those observed on the sampled ponderosa pine sites in Arizona. An explanation of the observed beneficial drought responses of ponderosa pine under higher stand densities may be found in facilitative interactions that may have overridden intraspecific competition, a mechanism observed by Fajardo and McIntire [119] and McIntire and Fajardo [120] in Lenga beech (Nothofagus pumilio (Poepp. & Endl.) Krasser) in Patagonia, Chile and confirmed by Owen [121] for ponderosa pine regeneration in Arizona, USA and Calama et al. [122] for Stone pine (Pinus pinea L.) in Spain. Fajardo and McIntire [119] proposed habitat amelioration via wind shelter and a reduction in radiation as facilitative processes between conspecific individuals that reduce evapotranspiration and improve water retention. Studying Stone pine at its ecological limit in the arid Spanish Northern Plateau, Calama et al. [122] also reported a positive effect of higher stand density on radial growth under episodic drought, which was seen as indicative of a shift from competition to facilitation under short-term water shortage. As potential causes for such facilitative effects Calama et al. [122] proposed root fusion by spontaneous graftage (anastomosis) of close conspecific neighbours, permitting an exploration of deeper ground layers and favouring mycorrhizal activity, as well as a maximization of light interception by the formation of single, umbrella like deep crowns, reducing irradiance and evapotranspiration. In our case, similar mechanisms may have increased ponderosa pine growth responsiveness to climate in dense compared to more open stands and improved growth responses under episodic drought. This seems like an interesting finding, as it, in general, is expected that intraspecific competition is fiercer than inter-specific competition, due to absolute niche overlapping [79,119,123]. In contrast to our findings, a number of studies have reported positive effects of reduced stand density on ponderosa pine tree drought resistance in its natural distribution range [16,55] and beyond [54]. The conflicting results could be related to methodological differences, such as the rationale for selecting trees, drought events, and pre- and post-periods, or differences in stand structure and site conditions. In accordance with our findings, Thomas and Waring [16] reported a positive effect of reduced stand density on the recovery of ponderosa pine.
On average, higher long-term site water availability was found to negatively influence drought resistance, recovery, and resilience of Scots pine. In sessile oak, increasing site water availability lessened recovery and resilience, but had no significant effect on resistance. In addition, recovery of ponderosa pine was, on average, negatively influenced by increasing site water availability. In line with these findings, a previous study reported that Scots pine populations on wetter sites were more impacted by drought than on drier sites [124]. However, other studies have also reported higher growth reductions on drier when compared with wetter sites [42,125], or no significant effect [126]. A recent synthesis for a wide range of forest types in the Northern Hemisphere reported significant effects of water availability on resistance (positive) and recovery (negative), but not resilience [127]. Furthermore, the legacy effects of drought have been reported to be more pronounced on dry when compared with wet sites [128]. Differences in methodological approaches may partially explain these contrasting findings, as many previous studies focused on general growth responses to climate, while our study focused on tree growth responses to specific severe to extreme drought events. It should also be pointed out that mean annual climate variables used in previous studies and ours may hide important seasonal differences among sites.
The impacts of drought on tree growth are understood to be more detrimental in environments with limited water availability [64,76,129]. Thus, the effects of reduced stand density on growth performance are expected to be more positive on sites with scarcer water supply [24]. Consistent with this framework, our results show that, in cases where site water availability significantly influenced the density effect, the benefits of reduced stand density decreased with increasing site water availability (Table 3, Figure 3). Therefore, we confirm H3. Based on a meta-regression of previous regional studies, including investigations of Scots pine, sessile oak, and ponderosa pine, Sohn et al. [24] reported that growth resistance increased with site aridity in heavily thinned and unthinned stands, whereas site aridity had no or even a negative effect in moderately thinned stands. The lack of uniform results in this study was attributed to an imbalanced distribution of studies across taxonomic groups, thinning intensities, and climatic regions, which is not the case in our study. More pronounced effects might be possible for the analysed tree species, especially at marginal sites, as our sites did not reflect the full range of potential growing conditions.
We did not find any indication that tree size had any effect on the studied species-specific short-term drought responses. This result is likely associated with the fact that only information on co-dominant and dominant trees was available in this study, which did not provide a broad range of tree sizes. Other studies, covering a larger part of the diameter distribution, reported significant influences of tree size or social class on drought responses of Scots pine [43], sessile oak [53,76], and ponderosa pine [55,105].
Stand age was found to significantly increase the resistance of Scots pine and reduce the recovery of oak (Table 3). Similar to our findings, Thurm et al. [87] reported a higher resistance with tree age, accompanied by a prolonged growth recovery time in Douglas fir. They proposed that these responses related to higher hydraulic constraints in older trees. In addition, Sohn et al. [39] reported a generally positive effect of stand age on the resistance of Scots pine. While we were not able to confirm a significant influence of stand age on the density effect, Sohn et al. [39] reported that thinning helped to prevent an age-related decline in growth resistance and recovery following drought. Differences in the methodological approach relating to the selection of drought events and the quantification of stand density may explain the differing results.

5. Conclusions

Our study provides empirical evidence that the maintenance of reduced stand densities over longer periods of time can significantly increase mean tree growth, while at the same time reducing tree drought susceptibility of Scots pine and oak by accelerated growth recovery and resilience in the former and increased recovery in the latter case. Therefore, silvicultural measures that reduce inter-individual competition, such as thinning, appear to be a suitable option for adapting existing stands of Scots pine and sessile oak to climate change. This is of high practical relevance, as mortality might be reduced and trees may become less susceptible to secondary pests and pathogens [24]. However, our findings also highlight the need for consideration of local climatic conditions when deciding on the suitability of such adaptation measures; the positive effects of reduced stand density were much stronger on sites with higher aridity, while the effect was reduced or even lost on sites with higher long-term water availability. This finding is new and the results appear promising under current climate scenarios that foresee higher average temperatures and lower or constant precipitation in many European regions, such as southern and western Europe [47]. However, it also prompts further questions as to what effects can be expected under more extreme climatic conditions and under higher seasonal variability in water supply. Our investigation of tree drought responses in chronically water stressed ponderosa pine confirms that, in contrast to Central Europe, where extreme drought events still occur less frequently and average water availability still seems sufficient, the observed relation of stand density and drought susceptibility may be reversed, a response pattern that was characterized by significantly decreased drought resistance and resilience in more open as compared with denser ponderosa pine stands. However, ponderosa pine growing under lower competition levels still exhibited greater recovery, higher absolute growth, and less variable growth overall. Further research should aim at studying the effect of competition on drought responses along larger continuous climatic gradients, encompassing more extreme growing conditions at marginal sites. In addition, the sampling of trees should ideally be conducted along the entire diameter range of a given stand to better account for potential effects of tree size and social class on drought responses under different levels of competition. Future studies should also address the need for further research into the interactions between stand density and microclimate, which might help to better understand the causes for negative effects of stand density reductions on drought responses, particularly with respect to ponderosa pine. Finally, facilitative effects among conspecific neighbours with overlapping ecological niches may, in part, explain the drought response patterns that were observed in ponderosa pine. This constitutes a rather novel view on individual tree interactions under drought with potentially considerable implications for techniques currently employed by forest managers and silviculturists, therefore warranting further examination.

Supplementary Materials

The following are available online at https://www.mdpi.com/1999-4907/11/6/627/s1, Figure S1: Climate diagrams (reference period: 1978–2017) for all nine study sites in Bavaria, Germany (DE 1–DE 6) and Arizona, USA (US 1–US 3).

Author Contributions

Conceptualisation, M.S., M.d.R. and H.P.; data curation, M.S.; formal analysis, M.S.; funding acquisition, H.P.; investigation, M.S.; methodology, M.S.; resources, W.K.M. and H.P.; supervision, H.P.; validation, M.S.; visualisation, M.S.; writing—original draft, M.S.; writing—review & editing, M.S., W.K.M., M.d.R. and H.P. All authors have read and agreed to the published version of the manuscript.

Funding

This research was funded by the Eva Mayr-Stihl Stiftung (170124) and the European Union as part of the ERANet SUMFOREST project REFORM—Mixed species forest management. Lowering risk, increasing resilience (2816ERA02S, PCIN2017-026). We want to thank the German Federal Ministry of Food and Agriculture (BMEL) for financial support through the Federal Office for Agriculture and Food (BLE) (2816ERA02S).

Acknowledgments

We thank the Bavarian State Forest Enterprise (Bayerische Staatsforsten AöR) and the United States Forest Service for providing suitable research sites. Furthermore, we thank Matthew Stone for his assistance in the field and Peter Biber for supporting the statistical analysis.

Conflicts of Interest

The authors declare no conflict of interest.

Appendix A

Table A1. Thinning history (year of thinning and subsequent sampling) and analysed episodic drought events (year of drought and corresponding mean S P E I value during the growing season in brackets) for each site.
SiteSpeciesThinning History (Year of Thinning and Sampling)Drought Years (SPEI)
DE 1sessile oak2004, 2009, 20142015 (−1.5)
DE 2sessile oak1981, 1986, 1991, 1996, 2002, 20102003 (−1.6), 2015 (−1.8)
DE 3sessile oak1934, 1942, 1952, 1958, 1966, 1976, 1986, 1996, 2006, 20132003 (−1.6), 2015 (−1.8)
DE 4Scots pine1966, 1977, 1986, 1993, 1998, 2003, 2008, 20151976 (−1.2)
DE 5Scots pine20022003 (−2.1), 2015 (−1.4)
DE 6Scots pine1987, 1992, 1997, 2002, 2007, 20142003 (−1.7), 2015 (−1.6)
US 1ponderosa pine1925, 19341989 (−1.4), 2002 (−2.1), 2009 (−1.3)
US 2ponderosa pine1924, 1935, 1946, 1967, 1968, 1988, 19972002 (−2.2), 2009 (−1.3)
US 3ponderosa pine1925, 19361989 (−1.0), 2002 (−2.2), 2009 (−1.3)
Table A2. Mean tree and chronology characteristics by species, site and stand density level ( S D ). n : number of trees sampled. d b h : diameter at breast height. h : tree height. M R B A : weighted mean relative stand basal area. R b a r : inter-series correlation. E P S : expected population signal.
SpeciesSiteSDndbhhMRBARbarEPS
cmm
sessile oakDE 1Low1521.818.50.440.550.95
Mod1518.518.30.650.450.92
Max1518.319.01.000.560.95
DE 2Low1538.426.20.600.540.94
Mod1534.827.20.730.560.94
Max1528.228.31.000.520.94
DE 3Low1548.731.10.800.500.92
Mod1544.030.50.860.590.95
Max1535.529.01.000.540.94
Scots pineDE 4Low1530.420.80.470.410.90
Mod1625.520.70.580.440.92
Max1528.124.71.000.430.91
DE 5Low1738.323.50.300.400.91
Mod1537.024.70.560.440.91
Max1530.624.91.000.520.94
DE 6Low1524.118.20.500.570.95
Mod1515.613.70.700.480.93
Max1714.914.51.000.490.94
ponderosa pineUS 1Low1540.817.10.300.470.93
Mod1535.119.20.520.290.84
Max1527.619.41.000.330.88
US 2Low1531.314.00.320.550.90
Mod1527.413.40.610.580.95
Max1522.312.71.000.440.92
US 3Low1536.813.80.310.320.84
Mod1533.617.90.560.350.88
Max1523.715.61.000.180.74
Table A3. Results of the linear mixed-effects model regressions from Equation (7). We test the effect of tree basal area ( b a , cm2), and stand density level ( S D m i n , S D m o d , S D m a x ) on the mean tree growth ( M e a n , cm2 yr−1) and the mean growth sensitivity ( C V ,   % ). The number of observations was always n = 139 for Scots pine, n = 135 for sessile oak and n = 135 for ponderosa pine. Bold values are significant at level p < 0.001 (***), p < 0.01 (**), p < 0.05 (*), p < 0.1 (.).
SpeciesResponse VariableStatisticInterceptbaSDmodSDmax
a0a1a2a3
Scots pineMeanEstimate1.450.02 ***−1.73 .−2.48 *
SE 1.700.000.981.01
CVEstimate31.59 ***−0.01 ***−3.09 *−5.65 ***
SE 2.640.001.191.23
sessile oakMeanEstimate3.930.01 ***−2.41 **−3.27 ***
SE 4.850.000.800.92
CVEstimate27.68 ***−0.00−2.03−1.21
SE 2.300.001.301.46
ponderosa pineMeanEstimate9.24 ***0.01 ***−6.87 ***−7.84 ***
SE 1.690.000.830.96
CVEstimate27.91 ***−0.003.40 *8.38 ***
SE 2.740.001.621.87

References

  1. Spinoni, J.; Vogt, J.V.; Naumann, G.; Barbosa, P.; Dosio, A. Will drought events become more frequent and severe in Europe? Int. J. Climatol. 2018, 38, 1718–1736. [Google Scholar] [CrossRef] [Green Version]
  2. Wilhite, D.A. (Ed.) Drought Assessment, Management, and Planning, Theory and Case Studies; Kluwer Acad Publ Boston: Boston, MA, USA, 1993; ISBN 0792393376. [Google Scholar]
  3. Gleason, K.E.; Bradford, J.B.; Bottero, A.; D’Amato, A.W.; Fraver, S.; Palik, B.J.; Battaglia, M.A.; Iverson, L.; Kenefic, L.; Kern, C.C. Competition amplifies drought stress in forests across broad climatic and compositional gradients. Ecosphere 2017, 8, e01849. [Google Scholar] [CrossRef] [Green Version]
  4. Allen, C.D.; Macalady, A.K.; Chenchouni, H.; Bachelet, D.; McDowell, N.; Vennetier, M.; Kitzberger, T.; Rigling, A.; Breshears, D.D.; Hogg, E.H.; et al. A global overview of drought and heat-induced tree mortality reveals emerging climate change risks for forests. For. Ecol. Manag. 2010, 259, 660–684. [Google Scholar] [CrossRef] [Green Version]
  5. Williams, A.P.; Allen, C.D.; Macalady, A.K.; Griffin, D.; Woodhouse, C.A.; Meko, D.M.; Swetnam, T.W.; Rauscher, S.A.; Seager, R.; Grissino-Mayer, H.D.; et al. Temperature as a potent driver of regional forest drought stress and tree mortality. Nat. Clim. Chang. 2013, 3, 292–297. [Google Scholar] [CrossRef]
  6. Knoke, T.; Ammer, C.; Stimm, B.; Mosandl, R. Admixing broadleaved to coniferous tree species A review on yield, ecological stability and economics. Eur. J. Forest. Res. 2008, 127, 89–101. [Google Scholar] [CrossRef]
  7. Bolte, A.; Degen, B. Forest adaptation to climate change-Options and limitations. Landbauforschung Volkenrode 2010, 60, 111–118. [Google Scholar]
  8. Brang, P.; Spathelf, P.; Larsen, J.B.; Bauhus, J.; Boncčìna, A.; Chauvin, C.; Drössler, L.; García-Güemes, C.; Heiri, C.; Kerr, G.; et al. Suitability of close-to-nature silviculture for adapting temperate European forests to climate change. Forestry 2014, 87, 492–503. [Google Scholar] [CrossRef] [Green Version]
  9. Bottero, A.; D’Amato, A.W.; Palik, B.J.; Bradford, J.B.; Fraver, S.; Battaglia, M.A.; Asherin, L.A. Density-dependent vulnerability of forest ecosystems to drought. J. Appl. Ecol. 2017, 54, 1605–1614. [Google Scholar] [CrossRef]
  10. Pretzsch, H. Grundlagen der Waldwachstumsforschung, 2nd ed.; Springer: Berlin, Germany, 2019; ISBN 978-3-662-58155-1. [Google Scholar]
  11. Guillemot, J.; Klein, E.K.; Davi, H.; Courbet, F. The effects of thinning intensity and tree size on the growth response to annual climate in Cedrus atlantica a linear mixed modeling approach. Ann. For. Sci. 2015, 72, 651–663. [Google Scholar] [CrossRef] [Green Version]
  12. Smith, D.M. The practice of silviculture. In Applied Forest Ecology, 9th ed.; Wiley: New York, NY, USA, 1997; ISBN 978-0-471-10941-9. [Google Scholar]
  13. Linder, M. Developing adaptive forest management strategies to cope with climate change. Tree Phys. 2000, 20, 299–307. [Google Scholar] [CrossRef] [Green Version]
  14. Papadopol, C.S. Impacts of climate warming on forests in Ontario: Options for adaptation and mitigation. For. Chron 2000, 76, 139–149. [Google Scholar] [CrossRef] [Green Version]
  15. Spittlehouse, D.L.; Stewart, R.B. Adapting to Climate Change in Forest Management. 2003. Available online: http://41.73.194.134/xmlui/handle/123456789/493 (accessed on 30 May 2020).
  16. Thomas, Z.; Waring, K.M. Enhancing Resiliency and Restoring Ecological Attributes in Second-Growth Ponderosa Pine Stands in Northern New Mexico, USA. For. Sci. 2014, 61, 93–104. [Google Scholar] [CrossRef]
  17. Ammer, C. Unraveling the Importance of Inter- and Intraspecific Competition for the Adaptation of Forests to Climate Change. In Progress in Botany; Cánovas, F.M., Lüttge, U., Matyssek, R., Eds.; Springer International Publishing: Berlin/Heidelberg, Germany, 2017; Volume 78, pp. 345–367. ISBN 978-3-319-49490-6. [Google Scholar]
  18. Bréda, N.; Granier, A.; Aussenac, G. Effects of thinning on soil and tree water relations, transpiration and growth in an oak forest (Quercus petraea (Matt.) Liebl.). Tree Phys. 1995, 15, 295–306. [Google Scholar] [CrossRef] [PubMed]
  19. Aussenac, G.; Granier, A. Effects of thinning on water stress and growth in Douglas-fir. Can. J. For. Res. 1988, 18, 100–105. [Google Scholar] [CrossRef]
  20. Lagergren, F.; Lankreijer, H.; Kučera, J.; Cienciala, E.; Mölder, M.; Lindroth, A. Thinning effects on pine-spruce forest transpiration in central Sweden. For. Ecol. Manag. 2008, 255, 2312–2323. [Google Scholar] [CrossRef]
  21. Brooks, J.R.; Mitchell, A.K. Interpreting tree responses to thinning and fertilization using tree-ring stable isotopes. New Phytol. 2011, 190, 770–782. [Google Scholar] [CrossRef] [Green Version]
  22. Aussenac, G. Interactions between forest stands and microclimate Ecophysiological aspects and consequences for silviculture. Ann. For. Sci. 2000, 57, 287–301. [Google Scholar] [CrossRef]
  23. Nilsen, E.T.; Clinton, B.D.; Lei, T.T.; Miller, T.T.; Semones, S.W.; Walker, J.F. Does Rhododendron maximum L. (Ericaceae) Reduce the Availability of Resources Above and Belowground for Canopy Tree Seedlings. Am. Midl. Nat. 2001, 145, 325–343. [Google Scholar] [CrossRef]
  24. Sohn, J.A.; Saha, S.; Bauhus, J. Potential of forest thinning to mitigate drought stress A meta-analysis. For. Ecol. Manag. 2016, 380, 261–273. [Google Scholar] [CrossRef]
  25. D’Amato, A.W.; Bradford, J.B.; Fraver, S.; Palik, B.J. Effects of thinning on drought vulnerability and climate response in north temperate forest ecosystems. Ecol. Appl. 2013, 23, 1735–1742. [Google Scholar] [CrossRef] [Green Version]
  26. Pretzsch, H. Density and growth of forest stands revisited. Effect of the temporal scale of observation, site quality, and thinning. For. Ecol. Manag. 2020, 460, 117879. [Google Scholar] [CrossRef]
  27. Eaton, E.; Caudullo, G.; Oliveira, S.; Rigo, D. Quercus robur and Quercus petraea in Europe distribution, habitat, usage and threats. In European Atlas of Forest Tree Species, 1st ed.; San-Miguel-Ayanz, J., Rigo, D.D., Caudullo, G., Durrant, T.H., Mauri, A., Eds.; Publication Office of the European Union Luxembourg: Luxembourg, 2016; ISBN 978-92-79-36740-3. [Google Scholar]
  28. Houston Durrant, T.; Rigo, D.; Caudullo, G. Pinus sylvestris in Europe 965 distribution, habitat, usage and threats. In European Atlas of Forest Tree Species, 1st ed.; San-Miguel-Ayanz, J., Rigo, D.d., Caudullo, G., Durrant, T.H., Mauri, A., Eds.; Publication Office of the European Union Luxembourg: Luxembourg, 2016; ISBN 978-92-79-36740-3. [Google Scholar]
  29. Spellmann, H.; Albert, M.; Schmidt, M.; Sutmöller, J.; Overbeck, M. Waldbauliche Anpassungsstrategien für veränderte Klimaverhältnisse. AFZ-Der Wald. 2011, 11, 19–23. [Google Scholar]
  30. Zang, C.; Rothe, A.; Weis, W.; Pretzsch, H. Zur Baumarteneignung bei Klimawandel Ableitung der Trockenstress-Anfälligkeit wichtiger Waldbaumarten aus Jahrringbreiten. Environ. Sci. Policy 2011, 14, 100–110. [Google Scholar]
  31. Albert, M.; Hansen, J.; Nagel, J.; Schmidt, M.; Spellmann, H. Assessing risks and uncertainties in forest dynamics under different management scenarios and climate change. For. Ecosyst. 2015, 2, 14. [Google Scholar] [CrossRef] [Green Version]
  32. Krakau, U.K.; Liesebach, M.; Aronen, T.; Lelu-Walter, M.-A.; Schneck, V. Scots Pine (Pinus sylvestris L.). In Forest Tree Breeding in Europe Current State-of-the-Art and Perspectives; Pâques, L.E., Ed.; Springer Dordrecht: New York, NY, USA, 2013; ISBN 9400761457. [Google Scholar]
  33. Irvine, J.; Perks, M.P.; Magnani, F.; Grace, J. The response of Pinus sylvestris to drought Stomatal control of transpiration and hydraulic conductance. Tree Physiol. 1998, 18, 393–402. [Google Scholar] [CrossRef] [PubMed]
  34. Martínez-Vilalta, J.; Piñol, J. Drought-induced mortality and hydraulic architecture in pine populations of the NE Iberian Peninsula. For. Ecol. Manag. 2002, 161, 247–256. [Google Scholar] [CrossRef]
  35. Bigler, C.; Bräker, O.U.; Bugmann, H.; Dobbertin, M.; Rigling, A. Drought as an Inciting Mortality Factor in Scots Pine Stands of the Valais, Switzerland. Ecosystems 2006, 9, 330–343. [Google Scholar] [CrossRef] [Green Version]
  36. Kölling, C.; Zimmermann, L. Die Anfälligkeit der Wälder Deutschlands gegenüber Klimawandel. Gefahrstoffe-Reinhaltung der Luft 2007, 67, 259–268. [Google Scholar]
  37. Galiano, L.; Martínez-Vilalta, J.; Lloret, F. Drought-Induced Multifactor Decline of Scots Pine in the Pyrenees and Potential Vegetation Change by the Expansion of Co-occurring Oak Species. Ecosystems 2010, 13, 978–991. [Google Scholar] [CrossRef]
  38. Matías, L.; Jump, A.S. Interactions between growth, demography and biotic interactions in determining species range limits in a warming world The case of Pinus sylvestris. For. Ecol. Manag. 2012, 282, 10–22. [Google Scholar] [CrossRef]
  39. Sohn, J.A.; Hartig, F.; Kohler, M.; Huss, J.; Bauhus, J. Heavy and frequent thinning promotes drought adaptation in Pinus sylvestris forests. Ecol. Appl. 2016, 26, 2190–2205. [Google Scholar] [CrossRef] [PubMed]
  40. Del Río, M.; Bravo-Oviedo, A.; Pretzsch, H.; Löf, M.; Ruiz-Peinado, R. A review of thinning effects on Scots pine stands From growth and yield to new challenges under global change. For. Syst. 2017, 26, eR03S. [Google Scholar] [CrossRef]
  41. Praciak, A.; Pasiecznik, N.; Sheil, D.; van Heist, M.; Sassen, M.; Correia, C.S.; Dixon, C.; Fyson, G.; Rushford, K.; Teeling, C. The CABI Encyclopedia of Forest Trees; CABI Oxfordshire: Wallingford, UK, 2013; ISBN 978-1-78064-236-9. [Google Scholar]
  42. Pretzsch, H.; Schütze, G.; Uhl, E. Resistance of European tree species to drought stress in mixed versus pure forests Evidence of stress release by inter-specific facilitation. Plant Biol. 2013, 15, 483–495. [Google Scholar] [CrossRef] [PubMed]
  43. Steckel, M.; del Río, M.; Heym, M.; Aldea, J.; Bielak, K.; Brazaitis, G.; Černý, J.; Coll, L.; Collet, C.; Ehbrecht, M.; et al. Species mixing reduces drought susceptibility of Scots pine (Pinus sylvestris L.) and oak (Quercus robur L., Quercus petraea (Matt.) Liebl.)—Site water supply and fertility modify the mixing effect. For. Ecol. Manag. 2020, 461, 117908. [Google Scholar] [CrossRef]
  44. Merlin, M.; Perot, T.; Perret, S.; Korboulewsky, N.; Vallet, P. Effects of stand composition and tree size on resistance and resilience to drought in sessile oak and Scots pine. For. Ecol. Manag. 2015, 339, 22–33. [Google Scholar] [CrossRef] [Green Version]
  45. Pretzsch, H.; Steckel, M.; Heym, M.; Biber, P.; Ammer, C.; Ehbrecht, M.; Bielak, K.; Bravo, F.; Ordóñez, C.; Collet, C.; et al. Stand growth and structure of mixed-species and monospecific stands of Scots pine (Pinus sylvestris L.) and oak (Q. robur L., Quercus petraea (Matt.) Liebl.) analysed along a productivity gradient through Europe. Eur. J. Forest Res. 2019, 162, 141. [Google Scholar] [CrossRef] [Green Version]
  46. Steckel, M.; Heym, M.; Wolff, B.; Reventlow, D.O.J.; Pretzsch, H. Transgressive overyielding in mixed compared with monospecific Scots pine (Pinus sylvestris L.) and oak (Quercus robur L., Quercus petraea (Matt.) Liebl.) stands—Productivity gains increase with annual water supply. For. Ecol. Manag. 2019, 439, 81–96. [Google Scholar] [CrossRef]
  47. Jacob, D.; Petersen, J.; Eggert, B.; Alias, A.; Christensen, O.B.; Bouwer, L.M.; Braun, A.; Colette, A.; Déqué, M.; Georgievski, G.; et al. EURO-CORDEX new high-resolution climate change projections for European impact research. Reg. Environ. Chang. 2014, 14, 563–578. [Google Scholar] [CrossRef]
  48. Perkins, D.; Uhl, E.; Biber, P.; Du Toit, B.; Carraro, V.; Rötzer, T.; Pretzsch, H. Impact of Climate Trends and Drought Events on the Growth of Oaks (Quercus robur L. and Quercus petraea (Matt.) Liebl.) within and beyond Their Natural Range. Forests 2018, 9, 108. [Google Scholar] [CrossRef] [Green Version]
  49. Wennerberg, S. Plant Guide. Ponderosa Pine. 2004. Available online: https://plants.usda.gov/plantguide/pdf/pg_pipo.pdf (accessed on 6 March 2020).
  50. Schütt, P.; Schuck, H.J.; Stimm, B. Lexikon der Baum- und Straucharten, Das Standardwerk der Forstbotanik, Morphologie, Pathologie, Ökologie und Systematik Wichtiger Baum- und Straucharten; Lizenzausgabe 2007; Nikol Verlagsgesellschaft: Hamburg, Germany, 2007; ISBN 3933203538. [Google Scholar]
  51. Giuggiola, A.; Bugmann, H.; Zingg, A.; Dobbertin, M.; Rigling, A. Reduction of stand density increases drought resistance in xeric Scots pine forests. For. Ecol. Manag. 2013, 310, 827–835. [Google Scholar] [CrossRef]
  52. Fernández-de-Uña, L.; Cañellas, I.; Gea-Izquierdo, G. Stand competition determines how different tree species will cope with a warming climate. PLoS ONE 2015, 10, e0122255. [Google Scholar] [CrossRef] [PubMed] [Green Version]
  53. Trouvé, R.; Bontemps, J.D.; Collet, C.; Seynave, I.; Lebourgeois, F. Radial growth resilience of sessile oak after drought is affected by site water status, stand density, and social status. Trees 2017, 31, 517–529. [Google Scholar] [CrossRef]
  54. Fernández, M.E.; Gyenge, J.E.; Urquiza, M.M.; Varela, S. Adaptability to climate change in forestry species drought effects on growth and wood anatomy of ponderosa pines growing at different competition levels. For. Syst. 2012. [Google Scholar] [CrossRef] [Green Version]
  55. Kerhoulas, L.P.; Kolb, T.E.; Hurteau, M.D.; Koch, G.W. Managing climate change adaptation in forests a case study from the U.S. Southwest. J. Appl. Ecol. 2013, 50, 1311–1320. [Google Scholar] [CrossRef] [Green Version]
  56. McDowell, N.G.; Adams, H.D.; Bailey, J.D.; Hess, M.; Kolb, T.E. Homeostatic Maintenance Of Ponderosa Pine Gas Exchange In Response To Stand Density Changes. Ecol. Appl. 2006, 16, 1164–1182. [Google Scholar] [CrossRef]
  57. Alton, A.L.; James, D.; Barton, J.R.; Miles, S.R. Field Efficiencies of Forest Sampling Methods. Ecology 1958, 39, 428–444. [Google Scholar] [CrossRef]
  58. Johann, K. Eine neue Jahrringmeßanlage für Bohrkerne und Stammscheiben. Forstarchiv 1977, 48, 24–26. [Google Scholar]
  59. Schweingruber, F.H.; Eckstein, D.; Serre-Bachet, F.; Bräker, O.U. Identification, presentation and interpretation of event years and pointer years in dendrochronology. Dendrochronologia 1990, 8, 9–38. [Google Scholar]
  60. Biondi, F.; Qeadan, F. A Theory-Driven Approach to Tree-Ring Standardization Defining the Biological Trend from Expected Basal Area Increment. Tree-Ring Res. 2008, 64, 81–96. [Google Scholar] [CrossRef] [Green Version]
  61. Holmes, R.L.; Adams, R.K.; Fritts, H.C. Tree-Ring Chronologies of Western North America California, Eastern Oregon and Northern Great Basin with Procedures Used in the Chronology Development Work Including Users Manuals for Computer Programs COFECHA and ARSTAN; Laboratory of Tree-Ring Research, University of Arizona Tucson: Tucson, AZ, USA, 1986. [Google Scholar]
  62. Hugershoff, R. Die Mathematischen Hilfsmittel der Kulturingenierurs und Biologen Herleitung von Gesetzmäßigen Zusammenhängen als Manuskript Veröffentlicht. 1936. Available online: https://books.google.com/books/about/Die_mathematischen_Hilfsmittel_der_Kultu.html?id=c_4YGwAACAAJ (accessed on 30 May 2020).
  63. Cook, E.R.; Peters, K. The smoothing spline a new approach to standardizing forest interior tree-ring width series for dendroclimatic studies. Tree-Ring Bull. 1981, 41, 45–53. [Google Scholar]
  64. Fritts, H.C. Tree Rings and Climate, Reprint of second printing 1976; Blackburn Press: Caldwell, NJ, USA, 2001; ISBN 978-1930665392. [Google Scholar]
  65. Esper, J.; Cook, E.R.; Schweingruber, F.H. Low-Frequency Signals in Long Tree-Ring Chronologies for Reconstructing Past Temperature Variability. Science 2002, 295, 2250. [Google Scholar] [CrossRef] [PubMed] [Green Version]
  66. Wigley, T.M.L.; Briffa, K.R.; Jones, P.D. On the Average Value of Correlated Time Series, with Applications in Dendroclimatology and Hydrometeorology. J. Appl. Meteorol. Clim. 1984, 23, 201–213. [Google Scholar] [CrossRef]
  67. Bunn, A.G. A dendrochronology program library in R (dplR). Dendrochronologia 2008, 26, 115–124. [Google Scholar] [CrossRef]
  68. R Core Team. R A Language and Environment for Statistical Computing. R Foundation for Statistical Computing. Available online: www.R-project.org (accessed on 5 July 2019).
  69. Deutscher Wetterdienst. Grids of Monthly Averaged Daily Air Temperature (2m) over Germany Version v1.0. Available online: https://opendata.dwd.de/climate_environment/CDC/grids_germany/monthly/air_temperature_mean (accessed on 6 March 2020).
  70. Deutscher Wetterdienst. Grids of Monthly Total Precipitation over GERMANY Version v1.0. Available online: https://opendata.dwd.de/climate_environment/CDC/grids_germany/monthly/precipitation (accessed on 6 March 2020).
  71. PRISM Climate Group. PRISM Data Time Series Values for Individual Locations Monthly Ppt, Tmin, Tmean, Tmax. Available online: http://www.prism.oregonstate.edu/explorer (accessed on 6 March 2020).
  72. Middleton, N.; Thomas, D. World Atlas of Desertification, Repr; Arnold: London, UK, 1993; ISBN 0340555122. [Google Scholar]
  73. Thornthwaite, C.W. An Approach toward a Rational Classification of Climate. Geogr. Rev. 1948, 38, 55–94. [Google Scholar] [CrossRef]
  74. Walter, H.; Lieth, H. Klimadiagramm-Weltatlas; Gustav Fischer Verlag Jena: Stuttgart, Germany, 1976. [Google Scholar]
  75. Kerhoulas, L.P.; Kolb, T.E.; Koch, G.W. Tree size, stand density, and the source of water used across seasons by ponderosa pine in northern Arizona. For. Ecol. Manag. 2013, 289, 425–433. [Google Scholar] [CrossRef]
  76. Bréda, N.; Huc, R.; Granier, A.; Dreyer, E. Temperate forest trees and stands under severe drought A review of ecophysiological responses, adaptation processes and long-term consequences. Ann. For. Sci. 2006, 63, 625–644. [Google Scholar] [CrossRef] [Green Version]
  77. Rebetez, M.; Mayer, H.; Dupont, O.; Schindler, D.; Gartner, K.; Kropp, J.P.; Menzel, A. Heat and drought 2003 in Europe A climate synthesis. Ann. For. Sci. 2006, 63, 569–577. [Google Scholar] [CrossRef] [Green Version]
  78. Ionita, M.; Tallaksen, L.M.; Kingston, D.G.; Stagge, J.H.; Laaha, G.; van Lanen, H.A.J.; Scholz, P.; Chelcea, S.M.; Haslinger, K. The European 2015 drought from a climatological perspective. Hydrol. Earth Syst. Sci. 2017, 21, 1397–1419. [Google Scholar] [CrossRef] [Green Version]
  79. Pretzsch, H.; Grams, T.; Häberle, K.H.; Pritsch, K.; Bauerle, T.; Rötzer, T. Growth and mortality of Norway spruce and European beech in monospecific and mixed-species stands under natural episodic and experimentally extended drought. Results of the KROOF throughfall exclusion experiment. Trees 2020. [Google Scholar] [CrossRef]
  80. Wardlow, B.D.; Anderson, M.C.; Verdin, J.P. Remote Sensing of Drought. Innovative Monitoring Approaches; CRC Press: Boca Raton, FL, USA, 2012; ISBN 1439835578. [Google Scholar]
  81. Fuchs, L.; Stevens, L.E.; Fulé, P.Z. Dendrochronological assessment of springs effects on ponderosa pine growth, Arizona, USA. For. Ecol. Manag. 2019, 435, 89–96. [Google Scholar] [CrossRef]
  82. Vicente-Serrano, S.M.; Beguería, S.; López-Moreno, J.I. A Multiscalar Drought Index Sensitive to Global Warming The Standardized Precipitation Evapotranspiration Index. J. Clim. 2009, 23, 1696–1718. [Google Scholar] [CrossRef] [Green Version]
  83. Winkler, S. Einführung in Die Pflanzenökologie, 2nd ed.; Fischer: Stuttgart, Germany, 1980; ISBN 3437202189. [Google Scholar]
  84. Potop, V.; Boroneanţ, C.; Možný, M.; Štěpánek, P.; Skalák, P. Observed spatiotemporal characteristics of drought on various time scales over the Czech Republic. Theor. Appl. Clim. 2014, 115, 563–581. [Google Scholar] [CrossRef]
  85. Assmann, E. The Principles of Forest Yield Study; Pergamon Press Oxford: Oxford, UK, 1970. [Google Scholar]
  86. Johann, K. DESER-Norm 1993. Normen der Sektion Ertragskunde im Deutschen Verband Forstlicher Forschungsanstalten zur Aufbereitung von waldwachstumskundlichen Dauerversuchen. In Deutscher Verband Forstlicher Forschungsanstalten Sektion Ertragskunde; Fundamentals of Tree-Ring Research: Tucson, AZ, USA, 1993; pp. 96–104. [Google Scholar]
  87. Thurm, E.A.; Uhl, E.; Pretzsch, H. Mixture reduces climate sensitivity of Douglas-fir stem growth. For. Ecol. Manag. 2016, 376, 205–220. [Google Scholar] [CrossRef]
  88. Lloret, F.; Keeling, E.G.; Sala, A. Components of tree resilience Effects of successive low-growth episodes in old ponderosa pine forests. Oikos 2011, 120, 1909–1920. [Google Scholar] [CrossRef]
  89. Crawley, M.J. The R Book, 2nd ed.; Wiley: Chichester, UK, 2013; ISBN 978-0-470-97392-9. [Google Scholar]
  90. Pinheiro, J.; Bates, D.; DebRoy, S.; Sarkar, D.; R Core Team. Nlme Linear and Nonlinear Mixed Effects Models. R Package Version 3.1-141. Available online: https://CRAN.R-project.org/package=nlme (accessed on 10 December 2018).
  91. Lenth, R.V. Least-Squares Means The R Package lsmeans. J. Stat. Soft. 2016, 69. [Google Scholar] [CrossRef] [Green Version]
  92. Akaike, H. Likelihood of a model and information criteria. J. Econom. 1981, 16, 3–14. [Google Scholar] [CrossRef]
  93. Barton, K. MuMIn Multi-Model Inference. R Package Version 1.43.6. Available online: https://CRAN.R-project.org/package=MuMIn (accessed on 10 December 2018).
  94. Speer, J.H. Fundamentals of Tree-Ring Research; University of Arizona Press: Tucson, AZ, USA, 2010; ISBN 0816526842. [Google Scholar]
  95. Mäkinen, H.; Isomäki, A. Thinning intensity and growth of Scots pine stands in Finland. For. Ecol. Manag. 2004, 201, 311–325. [Google Scholar] [CrossRef]
  96. Mäkinen, H.; Isomäki, A. Thinning intensity and long-term changes in increment and stem form of Scots pine trees. For. Ecol. Manag. 2004, 203, 21–34. [Google Scholar] [CrossRef]
  97. Nickel, M.; Klemmt, H.J.; Uhl, E.; Pretzsch, H. Der Kiefern Standraum und Durchforstungsversuch Weiden 611. AFZ-Der Wald 2007, 24, 1316–1319. [Google Scholar]
  98. Sánchez-Salguero, R.; Linares, J.C.; Camarero, J.J.; Madrigal-González, J.; Hevia, A.; Sánchez-Miranda, Á.; Ballesteros-Cánovas, J.A.; Alfaro-Sánchez, R.; García-Cervigón, A.I.; Bigler, C.; et al. Disentangling the effects of competition and climate on individual tree growth A retrospective and dynamic approach in Scots pine. For. Ecol. Manag. 2015, 358, 12–25. [Google Scholar] [CrossRef]
  99. Kerr, G. The effect of heavy or ‘free growth’ thinning on oak (Quercus petraea and Q. robur). Forestry 1996, 69, 303–317. [Google Scholar] [CrossRef] [Green Version]
  100. Štefančík, I. Growth characteristics of oak (Quercus petraea [Mattusch.] Liebl.) stand under different thinning regimes. J. For. Sci. 2012, 58, 67–78. [Google Scholar] [CrossRef] [Green Version]
  101. Gaines, E.M.; Kotok, E.S. Thinning Ponderosa Pine in the Southwest. Sta. Pap. 17; Department of Agriculture, Forest Service, Rocky Mountain Forest and Range Experiment Station: Fort Collins, CO, USA, 1954.
  102. Myers, C.A. Growing Stock Levels in Even-Aged Ponderosa Pine, Res. Pap. RM-33; Department of Agriculture, Forest Service, Rocky Mountain Forest and Range Experiment Station: Fort Collins, CO, USA, 1967.
  103. Barrett, J.W. Twenty-Year Growth of Ponderosa Pine Saplings Thinned to Five Spacings in Central Oregon, Res. Pap. PNW-RP-301; Department of Agriculture, Forest Service, Pacific Northwest Forest and Range Experiment Station: Portland, OR, USA, 1982.
  104. McDowell, N.; Brooks, J.R.; Fitzgerald, S.A.; Bond, B.J. Carbon isotope discrimination and growth response of old Pinus ponderosa trees to stand density reductions. Plant Cell Environ. 2003, 26, 631–644. [Google Scholar] [CrossRef]
  105. Skov, K.R.; Kolb, T.E.; Wallin, K.F. Tree Size and Drought Affect Ponderosa Pine Physiological Response to Thinning and Burning Treatments. For. Sci. 2004, 50, 81–91. [Google Scholar] [CrossRef]
  106. Miesel, J.R. Differential responses of Pinus ponderosa and Abies concolor foliar characteristics and diameter growth to thinning and prescribed fire treatments. For. Ecol. Manag. 2012, 284, 163–173. [Google Scholar] [CrossRef]
  107. Pretzsch, H. Forest Dynamics, Growth and Yield; Springer: Berlin/Heidelberg, Germany, 2009; ISBN 978-3-540-88306-7. [Google Scholar]
  108. Hara, T. Dynamics of size structure in plant populations. Trends Ecol. Evol. 1988, 3, 129–133. [Google Scholar] [CrossRef]
  109. Schwinning, S.; Weiner, J. Mechanisms determining the degree of size asymmetry in competition among plants. Oecologia 1998, 113, 447–455. [Google Scholar] [CrossRef]
  110. Pretzsch, H.; Biber, P. Size-symmetric versus size-asymmetric competition and growth partitioning among trees in forest stands along an ecological gradient in central Europe. Can. J. For. Res. 2010, 40, 370–384. [Google Scholar] [CrossRef]
  111. Pérez-de-Lis, G.; García-González, I.; Rozas, V.; Arévalo, J.R. Effects of thinning intensity on radial growth patterns and temperature sensitivity in Pinus canariensis afforestations on Tenerife Island, Spain. Ann. For. Sci. 2011, 68, 1093. [Google Scholar] [CrossRef] [Green Version]
  112. Martínez-Vilalta, J.; Cochard, H.; Mencuccini, M.; Sterck, F.; Herrero, A.; Korhonen, J.F.J.; Llorens, P.; Nikinmaa, E.; Nolè, A.; Poyatos, R.; et al. Hydraulic adjustment of Scots pine across Europe. New Phytol. 2009, 184, 353–364. [Google Scholar] [CrossRef] [PubMed]
  113. Metz, J.; Annighöfer, P.; Schall, P.; Zimmermann, J.; Kahl, T.; Schulze, E.-D.; Ammer, C. Site-adapted admixed tree species reduce drought susceptibility of mature European beech. Glob. Chang. Biol. 2016, 22, 903–920. [Google Scholar] [CrossRef] [PubMed]
  114. Zang, C.; Pretzsch, H.; Rothe, A. Size-dependent responses to summer drought in Scots pine, Norway spruce and common oak. Trees 2012, 26, 557–569. [Google Scholar] [CrossRef]
  115. McDowell, N.; Pockman, W.T.; Allen, C.D.; Breshears, D.D.; Cobb, N.; Kolb, T.; Plaut, J.; Sperry, J.; West, A.; Williams, D.G.; et al. Mechanisms of plant survival and mortality during drought: Why do some plants survive while others succumb to drought. New Phytol. 2008, 178, 719–739. [Google Scholar] [CrossRef] [PubMed]
  116. Voelker, S.L.; DeRose, R.J.; Bekker, M.F.; Sriladda, C.; Leksungnoen, N.; Kjelgren, R.K. Anisohydric water use behavior links growing season evaporative demand to ring-width increment in conifers from summer-dry environments. Trees 2018, 32, 735–749. [Google Scholar] [CrossRef]
  117. Hartmann, H. Will a 385 million year-struggle for light become a struggle for water and for carbon-How trees may cope with more frequent climate change-type drought events. Glob. Chang. Biol. 2011, 17, 642–655. [Google Scholar] [CrossRef]
  118. Whitehead, D.; Jarvis, P.G.; Waring, R.H. Stomatal conductance, transpiration, and resistance to water uptake in a Pinussylvestris spacing experiment. Can. J. For. Res. 1984, 14, 692–700. [Google Scholar] [CrossRef]
  119. Fajardo, A.; McIntire, E.J.B. Under strong niche overlap conspecifics do not compete but help each other to survive facilitation at the intraspecific level. J. Ecol. 2010. [Google Scholar] [CrossRef]
  120. McIntire, E.J.B.; Fajardo, A. Facilitation within species a possible origin of group-selected superorganisms. Am. Nat. 2011, 178, 88–97. [Google Scholar] [CrossRef]
  121. Owen, S.M. Tree Regeneration Following Large Wildfires in Southwestern Ponderosa Pine Forests, Dissertation; Northern Arizona University: Flagstaff, AZ, USA, 2019. [Google Scholar]
  122. Calama, R.; Conde, M.; de-Dios-García, J.; Madrigal, G.; Vázquez-Piqué, J.; Gordo, F.J.; Pardos, M. Linking climate, annual growth and competition in a Mediterranean forest Pinus pinea in the Spanish Northern Plateau. Agric. For. Meteorol. 2019, 264, 309–321. [Google Scholar] [CrossRef]
  123. Del Rio, M.; Schutze, G.; Pretzsch, H. Temporal variation of competition and facilitation in mixed species forests in Central Europe. Plant Biol. 2014, 16, 166–176. [Google Scholar] [CrossRef] [PubMed]
  124. Martínez-Vilalta, J.; López, B.C.; Loepfe, L.; Lloret, F. Stand- and tree-level determinants of the drought response of Scots pine radial growth. Oecologia 2012, 168, 877–888. [Google Scholar] [CrossRef] [PubMed]
  125. Pasho, E.; Camarero, J.J.; de Luis, M.; Vicente-Serrano, S.M. Impacts of drought at different time scales on forest growth across a wide climatic gradient in north-eastern Spain. Agric. For. Meteorol. 2011, 151, 1800–1811. [Google Scholar] [CrossRef]
  126. Serra-Maluquer, X.; Mencuccini, M.; Martínez-Vilalta, J. Changes in tree resistance, recovery and resilience across three successive extreme droughts in the northeast Iberian Peninsula. Oecologia 2018, 187, 343–354. [Google Scholar] [CrossRef]
  127. Gazol, A.; Camarero, J.J.; Anderegg, W.R.L.; Vicente-Serrano, S.M. Impacts of droughts on the growth resilience of Northern Hemisphere forests. Glob. Ecol. Biogeogr. 2017, 26, 166–176. [Google Scholar] [CrossRef]
  128. Anderegg, W.R.L.; Schwalm, C.; Biondi, F.; Camarero, J.J.; Koch, G.; Litvak, M.; Ogle, K.; Shaw, J.D.; Shevliakova, E.; Williams, A.P.; et al. FOREST ECOLOGY. Pervasive drought legacies in forest ecosystems and their implications for carbon cycle models. Science 2015, 349, 528–532. [Google Scholar] [CrossRef] [Green Version]
  129. Ciais, P.; Reichstein, M.; Viovy, N.; Granier, A.; Ogée, J.; Allard, V.; Aubinet, M.; Buchmann, N.; Bernhofer, C.; Carrara, A.; et al. Europe-wide reduction in primary productivity caused by the heat and drought in 2003. Nature 2005, 437, 529–533. [Google Scholar] [CrossRef]
Figure 1. (a) Overview of study regions (black triangles) in Arizona, USA (US) and Bavaria, Germany (DE). (b) Detailed location (black triangles) of ponderosa pine study sites in Arizona (US 1–US 3). (c) Detailed location (black triangles) of sessile oak (DE 1–DE 3) and Scots pine study sites (DE 4–DE 6) in Bavaria.
Forests 11 00627 g001
Figure 2. Estimated least-squares means of mean tree basal area increment ( M e a n , cm2 yr−1) and mean coefficient of variation ( C V ,   % ), representing mean tree growth sensitivity, according to Equation (7) (Table A3) for Scots pine, sessile oak and ponderosa pine growing under different stand density levels (low, moderate, maximum) based on 409 trees (Scots pine: 139; sessile oak: 135, ponderosa pine: 135). M e a n was calculated on raw b a i series, while C V was calculated on detrended b a i index series. Significant differences between the means ( p < 0.05) are indicated by lower case letters.
Forests 11 00627 g002
Figure 3. Effect of site water availability ( I A ) on the drought responses of Scots pine ( R t (a), R c (d), R s   ( g ) ), sessile oak ( R t (b), R c (e), R s (h)) and ponderosa pine ( R t (c), R c (f), R s (i)) under different stand density levels (low, moderate, maximum). Lines represent the fixed effect terms from Equation (8). Explanatory variables other than I A were set at the respective means of each stand density level as obtained from the data.
Forests 11 00627 g003
Table 1. Site and stand characteristics for all nine locations studied in Bavaria, Germany (DE 1–DE 6) and Arizona, USA (US 1–US 3). A g e : stand age. E : elevation. T : mean annual temperature. P : mean annual precipitation total. I A : Global Aridity Index. P M : parent material (geology). Reference period for climatic variables: 1978–2017.
SiteIDCountrySpeciesAgeETPIAPM
yrsm a.s.l°Cmm
DE 1GEI 649Germanysessile oak344958.37671.26sand, loess
DE 2ROB 620Germanysessile oak914408.110211.70sand
DE 3ROB 90Germanysessile oak1534708.39811.62sand
DE 4BOD 610GermanyScots pine654008.57221.17sand
DE 5GEI 335GermanyScots pine683808.97561.20sand
DE 6WEI 611GermanyScots pine474108.37141.16sand
US 1FV U1USAponderosa pine10522507.15751.07basalt
US 2FV U2USAponderosa pine10022807.16121.14basalt
US 3LVUSAponderosa pine10020799.07281.24basalt
Table 2. Mean values and standard deviation ( s d ) of species-specific resistance ( R t ), recovery ( R c ), and resilience ( R s ) indices. Means are calculated for each species over selected site-specific drought events based on standardized basal area increment indices. n = number of observations.
SpeciesnStatisticRtRcRs
Scots pine229Mean0.821.341.07
sd0.160.340.27
sessile oak225Mean0.991.041.02
sd0.200.280.32
ponderosa pine359Mean0.891.411.10
sd0.370.680.35
Table 3. Results of the linear mixed-effects model regressions from Equation (8). We test the effect of tree basal area ( b a , cm2), mean relative stand basal area ( M R B A ), Global Aridity Index ( I A ), stand age ( A g e ,   y r s ) and corresponding interactions with M R B A ( M R B A * I A , M R B A * A g e ) on the studied species-specific tree drought responses ( R t , R c , R s ). The number of observations was always n = 229 for Scots pine, n = 225 for sessile oak and n = 359 for ponderosa pine. Bold values are significant at level p < 0.001 (***), p < 0.01 (**), p < 0.05 (*), p < 0.1 (.).
SpeciesResponse VariableStatisticInterceptbaMRBAIAAgeMRBA * IAMRBA * Age
a0a1a2a3a4a5a6
Scots pineRt—ResistanceEstimate5.47 ***--−4.34 **0.01 **--
SE1.44 1.330.00
Rc—Recovery Estimate16.09 ***-−15.29 **−12.42 ***-12.85 *-
SE4.29 5.863.62 4.95
Rs—Resilience Estimate12.31 ***-−9.92 *−9.45 **-8.30 *-
SE3.39 4.622.86 3.91
sessile oakRt—ResistanceEstimate0.74 ***--0.16 .---
SE0.13 0.08
Rc—Recovery Estimate3.41 ***-−1.29 *−1.38 ***−0.00 ***0.82 *-
SE0.45 0.600.300.000.39
Rs—Resilience Estimate2.33 ***--−0.82 ***---
SE0.19 0.12
ponderosa pineRt—ResistanceEstimate0.71 ***-0.30 ***----
SE0.04 0.07
Rc—Recovery Estimate4.76 ***-−4.32 *−2.72 *-3.45 *-
SE1.37 2.011.18 1.73
Rs—Resilience Estimate0.97 ***-0.20 **----
SE0.04 0.06

