Article

Effect of Invasive Rhododendron ponticum L. on Natural Regeneration and Structure of Fagus orientalis Lipsky Forests in the Black Sea Region

1
Faculty of Forestry and Wood Sciences, Czech University of Life Sciences Prague, Kamýcká 129, 16500 Prague, Czech Republic
2
Forestry Faculty, Konuralp Campus, Düzce University, 81620 Düzce, Turkey
*
Author to whom correspondence should be addressed.
Forests 2020, 11(5), 603; https://doi.org/10.3390/f11050603
Submission received: 27 April 2020 / Revised: 18 May 2020 / Accepted: 21 May 2020 / Published: 25 May 2020
(This article belongs to the Special Issue Control and Management of Invasive Species in Forest Ecosystems)

Abstract

:
Biological invasions threaten global biodiversity and forest ecosystems; therefore, it is necessary to use appropriate strategies for combating the spread of invasive species. Natural regeneration of eastern beech (Fagus orientalis Lipsky) is considerably limited by an aggressive invasive shrub, pontic rhododendron (Rhododendron ponticum L.), in the Black Sea Region of Turkey. Therefore, the future character of the region’s forests is uncertain. The aim of this research was to evaluate the structure of beech forests with different management regimes of rhododedron and to determine the interaction among tree layer, rhododendron cover, and natural regeneration in Düzce Province using the FieldMap technology. The following variants of forests were compared: without intervention (control) and three and six years after rhododendron clearance. The results showed that tree density ranged between 175–381 trees ha−1 and stand volume between 331–589 m3 ha−1. The horizontal structure of the tree layer was mostly random, and the spatial pattern of natural regeneration was aggregated. Recruit density and height in the beech stands were significantly differentiated due to the influence of presence or absence of invasive rhododendron. Rhododendron cover ranged between 81%–97%, and woody stems amounted to 72,178–86,884 ha−1 in unmanaged forests. Canopy in the overstory did not have a significant effect on the density of regeneration and rhododendron cover. Tree layer had a significant negative influence on natural regeneration within a 4 m radius on the plots without rhododendron. However, on the plots with dense rhododendron cover, tree layer had a positive influence on regeneration within a 1.5 m radius. Natural regeneration density was significantly higher when rhododendron was cleared than the plots without intervention. On the plots without woody clearance, there was an insufficient regeneration (113–619 recruits ha−1); however, they had higher mean height compared to the sites without rhododendron. After three and six years of rhododendron clearance, the numbers of recruits in natural regeneration were 63,981 ha−1 and 105,075 ha−1, respectively. In conclusion, invasive spread of rhododendron was a limiting factor of the prosperous regeneration and tree species diversity, and manual clearance of rhododendron is recommended in managed beech forests of the study region.

1. Introduction

In the past, management of forests in Turkey was aimed at maximizing timber production regardless of sustainability of the multiple forest functions. However, forest stands did not receive any silvicultural treatment, all standing trees are above their economic rotation age, and almost half of the Turkish forests are considered to be degraded in terms of wood production [1]. The majority of the species-rich and productive forests are dominated by eastern beech (Fagus orientalis Lipsky) and mainly located in the mesic parts of the Black Sea Region [2]. Eastern beech accounts for 24% of the forested area and 28% of the total stand volume in the region [3,4]. Topographic heterogeneity and a humid, temperate, oceanic climate, with some forests having highly diversified structure and texture, are the main characteristics of this region [3,5,6].
Historical documents and the Ottoman archives indicate that most of the beech forests in this region are remnants of once species-rich forests [7]. The long-lasting anthropogenic pressure of various civilizations on forests and management systems aiming at even-aged forests in the Black Sea Region has led to the pronounced dominancy of beech or to the creation of monospecific beech stands [4,7,8]. Extensive fires in the 18th and 19th century also largely supported the creation of beech forests [9,10,11]. Close-to-nature management system with maximum preference of natural regeneration is now considered to have gradually replaced the traditional shelterwood system in today’s beech forests, similarly to Europe [4,12,13,14,15]. In near-natural beech forests, natural regeneration appears abundantly in small- or medium-sized canopy gaps created as a result of dieback or disturbance of single trees or their groups in mature stands [16,17,18,19].
The knowledge of gap size in the canopy closure of mature beech stands is important to understand the natural regeneration process [20,21]. For instance, Sefidi et al. [17] stated that the majority of stand gaps (41%) were formed due to individual tree-falls in natural stands of eastern beech and nearly 60% of such gaps were smaller than 200 m2 in size. Availability of light, temperature, moisture, and nutrients for tree species growing in recently formed gaps is determined by the size and position of gaps [4,22,23] and microsite conditions [19,24]. Site conditions, parent stand structure, and parameters of the gap and its dynamics substantially influence species composition, quantity, and prosperity of natural regeneration [18,19,23,25,26]. On the other site, the opening of gaps in the tree and shrub canopy provokes the loss of nemoral conditions and limits the development of several characteristic deciduous forest taxa that are most vulnerable to increased evapotranspiration [27]. The knowledge of the structure and development of forest stands provides important information for their sustainable management in the times of global climate changes [12,13,15,28,29,30,31,32,33]. Moreover, forest ecosystems are highly vulnerable to climate change (warming, prolonged droughts, climatic anomalies, and occurrence of fires) in temperate and Mediterranean zones and could suffer a decline in their habitat suitability if ongoing observed climate trends continue in the future [34,35]. Climate factors are the main driver of forest growth [36,37,38,39,40,41], such as in eastern beech [42,43,44].
Large areas of semi-natural eastern beech forests have been converted to young poor stands mostly through natural regeneration [4,45]. Artificial regeneration can be also used for supplementary planting [46] and for introduction of economically valuable tree species, e.g., wild cherry (Prunus avium L.), sweet chestnut (Castanea sativa Mill.), wild service tree (Sorbus torminalis L.), and other valuable broadleaves to increase biodiversity [47,48,49,50]. Moreover, naturally growing species such as sweet chestnut, maple (Acer spp.), wild cherry, ash (Fraxinus spp.), mountain ash (Sorbus spp.), elm (Ulmus spp.), linden (Tilia spp.), and goat-willow (Salix spp.) are included in the natural mixture of the beech forests of the Black Sea Region [8,50].
There is a frequent occurrence of pontic rhododedron (Rhododendron ponticum L.), an aggressive invasive shrubby species, in the understory of eastern beech forests. It occurs mainly on acidic soils in moist mountain areas up to the altitude of 2000 m a.s.l. in the Black Sea Region of Turkey [7,15]. This invasive shrub substantially eliminates the occurrence of natural regeneration of other species, subsequent growth of recruits, and stand diversity, causing site and production losses in the forest sector [7,15,51]. This shrub grows up to 8 m in height, bearing a developed lignotuber from which many axes or branches arise [52]. This shrub is aggressively invasive and can spread from seed and vegetative propagation. The future of the region’s forests is heavily threatened through invasion of this species [4,7,15,53]. Moreover, current distribution ranges of invasive pontic rhododendron can be modified in the future by ongoing global climate change [54], which may lead to its expansion into new areas [55].
Decisions on the methods of differentiated management of forests on ecological principles are complicated to ensure their ecological stability and biodiversity [28,56]. Models can be applied for support of a decision-making and planning process that helps finding the optimum solution to forest management [57]. Forest management and silviculture treatments (including thinning, promoting optimal growing conditions, reducing hosts, soil preparation, and consistent monitoring) then play the main role to control invasive alien species [58,59] and protect, in our case, threatened beech forests from aggressive invasive pontic rhododendron [60]. However, optimal management strategies should always be based on in-depth investigation and evaluation of species-specific site and stand conditions, especially stand structure and development of the natural and near-natural forests [61]. Our study can contribute to the solution of this serious problem.
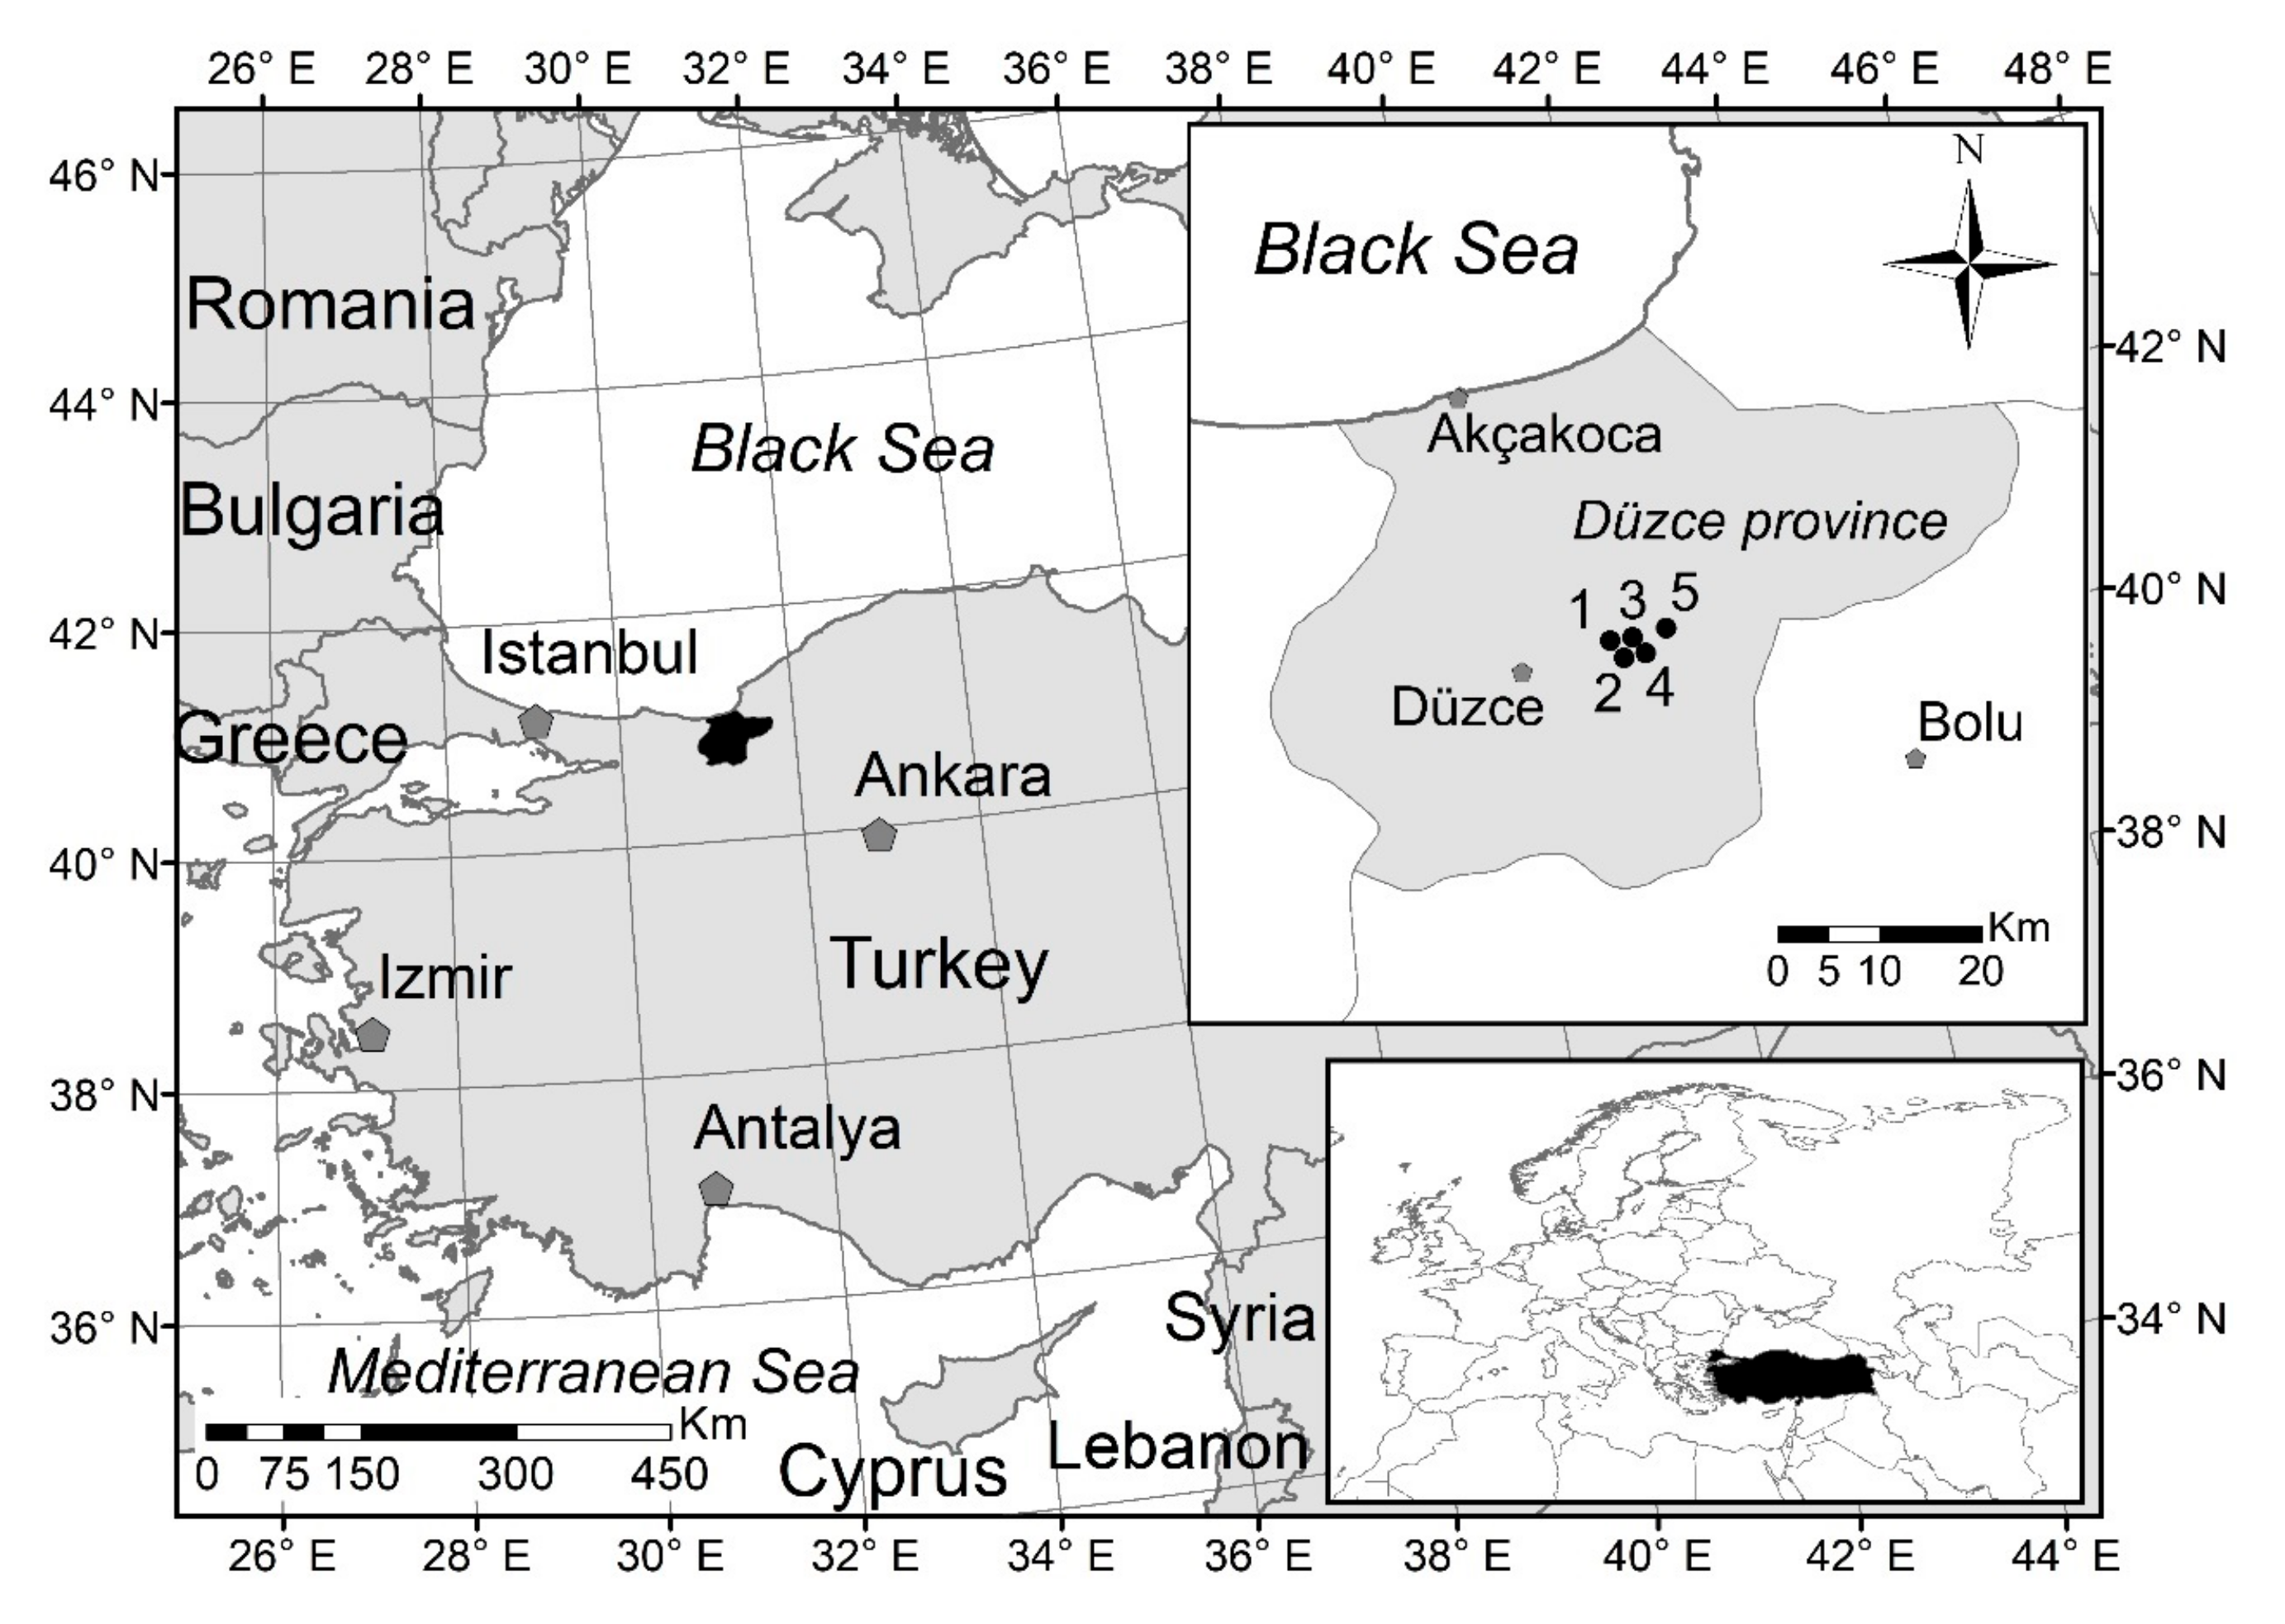
A general objective of our study was to evaluate effect of invasive pontic rhododendron on the structure of eastern beech stands in the north-west of Turkey in the Black Sea Region, with an emphasis on natural regeneration. Specific objectives were (1) to evaluate the parameters describing production, growth, diversity and structures of eastern beech stands, (2) to quantify and evaluate the effects of invasive pontic rhododendron and tree layer on the prosperity of natural regeneration in commercial and noncommercial forests, (3) to assess the effects of stand structure on the occurrence and expansion of pontic rhododendron, and (4) to quantify and evaluate the interactions among rhododendron, natural regeneration, stand production, and structural diversity.

2. Materials and Methods

2.1. Study Area

This study was conducted in the close-to-natural forest stands with dominant eastern beech in the Province of Düzce in the Black Sea Region (BSR) of Turkey. Five permanent research plots (PRP) were established in the mountain regions 14 km northeast of Düzce in 2016. Three PRP (1, 2, and 5) with historical minimal harvesting operations were situated in the stands with different tree canopy closure in the overstory and dense rhododendron presence in the understory. On PRP 3 and 4, rhododendron was removed manually by grabbing the roots three and six years ago, respectively, and left to decompose in soil. Moderate thinning of the tree layer was carried out on these two PRPs during rhododendron clearance. The proportion of stand volume logging were 8% (35 m3 ha−1) on PRP 3 and 12% (65 m3 ha−1) on PRP 4. The PRP were located in similar sites in close proximity to each other so that they were comparable (Figure 1, Table 1).
The study area falls in the jurisdiction of the Düzce Forest Management Directorate of Bolu Regional Forest Directorate in the western BSR, which is in the Euro-Siberian Floristic Region [62]. The territory of study area belongs to temperate oceanic climate characterized by a warm dry summer and cool dry winter with a relatively narrow annual temperature range [5]. The mean annual temperature in the area is 13.4 °C and mean temperature of the coldest and warmest months reaches 3.8 °C (January) and 22.6 °C (July), respectively. Amount of annual precipitation ranges around 820 mm with maximum in December (100 mm), mainly in the form of snow. The number of rainy days is 135 (Turkish State Meteorological Service). Soil texture ranges from clay and clay loam to loamy clay. The forest floor surface is 3–5 cm deep. The A-horizon is 10 cm deep, underlain by B-horizon of 40–60 cm in thickness. Stoniness is medium, ranging from 10% to 30% by volume. Soil profile depth is 110 cm, though rooting depth may go deeper between rocks. Soils in this region of Turkey have been placed in the Inceptisols order, under the Umbrepts suborder, and are classified as Typic Haplumbrepts according to the USDA soil taxonomy [62].

2.2. Data Collection

The Field-Map technology [63], which is a hardware tool, was used for establishment of five PRP of 40 × 40 m in size (0.16 ha). This hardware tool helped to determine the tree layer structure on each PRP and located the position of all individuals with breast height diameter (DBH; at 1.3 m above ground) >4 cm. The crown projection area of each individual, minimally at four directions perpendicular to each other, were determined. The crown measurements were used to determine the spatial pattern and canopy cover. Diameter, height, and height to live crown base were also measured for each tree layer. Diameters of the tree layer were measured with a Blue Mantax metal calliper (Haglöf, Sweden) to the nearest 1 mm, and heights were measured with a Vertex laser hypsometer (Haglöf, Sweden) to the nearest 0.1 m.
On each PRP, the position, height, and crown width were measured for recruits with height ≥100 cm and DBH <4 cm. Natural regeneration (recruit) from one year of age (DBH <4 cm) was measured on four nested subplots of 10 × 10 m in size within each PRP (Figure 2). The position, height, and crown width were recorded for each recruit. The crown width of recruit was measured using a height-measuring pole to the nearest 1 cm.
Basic dendrometric characteristics of pontic rhododendron estimated on each subplot includes cover percentage, stem number, basal stem diameter, and height of individuals. In the total coverage percentage of the rhododendron, each plot was divided into the 100 grids (4 × 4 m grids) by Field-Map technology where cover percentage was subjectively determined for each grid (accuracy 5%). The number of all stems and basal diameter of stems at 10 cm above ground were measured by a metal caliper (accuracy 1 mm), while height was determined by height-measuring pole (accuracy 5 cm) on two subplots, which were selected randomly using the random numbers generated (RNG) in MS Excel.

2.3. Data Analysis

Structural and growth parameters, horizontal and vertical structure, production potential of sites, and biodiversity were evaluated on each PRP. The stem volume of eastern beech trees was calculated using the previously developed tree volume equations [64] and that of the hornbeam and oak trees using tree volume equations developed by Petráš and Pajtík [65]. A list of equations used for tree stem volume calculations is given in the Supplementary Files. The curves of height–diameter relationship were constructed using the Näslund function [66]. The fitting performance of the height–diameter model was evaluated using the coefficient of determination (R2). Variances in stand parameters were indicated by standard error of the mean (SE).
In order to determine the spatial distribution pattern of the individuals on each PRP, Pielou-Mountford index [67,68], Clark-Evans index [69], and Ripley’s L-function [70] were computed. David-Moore index [71] was used to determine the distribution indices based on tree frequency in particular quadrats. A list of formulae used for determining the spatial distribution patterns is given in the Supplementary Files. The quadrat size of 10 × 10 m was chosen in the overstory and 2 × 2 m in regeneration. The PointPro 2.2 programme (© 2020 Zahradnik) was used for computation of characteristics describing the horizontal distribution of individuals across the research plot. A statistical test on the deviations from the values expected for the random point patterns was performed using the Monte Carlo simulation [72]. For each investigated research plot, 1999 simulations of the Poisson process with the same stand density were performed (α = 0.05, k = 100). The corresponding expected values of these indices were computed by means of numerical simulations for each particular case separately. The confidence limits were estimated using 95% confidence interval.
Evaluation of biodiversity of each research plot involved the computation of a number of indices, such as species richness index [73], species diversity index [74], species evenness index [75], diameter differentiation index and height differentiation index [76], crown differentiation index [77], Arten-profile index [78], and total diversity index [77]. A complete list of formulae used for calculation of biodiversity indices is given in the Supplementary Files. Table 2 shows the criteria of structural indices.
The relationship between tree layer and natural regeneration was calculated by the pair correlation function using the R 3.4. software (© 2020 The R Foundation). Stand density index (SDI; [79]—Equation (15)), crown closure (CC; [80]—Equation (16)), and crown projection areas (CPA; sum of measured crown projection per hectare) were also determined for analysis of the horizontal structure on each PRP. Situational maps were created in the ArcGIS programme (© 2020–2010 Esri).
All statistical analyses were carried out using the Statistica 13.5 software (© 2020–2019 StatSoft). Data were log transformed to acquire normal distribution, which was tested using the Kolmogorov–Smirnov test. One-way analysis of variance (ANOVA) and post-hoc Tukey’s HSD tests were used to evaluate the research plot-level differences. In addition, relationships among natural regeneration, tree layer, and rhododendron cover were evaluated using the Pearson correlation coefficients. Unconstrained principal component analysis (PCA) in CANOCO for the Windows 4.5 programme [81] was used to analyze the relationships between invasive rhododendron, stand and natural regeneration parameters, and structural diversity. Data were log-transformed, centered, and standardized in this analysis. The results from the PCA were visualized in the form of an ordination diagram.

3. Results

3.1. Growth Parameters and Stand Structure

The number of trees ranged between 175–381 trees ha−1 on PRP 1–5. Eastern beech accounted for 98–100% of the whole stand with the remaining made up by European hornbeam (Carpinus betulus L.) and sessile oak (Quercus petraea Matt.). Stand density index differed between 0.48–0.75 and CPA in the range of 1.90–4.42 ha. Mean stand volume was 427 m3 ha−1 (± 43 SE) with minimum on PRP 2 (331 m3 ha−1) and maximum on PRP 1 (589 m3 ha−1). Periodic annual increment of the stand ranged between 4.8 and 7.5 m3 ha−1 y−1, and mean annual increment varied between 3.3–5.9 m3 ha−1 y−1. Average stand basal area was 33.8 m2 ha−1 (± 3.2 SE; Table 3).
Frequency distribution of diameters on the tree layer and the relationship between DBH and height smoothed by the Näslund function are shown in Figure 3. This function described a large part of the height–diameter relationship on each PRP (R2 = 0.86–0.94). Diameter distribution shows a typical two-tree layer structure with the main amplitude in DBH class 32–36 cm (max. on PRP 5—63 trees ha−1). Based on the height curves, it is significant that the highest trees were located on the PRP 5 lying in a small valley.

3.2. Tree Layer Biodiversity

All biodiversity indices and species richness for each research plot are presented in Table 4. Species richness showed low diversity (D = 0.053–0.168). Species heterogeneity and evenness reached minimum values (H′ = 0.000–0.045, E = 0.000–0.149). The vertical structure according to the A index was medium to strongly diversified (A = 0.414–0.627). Diameter differentiation of the structure was medium (TMd = 0.305–0.452). Height differentiation was mostly low (TMh = 0.203–0.277), only on PRP 5 it was medium (TMh = 0.305). The crown differentiation reached mean values (K = 1.574–1.951). Total diversity for all PRPs indicates an even structure (B = 5.113–5.810). Stands with rhododendron clearance and moderate thinning of tree layer (PRP 3 and 4) had smaller crown differentiation and total diversity compared to other PRP, but there was no difference in other indicators.
The spatial patterns of tree layer, dead wood, and natural regeneration for each PRP are presented in Figure 2. Based on the computed structural indices, horizontal structure of the tree layer was indistinctly aggregated or moderately regular, while random distribution prevailed (Table 4). Research plot 3 was an exception, where the spatial pattern according to R and ICS indices was significantly aggregated (p < 0.05), respectively random according to α index. The L-function showed mostly a random distribution, and it was aggregated within 2 m on PRP 3. It was also aggregated within 1 m on PRP 4, and there was a regular pattern at spacing of 4.5–6 m on PRP 1.

3.3. Characteristics of Rhododendron ponticum Understory

Basic dendrometric characteristics of Rhododendron ponticum on PRP 1–5 are shown in Table 5. The rhododendron undergrowth on PRP 1, 2, and 5 (without intervention) was very vigorous with 81–97% cover percentage, a large number of monopodial woody stems amounting to 72,178–86,884 ha−1, basal stem diameter of 4–82 mm, and varying mean height of individuals (141–224 cm). The coverage of rhododendrons on PRP 4 was 3% because its clearing was done 6 years ago, and no rhododendrons occur on PRP 3 due to clearing carried out 3 years ago. In terms of basal stem diameter structure, the first four diameter classes below 2.5 cm accounted for more than half (59.4%) of the total share of the stem number (Figure 4). In the left-shaped distribution of stem diameters, the largest representation of stems was in diameter class of 1.5–2 cm (13,800 stem ha−1). The share of rhododendrons with basal stem diameter >65 mm was only 0.4%.

3.4. Natural Regeneration

The number of recruits per hectare (natural regeneration) varied from 113 (PRP 1) to 105,075 (PRP 4); on the average eastern beech accounted for 97.0%, European hornbeam for 2.9%, and silver lime (Tilia tomentosa Moench.) for 0.1% (Table 6). The cover percentage of rhododendron had a significant effect on the abundance of natural regeneration (F1, 18 = 57.8, p < 0.001). The highest number of recruits occurred on the research plots with the zero or minimum cover percentage of rhododendron where this shrub was removed by clearing. Three years after clearing the recruit density on subplots of PRP 3 was 29,900–78,600 recruits ha−1, and six years after clearing there were as many as 55,800‒159,500 recruits ha−1 on subplots of PRP 4. A cover percentage of rhododendron abundance of natural regeneration on subplots of PRP 1, 2, and 5 was minimal i.e., 81–97% (100‒1300 recruits ha−1).
Figure 5 shows a histogram of the height frequencies of natural regeneration of tree species on PRP 1–5. In case of PRP 3 (three years after rhododendron clearance), left-sided height distribution was observed with an exponential decline from a significant proportion of the first (h ≤ 20 cm) height class (12,088 recruits ha−1). After 6 years of rhododendron clearance (PRP 4), the most represented height class shifted to the right (40–60 cm; 10,100 recruits ha−1) because of dynamics. On other PRP (without rhododendron clearance), no height class reached the limit of 100 recruits ha−1. On PRP 1 and 5, the height class distribution was uneven, in contrast to PRP 2 it was relatively balanced. The mean height of recruits was significantly taller (F(4, 7468) = 524.5, p < 0.001) on PRP 5 (221.5 cm ± 8.5 SE) and PRP 1 (196.7 cm ± 9.0 SE) than on PRP 2 (87.2 ± 5.0 SE) and PRP 4 (43.3 ± 0.4 SE); the smallest height was found on PRP 3 (23.2 ± 0.4 SE).
From a biodiversity perspective (Table 7), the spatial pattern of natural regeneration was significantly aggregated on all research plots (α = 1.986–21.053, R = 0.235–0.735, and ICS = 1.624–49.975) with the highest tendency of aggregation on PRP 3. PRP 5 is an exception where horizontal structure of recruits was insignificantly aggregated and/or random (according to α and ICS indices) due to their low number in distribution. It is also reported in the results obtained from the L-function (Figure 6). Species richness, with monospecific or dominancy of eastern beech, evaluated by the D index of the relative measure of species diversity was zero on PRP 1, 2, and 5 and very low on PRP 3 and 4. It was the same in entropy H′ and species evenness indices. The vertical diversity was low on PRP 4 (A = 0.273) and medium on the other PRP (A = 0.362–0.487). The lowest values of TMh index, which describes the height differentiation, were obtained for PRP 4 (0.287) while the highest values were found on PRP 3 (0.651).
Figure 7 illustrates relationships of the spatial pattern of recruits and the overstory on PRP 2 and 4 by means of the pair correlation function. These two plots were chosen where the highest number of recruits >1 m in height occurred and that represented both treatments: PRP 2—81% cover percentage of rhododendron (without intervention) and PRP 4—clearing the rhododendron. This figure indicates that the tree layer had a significantly positive influence (α = 0.05) on the spatial pattern of natural regeneration to a distance of 1.5 m on plots with the high cover percentage of rhododendron (PRP 2) where its vegetative reproduction (layering) was dominant. On the contrary, on plots where rhododendrons were removed, the tree layer had a negative influence on natural regeneration within 4 m (PRP 4).

3.5. Relationships between Rhododendron, Tree Layer, and Natural Regeneration

Results of the PCA are presented in the form of an ordination diagram in Figure 8 and correlation matrix in Table 8. The first ordination axis explained 37.9% variability, the first two axes together explained 65.5% variability, and the first four axes together explained 86.2% variability in the data. The first x-axis represented stand stocking (SDI) and canopy (crown closure and crown projection area) with height differentiation. The second y-axis represented total diversity index and mean height of natural regeneration with the number of recruits. Stand volume was significantly positively correlated with basal area (r = 0.97; p < 0.001) and mean stand height with DBH (r = 0.82; p < 0.001). Crown closure, SDI, and crown projection area increased with age, while these parameters were negatively correlated with height and diameter differentiation. The number of trees was significantly positively correlated with Arten-profile index (r = 0.52; p < 0.05) and total diversity index (r = 0.61; p < 0.01), while tree density was significantly negatively correlated with diameter differentiation (r = −0.58; p < 0.01). Total diversity also significantly decreased with increasing mean stand height (r = 0.63; p < 0.01) and DBH (r = 0.70; p < 0.001). Mean height of natural regeneration (recruits) was significantly positively correlated with the cover percentage of rhododendron (r = 0.67; p < 0.001), while these parameters were significantly negatively correlated with the density of natural regeneration (height: r = −0.52; p < 0.05; rhododendron: r = −0.84; p < 0.001). All these parameters were found independent (p > 0.05) of canopy (crown projection area, crown closure). Moreover, density of natural regeneration was significantly positively correlated with DBH (r = 0.57; p < 0.05) and significantly negatively with number of trees (r = −0.52; p < 0.05). Contribution of the mean stand age to explanation off variability in the data was relatively small. The difference within PRP was remarkable, especially for PRP 2, as marks of each record were relatively distant from each other, whereas marks for PRP 1 were fairly close to each other in the diagram. Research plots were significantly different from each other, as PRP 3 and 4 (with rhododendron cleared) with high density of natural regeneration occupied the upper part of the diagram, while higher stand density, rhododendron cover, vertical diversity, and mean height of natural regeneration were typical for PRP 1, 2, and 5 (lower part).

4. Discussion

Eastern beech forest is one of the most important forest communities in the Black Sea Region [82] and Turkey, where it occupies 1.7 million hectares [14]. However, dynamics and structure of these valuable forest ecosystems are, in the long-term, significantly negatively affected by aggressive invasive pontic rhododendron [83,84]. A low species diversity was characteristic for the studied eastern beech stands in the BSR of Turkey in terms of species richness, heterogeneity, and evenness. Poor diversity is caused by strong competition of dense rhododendron cover and inappropriate management in its removal [85,
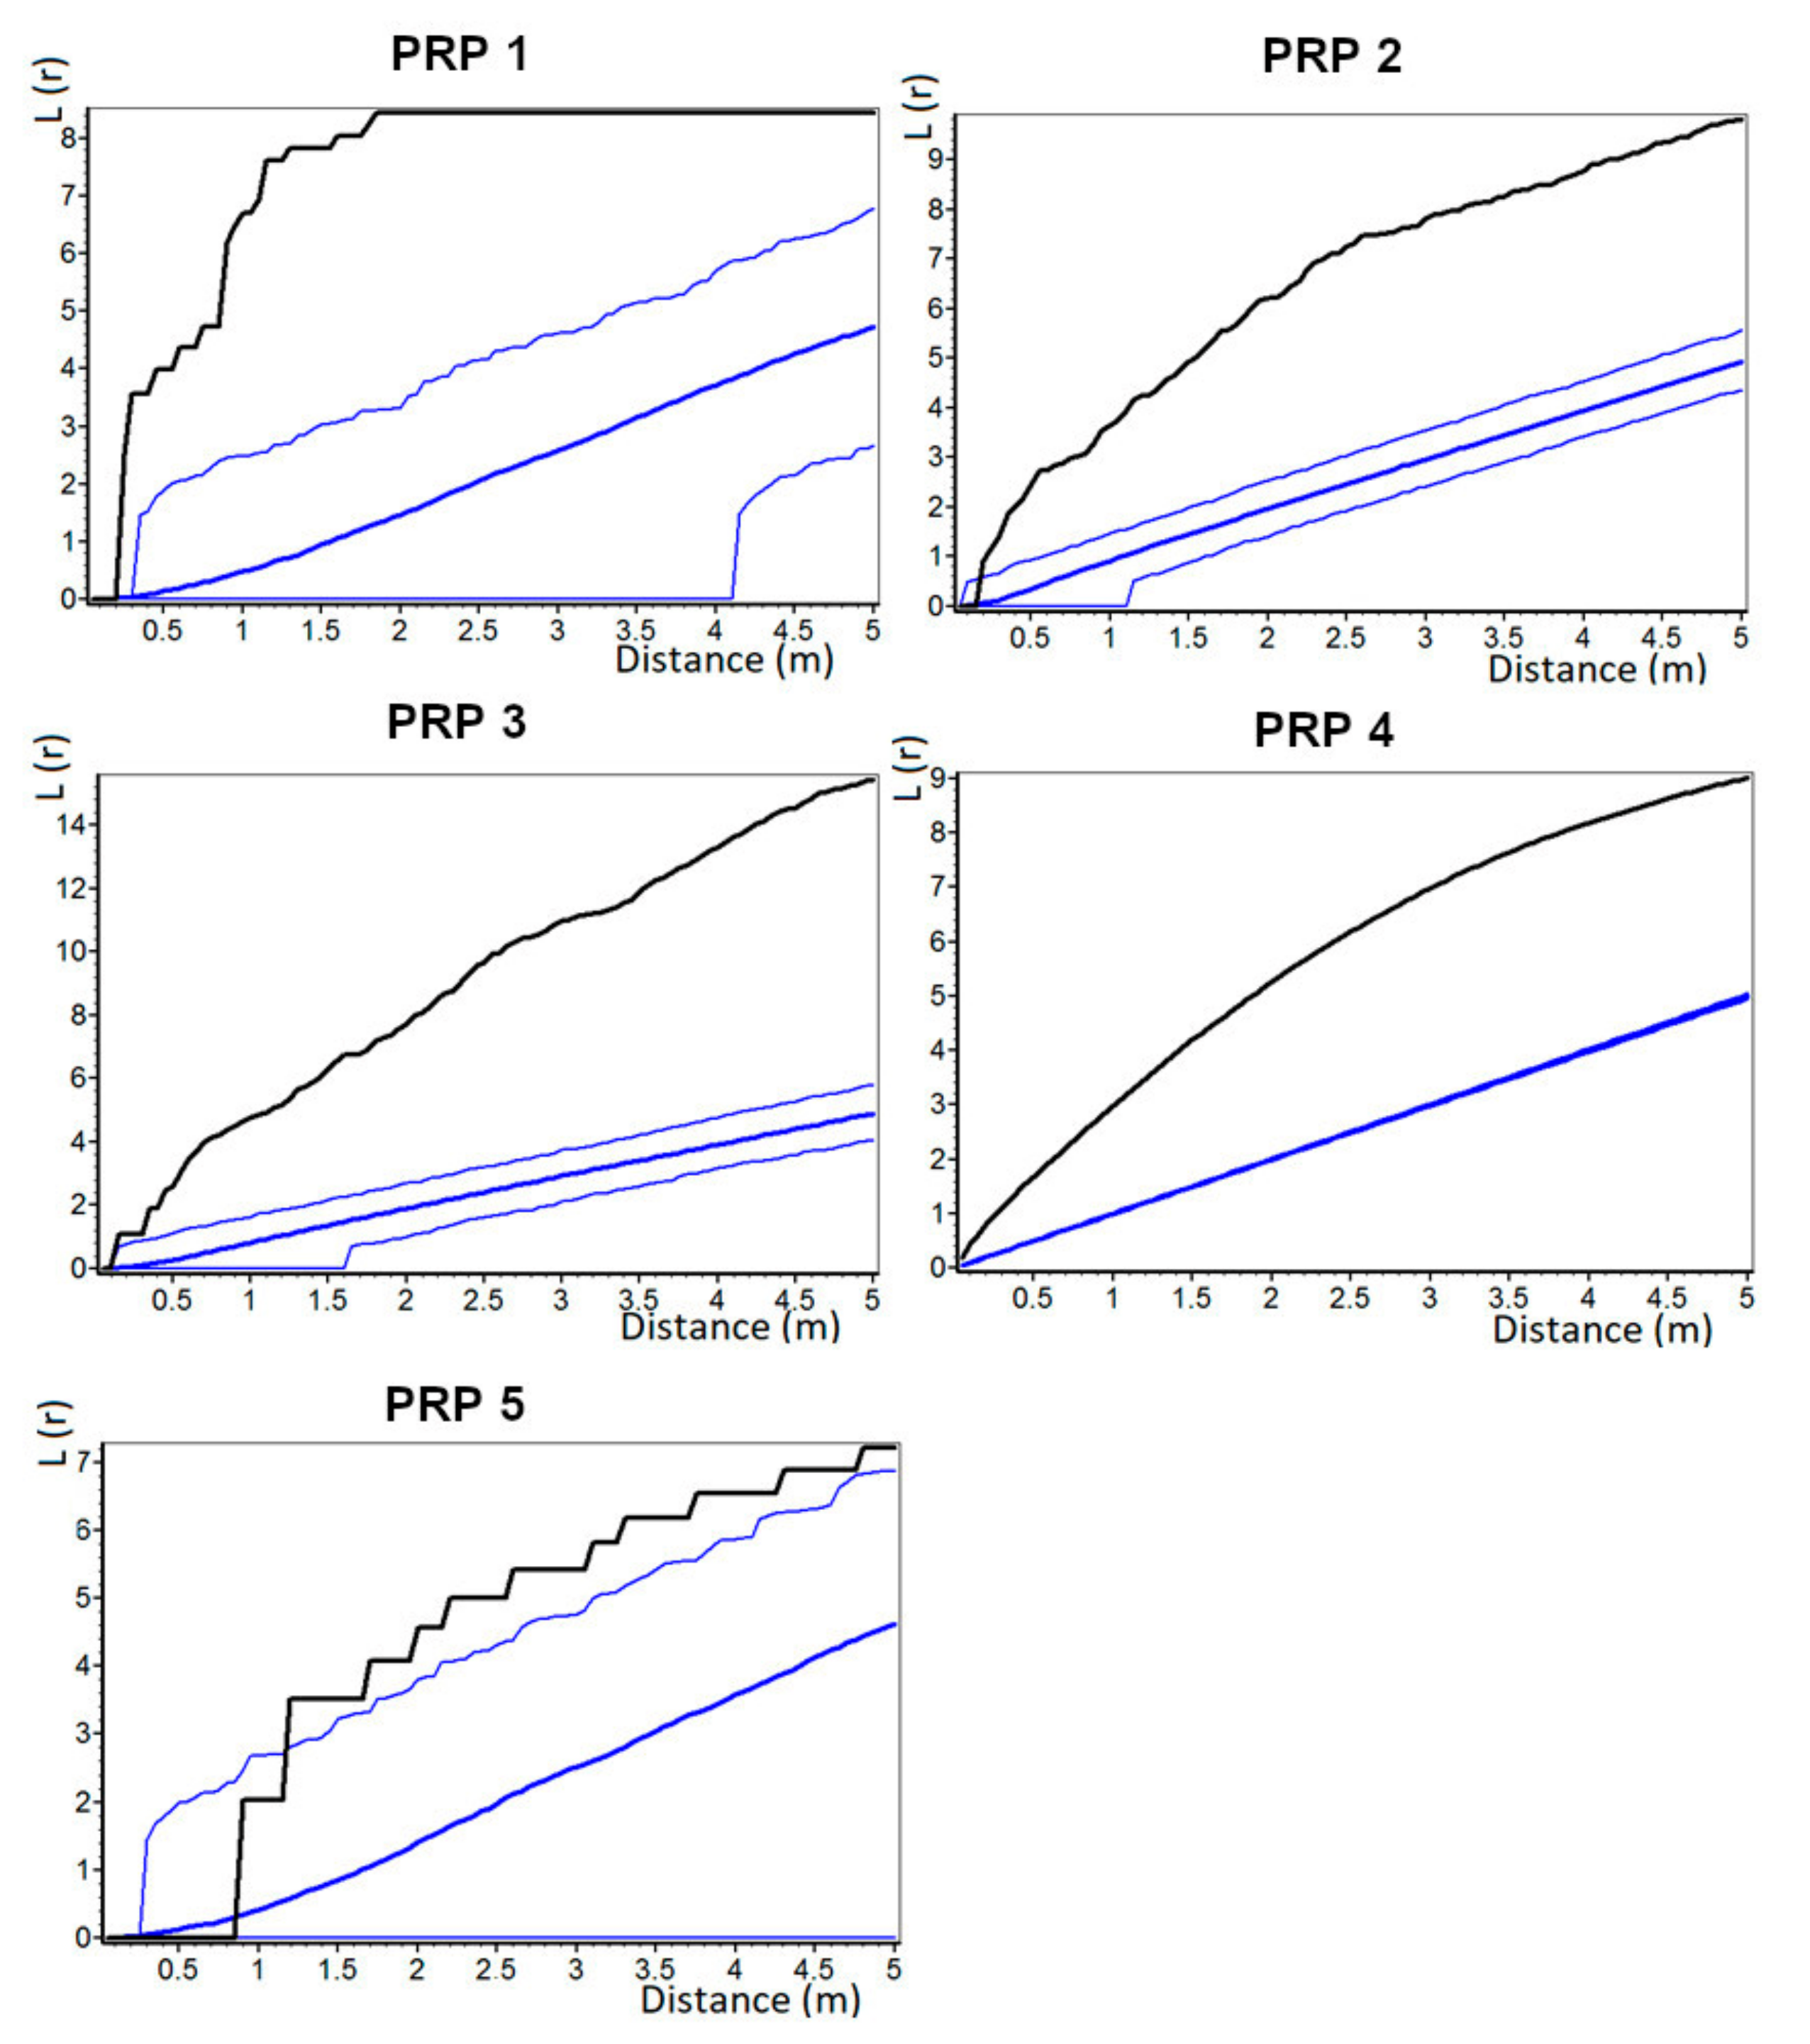
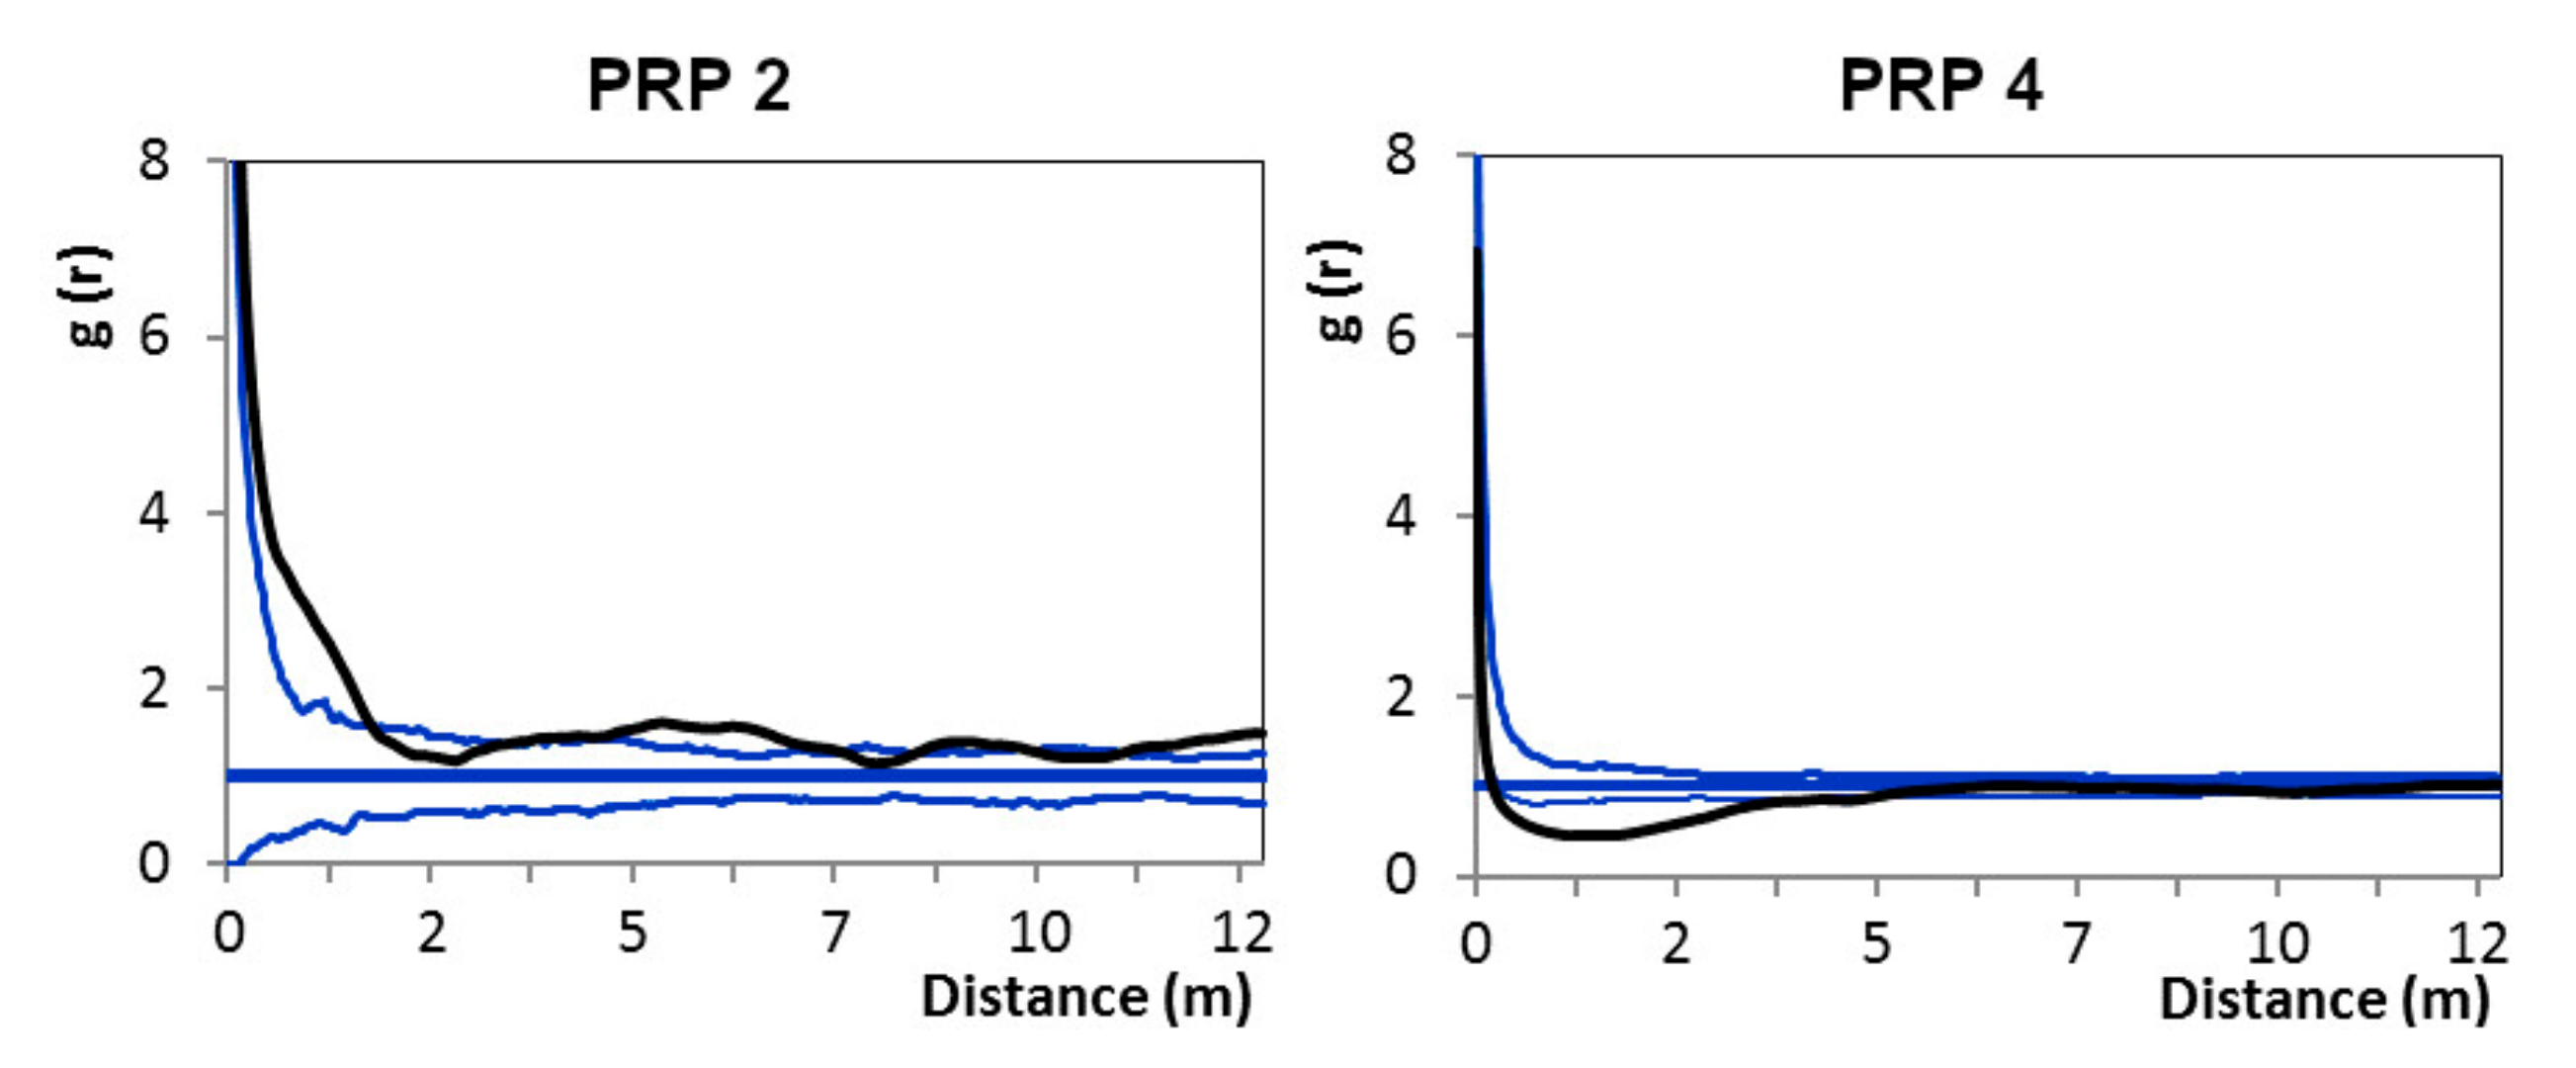
86]. The horizontal structure of the tree layer was indistinctly aggregated or moderately regular while the random spatial pattern of trees across the research plots prevailed. Zenner et al. [87] also documented the prevailing random distribution of trees in near-natural stands of eastern beech in the Caspian Iran. The initial spatial pattern of near-natural beech stands is usually aggregated or randomly irregular and it turns to a moderately regular pattern in favorable conditions [88,89]. This may be due to gradual growth, competition among trees, and expansion of crowns as beech crowns are able to promptly react to the changes in the normal environmental condition [90].
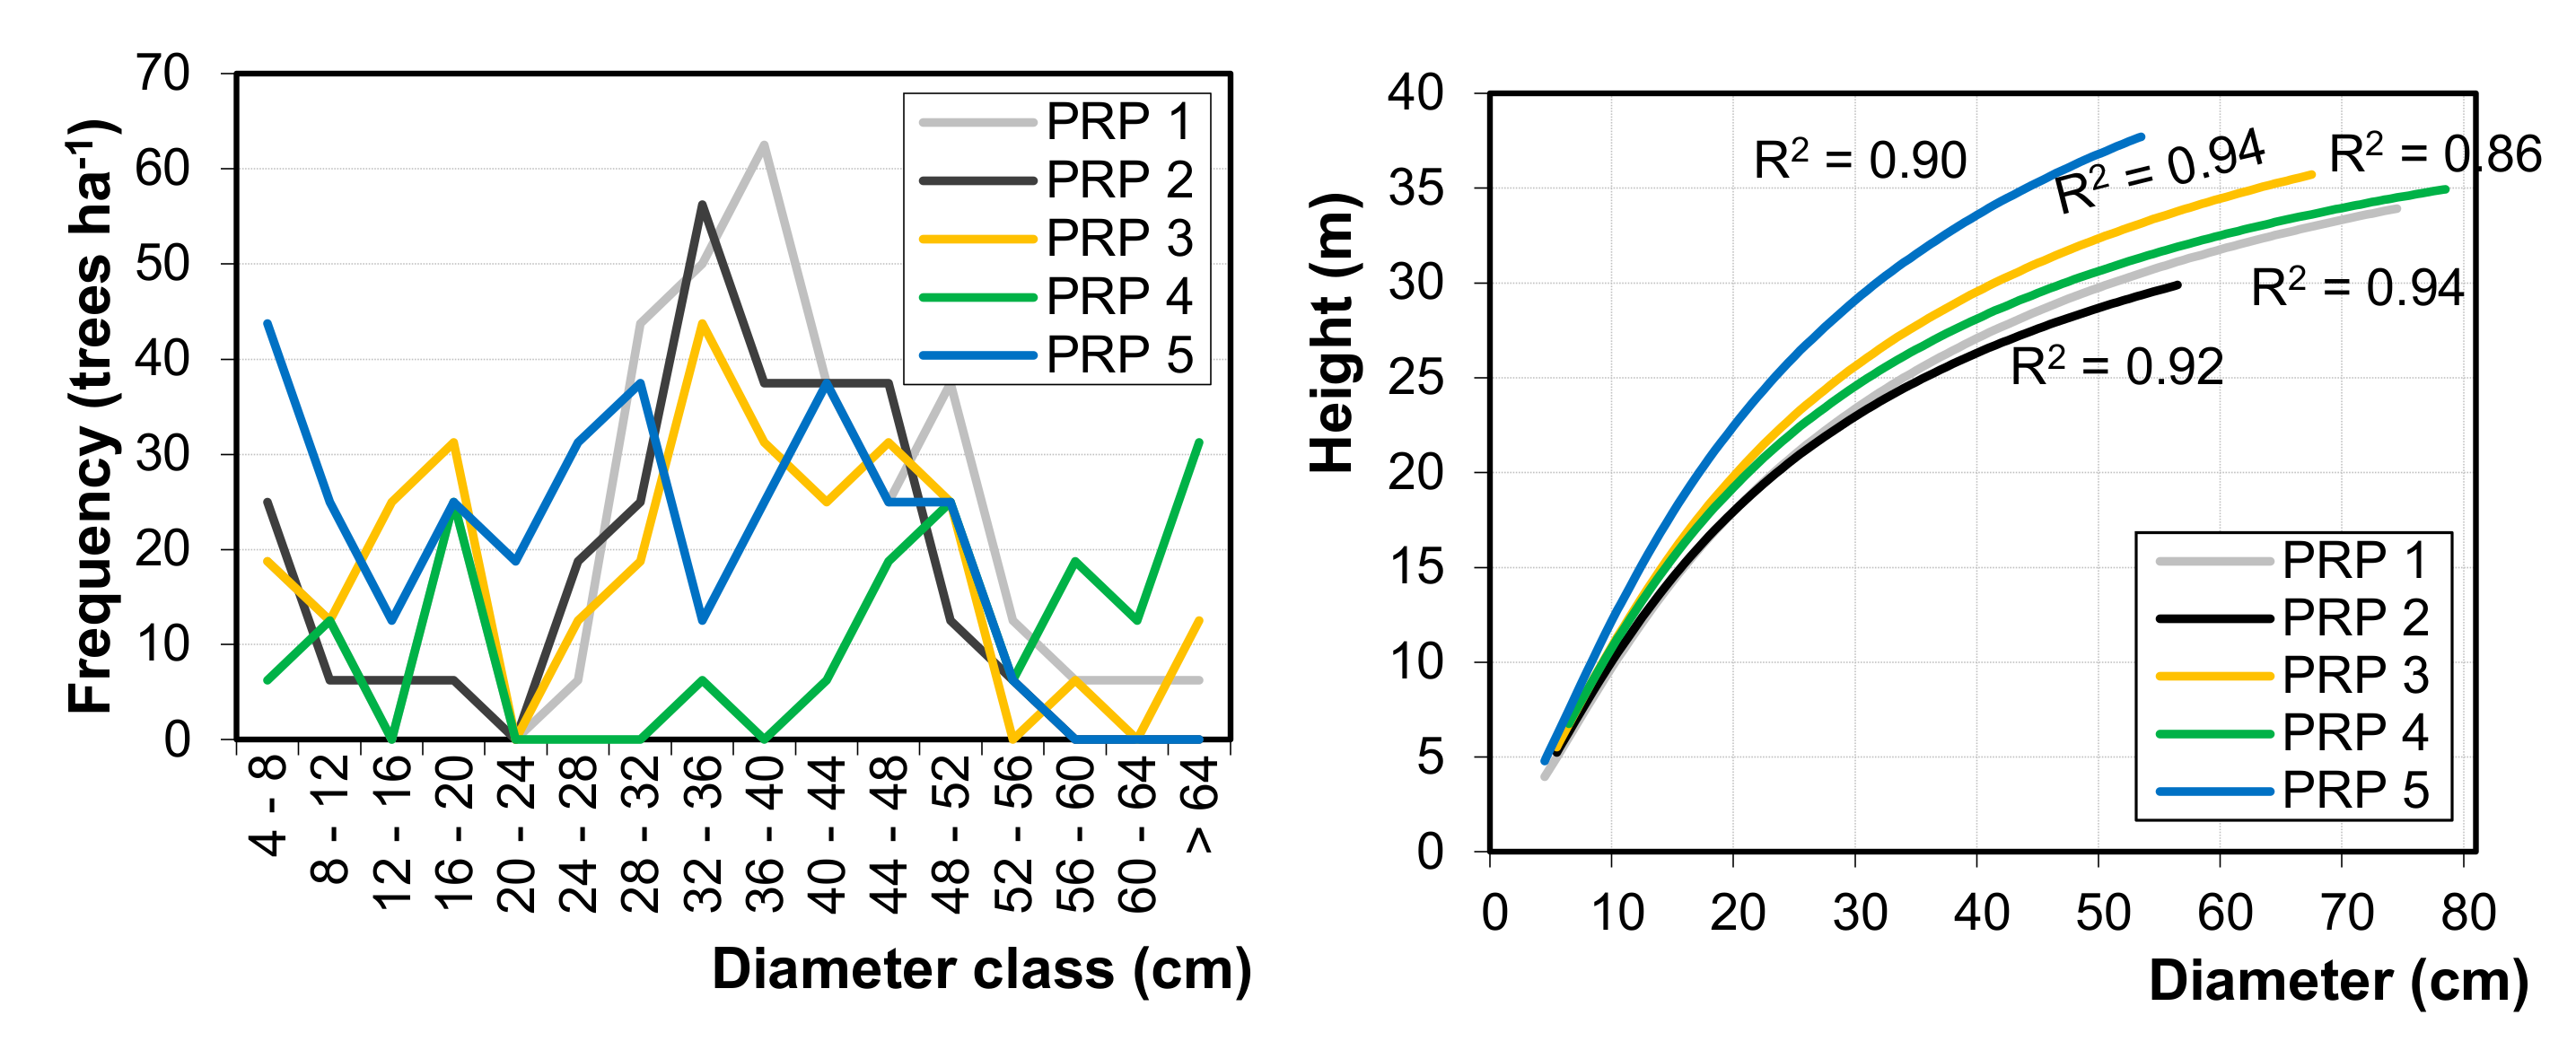
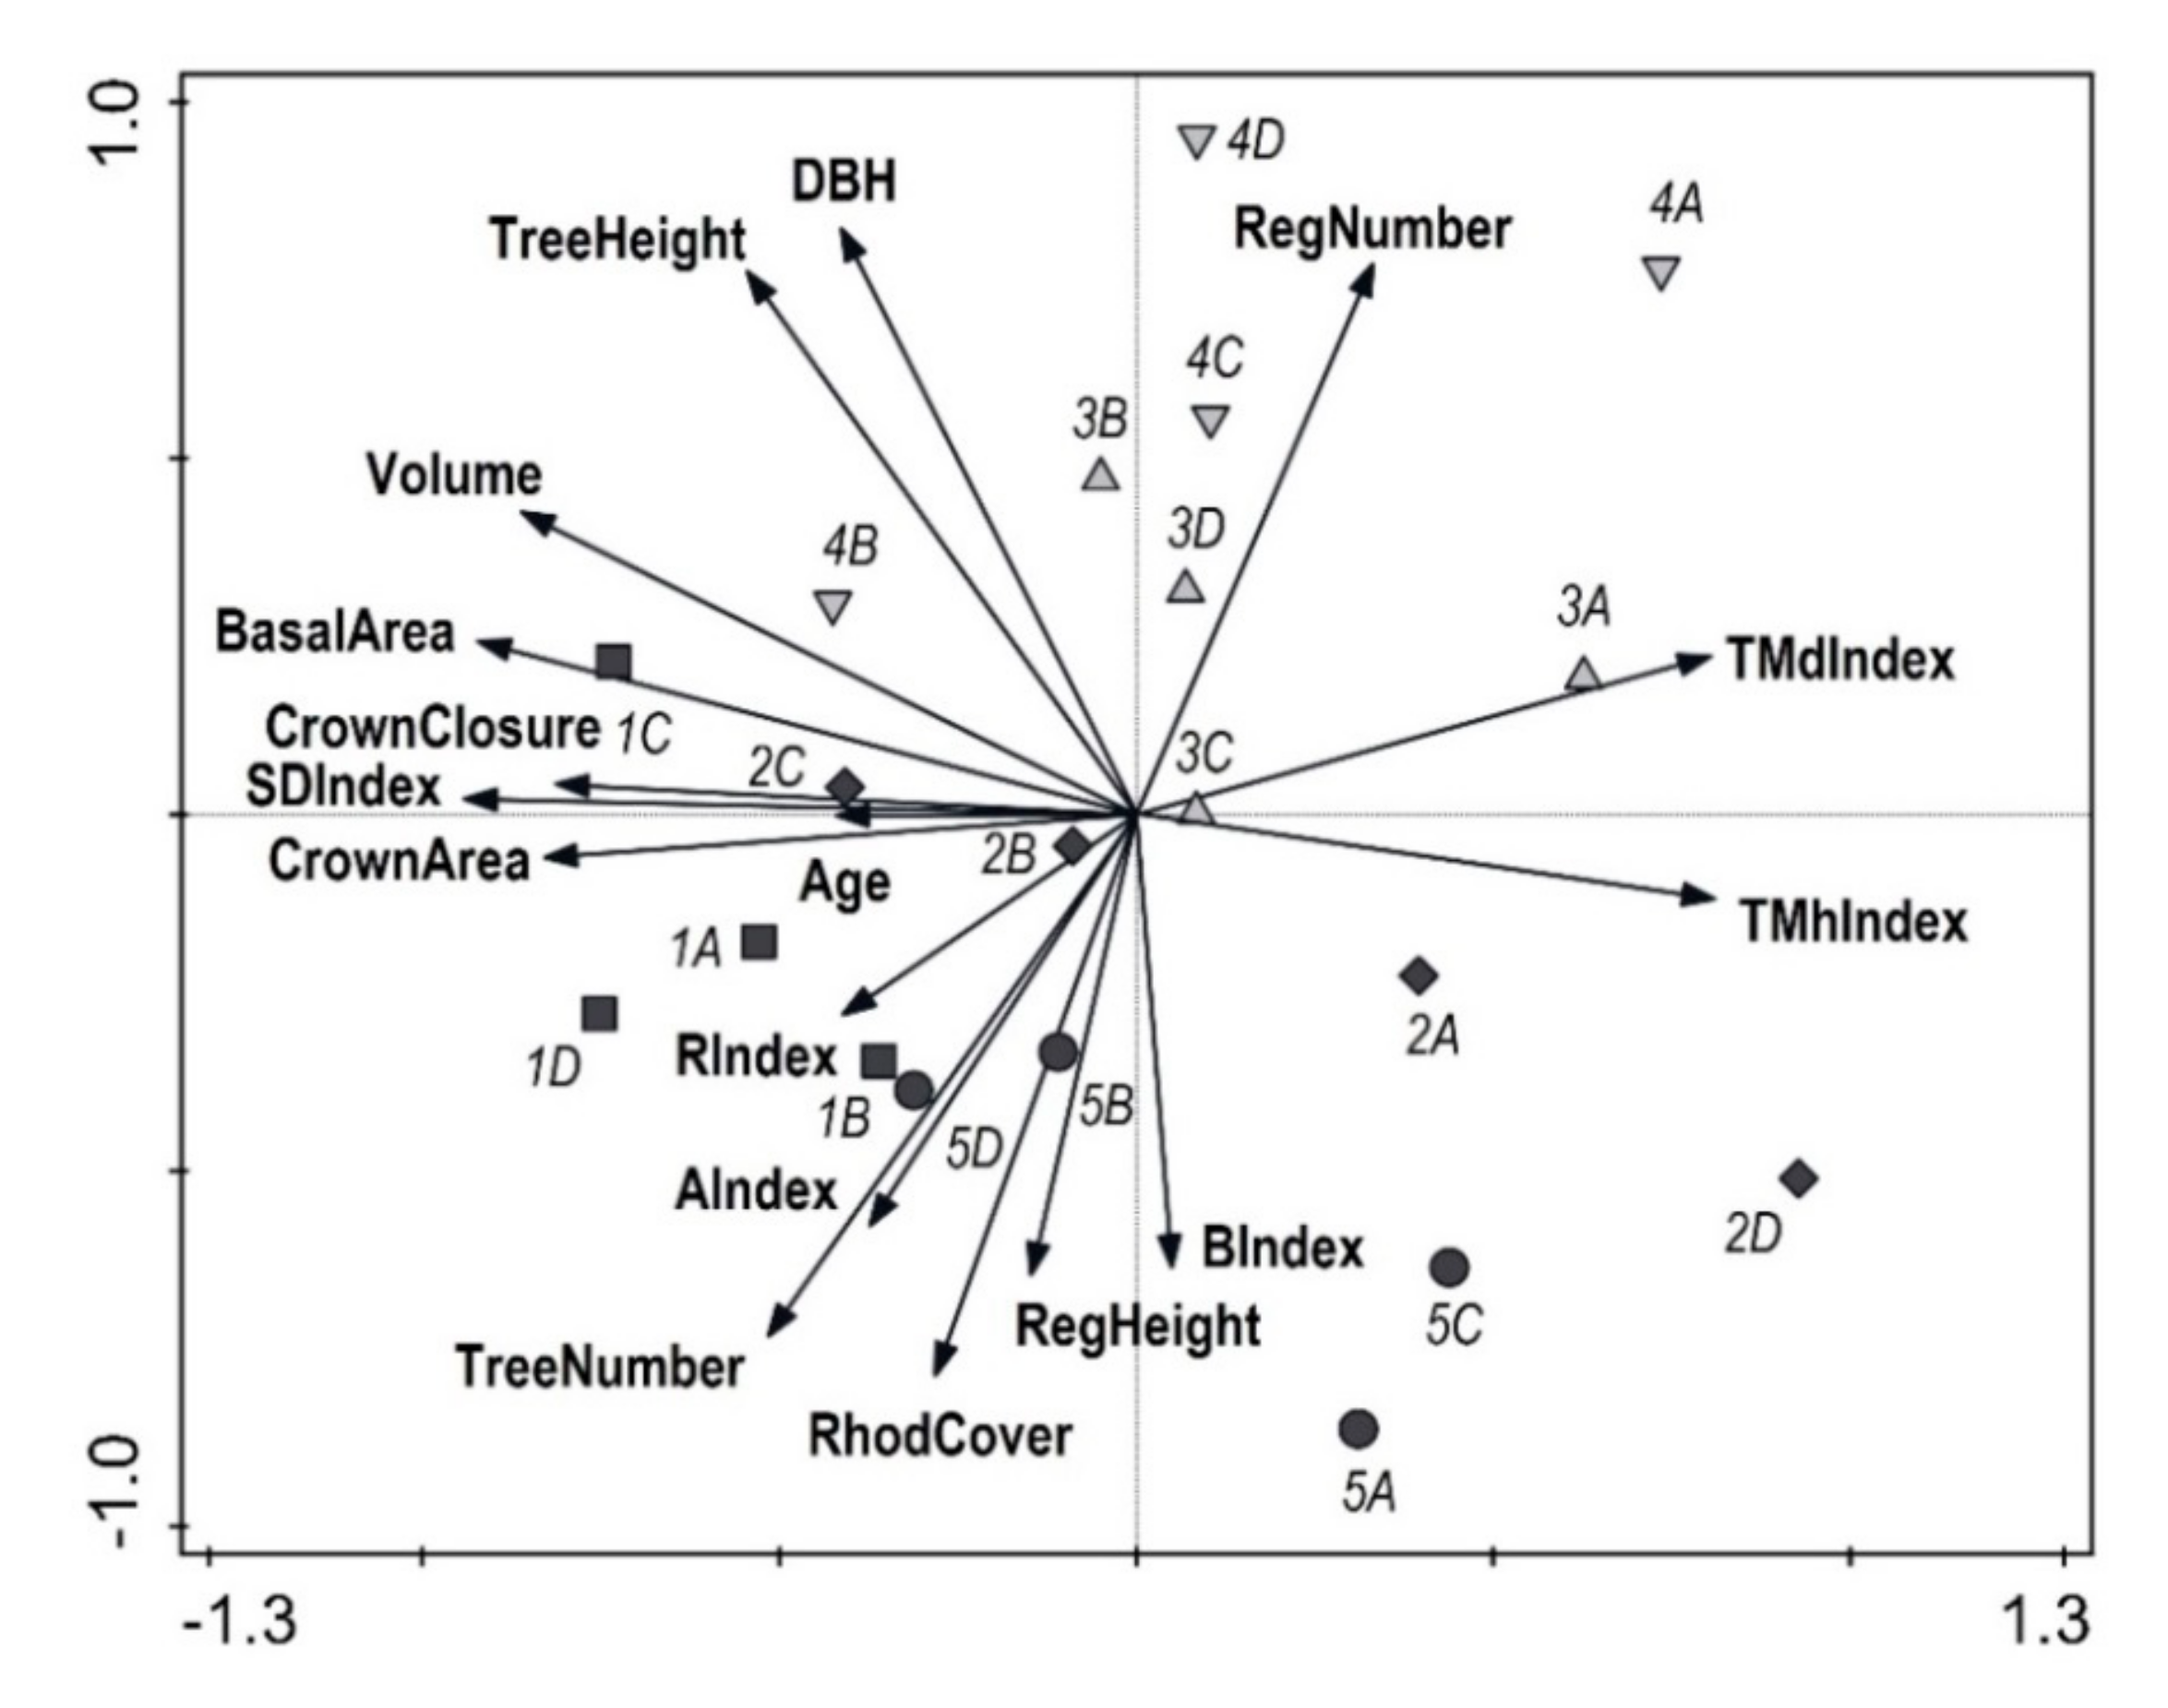
The vertical structure of investigated stands varied from medium to very high. Diameter structure was also medium-diversified. Frequency distribution of diameter of the tree layer was mostly bell-shaped, which documents the stage of optimum [54]. Similarly, other studies show Gaussian distribution of diameters of eastern beech in the mature stands. Atalay [3] and Eşen et al. [4] also reported the relatively highest forest biodiversity in the oriental beech stands in the BSR within Turkish forests. A high biodiversity of near-natural forest stands with oriental beech was also reported in Iran [87,91]. These studies show that forests create the structural mosaic with alternation of particular developmental stages and phases. Sagheb-Talebi and Schütz [92] found irregular and diversified structure with a high proportion of large trees in the natural beech forests of the Caspian Iran.
The number of trees on the studied PRPs varies from 175 to 381 trees ha−1. These numbers are roughly consistent with the data from the Elborz Mountain range along the southern Caspian Sea, i.e., 219–443 trees ha−1 [87]. In comparable stands of eastern beech in Iran, Akhavan et al. [93] reported 302–454 trees ha−1 and Sefidi et al. [17] reported 198 trees ha−1 on average. The highest stand volume was found on PRP 1, reaching 589 m3 ha−1, and the lowest stand volume was on PRP 2, i.e., 331 m3 ha−1. In eastern beech stands of identical growth conditions, Hassani and Amani [94] reported higher volumes (i.e., 562–678 m3 ha−1) and Sefidi et al. [17] documented 386 m3 ha−1. Basal area of the studied stands was in the range of 28.8–46.1 m2 ha−1, and similarly Zenner et al. [87] found stand basal area varying from 33.7 to 44.1 m2 ha−1.
Natural regeneration of beech forests is strongly limited by dense undergrowth of aggressive invasive pontic rhododendron, which is very abundant in eastern beech stands in the entire western BSR [7,95,96,
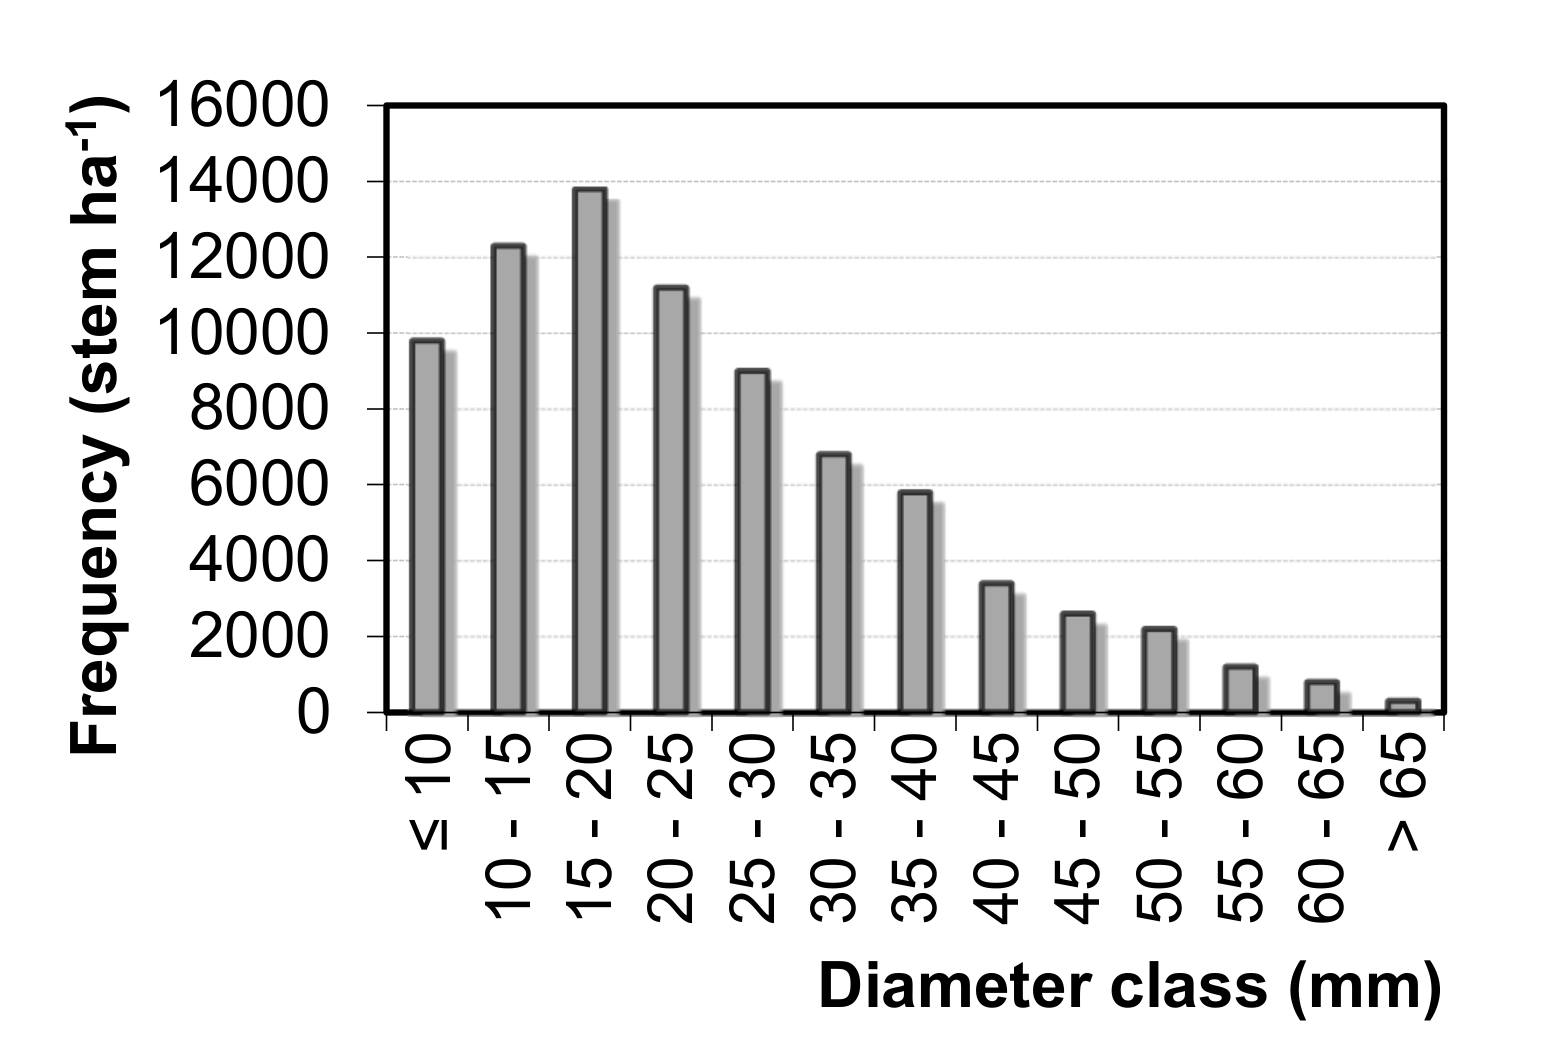
97]. The number of monopodial woody stems varied from 72,178 to 86,884 stems ha−1 on our PRP, and this number was between the values reported by Eşen et al. [7], which were 48,000 and 91,000 stems ha−1 for R. ponticum and R. flavum, respectively. High rhododendron production was also observed from neighboring districts, where biomass storage capacity of pontic rhododendron reached up to 40,035 kg ha−1 with preference of sunny exposure and altitude to 500 m a. s. l. [98]. From this reason, pontic rhododendron can be (except positive effect of clearing on tree regeneration) used for fuel and in wood industry, especially for manufacture of density fiberboard panels [99,100]. Our study also reported dense rhododendron cover (81%–97%) and low tree regeneration (113–619 recruits ha−1). Only two research plots (PRP 3 and 4), where invasive rhododendron was cleared 3 and 6 years ago, respectively, contained a high number of tree regeneration (63,987–105,075 recruits ha−1). Comparable amount of beech natural regeneration (24,500 to 123,400 seedlings ha−1) was observed in the Sökü district in Western part of BSR [83]. Three to four individuals per m2 may be considered as a sufficient number of tree regeneration for the prosperous development of stands [101]. From this perspective, only tree regeneration on PRP 3 and 4 with 0–3% cover percentage of rhododendron may be considered as sufficient. On the average, eastern beech accounted for 97% of natural regeneration (recruits) on the studied research plots. Because site preparation was done in seed mast year of beech, the seed status of other tree species was not taken into consideration. As a result, regeneration was purely dominated by beech seedlings, but other tree species consisted of admixture of mature stands. However, rhododendron had an opposite influence on the mean height of recruits. Due to competitiveness of this woody shrub, the height of recruits was significantly taller on the research plots with a high cover percentage of rhododendron (87.2–221.5 cm) compared to the recruit heights (23.2–43.3 cm) on PRPs where rhododendron was removed. While the influence of rhododendron cover (light competition) on regeneration was strong, influence of overstory canopy closure on recruit number and height was not proved.
The horizontal structure of natural regeneration was distinctly aggregated on all studied PRPs. A similar pattern was also found in comparable oriental beech stands [93]. The situation is identical in European beech (Fagus sylvatica L.) [19,102]. A tendency towards aggregation of seedlings and in the lowerstory is a result of prosperous growth of natural regeneration in canopy gaps that originated after dead trees [23,103]. As for the spatial pattern (contrary to recruit number and height), parent trees had a significant negative influence on the individual recruits within a 4 m radius from tree stem on the PRPs, where rhododendron cover with generative regeneration prevailed. Vacek et al. [19] reported that distribution of parent trees negatively affected the placement of natural regeneration of European beech within a 2.5 m radius. This negative spatial interaction between natural regeneration and tree layer in small spacing may be caused by insufficient light conditions for growth of seedlings closer to mature tree. However, trees had positive influence on natural regeneration to the distance of 1.5 m on the research plots with dense rhododendron cover. This is caused by rich root sprouting of eastern beech [17]. Natural regeneration, especially from the seed without support from the parent plant, has no chance to survive under the dense rhododendron cover compared to the sprouts or suckers [7]. The species diversity of natural regeneration was low on the study site; however, it was higher on PRP 3 and 4, where rhododendron was removed. On other plots, no other tree species (except beech) occurred. Removal of rhododendron may give an opportunity to the other tree species to establish regeneration. However, during the rhododendron clearance, the other tree species are usually removed from the beech forests, and frequent use of bulldozers had a negative effect on the seed bank during the soil removal [86].
The mineral soil exposure during site preparation is often recommended for sufficient natural regeneration because the litter layer does not provide a favorable seedbed for beech seeds [96,104]. In this context, Agestam et al. [105] stated that the suitable preparation of site conditions, and especially of the soil surface with the exposure of mineral contents, increased the germination rate of beech seeds compared to sites without soil preparation in southern Sweden. One year after the bulldozer removal of rhododendron undergrowth along with thickness of 5–10 cm soil layer in beech forests of the BSR, Yildiz et al. [95] and Sarginci [106] reported 300,000–700,000 beech seedlings ha−1. Such a method of soil preparation is more suitable from short-time economic aspects than manual cutting or clearance of rhododendron. At the same time, it leads to the accelerated mineralization causing nutrient loss, decrease in microbial activity, and soil compaction [95,101,107]. Soil compaction can also hinder the root growth, decrease tolerance to drought, and limit the uptake of immobile soil nutrients [108]. For these reasons, and especially from the perspective of the sustainable forest management, manual cutting and clearance of rhododendron undergrowth seems better than its removal by a bulldozer with great disturbance of the soil surface. In addition, during site preparation, scraping the forest floor by a rake-equipped bulldozer significantly disturbed the seed banks. A similar opinion was published by [101], who supported manual clearance of rhododendron and its burning because of their efficiency for the long-term productivity of oriental beech stands in Turkey.

5. Conclusions

The findings of this study document an invasive spread of pontic rhododendron as a limiting factor for prosperous regeneration in beech forests in the Black Sea Region, which can be further enhanced in future due to climate change. This aggressive invasive shrub has a long-term significant negative effect on natural regeneration and subsequent dynamics and structure of forest ecosystems. Rhododendron cover significantly affected spatial patterns of natural regeneration, considering its mean height and especially density. Number of tree regeneration was 309× (188×) higher in forest stands after 6 (3) years after rhododendron clearance compared to stands without intervention with a mean annual increase in the regeneration number by 19.4 thousand recruits ha−1 y−1. On the other hand, tree canopy had no significant effect on density of tree regeneration and rhododendron cover. The natural regeneration of these forests will be very problematic without the efficient clearance of rhododendron by effective methods minimally disturbing the soil environment and seed bank, while blockage of the successional stages of rhododendron may occur during disintegration of the beech stands. The appropriate methods of rhododendron removal and the regeneration techniques have significant positive effect on continuity of forest dynamics and thus protect the threatened beech forest ecosystems, but it can also increase forest species diversity. Other tree species (except eastern beech) occurred in natural regeneration only in stands after rhododendron clearance. Therefore, manual clearance of rhododendron (with the possibility of use in wood industry) at the beginning of the regeneration period is recommended in managed forests.

Supplementary Materials

The following are available online at https://www.mdpi.com/1999-4907/11/5/603/s1.

Author Contributions

Conceptualization, Z.V.; methodology, Z.V. and S.V.; software, Z.V. and J.K.; validation, Z.V. and S.V.; formal analysis, Z.V. and J.K.; investigation, Z.V. and J.K.; resources, Z.V.; data curation, Z.V.; writing—original draft preparation, Z.V., S.V., D.E., O.Y., and J.G.; visualization, Z.V. and J.K.; supervision, S.V., D.E., and O.Y.; project administration, Z.V.; funding acquisition, Z.V. All authors have read and agreed to the published version of the manuscript.

Funding

This research was funded by the Czech University of Life Sciences Prague, Faculty of Forestry and Wood Sciences (IGA no. B_19_05).

Acknowledgments

We are grateful to an editor and three anonymous reviewers for their insightful comments and suggestions that greatly helped improve our manuscript.

Conflicts of Interest

The authors declare no conflict of interest.

References

  1. Kaya, Z.; Raynal, D.J. Biodiversity and conservation of Turkish forests. Boil. Conserv. 2001, 97, 131–141. [Google Scholar] [CrossRef]
  2. Bektaş, İ.; Güler, C.; Baştürk, M.A. Principal Mechanical Properties of Eastern Beech Wood (Fagus orientalis Lipsky) Naturally Grown in Andırın Northeastern Mediterranean Region of Turkey. Turk. J. Agric. For. 2002, 26, 147–154. [Google Scholar]
  3. Atalay, I. Ecoregions of Turkey; Meta Basimevi: Izmir, Turkey, 2002. [Google Scholar]
  4. Eşen, D.; Soysal, G.E.; Yıldız, O. Regenerating Eastern Beech (Fagus orientalis Lipsky) With Gaps of Various Sizes in the Western Black Sea Region of Turkey. Düzce Üniversitesi Orman Fakültesi Ormancılık Dergisi 2015, 11, 71–82. [Google Scholar]
  5. Köppen, W. Das Geographische System der Klimate, Handbuch der Klimatologie; Gebrüder Borntraeger: Berlin, Germany, 1936. [Google Scholar]
  6. Atalay, I.; Efe, R.; Öztürk, M. Ecology and Classification of Forests in Turkey. Procedia Soc. Behav. Sci. 2014, 120, 788–805. [Google Scholar] [CrossRef] [Green Version]
  7. Eşen, D.; Zedaker, S.M.; Kirwan, J.L.; Mou, P. Soil and site factors influencing purple-flowered rhododendron (Rhododendron ponticum L.) and eastern beech forests (Fagus orientalis Lipsky) in Turkey. For. Ecol. Manag. 2004, 203, 229–240. [Google Scholar] [CrossRef]
  8. Odabaşı, T.; Calışkan, A.; Bozkuş, F. Silvikultur Tekniği; İ.U. Yayın No, 4459, O.F. Yayın No: 475; Orman Fakültesi, Istanbul Üniversitesi, Matbaa Teknisyenleri Basımevi: İstanbul, Turkey, 2004. [Google Scholar]
  9. Kirwan, J.L.; Shugart, H.H. Vegetation and Two Indices of Fire on the Delmarva Peninsula. J. Torrey Bot. Soc. 2000, 127, 44. [Google Scholar] [CrossRef]
  10. Colak, A.H.; Rotherham, I.D. A Review of the Forest Vegetation of Turkey: Its Status Past and Present and its Future Conservation. Boil. Environ. Proc. R. Ir. Acad. 2006, 106, 343–354. [Google Scholar] [CrossRef] [Green Version]
  11. Yildiz, O.; Eşen, D. Effects of different Rhododendron control methods in eastern beech (Fagus orientalis Lipsky) ecosystems in the western Black Sea region of Turkey. Ann. Appl. Boil. 2006, 149, 235–242. [Google Scholar] [CrossRef]
  12. Somogyi, Z.; Tobish, T.; Csepanyi, P. Hungarian initiatives towards a continuous cover forestry. In Proceedings of the Conference of Close to Nature Forestry, Zvolen, Slovakia, 14–19 October 2003. [Google Scholar]
  13. Huss, J.; Kahveci, O. Turkiye’de Doğaya Yakın Yapraklı Orman Işletmeciliği; OGEMVAK: Ankara, Turkey, 2009. [Google Scholar]
  14. Zengin, H.; Yeşil, A.; Asan, Ü.; Bettinger, P.; Cieszewski, C.; Siry, J. Evolution of Modern Forest Management Planning in the Republic of Turkey. J. For. 2013, 111, 239–248. [Google Scholar] [CrossRef] [Green Version]
  15. Eşen, D.; Yıldız, O. Close-to-nature forestry and eastern beech (Fagus orientalis Lipsky.), A.İ.B.Ü. Ormancılık Dergisi 2006, 1, 130–139. [Google Scholar]
  16. Wagner, S.; Collet, C.; Madsen, P.; Nakashizuka, T.; Nyland, R.D.; Talebi, K.S. Beech regeneration research: From ecological to silvicultural aspects. For. Ecol. Manag. 2010, 259, 2172–2182. [Google Scholar] [CrossRef]
  17. Sefidi, K.; Marvie Mohadjer, M.R.; Mosandl, R.; Copenheaver, C. A Canopy gaps and regeneration in old-growth Oriental beech (Fagus orientalis Lipsky) stands, northern Iran. For. Ecol. Manag. 2011, 262, 1094–1099. [Google Scholar] [CrossRef]
  18. Vacek, S.; Vacek, Z.; Podrazský, V.; Bilek, L.; Bulušek, D.; Štefančik, I.; Remeš, J.; Šticha, V.; Ambrož, R. Structural Diversity of Autochthonous Beech Forests in Broumovské Stěny National Nature Reserve, Czech Republic. Aust. J. Forest. Sci. 2014, 131, 191–214. [Google Scholar]
  19. Vacek, Z.; Vacek, S.; Podrázský, V.; Bílek, L.; Štefančík, I.; Moser, W.K.; Bulušek, D.; Král, J.; Remeš, J.; Králíček, I. Effect of Tree Layer and Microsite on the Variability of Natural Regeneration in Autochthonous Beech Forests. Pol. J. Ecol. 2015, 63, 233–246. [Google Scholar] [CrossRef]
  20. McCarthy, J. Gap dynamics of forest trees: A review with particular attention to boreal forests. Environ. Rev. 2001, 9, 1–59. [Google Scholar] [CrossRef]
  21. Vacek, S.; Nosková, I.; Bílek, L.; Vacek, Z.; Schwarz, O. Regeneration of forest stands on permanent research plots in the Krkonoše Mts. J. For. Sci. 2010, 56, 541–554. [Google Scholar] [CrossRef] [Green Version]
  22. Messier, C. Managing Light and Understory Vegetation in Boreal and Temperate Broadleaf-Conifer Forests. In Silviculture of Temperate and Boreal Broadleaf-Conifer Mixtures; Comeau, P.G., Thomas, K.D., Eds.; Province of British Columbia, Ministry of Forests Research Program: Victoria, BC, Canada, 1996. [Google Scholar]
  23. Zeibig, A.; Diaci, J.; Wagner, S. Gap disturbance patterns of a Fagus sylvatica virgin forest remnant in the mountain vegetation belt of Slovenia. For. Snow Land. Res. 2005, 79, 69–80. [Google Scholar]
  24. Van Gils, H.; Batsukh, O.; Rossiter, D.; Munthali, W.; Liberatoscioli, E. Forecasting the pattern and pace of Fagus forest expansion in Majella National Park, Italy. Appl. Veg. Sci. 2008, 11, 539–546. [Google Scholar] [CrossRef]
  25. Oliver, C.D.; Larson, B.C. Forest Stands Dynamics; Wiley: New York, NY, USA, 1996; 520p. [Google Scholar]
  26. Messier, C.; Puettmann, K.J.; Coates, K.D. Managing Forests as Complex Adaptive Systems: Building Resilience to the Challenge of Global Change; Routledge: New York, NY, USA, 2013; 360p. [Google Scholar]
  27. Piñar Fuentes, J.C.; Cano-Ortiz, A.; Musarella, C.M.; Quinto Canas, R.; Pinto Gomes, C.J.; Spampinato, G.; del Río, S.; Cano, E. Bioclimatology, Structure, and Conservation Perspectives of Quercus pyrenaica, Acer opalus subsp. Granatensis, and Corylus avellana Deciduous Forests on Mediterranean Bioclimate in the South-Central Part of the Iberian Peninsula. Sustainability 2019, 11, 6500. [Google Scholar] [CrossRef] [Green Version]
  28. Rotherham, I.D.; Çolak, A.H.; Çalıkoğlu, M. Combining ‘naturalness concepts’ with close-to-nature silviculture. Eur. J. For. Res. 2003, 122, 421–431. [Google Scholar] [CrossRef]
  29. Foster, B.C.; Wang, D.; Keeton, W.S.; Ashton, M.S. Implementing Sustainable Forest Management Using Six Concepts in an Adaptive Management Framework. J. Sustain. For. 2010, 29, 79–108. [Google Scholar] [CrossRef]
  30. Coote, L.; French, L.; Moore, K.; Mitchell, F.; Kelly, D. Can plantation forests support plant species and communities of semi-natural woodland? For. Ecol. Manag. 2012, 283, 86–95. [Google Scholar] [CrossRef]
  31. Oxbrough, A.; Irwin, S.; Wilson, M.; O’Halloran, J. Mechanisms and predictors of ecological change in managed forests: A selection of papers from the second international conference on biodiversity in forest ecosystems and landscapes. For. Ecol. Manag. 2014, 321, 1–4. [Google Scholar] [CrossRef]
  32. Barbati, A.; Marchetti, M.; Chirici, G.; Corona, P. European Forest Types and Forest Europe SFM indicators: Tools for monitoring progress on forest biodiversity conservation. For. Ecol. Manag. 2014, 321, 145–157. [Google Scholar] [CrossRef] [Green Version]
  33. Vacek, Z.; Vacek, S.; Slanař, J.; Bílek, L.; Bulušek, D.; Štefančík, I.; Králíček, I.; Vančura, K. Adaption of Norway spruce and European beech forests under climate change: From resistance to close-to-nature silviculture. Cent. Eur. For. J. 2019, 65, 129–144. [Google Scholar] [CrossRef] [Green Version]
  34. Del Rio, S.; Alvarez-Esteban, R.; Cano, E.; Gomes, C.P.; Penas, A. Potential impacts of climate change on habitat suitability of Fagus sylvatica L. forests in Spain. Plant Biosyst. 2018, 152, 1205–1213. [Google Scholar] [CrossRef]
  35. Nunes, L.; Meireles, C.I.; Gomes, C.P.; Ribeiro, N.M.A. The Evolution of Climate Changes in Portugal: Determination of Trend Series and Its Impact on Forest Development. Climate 2019, 7, 78. [Google Scholar] [CrossRef] [Green Version]
  36. Dittmar, C.; Zech, W.; Elling, W. Growth variations of Common beech (Fagus sylvatica L.) under different climatic and environmental conditions in Europe—A dendroecological study. For. Ecol. Manag. 2003, 173, 63–78. [Google Scholar] [CrossRef]
  37. Geßler, A.; Keitel, C.; Kreuzwieser, J.; Matyssek, R.; Seiler, W.; Rennenberg, H.; Gessler, A. Potential risks for European beech (Fagus sylvatica L.) in a changing climate. Trees 2006, 21, 1–11. [Google Scholar] [CrossRef]
  38. Králíček, I.; Vacek, Z.; Vacek, S.; Remeš, J.; Bulušek, D.; Král, J.; Štefančík, I.; Putalová, T. Dynamics and structure of mountain autochthonous spruce-beech forests: Impact of hilltop phenomenon, air pollutants and climate. Dendrobiology 2017, 77, 119–137. [Google Scholar] [CrossRef]
  39. Vacek, S.; Vacek, Z.; Kalousková, I.; Cukor, J.; Bílek, L.; Moser, W.K.; Bulušek, D.; Podrázský, V.; Řeháček, D. Sycamore maple (Acer pseudoplatanus L.) stands on former agricultural land in the Sudetes—Evaluation of ecological value and production potential. Dendrobiology 2018, 79, 61–76. [Google Scholar] [CrossRef] [Green Version]
  40. Cukor, J.; Vacek, Z.; Linda, R.; Vacek, S.; Marada, P.; Šimůnek, V.; Havránek, F. Effects of Bark Stripping on Timber Production and Structure of Norway Spruce Forests in Relation to Climatic Factors. Forests 2019, 10, 320. [Google Scholar] [CrossRef] [Green Version]
  41. Šimůnek, V.; Vacek, Z.; Vacek, S.; Králíček, I.; Vančura, K. Growth variability of European beech (Fagus sylvatica L.) natural forests: Dendroclimatic study from Krkonoše National Park. Cent. Eur. For. J. 2019, 65, 92–102. [Google Scholar] [CrossRef] [Green Version]
  42. Pourtahmasi, K.; Lotfiomran, N.; Bräuning, A.; Parsapajouh, D. Tree-ring width and vessel characteristics of oriental beech (Fagus Orientalis) along an altitudinal gradient in the caspian forests, northern Iran. IAWA J. 2011, 32, 461–473. [Google Scholar] [CrossRef]
  43. Oladi, R.; Pourtahmasi, K.; Eckstein, D.; Bräuning, A. Seasonal dynamics of wood formation in Oriental beech (Fagus orientalis Lipsky) along an altitudinal gradient in the Hyrcanian forest, Iran. Trees 2010, 25, 425–433. [Google Scholar] [CrossRef]
  44. Haghshenas, M.; Mohadjer, M.R.M.; Attarod, P.; Pourtahmasi, K.; Feldhaus, J.; Sadeghi, S.M.M. Climate effect on tree-ring widths ofFagus orientalisin the Caspian forests, northern Iran. For. Sci. Technol. 2016, 12, 176–182. [Google Scholar] [CrossRef] [Green Version]
  45. Mayer, H. Aksoy HForests in Turkey; Gustav Fischer Verlag: Sttutgart, Germany, 1986. [Google Scholar]
  46. Genç, M. Silvikültür Tekniği (Techniques of Silviculture); Orman Fakültesi, Süleyman Demirel Üniversitesi Yayın: Isparta, Turkey, 2004; 400p. [Google Scholar]
  47. Eşen, D.; Yildiz, O.; Kulaç, S.; Sarginci, M. Neglected valuable leafy type of Turkey’s forests: Wild cherry, (Cerasus avium (L.) Monench) or syn. Prunus avium. J. Chamb. Forest Eng. (TBMMO) 2005, 2, 18–22. [Google Scholar]
  48. Ketenoglu, O.; Tug, G.N.; Kurt, L. An ecological and syntaxonomical overview of Castanea sativa and a new association in Turkey. J. Environ. Boil. 2010, 31, 81–86. [Google Scholar]
  49. Var, M.; Bekci, B.; Dinçer, D. Effect of stratification treatments on germination of Sorbus torminalis L. Crantz (wild service tree) seeds with different origins. Afr. J. Biotechnol. 2010, 9, 5535–5541. [Google Scholar]
  50. Esen, D.; Yildiz, O.; Esen, U.; Edis, S.; Çetintas, C. Effects of cultural treatments, seedling type and morphological characteristics on survival and growth of wild cherry seedlings in Turkey. iForest-Biogeosci. For. 2012, 5, 283–289. [Google Scholar] [CrossRef]
  51. Dehnen-Schmutz, K.; Perrings, C.; Williamson, M. Controlling Rhododendron ponticum in the British Isles: An economic analysis. J. Environ. Manag. 2004, 70, 323–332. [Google Scholar] [CrossRef] [PubMed]
  52. Mejías, J.A.; Arroyo, J.; Ojeda, F.; Mejías, J.A. Reproductive ecology of Rhododendron ponticum (Ericaceae) in relict Mediterranean populations. Bot. J. Linn. Soc. 2002, 140, 297–311. [Google Scholar] [CrossRef]
  53. Colak, A.H. Investigations on the Silvicultural Characteristics of Rhododendron ponticum L. Ph.D. Thesis, University of Istanbul, Istanbul, Turkey, 1997. [Google Scholar]
  54. Manzoor, S.A.; Griffiths, G.; Iizuka, K.; Lukac, M. Land Cover and Climate Change May Limit Invasiveness of Rhododendron ponticum in Wales. Front. Plant Sci. 2018, 9, 664. [Google Scholar] [CrossRef] [PubMed] [Green Version]
  55. Manzoor, S.A.; Griffiths, G.; Obiakara, M.C.; Esparza-Estrada, C.E.; Lukac, M. Evidence of ecological niche shift in Rhododendron ponticum (L.) in Britain: Hybridization as a possible cause of rapid niche expansion. Ecol. Evol. 2020, 10, 2040–2050. [Google Scholar] [CrossRef] [Green Version]
  56. European Forest Institute. Implementing Criteria and Indicators for Sustainable Forest Management in Europe; EFI: Joensuu, Finland, 2013; 128p. [Google Scholar]
  57. Pretzsch, H.; Grote, R.; Reineking, B.; Rötzer, T.; Seifert, S. Models for Forest Ecosystem Management: A European Perspective. Ann. Bot. 2007, 101, 1065–1087. [Google Scholar] [CrossRef]
  58. Sitzia, T.; Campagnaro, T.; Kowarik, I.; Trentanovi, G. Using forest management to control invasive alien species: Helping implement the new European regulation on invasive alien species. Boil. Invasions 2015, 18, 1–7. [Google Scholar] [CrossRef]
  59. Gharehaghaji, M.; Kobal, S.; Reklau, R.; Minor, E.S. Management slows down invasion by non-native plants but does not prevent community change over 35 years in urban forests of the Midwestern USA. For. Ecol. Manag. 2019, 448, 424–431. [Google Scholar] [CrossRef]
  60. Yildiz, O. Natural Beech (Fagus orientalis Lipsky) Regenerations and Long-Term Productivity. In Proceedings of the International Multidisciplinary Congress of Eurasia-IMCOFE, Honor Committee, Odessa, Ukraine, 11–13 July 2016; pp. 190–198. [Google Scholar]
  61. Pretzsch, H. Forest Dynamics, Growth and Yield; Springer: Berlin/Heidelberg, Germany, 2009; 617p. [Google Scholar]
  62. Kantarci, D. Toprak Ilmi; Istanbul Universitesi Yayin No. 4261; Istanbul Universitesi Yayin: Istanbul, Turkey, 2000. [Google Scholar]
  63. IFER. FieldMap Software and Hardware Catalogue 2010; IFER—Monitoring and Mapping Solutions, Ltd.: Jílové u Prahy, Czech Republic, 2010; 64p. [Google Scholar]
  64. Carus, S. Increment and Growth in Even Aged Beech (Fagus Orientalis Lipsky.) Forests. Ph.D. Thesis, Istanbul University, Istanbul, Turkey, 1998; 360p. [Google Scholar]
  65. Petráš, R.; Pajtík, J. Sústava česko-slovenských objemových tabuliek drevín. Lesnícky Časopis 1991, 37, 49–56. [Google Scholar]
  66. Näslund, M. Skogsförsöksanstaltens gallringsförsök i tallskog. Meddelanden från Statens Skogsförsöksanstalt. Swed. Inst. Exp. For. 1936, 29, 169. [Google Scholar]
  67. Pielou, E.C. The Use of Point-to-Plant Distances in the Study of the Pattern of Plant Populations. J. Ecol. 1959, 47, 607. [Google Scholar] [CrossRef]
  68. Mountford, M.D. On E. C. Pielou’s index of nonrandomness. J. Ecol. 1961, 49, 271–275. [Google Scholar] [CrossRef]
  69. Clark, P.J.; Evans, F.C. Distance to Nearest Neighbor as a Measure of Spatial Relationships in Populations. Ecology 1954, 35, 445–453. [Google Scholar] [CrossRef]
  70. Ripley, B.D. Spatial Statistics; John Wiley & Sons: New York, NY, USA, 1981; 252p. [Google Scholar]
  71. David, F.N.; Moore, P.G. Notes on Contagious Distributions in Plant Populations. Ann. Bot. 1954, 18, 47–53. [Google Scholar] [CrossRef]
  72. Ziegel, E.R.; Mooney, C. Monte Carlo Simulation. Technometrics 1998, 40, 267. [Google Scholar] [CrossRef]
  73. Margalef, R. Information theory in ecology. Gen. Syst. 1958, 3, 36–71. [Google Scholar]
  74. Shannon, C.E. A Mathematical Theory of Communication. Bell Syst. Tech. J. 1948, 27, 379–423. [Google Scholar] [CrossRef] [Green Version]
  75. Weller, S.G.; Pielou, E.C. Ecological Diversity. Syst. Bot. 1976, 1, 318. [Google Scholar] [CrossRef]
  76. Füldner, K. Strukturbeschreibung von Buchen-Edellaubholz-Mischwäldern. Ph.D. Thesis, Cuvillier Verlag, Göttingen, Germany, 1995. [Google Scholar]
  77. Jaehne, S.; Dohrenbusch, A. Ein Verfahren zur Beurteilung der Bestandesdiversität. Eur. J. For. Res. 1997, 116, 333–345. [Google Scholar] [CrossRef]
  78. Pretzsch, H. Wissen nutzbar machen für das Management von Waldökosystemen. AFZ-Der Wald. 2006, 61, 1158–1159. [Google Scholar]
  79. Reineke, L.H. Perfecting a stand-density index for even-aged forests. J. Agric. Res. 1933, 46, 627–638. [Google Scholar]
  80. Crookston, N.L.; Stage, A.R. Percent Canopy Cover and Stand Structure Statistics from the Forest Vegetation Simulator; Gen. Tech. Rep. RMRS-GTR-24; U.S. Department of Agriculture, Forest Service, Rocky Mountain Research Station: Ogden, UT, USA, 1999; 11p. [Google Scholar]
  81. Ter Braak, C.J.F.; Šmilauer, P. CANOCO Reference Manual and CanoDraw for Windows User’s Guide: Software for Canonical Community Ordination, Version 4.5; Microcomputer Power: Ithaca, NY, USA, 2002. [Google Scholar]
  82. Atalay, I.; Efe, R. Structural and distributional evaluation of forest ecosystems in Turkey. J. Environ. Boil. 2010, 31, 61–70. [Google Scholar]
  83. Özel, H.B.; Ertekin, M.; Yilmaz, M.; Kirdar, E. Factors affecting the success of natural regeneration in oriental Beech (Fagus orientalis Lipsky) forests in Turkey. Acta Silvatica et Lignaria Hungarica 2010, 6, 149–159. [Google Scholar]
  84. Yildiz, O.; Eşen, D.; Zedaker, S.M. Five-year effects of cutting and herbicide treatments on control of Rhododendron flavum Don., and macronutrient pools in eastern beech (Fagus orientalis Lipsky) forests of Turkey. New For. 2010, 40, 175–184. [Google Scholar] [CrossRef]
  85. Eşen, D.; Zedaker, S.M. Control of rhododendron (Rhododendron ponticum and R. flavum) in the eastern beech (Fagus orientalis) forests of Turkey. New For. 2004, 27, 69–79. [Google Scholar] [CrossRef]
  86. Yildiz, O.; Eşen, D.; Sarginci, M.; Toprak, B. Eastern Beech (Fagus orientalis) Natural Regeneration and Forest Diversity. In Proceedings of the 3rd International Symposium on EuroAsian Biodiversity, Minsk, Belarus, 5–8 July 2017. [Google Scholar]
  87. Zenner, E.K.; Talebi, K.S.; Akhavan, R.; Peck, J.E. Integration of small-scale canopy dynamics smoothes live-tree structural complexity across development stages in old-growth Oriental beech (Fagus orientalis Lipsky) forests at the multi-gap scale. For. Ecol. Manag. 2015, 335, 26–36. [Google Scholar] [CrossRef]
  88. Wijdeven, S.M.J. Stand Dynamics in Fontainebleau: Dynamics in Beech Forest Structure and Composition over 17 Years in La Tillaie forest Reserve, Fontainebleua, France; Green World Research: Wageningen, The Netherlands, 2003; p. 56. [Google Scholar]
  89. Bulušek, D.; Vacek, Z.; Vacek, S.; Král, J.; Bílek, L.; Králíček, I. Spatial pattern of relict beech (Fagus sylvatica L.) forests in the Sudetes of the Czech Republic and Poland. J. For. Sci. 2016, 62, 293–305. [Google Scholar] [CrossRef] [Green Version]
  90. Pretzsch, H.; Schütze, G. Transgressive over yielding in mixed compared with pure stands of Norway spruce and European beech in Central Europe: Evidence on stand level and explanation on individual tree level. Eur. J. For. Res. 2009, 128, 183–204. [Google Scholar] [CrossRef]
  91. Amiri, M.; Rahmani, R.; Sagheb-Talebi, K.; Habashi, H. Dynamics and structural characteristics of a natural unlogged Oriental beech (Fagus orientalis Lipsky) stand during a 5-year period in State Kalate forest, Northern Iran. Int. J. Environ. Res. 2013, 1, 107–129. [Google Scholar] [CrossRef]
  92. Talebi, K.S.; Schütz, J. The structure of natural oriental beech (Fagus orientalis) forests in the Caspian region of Iran and potential for the application of the group selection system. Forestry 2002, 75, 465–472. [Google Scholar] [CrossRef] [Green Version]
  93. Akhavan, R.; Talebi, K.S.; Zenner, E.K.; Safavimanesh, F. Spatial patterns in different forest development stages of an intact old-growth Oriental beech forest in the Caspian region of Iran. Eur. J. For. Res. 2012, 131, 1355–1366. [Google Scholar] [CrossRef]
  94. Hassani, M.; Amani, M. Investigation on some qualitative and quantitative characteristics of oriental beech in the optimal phase (Case study: Sangdeh, Caspian forests of Iran). Iran. J. For. Poplar Res. 2009, 17, 134–148. [Google Scholar]
  95. Yildiz, O.; Sarginci, M.; Eşen, D.; Cromack, K., Jr. Effects of vegetation control on nutrient removal and Fagus orientalis, Lipsky regeneration in the western Black Sea Region of Turkey. For. Ecol. Manag. 2007, 240, 186–194. [Google Scholar] [CrossRef]
  96. Yildiz, O.; Eşen, D.; Sarginci, M. Long-term site productivity effects of differentRhododendroncontrol methods in eastern beech (Fagus orientalisLipsky) ecosystems in the Western Black Sea region of Turkey. Soil Use Manag. 2009, 25, 28–33. [Google Scholar] [CrossRef]
  97. Eşen, D. Ecology and Control of Rhododendron (Rhododendron ponticum L.) in Turkish Eastern Beech (Fagus orientalis Lipsky) Forests. Ph.D. Thesis, Virginia Tech, Blacksburg, VA, USA, 2000. [Google Scholar]
  98. Durkaya, B.; Durkaya, A.; Onal, G.; Kaptan, S. Evaluation of the effects of various factors on aboveground and belowground biomass storage capacity of Rhododendron ponticum. Bosque 2018, 39, 95–106. [Google Scholar] [CrossRef] [Green Version]
  99. Akgul, M.; Korkut, S.; Camlibel, O.; Candan, Z.; Akbulut, T. Wettability and surface roughness characteristics of medium density fiberboard panels from rhododendron (Rhododendron ponticum) biomass. Maderas. Ciencia y Tecnología 2012, 14, 185–193. [Google Scholar] [CrossRef] [Green Version]
  100. Akgul, M.; Camlibel, O. Manufacture of medium density fiberboard (MDF) panels from rhododendron (R. ponticum L.) biomass. Build. Environ. 2008, 43, 438–443. [Google Scholar] [CrossRef]
  101. Yildiz, O.; Eşen, D.; Karaoz, O.M.; Sarginci, M.; Toprak, B.; Soysal, Y. Effects of different site preparation methods on soil carbon and nutrient removal from Eastern beech regeneration sites in Turkey’s Black Sea region. Appl. Soil Ecol. 2010, 45, 49–55. [Google Scholar] [CrossRef]
  102. Nagel, T.A.; Diaci, J. Intermediate wind disturbance in an old-growth beech-fir forest in southeastern Slovenia. Can. J. For. Res. 2006, 36, 629–638. [Google Scholar] [CrossRef]
  103. Szwagrzyk, J.; Szewczyk, J. Is natural regeneration of forest stands a continuous process? A case study of an old-growth forest of the Western Carpathians. Pol. J. Ecol. 2008, 56, 623–634. [Google Scholar]
  104. Kozlowski, T. Physiological ecology of natural regeneration of harvested and disturbed forest stands: Implications for forest management. For. Ecol. Manag. 2002, 158, 195–221. [Google Scholar] [CrossRef]
  105. Agestam, E.; Eko, P.-M.; Nilsson, U.; Welander, N.T. The effects of shelter wood density and plot preparation on natural regeneration of Fagus sylvatica in southern Sweden. For. Ecol. Manag. 2003, 176, 61–73. [Google Scholar] [CrossRef]
  106. Sargıncı, M. Batı Karadeniz Kayın (Fagus orientalis Lipsky) Ekosistemlerinde Diri-örtü Control Yöntemlerinin Toprak Verimlilig˘ine Etkisi. In Yüksek Lisans Tezi; Abant Ízzet Baysal Universitesi: Düzce, Turkey, 2005. [Google Scholar]
  107. Kissling, M.; Hegetschweiler, T.; Rusterholz, H.-P.; Baur, B. Short-term and long-term effects of human trampling on above-ground vegetation, soil density, soil organic matter and soil microbial processes in suburban beech forests. Appl. Soil Ecol. 2009, 42, 303–314. [Google Scholar] [CrossRef]
  108. Bassett, I.E.; Simcock, R.C.; Mitchell, N.D. Consequences of soil compaction for seedling establishment: Implications for natural regeneration and restoration. Austral Ecol. 2005, 30, 827–833. [Google Scholar] [CrossRef]
Figure 1. Locations of the permanent research plots with Fagus orientalis Lipsky forest stands in the Düzce province in the Black Sea Region of Turkey.
Forests 11 00603 g001
Figure 2. Horizontal structure of the tree layer and natural regeneration on permanent research plots (PRP) 1–5.
Forests 11 00603 g002
Figure 3. Frequency in each diameter class (left) and height curves produced with Näslund function (right) for Fagus orientalis Lipsky of each permanent research plot (PRP); R2 indicates coefficient of determination.
Forests 11 00603 g003
Figure 4. A histogram of diameter classes of rhododendron basal diameters on PRP.
Forests 11 00603 g004
Figure 5. A histogram of the height frequencies of recruits according to tree species on permanent research plots (PRP) 1–5.
Forests 11 00603 g005
Figure 6. Horizontal structure of the natural regeneration of beech stands on permanent research plots (PRP) 1–5 expressed by L-function; black line represents the L-function for real distances of trees on plots, thick blue line shows the mean course for random spatial pattern of trees, and two thinner central curves represent a 95% confidence interval; when the black line of tree distribution on plot is below this interval, it indicates a tendency of individuals towards the regular pattern, and if it is above this interval, it suggests a tendency to aggregation.
Forests 11 00603 g006
Figure 7. Relationships of the spatial pattern of recruits and the overstory expressed by the pair correlation function on permanent research plots (PRP) 2 (rhododendron cleared) and permanent research plots 4 (no intervention); bold black line represents the pair cross function for real distances of trees; blue line on the level of g (r) = 1 represents the mean course for random spatial distribution of trees; and two thick blue curves represent 95% interval of reliability; if the observed value (black line) exceeds the upper (respectively lower) limit of the simulation interval, it indicates significant aggregation—positive relationship between two tested groups (respectively inhibition—negative relationship).
Forests 11 00603 g007
Figure 8. Ordination diagram showing results of unconstrained principal component analysis of relationships between stand parameters (Age—mean stand age, DBH—quadratic breast height diameter, Tree Height—mean stand height, Volume—of stand, Tree Number, Basal Area, Crown Closure, Crown projection area, and SD index — stocking), natural regeneration parameters (RegNumber and RegHeight), rhododendron cover (RhodCover), and diversity indices of tree layer (R—aggregation index, A—Arten-profile index, TMd/h—structural differentiation indexes, and B—total diversity index); Codes: ●, ▼, ▲, ♦, ■ indicate PRP with the number of transects (A–D) and color permanent research plots with (light grey) or without (dark grey) rhododendron clearance.
Forests 11 00603 g008
Table 1. Basic stand and site characteristics of the permanent research plots (PRP) with Fagus orientalis Lipsky forest stands in the Düzce province in the Black Sea Region of Turkey.
PRPLatitude (N)Longitude (E)Age of Tree Layer (y)Altitude (m)ExposureSlope (°)Rhododendron Cover (%)
140°51′42.1″31°18′12.3″179586N3197
240°51′37.1″31°18′24.7″134671NW1881
340°51′39.4″31°18′28.0″134675NW160
440°51′37.8″31°18′27.3″134683N153
540°52′01.1″31°20′02.4″155827NW2093
Table 2. Overview of indices describing the stand structure and their common interpretation.
CriterionQuantifiersLabel ReferenceEvaluation
Species diversityRichnessD[73]minimum D = 0, higher D = higher values
HeterogeneityH′[74]minimum H′ = 0, higher H′ = higher values
EvennessE[75]range 0–1; minimum E = 0, maximum E = 1
Vertical diversityArten-profile indexA[78]range 0–1; balanced vertical structure A < 0.3; selection forest A > 0.9
Structure differentiationDiameter dif.TMd[76]range 0–1; low TM < 0.3; very high differentiation TM > 0.7
Height dif.TMh
Crown dif.K[77]minimum K = 0, higher K = higher values
Horizontal structureIndex of nonrandomnessα[67,68]mean value α = 1; aggregation α > 1; regularity α < 1
Aggregation indexR[69]mean value R = 1; aggregation R < 1; regularity R > 1
Index of cluster sizeICS[71]mean value ICS = 1; aggregation ICS > 1; regularity ICS < 1
Complex diversityStand diversityB[77]monotonous structure B < 4; uneven structure B = 6–8; very diverse structure B > 9
Table 3. Structural characteristics of forest stands on permanent research plots in 2016.
PRPAgeDBH ± SEhvNBAVPAIMAICCCPASDI
ycmmm3trees ha−1m2 ha−1m3 ha−1m3 ha−1 y−1m3 ha−1 y−1%ha
117939.3 ± 1.924.061.5538146.15897.55.998.84.420.75
213436.2 ± 1.821.891.1828128.83316.03.385.11.900.48
313436.2 ± 2.422.781.3229430.23865.53.992.92.650.51
413449.6 ± 4.125.282.7717533.74856.34.989.42.250.50
515532.5 ± 2.019.630.9536230.03434.83.487.92.110.52
Notes: PRP—permanent research plot, age—average stand age, DBH—mean quadratic breast height diameter, h—mean height, v—average tree volume, N—number of trees per hectare, BA—basal area, V—stand volume, PAI—periodic annual increment; MAI—mean annual increment, CC—canopy closure, CPA—crown projection area, SDI—stand density index.
Table 4. Biodiversity indices of forest stand on permanent research plots.
PRPDH′EATMhTMdKαRICSB
10.1680.0020.0070.4140.3050.2031.6051.1401.1200.0895.810
20.1770.0450.1490.4460.3900.2771.6750.7981.162−0.0405.664
30.1760.0110.0370.4220.4520.2721.5741.0900.804 *0.481 *5.484
40.0760.0000.0000.6020.3530.2571.5911.2641.1090.0165.113
50.0530.0000.0000.6270.3470.3051.9511.2021.0290.1565.626
Notes: PRP—permanent research plot, D—species richness index, H′—species heterogeneity index (entropy), E—species evenness index, A—Arten-profile index, TMd—diameter differentiation index, TMh—height differentiation index, K—crown differentiation, α—nonrandomness index, R—aggregation index, ICS—index of cluster size, B—total diversity index; * statistically significant (α = 0.05) for horizontal structure (α, R, and ICS index).
Table 5. Basic dendrometric characteristics of pontic rhododendron on permanent research plots.
Permanent Research PlotCover %Number of Stem ha−1Basal Stem Diameter mmMean Height cm
19772,1786–80224
28186,8845–73141
30000
439384–2422
59378,1255–62178
Table 6. Representation of recruits per hectare and in percentage according to tree species on permanent research plots (PRP).
SpeciesPRP 1PRP 2PRP 3PRP 4PRP 5
Recruit ha−1%Recruit ha−1%Recruit ha−1%Recruit ha−1%Recruit ha−1%
Fagus orientalis11310061910061,38896103,88899288100
Carpinus betulus0000258141131100
Tilia tomentosa00001300000
11310061910063,981100105,075100288100
Table 7. Biodiversity indices of natural regeneration on permanent research plots.
PRPDH′EATMhαRICS
10.0000.0000.0000.4730.5231.986 *0.235 *1.624 *
20.0000.0000.0000.3620.4784.491 *0.478 *3.646 *
30.1810.1710.1560.4030.6517.060 *0.337 *5.065 *
40.0860.0600.0860.2730.28721.053 *0.413 *49.975 *
50.0000.0000.0000.4870.6251.6960.735 *0.354
Notes: see Table 5; * statistically significant (α = 0.05) for horizontal structure (α, R, and ICS index).
Table 8. Correlation matrix describing relationships between stand parameters (Age, DBH, H, N, G, V, CC, CPA, and SDI), diversity indices of tree layer (A, TMd, TMh, R, and B), natural regeneration parameters (Reg. N and Reg. H) and rhododendron cover (Rhod. cover).
AgeDBHHNGVCCCPASDIATMdTMhRBReg. NReg. H
Age1.00
DBH0.301.00
H0.330.82 **1.00
N0.17−0.66 *−0.331.00
G0.430.340.61 *0.401.00
V0.410.49 *0.70 **0.240.97 **1.00
CC0.29−0.020.360.57 *0.70 **0.67 **1.00
CPA0.51 *−0.060.270.65 *0.71 **0.66 *0.85 **1.00
SDI0.400.160.47 *0.58 *0.98 **0.91 **0.75 **0.77 **1.00
A0.21−0.42−0.220.52 *0.09−0.030.100.120.181.00
TMd−0.250.09−0.29−0.58 *−0.60 *−0.52 *−0.60 *−0.53 *−0.65 *−0.62 *1.00
TMh−0.34−0.35−0.66 *−0.28−0.70 **−0.68 **−0.59 *−0.51 *−0.67 **−0.300.76 **1.00
R0.09−0.090.130.240.310.270.200.180.320.09−0.44−0.301.00
B−0.27−0.70 **−0.63 *0.61 *−0.05−0.130.160.220.100.10−0.020.420.101.00
Reg. N−0.250.57 *0.41−0.54 *0.010.200.03−0.13−0.10−0.52 *0.230.03−0.12−0.141.00
Reg. H0.58 *−0.36−0.360.60 *0.170.060.120.340.270.43−0.210.090,120.47 *−0.52 *1.00
Rhod. cover0.41−0.45 *−0.320.56 *0.180.000.050.210.270.57 *−0.41−0.090.430.17−0.87 **0.70 **
Notes: see Table 3, Table 4, and Figure 8; * statistically significant at the level p < 0.05, ** p < 0.001.

