Article

Community Attributes Predict the Relationship between Habitat Invasibility and Land Use Types in an Agricultural and Forest Landscape

College of Forestry and Landscape Architecture, South China Agricultural University, Guangzhou 510642, China
*
Author to whom correspondence should be addressed.
Forests 2019, 10(10), 867; https://doi.org/10.3390/f10100867
Submission received: 1 August 2019 / Revised: 15 September 2019 / Accepted: 27 September 2019 / Published: 3 October 2019
(This article belongs to the Special Issue Control and Management of Invasive Species in Forest Ecosystems)

Abstract

:
Finding ecosystem or community level indicators for habitat invasibility may provide natural resource managers with environmentally friendly measures to control alien plant invasion; yet, ecosystem invasibility remains understudied. Here, we investigated alien plant invasion into various ecosystems representing different land use types in a subtropical peri-urban area of south China. Four invasive alien species were found from five out of the six ecosystems. Lower plant diversity in both the overstory and understory was consistently associated with more severe alien plant invasion to the ecosystems. The highest total abundance and plot occurrence of the invasive plants were found in the agroforestry ecosystem representing the highest disturbance. At plot scale, an increase in invasion severity was associated with a significant decrease in overstory stem density, species richness, and diversity, but with a significant increase in overstory plant dominance. The understory community attributes in response to the increase in invasion severity followed similar patterns, except that the stem density increased with invasion severity. Higher canopy openness and thus lower leaf area index and greater understory radiation were associated with higher invasion severity of invasive plants to the understory habitat. For predicting total abundance of the invasive species, the most important variable is land use type, while for the abundance of Lantana camara and Mikania micrantha, the most important predictor variable is overstory Berger–Parker index and canopy openness, respectively. Canopy structure and understory gap light regimes were among the most important factors determining the abundance of the worst invasive plant Mikania micrantha. Our results demonstrate that land use types with varying disturbance regimes determine the spatial heterogeneity in plant diversity and community structure, which predicts alien plant invasion and habitat invasibility; and that the severity of alien plant invasion in turn is a good indicator of habitat disturbance across the ecosystems.

1. Introduction

Plant invasion has been recognized as one of the major factors threatening biodiversity, ecosystem health, and ecosystem services, and one of the major economic costs to the agricultural and forestry sectors [1,2,3]. Predicting and controlling alien plant invasion will help maintain biodiversity and prevent the local ecosystems from ecological and economic losses. However, limited knowledge of the indicators of alien plant invasion and the interactions between invasive plants and the resident communities has been an obstacle to achieving this goal. Although plant invasion is a common phenomenon across the terrestrial ecosystems, the invasibility of a particular ecosystem, which is defined as the vulnerability of its associated habitat and biological community to invasion [4,5], is dependent on various biotic and abiotic factors, such as species diversity and composition, community structure, land use types, soil functioning, and disturbance regimes [6,7,8,9]. At ecosystem scale, finding the indicators of alien plant invasion may be crucial for forest and natural resource managers. Such indicators can provide ecosystem managers with environmentally friendly measures to control invasive plants, such that conventional approaches such as chemical methods by herbicides and mechanical methods that either pollute the soils or incur tremendous workforce can be avoided.
Habitat heterogeneity provides plants with diverse niches and is conducive to the growth and distribution of the resident plant species as well as the invasive ones [10]. Species diversity, composition, and the structure of the resident community establish and shape the micro-habitats [11] and consequently affect the colonization of alien invasive plants [12,13]. Various mechanisms have been proposed to explain plant invasion and habitat invasibility. Studies on the biodiversity–ecosystem functioning relationships have demonstrated that higher plant diversity will increase the resistance of a resident ecosystem to alien plant invasion [14,15]. The biotic resistance hypothesis is commonly used to explain the negative relationship between native plant diversity and habitat invasibility [16]. As an important mechanism of the biotic resistance hypothesis, the resource use complementarity effect suggests that different plant species use different types and quantities of environmental resources [17]. The native individuals reduce the invasibility of the resident community by fully occupying resource niches, so that there are less ecological niches and resources available for alien plants to become successful invaders [18,19]. Alternatively, alien plants will be suppressed by the resident community through niche filling or competitive exclusion during vegetation recovery [20]. However, the relationships between plant diversity and invasibility may be scale dependent [21,22], and positive diversity–invasibility relationships have been reported in a number of cases [23,24,25].
A growing number of studies have demonstrated that land use types and human activities have a major effect on the success of alien plant invasion [26,27,28,29], yet the interactions between the resident plant community structure and the severity of alien plant invasion remains understudied. As land use types represent human disturbance of various intensity [28], examining the relationships between alien plant invasion and environmental factors across various land uses will reveal how resident communities respond to alien plant invasion, thus providing management and conservation implications for the local ecosystems. During the past decades, the Pearl River Delta of south China has experienced rapid development due to industrialization and urbanization driven by both international as well as domestic investment [30,31]. However, such an incomplete urbanization, or peri-urbanization [32], has left a mosaic of agricultural and forest landscapes with some industrial establishments in the peri-urban fringes of the area. Here, we examined several such land use types in relation to alien plant invasion with the objective of answering the following questions: (1) How do invaded and uninvaded communities differ in stand structure, species composition, and diversity? (2) Are land use types and management regimes the major determinants for alien plant invasion at the ecosystem level? (3) Are species diversity, composition, functional diversity, and canopy and gap light parameters significantly associated with alien plant invasion severity? (4) What are the most important biotic or abiotic factors determining the severity of alien plant invasion?

2. Materials and Methods

2.1. Study Area

Our study area was located in the peri-urban fringe of Dongguan (113°31′–114°15′ E, 22°39′–23°09′ N), a rapidly developing region in the southeast part of the Pearl River Delta of South China [33]. Dongguan is situated between the two metropolitan cities, Shenzhen to the south and Guangzhou to the north. The area has a subtropical monsoon climate. Mean annual temperature is 23.1 °C, with the maximum temperature of 37.8 °C in July and the minimum temperature of 3.1 °C in January. Mean annual precipitation is 1819 mm, approximately 80% of which concentrated during April to September to form a rainy season [34].
Major land uses in the peri-urban fringes of Dongguan form diverse agricultural and forest landscapes, including protected natural forests, forest farms, orchards, and paddy fields. Most of the forest farms and orchards have been withdrawn from production and converted to noncommercial ecological forests by planting native trees.

2.2. Sampling Design and Data Collection

We selected six sites in the peri-urban fringe of Dongguan for our study. Each of the sampling sites corresponded to one ecosystem representing a unique land use type (Table 1). In each of the six land use types, we set up five rectangular plots separated by at least 20 m. Each plot was 20 × 50 m and was further divided into ten 100-m2 contiguous square quadrats for field data collection. All the trees ≥ 1 cm in every quadrat were tallied and recorded by species identity, diameter at breast height (DBH), and tree height. Understory plant census was carried out in five 1 × 1-m sub-quadrats within each 100-m2 quadrat.
We measured canopy openness, leaf area index (LAI), and understory radiation in all the quadrats using hemispherical photography. Hemispherical photography is a photogrammetric technique that involves field image acquisition using a digital camera and image analysis with a computer program. We took a hemispherical photograph at the center of each 100-m2 quadrat, using a Nikon 4500 Coolpix® digital camera fitted with a Nikkor FC-E8 fisheye converter. The camera was mounted on a tripod 1.65 m above the ground and pointed upwards to the sky. All the hemispherical images were acquired at 2272 × 1704 pixels and saved as fine quality JPEG format. To ensure uniform light conditions and minimize glare from direct sunlight, photographs were taken in the afternoon under overcast conditions and still air [35,36]. After the hemispherical images were downloaded, we analyzed all the images using WinScanopy Pro 2008 (Regent Instruments Inc. Quebec, QC, Canada) to extract canopy openness, leaf area index (LAI) and understory radiation parameters, i.e., direct photosynthetically-active photon flux density (direct PPFDunder) and diffuse photosynthetically-active photon flux density (diffuse PPFDunder). These parameters represent canopy structure and gap light regimes that might affect understory plant patterns and invasive alien plant invasion.

2.3. Data Analysis

We constructed five primary datasets based on the field data: (1) a dataset with canopy tree abundance; (2) a dataset with all understory plants, as well as (3) one with the invasive alien plants removed; (4) a dataset with only invasive plants, and (5) a dataset with canopy openness, LAI and understory radiation data. With the canopy plant dataset and understory plant dataset with invasive alien plants removed, we calculated six community metrics by quadrat, i.e., number of stems or stem density (stems per 100-m2 quadrat), species richness, Berger–Parker index, Shannon–Wiener index, functional richness, and functional dispersion, to generate secondary datasets. Both Berger–Parker and Shannon–Wiener indices are indicators of community structural diversity [37]. From the invasive plant dataset, we defined an invasion severity gradient according to the total abundance of invasive alien plants in each quadrat. The invasion severity gradient was defined in five classes as follows: 1 = Uninvaded; 2 = Low (1 stem); 3 = Medium (2–5 stems); 4 = High (≥6 stems). Our final step was to merge the secondary datasets of diversity metrics with invasive plant abundance, LAI and gap light variables into one integrated dataset. The values of one grouping variable for land use types and one for invasion severity were also assigned to each quadrat of the integrated dataset.
We generated multiple rank–abundance plots to contrast the differences in species richness and abundance patterns across land use types for the forest canopy and the understory. Rank–abundance plot, also called diversity–dominance curve, visualizes the community dominance and evenness as well as species richness of an ecosystem in a two-dimensional graph. A steeper curve indicates greater community dominance and less evenness of species patterns in an ecosystem [37,38].
To evaluate the effects of diversity metrics of both the canopy and understory communities on understory plant invasion, we tested the changes in diversity metrics for significance across invasion severity gradients using Kruskal–Wallis test. Kruskal–Wallis test, a nonparametric alternative to one-way analysis of variance (ANOVA), is the appropriate method for comparing two or more independent samples or groups of equal or different sample sizes, especially for field ecology data [39].
To assess the differences in species composition of both the canopy and understory communities across the invasion severity gradient, we performed multi-response permutation procedures (MRPP) on the plot-by-species datasets of both the canopy and understory plants.
To detect plant species with significant indicator values, which represent faithfulness to a particular invasion severity class, we performed indicator species analysis (ISA) using the Dufrêne and Legendre method [40]. The method combines information on the concentration of species abundance in a particular group (relative abundance, RA) and the faithfulness of occurrence of a species in a particular group (relative frequency, RF). The indicator value for a given species in a particular invasion severity class is then calculated by multiplying RA and RF and the result is expressed as a percentage [40]. Statistical significance of the highest indicator value of a given species across the invasion severity classes was evaluated using randomization method.
To determine which biotic or abiotic factors have the greatest impact on understory alien plant invasion, we performed Random Forest to visualize variable importance. Random Forest is a data mining technique developed by Breiman and can handle multiple categorical variables and quantitative variables in one analysis [41,42]. Sixteen quantitative variables including overstory and understory diversity metrics, canopy structure and gap light attributes, as well as two categorical variables, land use types and management regimes, were used as predictor variables in the Random Forest regression model, while the abundance of invasive alien plants were used as response variables. The Random Forest regression model produces bar charts showing the predictor variable importance for the given response variable.
Rank-abundance curve analysis, Kruskal–Wallis test, and Random Forest modeling were performed with Statistica 8.0 (Statsoft, Inc., Tulsa, OK, USA), while MRPP and ISA, as well as the calculation of community metrics, were performed with PC-ORD 7.0 (MjM Software, Gleneden Beach, OR, USA).

3. Results

3.1. Effect of Land Use and Species Composition on Plant Invasion

The six ecosystems representing various land use types differed in management and disturbance regimes (Table 1), species richness, total abundance (Table 2), and community structure (Figure 1). A decreasing trend in species richness from natural forest through the agroforestry ecosystem was associated with increasing disturbance. The strictly protected natural forest has 68 species in the overstory and 192 species in the understory, while the most-disturbed agroforestry ecosystem has 25 species in the overstory and 82 native species in the understory (Table 2). Lower plant diversity in both the overstory and understory was consistently associated with more severe alien plant invasion to the ecosystems as indicated by the total number of invasive plant individuals and the number of subplots invaded by the invasive plants (Table 2).
At ecosystem level, alien plant invasion intensified with disturbance and stand history. No invasive plants were found in the natural broadleaf ecosystem in the Yinpingshan Nature Reserve, but even in the natural forest in a neighboring forest park with moderate disturbance from tourist visits, two invasive plant individuals were found from the sampling plots there. Of all the four invasive alien plant species (Table 2), Mikania micrantha, a fast-growing, perennial vine from the Compositae family, is one of the world’s worst alien invasive weeds [43]. It has ruined forests and agricultural ecosystems and caused tremendous economic losses across tropical and subtropical China [44]. Except for the two natural forest ecosystems, Mikania micrantha occurred in all the other ecosystems. Alien plant invasion severity was associated with the disturbance regimes. The total number of invasive plants increased with disturbance at the ecosystem level (Table 2). The highest total abundance and plot occurrence of the invasive alien plants were found in the agroforestry ecosystem with the highest disturbance. Species richness is a good indicator for alien plant invasion at the ecosystem level. The uninvaded forest ecosystem had the highest species diversity with 68 overstory species and 192 understory plant species, while the severely invaded agroforestry ecosystem had only 25 overstory species and 86 understory resident plant species (excluding the invasive alien plants; Table 2).

3.2. Relationships of Alien Plant Invasion to Community Attributes

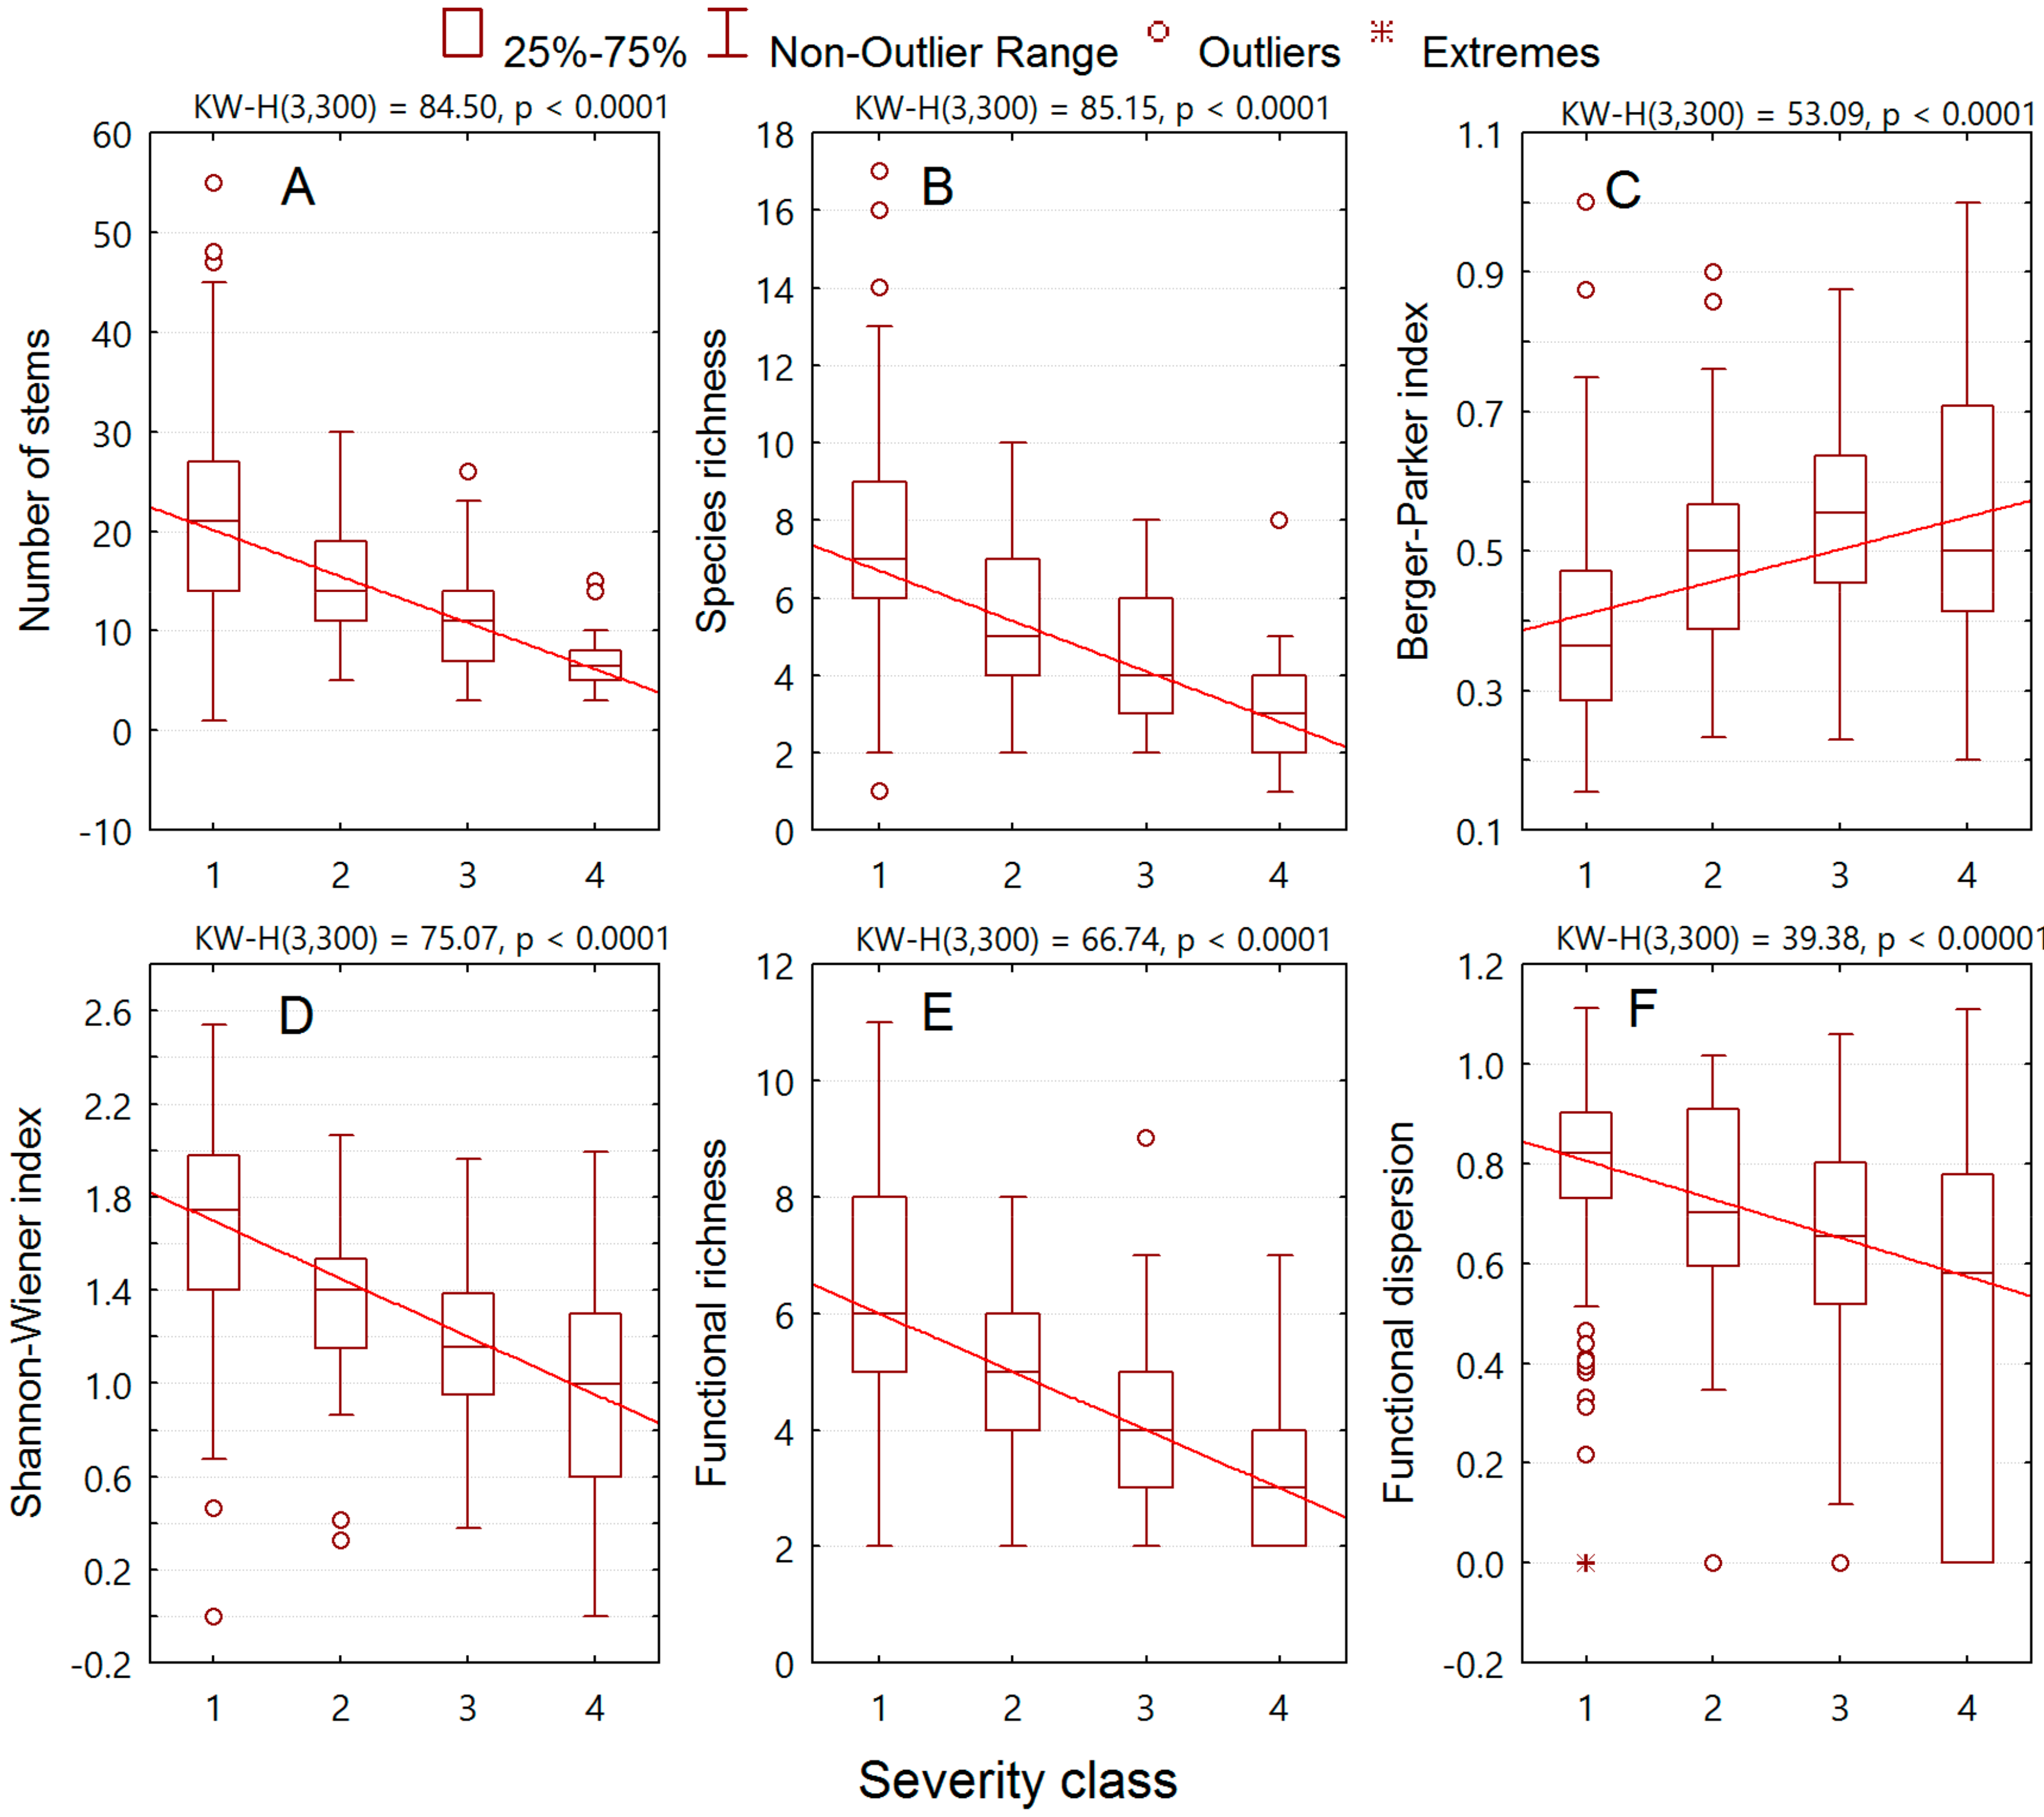
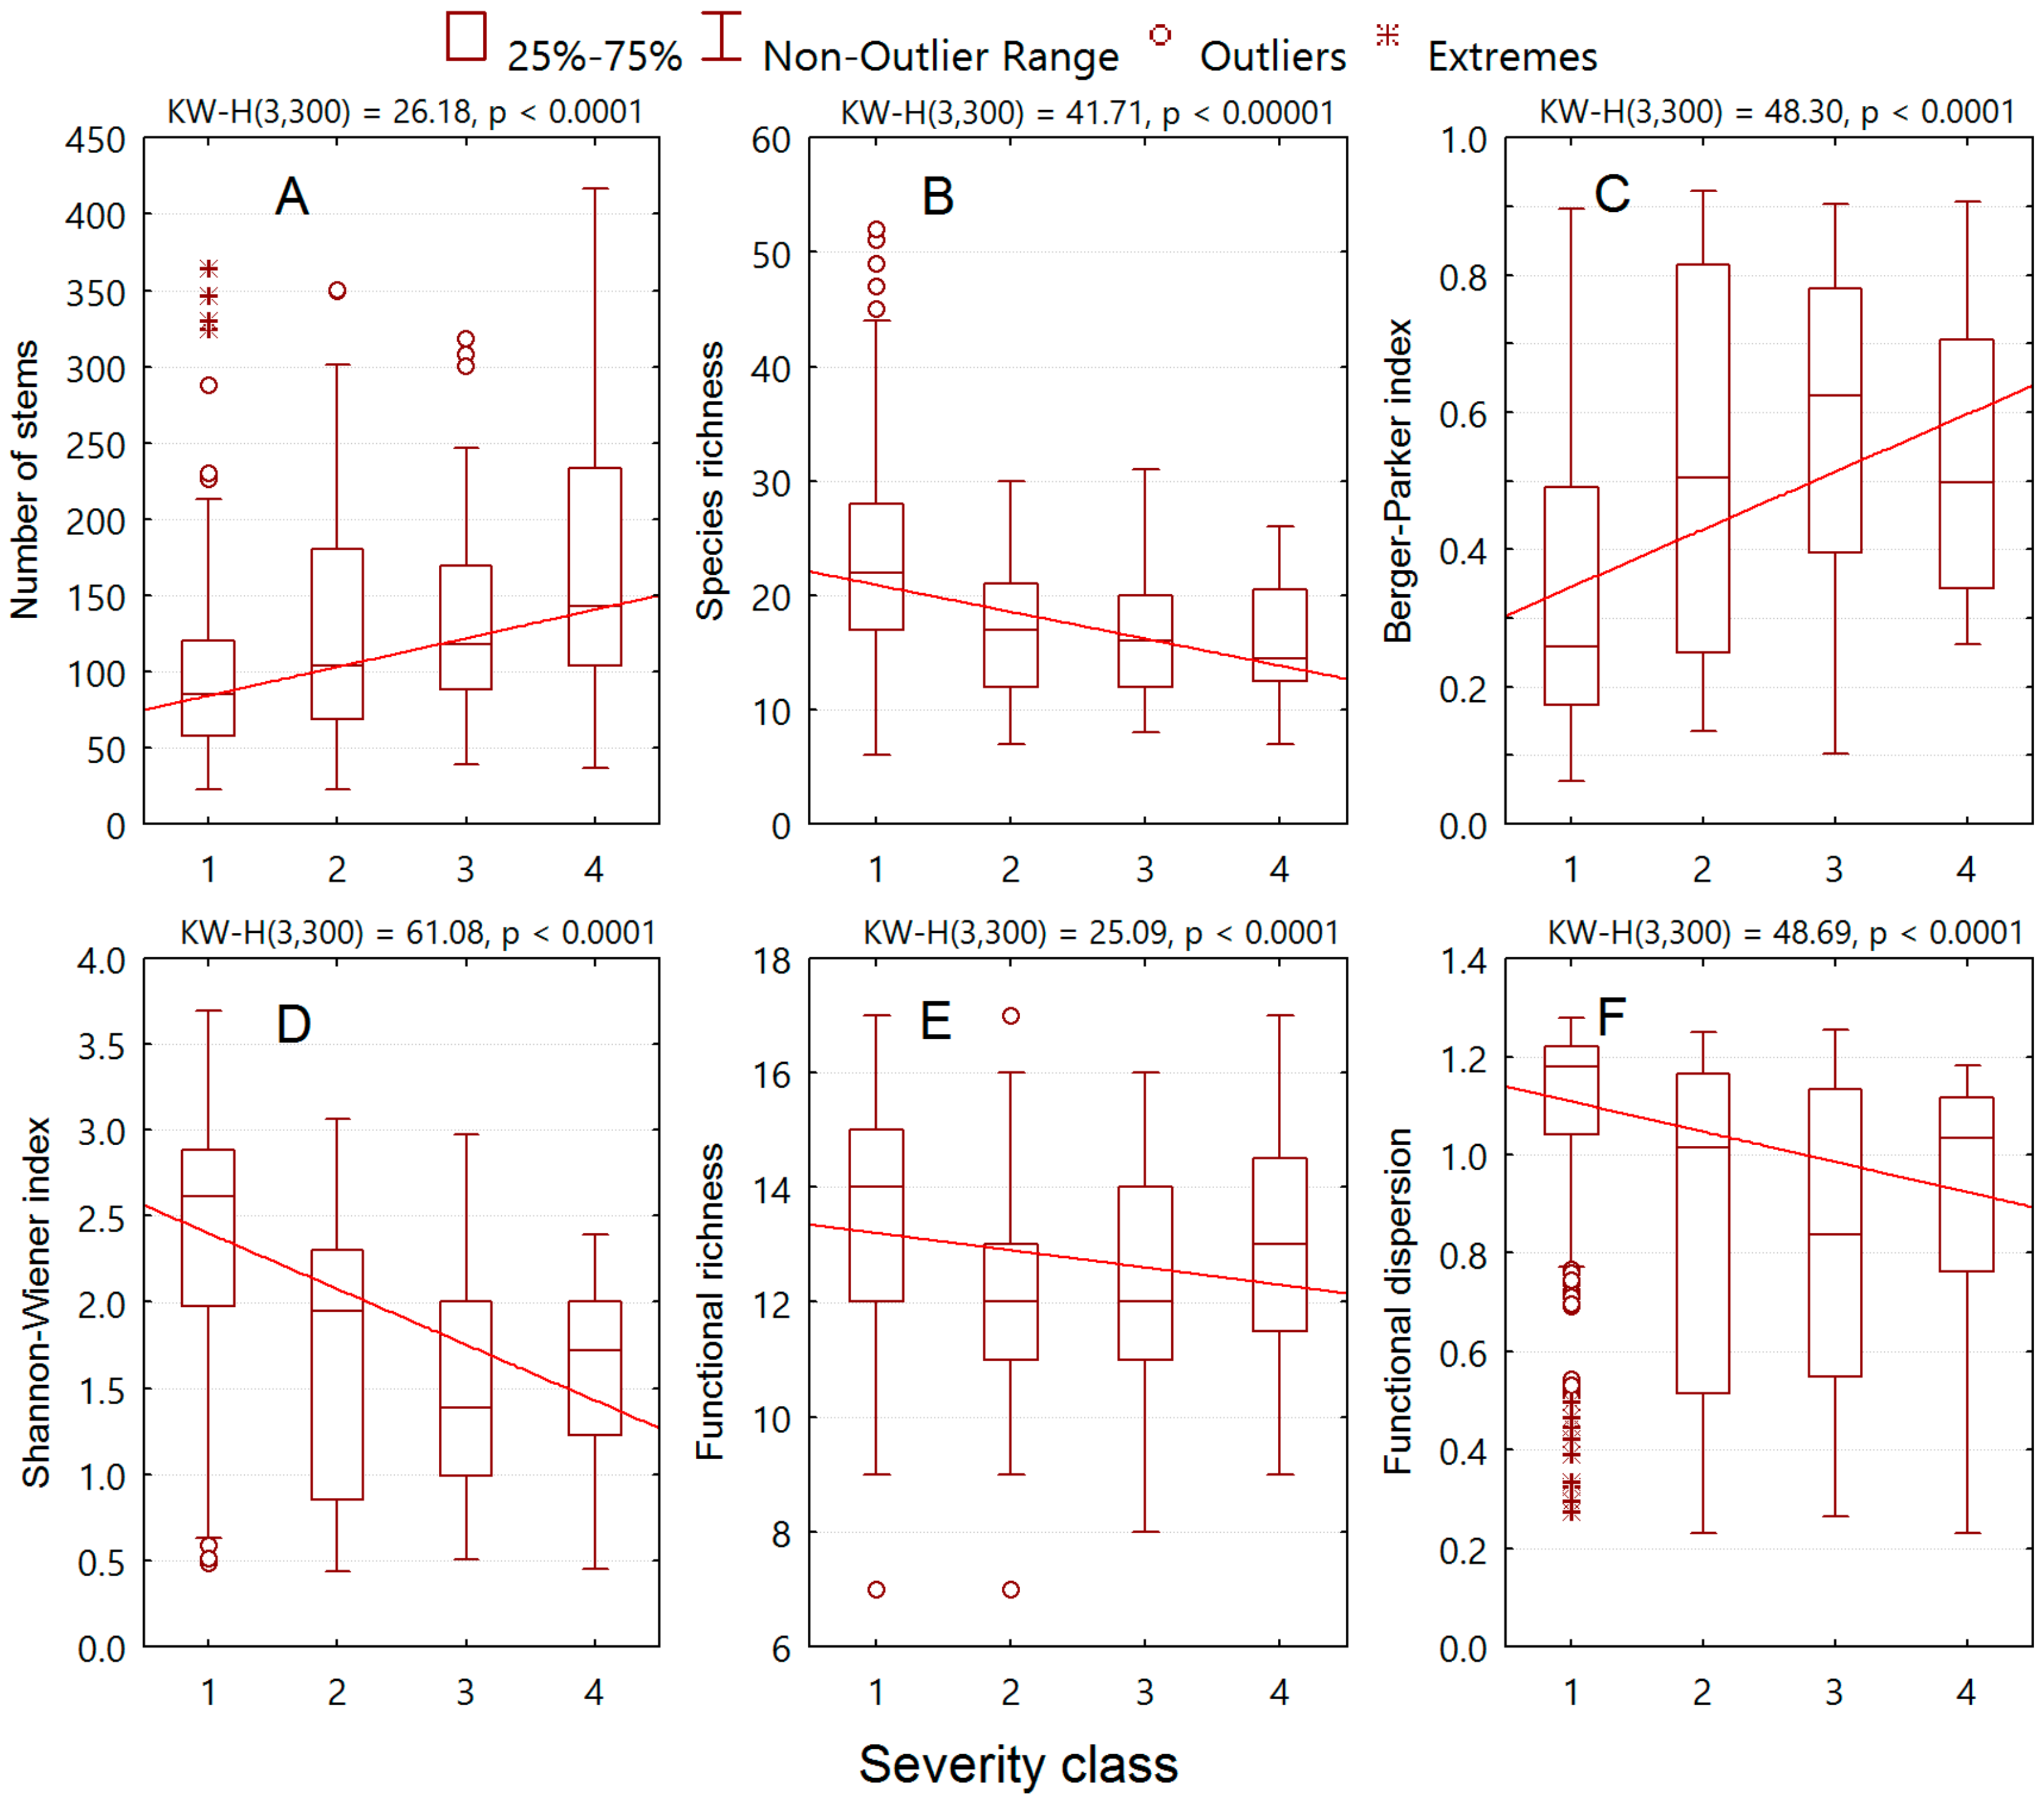
At plot scale, an increase in invasion severity is associated with the significant decrease in overstory stem density (Figure 2A), species richness (Figure 2B), Shannon–Wiener index (Figure 2D), and functional diversity (Figure 2E,F), but with the significant increase in dominance as indicated by Berger–Parker index (Figure 2C). The understory community parameters in response to the increase in invasion severity followed similar patterns (Figure 3B–F) with the overstory community, except that the stem density increased with invasion severity in the understory (Figure 2A).
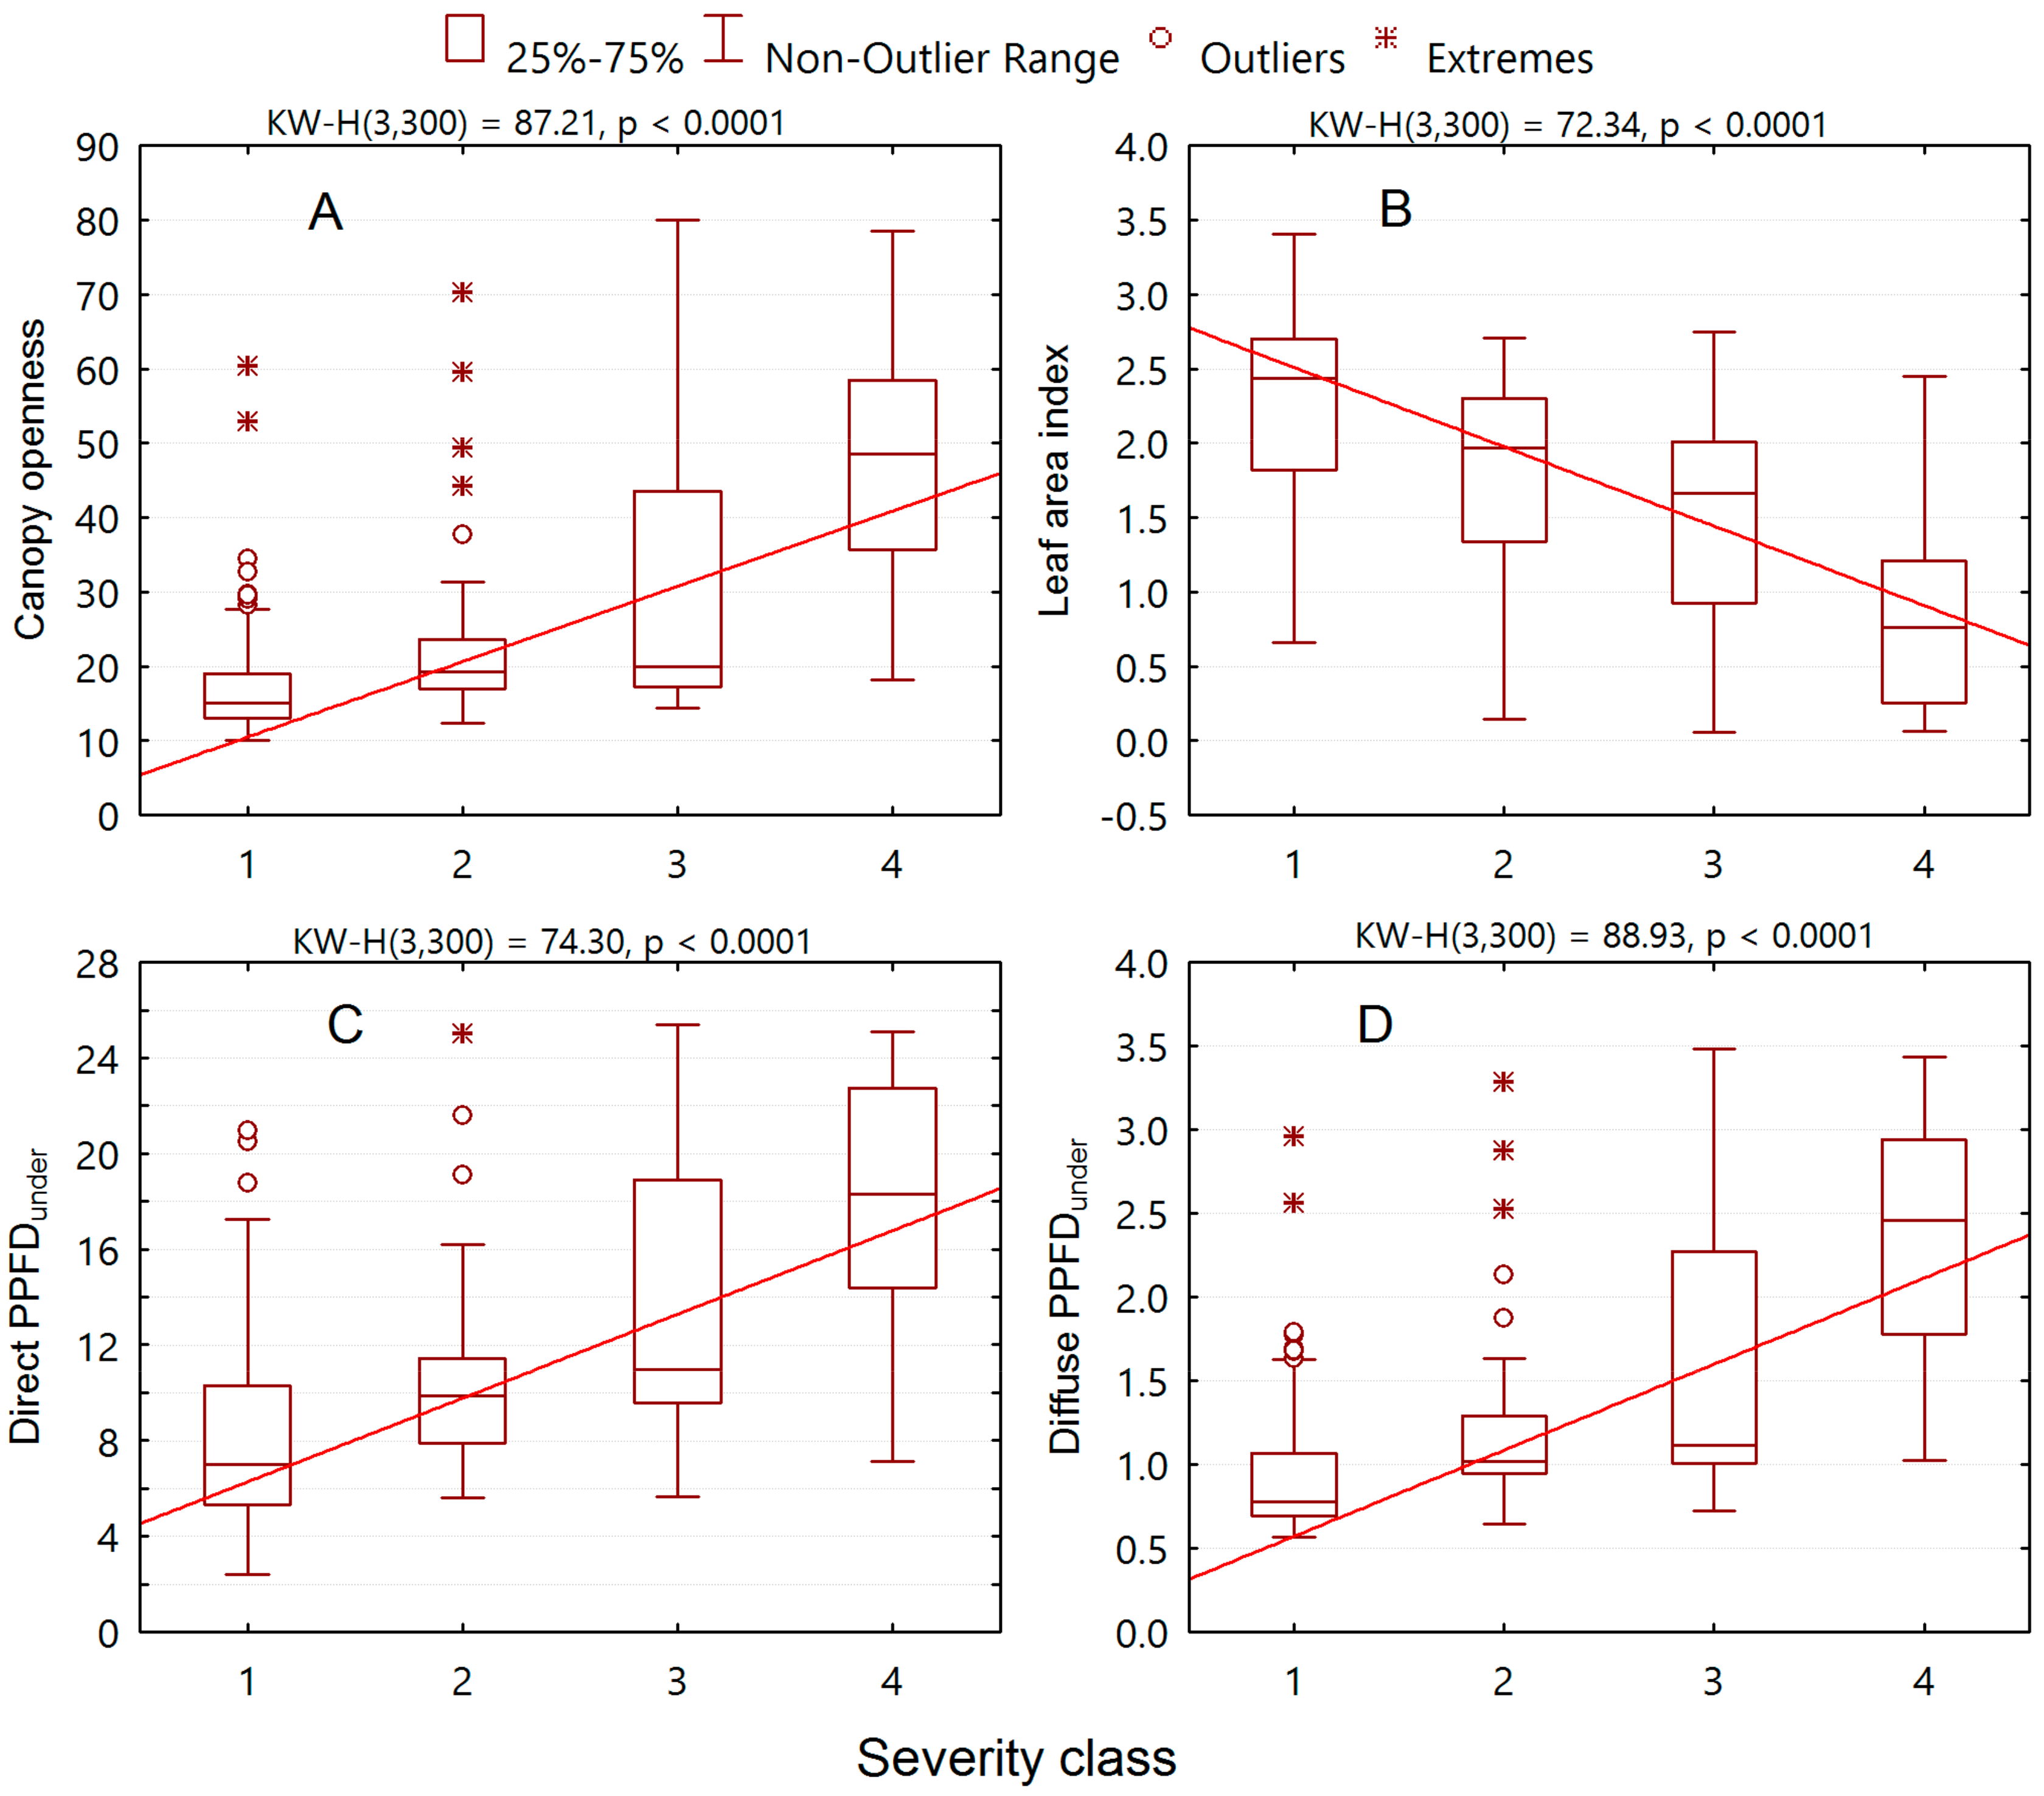
Canopy structure and understory gap light regimes significantly varied across an invasion severity gradient. Higher canopy openness and thus greater understory radiation were associated with higher invasion severity of alien plants to the understory habitat (Figure 4A,C,D), whereas the changes in leaf area index were negatively associated with invasion severity (Figure 4B).
Species composition in both the overstory and understory of the six ecosystems significantly differed across the severity classes by overall comparison (Table 3). By pairwise comparison, except for the Low vs. Medium severity classes, significant differences were found in all other pairs (Table 3).

3.3. Indicator Species of the Resident Community for Alien Plant Invasion

Eight understory species were detected as indicators of uninvaded habitats (Table 4). These are the common floristic elements native to the subtropical vegetation [42]. Twelve other species were detected as indicators of habitats with various invasion severities (Table 4). Two indicator species from the overstory corresponded with land use type. The fruit tree Dimocarpus longan from the agroforestry ecosystem was associated with habitats of high invasion severity, while the Acacia mangium from the artificially rehabilitated forest was associated with medium invasion severity (Table 4). Ten understory species indicative of habitats with low to high invasion severity are light-demanding plants that commonly occur in the open, under canopies with high openness, or in habitats with disturbance [45]. These understory species are similar in ecophysiological aspects with the invasive alien plants [45], especially the worst invasive plant Mikania micrantha.

3.4. Major Drivers for the Alien Plant Invasion

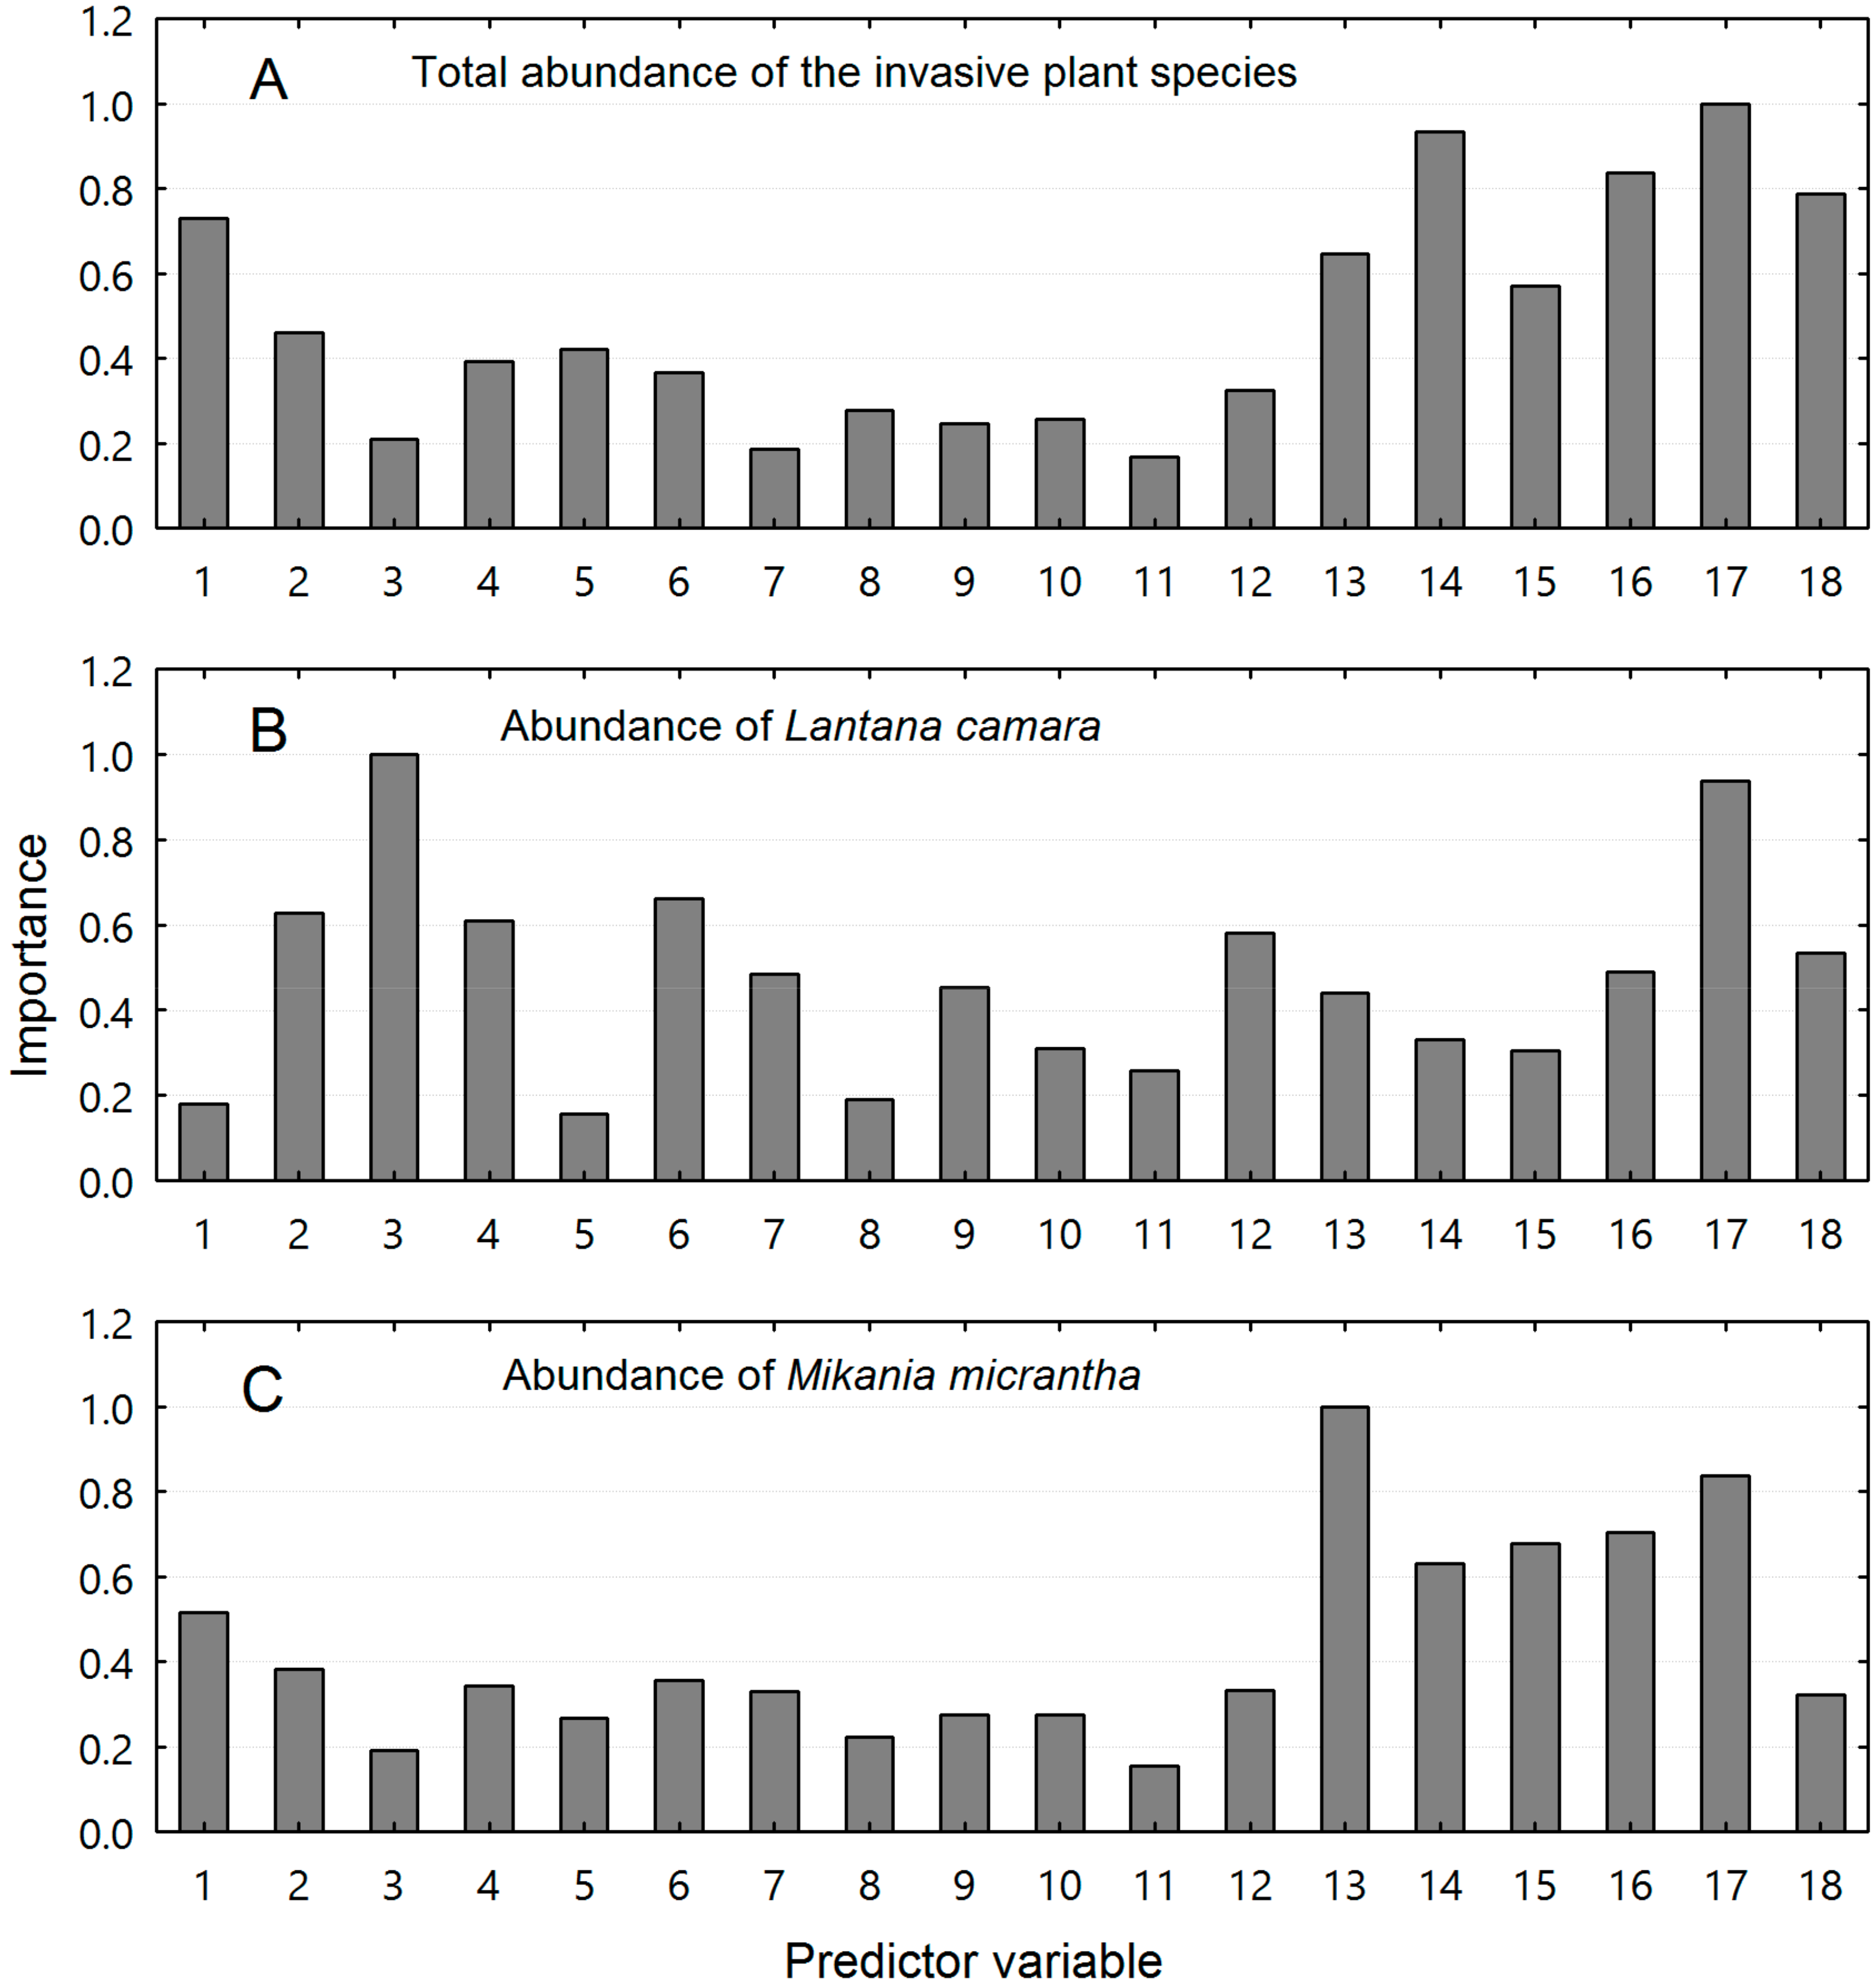
The relative importance of major biotic and abiotic determinants for alien plant invasion were visualized by the bar plots with Random Forest (Figure 5), a data mining algorithm. The most important variable for predicting total abundance of all the invasive species was land use type (Figure 5A), while for the abundance of Lantana camara and Mikania micrantha, the most important predictor variables were overstory Berger–Parker index and canopy openness, respectively (Figure 5B,C). Other important predictors for alien plant invasion included leaf area index, understory diffuse PPFD, management regimes and density of overstory plant individuals for the total invasive plant abundance (Figure 5A); land use type, overstory functional dispersion, overstory species richness, overstory Shannon–Wiener index, understory functional dispersion, and management regimes for predicting the abundance of Lantana camara (Figure 5B); and land use type, understory diffuse PPFD, understory direct PPFD, and leaf area index for predicting the abundance of Mikania micrantha (Figure 5C). Although functional diversity of the understory plants significantly decreased with the invasion severity, surprisingly they were less important as compared with canopy structure and gap light variables for predicting invasive alien plant abundance, especially Mikania micrantha abundance. Canopy structure and understory gap light regimes are among the most important factors determining the abundance of the worst invasive plant Mikania micrantha.

4. Discussion

Land use types of varying disturbance regimes had significant impacts on community structure, species composition and diversity, and these community parameters in turn changed with plant invasion severity. At ecosystem scale, an increasing trend of invasibility was observed from natural forest through the agroforestry ecosystem, corresponding to a decreasing trend of species richness in both the overstory and understory across these land use types. Canopy structure, understory light regimes, community structure, species composition, and plant diversity varied significantly in relation to plant invasion severity. We found that higher canopy openness, understory direct PPFD, and understory diffuse PPFD, as well as lower leaf area index (LAI) were associated with higher invasion severity.
Four invasive alien species were found from five out of the six ecosystems in the subtropical peri-urban area of south China. Lower plant diversity in both the overstory and understory of the resident ecosystems was consistently associated with more severe alien plant invasion to the ecosystems. The highest total abundance and plot occurrence of the invasive plants were found in the agroforestry ecosystem with the highest disturbance. At plot scale, an increase in invasion severity was associated with a significant decrease in overstory stem density, overstory and understory species richness, Shannon–Wiener index, and functional diversity, but with a significant increase in overstory and understory Berger–Parker dominance and understory stem density.
The invasibility of the resident communities to alien plants are heavily affected by their resource availability [46]. Resource availability affects the growth and development of plants [47,48,49]. Higher overstory LAI reduces canopy openness, understory direct and diffuse PPFD, thus leading to lower temperature in the understory [50,51]. Invasive plants found in our study plots are light-demanding plants. Their performance and invasiveness were inhibited by lower light availability and temperature. Overstory plants with different preferences for light resource occupy different space in vertical direction in the community. In a community with higher diversity, trees might use space fully and intercept more light resources, such that less light is able to reach the understory. Similarly, a community with lower diversity in the overstory intercepts less light resource and there will be more light transmitted to the understory [50,52]. Lower stem density in the overstory increases the canopy openness and consequently increases the light resource transmitted to the understory to promote the growth of light-demanding plants, thus leading to higher ecological dominance and lower species diversity in the understory. According to the biotic resistance hypothesis, a community with higher diversity is more resistant to alien plant invasion [16]. The biotic resistance of the resident communities to invasive plants results largely from the resource complementarity effect and the sampling effect [53]. As the resource complementarity effect hypothesis proposed, different understory species complementarily use light and soil resource. A species-rich community use environmental resources more fully and less resource will be left for the alien plants [17]. According to the sampling effect, a species-diverse community is more likely to contain highly suppressive species to inhibit alien plant invasion by competing for resources [54,55] or by producing antagonistic substances [56]. Decreases in stem density and species diversity in the overstory may also increase plant invasion severity by reducing the effects of shading exclusion on invasive plants.
Multi-response permutation procedures (MRPP) reveal significant differences in species composition in both overstory and understory of the resident communities across plant invasion severity classes. Significant differences were also detected by pairwise comparison between the invasion severity classes, except for the Low vs. Medium classes. Overstory plants shape the micro-climate and plant species composition in the understory [50], while changes in understory species composition may lead to changes in species interactions, i.e., competition or facilitation [57], adding to the biotic factors that influence plant invasion severity. Indicator species analysis (ISA) provides a simple and intuitive method to calculate indicator values of specific species in the resident communities for indicating alien plant invasion severity. Conventional ISA usually treats indicator species as a response variable, such as indicator plants of a particular soil gradient [40,58]. Instead, here, we use ISA to find species from the resident community as predictors that are indicative of a particular invasion severity. Eight common understory plant species characteristic of the subtropical flora were detected as indicators of uninvaded habitats, which are characterized by high LAI, low canopy openness, and low understory light resource. Such habitats are resistant to invasion of the light-demanding alien plant species. Ten understory plant species and two overstory plant species were detected as indicators of the invaded habitats. Dimocarpus longan from the agroforestry ecosystem is the overstory fruit tree species indicative of high plant invasion severity, while Acacia mangium from the artificially rehabilitated forest is the overstory timber tree species indicative of medium plant invasion severity. The two ecosystems used to be intensively managed and later were left uncultivated to permit natural or artificially regeneration for noncommercial ecological purposes. All the ten understory species indicative of the invaded habitats are light-demanding plants, with similar habitat requirements to the invasive plants.
We found that land use type was the most important predictor for the total number of invasive plants. Land use type and management regimes exert influences on invasive plants in various ways. Changes in land use types from natural to managed types will alter resource availability and resource use by native plants [59,60,61]. Higher environmental resource availability due to plant exclusion by changes in land use types or management regimes will increase plant invasion severity. The most important predictor variables for the abundance of Mikania micrantha and Lantana camara were canopy openness and overstory Berger–Parker dominance index, respectively. Mikania micrantha, one of the most notorious “plant killers”, is a climbing weed with high photosynthesis and growth rate [43,44]. Climbing plants is usually sensitive to light, heat, and moisture conditions [62]; therefore, canopy openness shaping the understory micro-climate became the most important driver for the invasion severity of Mikania micrantha. Lantana camara, a shrub species competing for space and resources against other standing plant individuals, might be chiefly affected by the crowding effect of other standing neighbors. Higher community dominance and thus lower diversity in the overstory might provide more space, and there might be less shading exclusion of Lantana camara.
As the indicators for disturbance and ecosystem history, land use types and management regimes of a forest ecosystem are associated with plant invasion in various ways [63,64]. Land use types and forest management regimes alter the distribution of environmental resources in an ecosystem both directly and indirectly through changed community structure and species composition [59]. Changes in site conditions and biotic interactions may transform habitat invasibility and the severity of alien plant invasion. For examples, anthropogenic irrigation, fertilization, and burning or fire control can alter soil moisture and nutrients that are fundamental resources for invasive plants [60,61]. Deforestation or reforestation during land use changes may eliminate or increase species diversity. Alterations in species composition and community structure may change the availability of environmental resources for alien plants. Changes in land use types and forest management regimes may also bring alien propagules to the resident community, raising possibilities of alien plant invasion [65]. Our study has identified indicators for habitat and community invasibility; however, further work such as control experiments still needs to be done to enhance our mechanistic understanding of the interactions between plant invasion and the biotic and abiotic indicators of habitat invasibility.

5. Conclusions

Finding indicators of alien plant invasion to the resident communities will provide forest managers an easy way to control plant invasion using ecosystem management methods. Indicators of different scales have been identified for predicting alien plant invasion and the invasion severity. Land use type is the ecosystem-scale indicator that reflects disturbance regimes and management regimes. The community-level indicators including species composition and diversity metrics varied significantly across invasion severity classes, while the species-level indicators were represented by certain species that were directly indicative of a particular invasion severity. Of all these indicators, land use type was the major indicator that encompassed, determined or shaped the other indicators. Our results demonstrate that land use types with varying disturbance regimes determine the spatial heterogeneity in plant biodiversity, species composition and community structure of the resident communities, which predicts alien plant invasion and habitat invasibility; and that the severity of alien plant invasion in turn is a good indicator of habitat disturbance across the ecosystems.

Author Contributions

Z.S. and Y.Z. (Yi Zhou) conceived and designed the study. Y.Z. (Yi Zhou), Y.S., and Y.Z. (Yonglin Zhong) wrote the manuscript. P.X. and M.X. collected the data and discussed the results. Z.S. analyzed the data, prepared the figures, and revised the final manuscript for submission. All the authors participated in field surveys to collect the data, discussed the results, and reviewed and approved the manuscript.

Funding

This research was funded by a grant for non-commercial forest research from the Forestry Department of Guangdong Province, China (Grant No. B366).

Acknowledgments

We thank Zhenkui Li for field plant identification and Guantu Lin for his assistance with plot establishment. We are very grateful to the staff of the Dongguan Municipal Institute of Forestry Research for logistic support during field work.

Conflicts of Interest

The authors declare no conflict of interest.

References

  1. Drake, K.K.; Bowen, L.; Nussear, K.E.; Esque, T.C.; Berger, A.J.; Custer, N.A.; Waters, S.C.; Johnson, J.D.; Miles, A.K.; Lewison, R.L. Negative impacts of invasive plants on conservation of sensitive desert wildlife. Ecosphere 2016, 7, e01531. [Google Scholar] [CrossRef]
  2. Nickerson, K.; Flory, S.L. Competitive and allelopathic effects of the invasive shrub Schinus terebinthifolius (Brazilian pepper tree). Biol. Invasions 2015, 17, 555–564. [Google Scholar] [CrossRef]
  3. Shackleton, R.T.; Witt, A.B.R.; Piroris, F.M.; van Wilgen, B.W. Distribution and socio-ecological impacts of the invasive alien cactus Opuntia stricta in eastern Africa. Biol. Invasions 2017, 19, 2427–2441. [Google Scholar] [CrossRef]
  4. Catford, J.A.; Vesk, P.A.; Richardson, D.M.; Pyšek, P.J.G.C.B. Quantifying levels of biological invasion: Towards the objective classification of invaded and invasible ecosystems. Global Change Biol. 2012, 18, 44–62. [Google Scholar] [CrossRef]
  5. Milbau, A.; Stout, J.C.; Graae, B.J.; Nijs, I.J.B.I. A hierarchical framework for integrating invasibility experiments incorporating different factors and spatial scales. Biol. Invasions 2009, 11, 941–950. [Google Scholar] [CrossRef]
  6. Schrama, M.; Bardgett, R.D. Grassland invasibility varies with drought effects on soil functioning. J. Ecol. 2016, 104, 1250–1258. [Google Scholar] [CrossRef] [Green Version]
  7. Dimitrakopoulos, P.G.; Koukoulas, S.; Galanidis, A.; Delipetrou, P.; Gounaridis, D.; Touloumi, K.; Arianoutsou, M. Factors shaping alien plant species richness spatial patterns across Natura 2000 Special Areas of Conservation of Greece. Sci. Total Environ. 2017, 601, 461–468. [Google Scholar] [CrossRef]
  8. Menzel, A.; Hempel, S.; Klotz, S.; Moora, M.; Pysek, P.; Rillig, M.C.; Zobel, M.; Kuhn, I. Mycorrhizal status helps explain invasion success of alien plant species. Ecology 2017, 98, 92–102. [Google Scholar] [CrossRef]
  9. Rembold, K.; Mangopo, H.; Tjitrosoedirdjo, S.; Kreft, H. Plant diversity, forest dependency, and alien plant invasions in tropical agricultural landscapes. Biol. Conserv. 2017, 213, 234–242. [Google Scholar] [CrossRef]
  10. Stein, A.; Gerstner, K.; Kreft, H. Environmental heterogeneity as a universal driver of species richness across taxa, biomes and spatial scales. Ecol. Lett. 2014, 17, 866–880. [Google Scholar] [CrossRef]
  11. Dawud, S.M.; Raulund-Rasmussen, K.; Domisch, T.; Finer, L.; Jaroszewicz, B.; Vesterdal, L. Is tree species diversity or species identity the more important driver of soil carbon stocks, C/N ratio, and pH? Ecosystems 2016, 19, 645–660. [Google Scholar] [CrossRef]
  12. Arellano-Cataldo, G.; Smith-Ramirez, C. Establishment of invasive plant species in canopy gaps on Robinson Crusoe Island. Plant Ecol. 2016, 217, 289–302. [Google Scholar] [CrossRef]
  13. Song, X.Y.; Hogan, J.A.; Brown, C.; Cao, M.; Yang, J. Snow damage to the canopy facilitates alien weed invasion in a subtropical montane primary forest in southwestern China. For. Ecol. Manag. 2017, 391, 275–281. [Google Scholar] [CrossRef]
  14. Liao, H.X.; Luo, W.B.; Peng, S.L.; Callaway, R.M. Plant diversity, soil biota and resistance to exotic invasion. Divers. Distrib. 2015, 21, 826–835. [Google Scholar] [CrossRef]
  15. Selmants, P.C.; Zavaleta, E.S.; Pasari, J.R.; Hernandez, D.L. Realistic plant species losses reduce invasion resistance in a California serpentine grassland. J. Ecol. 2012, 100, 723–731. [Google Scholar] [CrossRef]
  16. Levine, J.M.; Adler, P.B.; Yelenik, S.G. A meta-analysis of biotic resistance to exotic plant invasions. Ecol. Lett. 2004, 7, 975–989. [Google Scholar] [CrossRef] [Green Version]
  17. Grossman, J.J.; Cavenderbares, J.; Hobbie, S.E.; Reich, P.B.; Montgomery, R.A. Species richness and traits predict overyielding in stem growth in an early-successional tree diversity experiment. Ecology 2017, 98, 2601–2614. [Google Scholar] [CrossRef] [PubMed]
  18. Frankow-Lindberg, B.E. Grassland plant species diversity decreases invasion by increasing resource use. Oecologia 2012, 169, 793–802. [Google Scholar] [CrossRef]
  19. Whitfeld, T.J.S.; Roth, A.M.; Lodge, A.G.; Eisenhauer, N.; Frelich, L.E.; Reich, P.B. Resident plant diversity and introduced earthworms have contrasting effects on the success of invasive plants. Biol. Invasions 2014, 16, 2181–2193. [Google Scholar] [CrossRef]
  20. Gentili, R.; Montagnani, C.; Gilardelli, F.; Guarino, M.F.; Citterio, S. Let native species take their course: Ambrosia artemisiifolia replacement during natural or “artificial” succession. Acta Oecol. 2017, 82, 32–40. [Google Scholar] [CrossRef]
  21. Belote, R.T.; Jones, R.H.; Hood, S.M.; Wender, B.W. Diversity-invasibility across an experimental disturbance gradient in Appalachian forests. Ecology 2008, 89, 183–192. [Google Scholar] [CrossRef] [PubMed]
  22. Davies, K.F.; Harrison, S.; Safford, H.D.; Viers, J.H. Productivity alters the scale dependence of the diversity-invasibility relationship. Ecology 2007, 88, 1940–1947. [Google Scholar] [CrossRef] [PubMed]
  23. Knight, K.S.; Oleksyn, J.; Jagodzinski, A.M.; Reich, P.B.; Kasprowicz, M. Overstorey tree species regulate colonization by native and exotic plants: A source of positive relationships between understorey diversity and invasibility. Divers. Distrib. 2008, 14, 666–675. [Google Scholar] [CrossRef]
  24. Tabacchi, E.; Planty-Tabacchi, A.M. Exotic and native plant community distributions within complex riparian landscapes: A positive correlation. Ecoscience 2005, 12, 412–423. [Google Scholar] [CrossRef]
  25. Bhattarai, K.R.; Maren, I.E.; Subedi, S.C. Biodiversity and invasibility: Distribution patterns of invasive plant species in the Himalayas, Nepal. J. Mt. Sci. 2014, 11, 688–696. [Google Scholar] [CrossRef]
  26. Bart, D.; Davenport, T.; Carpenter, Q. Stress and land-use legacies alter the relationship between invasive- and native- plant richness. J. Veg. Sci. 2015, 26, 80–88. [Google Scholar] [CrossRef]
  27. Csecserits, A.; Botta-Dukat, Z.; Kroel-Dulay, G.; Lhotsky, B.; Onodi, G.; Redei, T.; Szitar, K.; Halassy, M. Tree plantations are hot-spots of plant invasion in a landscape with heterogeneous land-use. Agric. Ecosyst. Environ. 2016, 226, 88–98. [Google Scholar] [CrossRef] [Green Version]
  28. Clotet, M.; Basnou, C.; Bagaria, G.; Pino, J. Contrasting historical and current land-use correlation with diverse components of current alien plant invasions in Mediterranean habitats. Biol. Invasions 2016, 18, 2897–2909. [Google Scholar] [CrossRef]
  29. Chytry, M.; Wild, J.; Pysek, P.; Jarosik, V.; Dendoncker, N.; Reginster, I.; Pino, J.; Maskell, L.C.; Vila, M.; Pergl, J.; et al. Projecting trends in plant invasions in Europe under different scenarios of future land-use change. Global Ecol. Biogeogr. 2012, 21, 75–87. [Google Scholar] [CrossRef]
  30. Li, S.Y.; Li, X.; Liu, X.P.; Wu, Z.F.; Ai, B.; Wang, F. Simulation of spatial population dynamics based on labor economics and multi-agent systems: A case study on a rapidly developing manufacturing metropolis. Int. J. Geogr. Inf. Sci. 2013, 27, 2410–2435. [Google Scholar] [CrossRef]
  31. Liu, Z.J.; Huang, H.Q.; Werners, S.E.; Yan, D. Construction area expansion in relation to economic-demographic development and land resource in the Pearl River Delta of China. J. Geogr. Sci. 2016, 26, 188–202. [Google Scholar] [CrossRef]
  32. Fang, C.L.; Ma, H.T.; Wang, J. A regional categorization for "new-type urbanization" in China. PLoS ONE 2015, 10, e0134253. [Google Scholar] [CrossRef] [PubMed]
  33. Liao, F.H.F.; Wei, Y.H.D. Modeling determinants of urban growth in Dongguan, China: A spatial logistic approach. Stoch. Environ. Res. Risk A 2014, 28, 801–816. [Google Scholar] [CrossRef]
  34. Huang, G.X.; Sun, J.C.; Zhang, Y.; Chen, Z.Y.; Liu, F. Impact of anthropogenic and natural processes on the evolution of groundwater chemistry in a rapidly urbanized coastal area, south China. Sci. Total Environ. 2013, 463, 209–221. [Google Scholar] [CrossRef] [PubMed]
  35. Ou, Y.D.; Su, Z.Y.; Ke, X.D.; Li, Z.K. Vascular ground flora in relation to topography, canopy structure and gap light regimes in a subtropical broadleaved forest (south China). Pol. J. Ecol. 2012, 60, 463–478. [Google Scholar]
  36. Beaudet, M.; Messier, C. Variation in canopy openness and light transmission following selection cutting in northern hardwood stands: An assessment based on hemispherical photographs. Agric. For. Meteorol. 2002, 110, 217–228. [Google Scholar] [CrossRef]
  37. Magurran, A.E.; McGill, B.J. Biological Diversity: Frontiers in Measurement and Assessment; Oxford University Press: New York, NY, USA, 2011. [Google Scholar]
  38. Su, Y.Q.; Tang, Q.M.; Mo, F.Y.; Xue, Y.G. Karst tiankengs as refugia for indigenous tree flora amidst a degraded landscape in southwestern China. Sci. Rep. 2017, 7, 4249. [Google Scholar] [CrossRef] [Green Version]
  39. He, S.Y.; Zhong, Y.L.; Sun, Y.D.; Su, Z.Y.; Jia, X.R.; Hu, Y.Q.; Zhou, Q. Topography-associated thermal gradient predicts warming effects on woody plant structural diversity in a subtropical forest. Sci. Rep. 2017, 7, 40387. [Google Scholar] [CrossRef]
  40. McCune, B.; Grace, J.B.; Urban, D.L. Analysis of Ecological Communities; MjM Software Design: Gleneden Beach, OR, USA, 2002. [Google Scholar]
  41. Breiman, L.; Last, M.; Rice, J. Random forests: Finding quasars. In Statistical Challenges in Astronomy; Springer: New York, NY, USA, 2003; pp. 243–254. [Google Scholar]
  42. Breiman, L. Random forest. Mach. Learn. 2001, 45, 5–32. [Google Scholar] [CrossRef]
  43. Prabu, N.R.; Stalin, N.; Swamy, P.S. Ecophysiological attributes of Mikania micrantha, an exotic invasive weed, at two different elevations in the tropical forest regions of the western Ghats, south India. Weed Biol. Manag. 2014, 14, 59–67. [Google Scholar] [CrossRef]
  44. Zhang, L.Y.; Ye, W.H.; Cao, H.L.; Feng, H.L. Mikania micrantha H.B.K. In China—An overview. Weed Res. 2010, 44, 42–49. [Google Scholar] [CrossRef]
  45. Ye, H.G.; Peng, S.L. Plant Diversity Inventory of Guangdong; Guangdong World Publishing Corporation: Guangzhou, China, 2006. [Google Scholar]
  46. Romanuk, T.N.; Kolasa, J. Resource limitation, biodiversity, and competitive effects interact to determine the nvisibility of rock pool microcosms. Biol. Invasions 2005, 7, 711–722. [Google Scholar] [CrossRef]
  47. Annighöfer, P.; Petritan, A.M.; Petritan, I.C.; Ammer, C. Disentangling juvenile growth strategies of three shade-tolerant temperate forest tree species responding to a light gradient. For. Ecol. Manag. 2017, 391, 115–126. [Google Scholar] [CrossRef]
  48. Chin, A.R.; Sillett, S.C. Leaf acclimation to light availability supports rapid growth in tall Picea sitchensis trees. Tree Physiol. 2017, 37, 1352–1366. [Google Scholar] [CrossRef] [PubMed]
  49. Oberhuber, W. Soil water availability and evaporative demand affect seasonal growth dynamics and use of stored water in co-occurring saplings and mature conifers under drought. Trees 2017, 31, 467–478. [Google Scholar] [CrossRef] [PubMed]
  50. Barbier, S.; Gosselin, F.; Balandier, P. Influence of tree species on understory vegetation diversity and mechanisms involved—a critical review for temperate and boreal forests. For. Ecol. Manag. 2008, 254, 1–15. [Google Scholar] [CrossRef]
  51. Battaglia, M.A.; Mou, P.; Palik, B.; Mitchell, R.J. The effect of spatially variable overstory on the understory light environment of an open-canopied longleaf pine forest. Can. J. For. Res. 2002, 32, 1984–1991. [Google Scholar] [CrossRef]
  52. Sharma, A.; Jose, S.; Bohn, K.K.; Andreu, M.G. Effects of reproduction methods and overstory species composition on understory light availability in longleaf pine–slash pine ecosystems. For. Ecol. Manag. 2012, 284, 23–33. [Google Scholar] [CrossRef]
  53. Fargione, J.E.; Tilman, D. Diversity decreases invasion via both sampling and complementarity effects. Ecol. Lett. 2005, 8, 604–611. [Google Scholar] [CrossRef]
  54. Bresciano, D.; Altesor, A.; Rodríguez, C. The growth form of dominant grasses regulates the invasibility of Uruguayan grasslands. Ecosphere 2016, 5, 1–12. [Google Scholar] [CrossRef]
  55. Ruijven, J.V.; Deyn, G.B.D.; Berendse, F. Diversity reduces invasibility in experimental plant communities: The role of plant species. Ecol. Lett 2003, 6, 910–918. [Google Scholar] [CrossRef]
  56. Chen, B.M.; Liao, H.; Chen, W.B.; Wei, H.J.; Peng, S.L. Role of allelopathy in plant invasion and control of invasive plants. Allelopathy J. 2017, 41, 155–166. [Google Scholar] [CrossRef]
  57. Alnamazi, A.A.; Elbana, M.I.; Bonser, S.P. Competition and facilitation structure plant communities under nurse tree canopies in extremely stressful environments. Ecol. Evol. 2017, 7, 2747–2755. [Google Scholar] [CrossRef] [PubMed] [Green Version]
  58. Su, Z.Y.; Ke, X.D.; Zhang, S.J. Vascular plants as indicators of organic carbon gradient in subtropical forested soils. Pol. J. Environ. Stud. 2012, 21, 1393–1398. [Google Scholar]
  59. Clark, G.F.; Johnston, E.L. Temporal change in the diversity–invasibility relationship in the presence of a disturbance regime. Ecol. Lett. 2011, 14, 52–57. [Google Scholar] [CrossRef] [PubMed]
  60. Holmes, M.A.; Matlack, G.R. Agricultural history drives structure and tree species composition of second growth forest over 100 years in southeastern Ohio, USA. J. Veg. Sci. 2017, 28, 736–746. [Google Scholar] [CrossRef]
  61. Schmidt, M.; Veldkamp, E.; Corre, M.D. Tree species diversity effects on productivity, soil nutrient availability and nutrient response efficiency in a temperate deciduous forest. For. Ecol. Manag. 2015, 338, 114–123. [Google Scholar] [CrossRef]
  62. Hu, L.; Li, M.; Li, Z. Geographical and environmental gradients of lianas and vines in China. Global Ecol. Biogeogr. 2010, 19, 554–561. [Google Scholar] [CrossRef]
  63. Haeuser, E.; Dawson, W.; Van Kleunen, M. The effects of climate warming and disturbance on the colonization potential of ornamental alien plant species. J. Ecol. 2017, 105, 1698–1708. [Google Scholar] [CrossRef] [Green Version]
  64. Lembrechts, J.J.; Pauchard, A.; Lenoir, J.; Nuñez, M.A.; Geron, C.; Ven, A.; Bravomonasterio, P.; Teneb, E.; Nijs, I.; Milbau, A. Disturbance is the key to plant invasions in cold environments. Proc. Natl. Acad. Sci. USA 2016, 113, 14061. [Google Scholar] [CrossRef] [PubMed]
  65. Aguirre-Acosta, N.; Kowaljow, E.; Aguilar, R. Reproductive performance of the invasive tree Ligustrum lucidum in a subtropical dry forest: Does habitat fragmentation boost or limit invasion? Biol. Invasions 2014, 16, 1397–1410. [Google Scholar] [CrossRef]
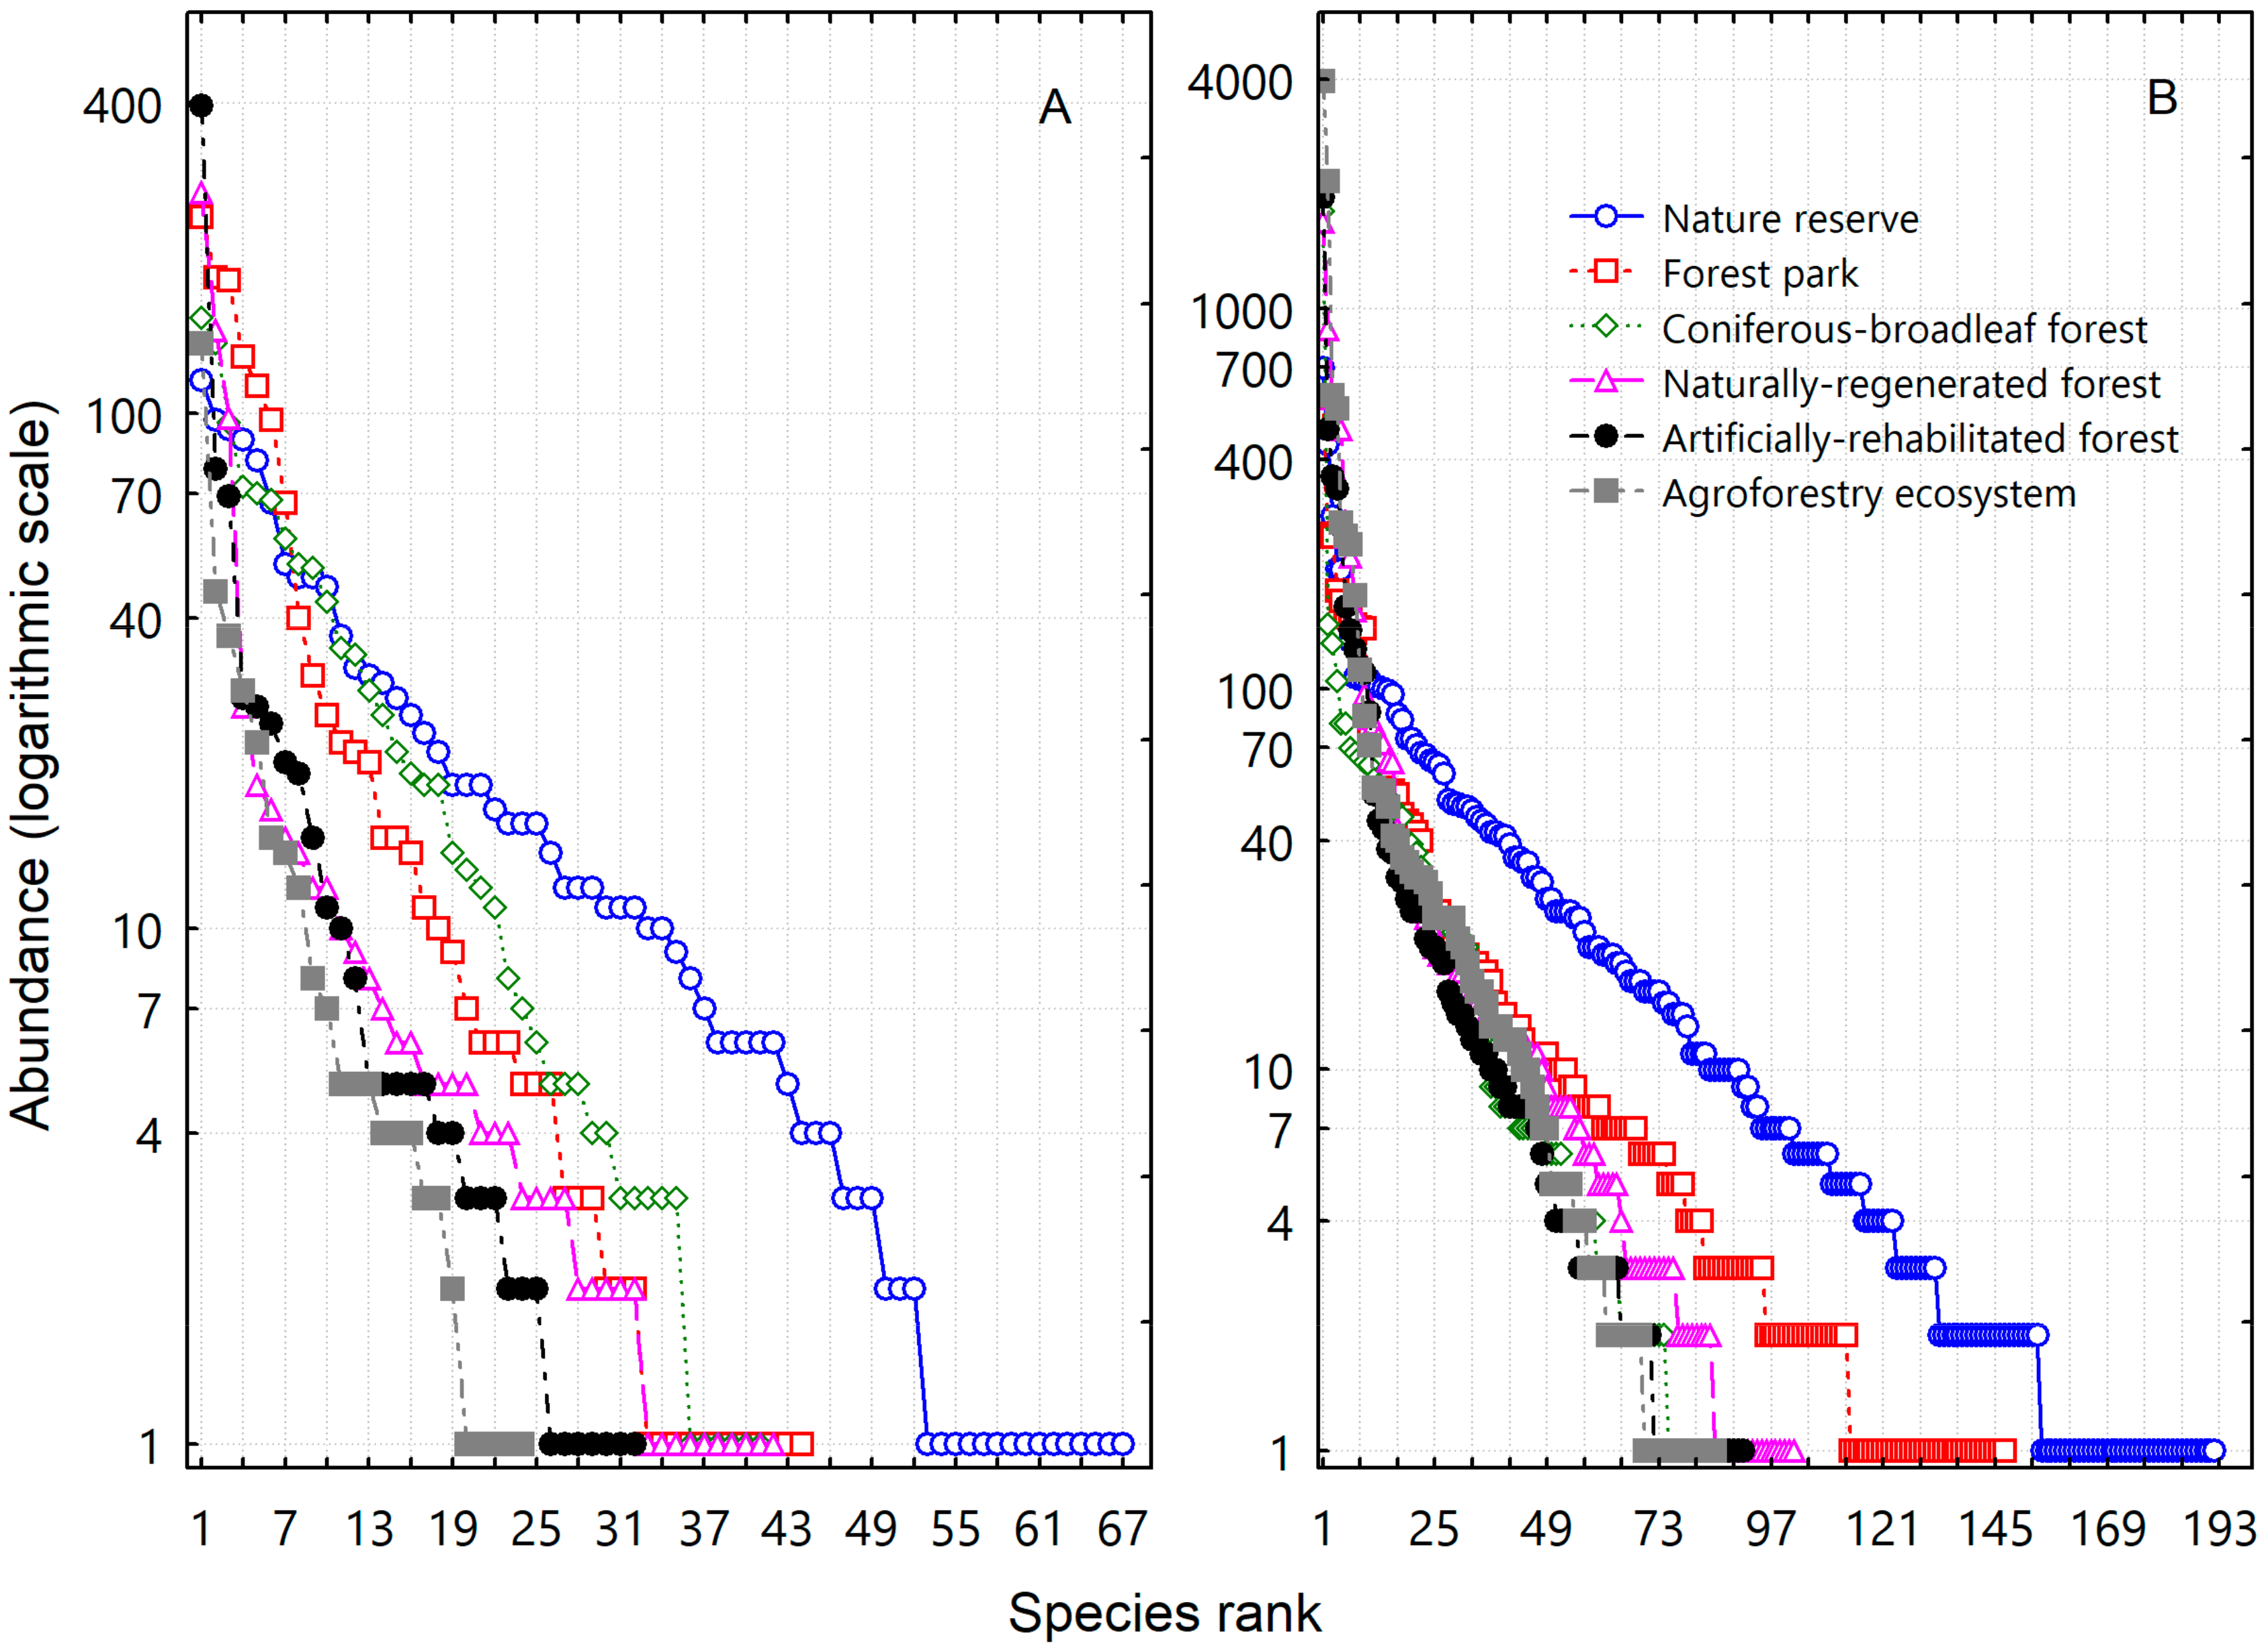
Figure 1. Rank–abundance curves showing plant diversity and dominance patterns of the six ecosystems representing various land use types for both the overstory (A) and the understory (B).
Forests 10 00867 g001
Figure 2. Changes of overstory community parameters (AF) in relation to invasion severity. A linear fit to the medians was plotted to show the trend of change. The invasion severity classes are defined according to the total number of invasive plant individuals found in a subplot, as follows: 1 = Uninvaded; 2 = Low (1 stem); 3 = Medium (2–5 stems); 4 = High (≥6 stems).
Forests 10 00867 g002
Figure 3. Changes of understory community parameters (AF) in relation to invasion severity. A linear fit to the medians was plotted to show the trend of change. The invasion severity classes are defined according to the total number of invasive plant individuals found in a subplot, as follows: 1 = Uninvaded; 2 = Low (1 stem); 3 = Medium (2–5 stems); 4 = High (≥6 stems).
Forests 10 00867 g003
Figure 4. Changes of canopy structure (A,B) and understory photosynthetically-active photon flux density (PPFDunder; C,D) in relation to invasion severity. A linear fit to the medians was plotted to show the trend of change. The invasion severity classes are defined according to the total number of invasive plant individuals found in a subplot, as follows: 1 = Uninvaded; 2 = Low (1 stem); 3 = Medium (2–5 stems); 4 = High (≥6 stems).
Forests 10 00867 g004
Figure 5. Predictor variable importance showing major biotic and abiotic factors influencing alien plant invasion. The bar plots are generated with Random Forest regression model, with overstory and understory diversity metrics, canopy structure and gap light attributes, land use types and management regimes as predictor variables, total abundance of invasive alien plants (A), the abundance of Lantana camara (B) and the abundance of Mikania micrantha (C) as response variables. Two other invasive alien species, Eupatorium catarium and Rhynehelytrum repens were excluded from analysis because they have either few occurrences in the quadrats or only few stems found in the survey. Response variables are given inside each graph panel. Predictor variable codes: 1 = overstory stem density; 2 = overstory species richness; 3 = overstory Berger–Parker index; 4 = overstory Shannon–Wiener index; 5 = overstory functional richness; 6 = overstory functional dispersion; 7 = understory stem density; 8 = understory species richness; 9 = understory Berger–Parker index; 10 = understory Shannon–Wiener index; 11 = understory functional richness; 12 = understory functional dispersion; 13 = canopy openness; 14 = leaf area index; 15 = understory direct PPFD; 16 = understory diffuse PPFD; 17 = land use type; 18 = management regime.
Forests 10 00867 g005
Table 1. Summary of site characteristics. The size of arrows increases with greater disturbance.
AttributeEcosystem
123456
Location114°13′23″ E
22°53′09″ N
114°14′40″ E
22°53′12″ N
113°48′06″ E
22°55′20″ N
113°46′18″ E
22°51′41″ N
113°47′50″ E
22°50′51″ N
113°46′53″ E
22°50′42″ N
Land use typesNature reserveForest parkConiferous-broadleaf forestNaturally- regenerated forestArtificially- rehabilitated forestAgroforestry ecosystem
Management regimeNaturalNaturalSemi-naturalSemi-naturalManagedManaged
Disturbance regimeStrictly protected Forests 10 00867 i001 Forests 10 00867 i002 Forests 10 00867 i003 Forests 10 00867 i004 Forests 10 00867 i005
Elevation (m)246.4581.259.662.557.268.7
AspectNWNESWSWSWNW
Slope (°)25157568
Plot area (m2)500050005000500050005000
Number of quadrats505050505050
Table 2. Alien plant invasion status of the six heterogeneous ecosystems. Ecosystems representing various land use types are coded as: 1 = Nature reserve; 2 = Forest park; 3 = Coniferous-broadleaf forest; 4 = Naturally-regenerated forest; 5 = Artificially-rehabilitated forest; 6 = Agroforestry ecosystem. Abbreviations for invasive plants: EUPCAT = Eupatorium catarium; LANCAM = Lantana camara; MIKMIC = Mikania micrantha; RHYREP = Rhynehelytrum repens.
AttributeEcosystem
123456
Number of species
Overstory684542433325
Understory192147901029185
Number of stems
Overstory129213151116737762367
Understory572336453685624249469446
Number of subplots with invasive plantsuninvaded2583045
Invasive plant speciesNoneEUPCAT
LANCAM
LANCAM
MIKMIC
MIKMICLANCAM
MIKMIC
LANCAM
MIKMIC
RHYREP
Total number of invasive plant individualsNone291862286
Table 3. Multi-response permutation procedures (MRPP) to test for significance of variation in both overstory and understory plant species composition across heterogeneous habitats represented by invasion severity classes. The invasion severity classes are as follows: Uninvaded, Low (1 stem), Medium, and High (≥6 stems). T is a statistic describing the separation between groupings, while A represents within-group homogeneity. P is the p-value for significance calculated using randomization method.
Groups ComparedOverstoryUnderstory
TAPTAP
Overall comparison−36.1700.048<10−7−22.5900.029<10−7
Pairwise comparison
Uninvaded vs. Low−12.4780.012<10−6−10.4220.010<10−5
Uninvaded vs. Medium−24.2990.021<10−7−20.2650.018<10−7
Uninvaded vs. High−38.9440.036<10−7−17.4360.016<10−7
Low vs. Medium−1.0530.0050.131−0.0860.00040.380
Low vs. High−14.5790.111<10−5−5.0130.0300.001
Medium vs. High−7.7090.0490.001−3.1340.0160.011
Table 4. Plant species with a significant indicator value (IV) ≥ 20 for different invasion severity classes from both the overstory and understory resident communities. The invasion severity classes are as follows: Uninvaded, Low (1 stem), Medium, and High (≥6 stems).
Invasion Severity ClassSpeciesGrowth FormIVP
Overstory
MediumAcacia mangiumTree22.80.0019
HighDimocarpus longanTree55.10.0001
Understory
UninvadedAdiantum flabellulatumFern34.70.0028
UninvadedWikstroemia nutansShrub26.10.0005
UninvadedTricalysia dubiaShrub23.60.005
UninvadedRapanea neriifoliaShrub22.50.0064
UninvadedItea chinensisTree seedling21.70.0065
UninvadedStyrax suberifoliaTree seedling21.40.0039
UninvadedGardenia jasminoidesShrub20.60.0166
UninvadedSmilax hypoglaucaClimber shrub200.0037
LowPsychotria rubraTree seedling29.10.0184
LowLitsea glutinosaTree seedling28.60.0029
LowFicus hirtaShrub24.70.0348
MediumAporosa dioicaTree seedling28.80.0077
HighLygodium japonicumFern58.70.0001
HighMiscanthus sinensisgraminoid58.30.0001
HighBlechnum orientaleFern42.20.0002
HighHedyotis hedyotideaClimber shrub34.30.0001
HighMicrostegium vagansGraminoid32.20.0002
HighLindsaea heterophyllumFern21.50.0019