Abstract
A better understanding of wood form–structure–function relationships and potentialities can lead to an enormous pool of fascinating solutions and inventions. In this research advances from both the anatomical and the mechanical points of view, the principles, fundamentals and concept generators derived from the inherent relationship between green tissue-microstructure and physical–mechanical properties of two representative woody species. Specifically, a total of 120 small-clear samples cut from six (e.g., three per wood species) Eucalyptus globulus (i.e., hardwood) and Cupressus macrocarpa (i.e., softwood) trees were sampled and tested to determine the tissue transitions per age group (e.g., juvenile, mature and senile) in terms of density, area, roundness and sphericity of vessel elements, longitudinal tracheids and longitudinal/ray parenchyma cells. Moreover, the studied green tissue-microstructure transitions were compared and analysed with the corresponding physical–mechanical properties [i.e., green density, moisture content, modulus of rupture (MOR) and modulus of elasticity (MOE)] of each species, which in turn were acquired from 159 tests carried out according to the German Deutsches Institut für Normung (DIN standards). The results herein show mature and senile wood tissues are more rigid and mechanically resistant than juvenile ones, which is partially influenced by the progressive increment in cell-wall thickness as the wood-tissue ages, and this process is of greater magnitude for the eucalyptus species. Indeed, this representative hardwood species was found superior in terms of mechanical resistance to the progression of stresses due to a complex porous vascular system that becomes stronger as the tissue-microstructure ages. The design principles underlying the natural architectures of both studied green tissues provide concept generators for potential biomimetic and engineering applications, e.g., eucalyptus species are suitable for structural applications, whereas the superior flexibility found in the cypress species could be well bio-mimicked into composite panels, where the balance between strength and rigidity is of high relevance.
1. Introduction
In recent decades scientists have been inspired by nature to generate innovative materials with specific properties and features. These properties have been widely used at the industrial level to find solutions to technological problems and to generate eco-friendly products. As alternatives to the use of natural materials (referred to here as biomaterials), efforts have been initiated to develop engineered materials from the biomimetic research approach to copy and enhance the optimal properties found in nature [,]. Therefore, to implement the materials’ simulation strategies developed by biomimetics, it is necessary to carry out a comprehensive study at different levels of hierarchical structure to determine the properties, fundamentals and concept generators derived from a specific biomaterial [].
Wood, one of the oldest and most widely used natural resources in the world, is a biomaterial with an optimal hierarchical structure capable of transferring both internal and external forces that make it naturally suited as a structural material in several engineering applications []. The wood morphology (i.e., physical form and external structure []) is usually well-known and well-described; yet, the wood anatomy (i.e., the internal structure and composition []) along with the consequent material biomechanics are still unknown from several viewpoints. Wood is a fibrous complex biological tissue-structure that makes up the inner part of stems (also referred to here as trunk), branches and roots in woody plants []. According to plant taxonomy, woody plants are classified into two broad classes, namely as hardwoods (i.e., wood from angiosperm trees, such as dicotyledons) and softwoods (i.e., wood from gymnosperm trees, such as conifers) [,]. Softwoods are usually cone-bearing trees with needle-like evergreen leaves; their nonporous tissue-structure (i.e., wood structure without vessel elements) comprises mainly axial tracheids (i.e., elongated cells with perforation plates that transport water and mineral salts) and radial ray parenchyma cells. Softwoods are generally identified (with few exceptions) by their lightness, rapid growth, light colours, small knots and low cost for industrial purposes. In most cases, they are likely suitable for non-structural applications (e.g., ornamental wood pieces, furniture, wooden boxes and paper pulp). Major resources of softwood species are cypress, fir, pine and cedar. On the other hand, the tissue-structure of a characteristic hardwood is more complex than that for softwoods []. A hardwood tissue-structure thereof comprises a very porous vascular system (i.e., the assemblage of supportive fibres, abundant parenchyma and large amounts of lignified vessel elements that transport water and sap in the tree). Although it is not a general rule, hardwoods are commonly denser than softwoods with basic densities ranging from 550 kg/m3 to 910 kg/m3 []. Furthermore, hardwoods normally grow up to 45 metres of stem height depending on the tree species and age []; yet, it is worth noting mentioning that there are some hardwood species for which heights of up to 100 m have been historically reported []. From the structural mechanic’s point of view, hardwoods are considered of better quality than softwoods and thereof their higher price for industrial purposes.
From the peripheral side of the tree to the core, six specific materials disposed into concentric bands can be distinguished within the trunk: (i) the outer bark, (ii) inner bark, (iii) vascular cambium, (iv) sapwood, (v) heartwood and (vi) the pith []. The relationship between sapwood and heartwood varies depending on the species; it is indeed a significant indicator of wood quality and a classification criterion for differentiation between hardwoods and softwoods. The sapwood is located under the bark and is the outermost living portion of a woody trunk. It is made up of a combination of biologically active and inactive parenchymal cells and constitutes the youngest tissue of the tree. Its extent depends on the wood species. Its function is basically oriented to the storage and conduction of nutrients. The heartwood is the inner wood of the trunk that comprises the most of a tree trunk’s cross-section and has the function of providing support and resistance. It is made up of biologically inactive cells and is originated in the death part of the sapwood parenchyma []. The heartwood has well-differentiated and defined tissue and cells; it is formed by compact woody vessels that do not maintain the conduction capacity of the sap. As previously said, it is of relative importance to investigate the wood form–structure–function relationship from all levels of hierarchical structure (i.e., structural, macroscopic, microscopic, biochemical and ultrastructural levels [,]).
The form–structure–function relationship of different wood species have been studied so far, yet, such studies still fall short of fully determining the influence of each level of hierarchical structure on the related properties and potentials of biomaterials. One study, worth mentioning, that investigated the coconut palm morphological characteristics and the stem structural mechanics from two out of the five levels of hierarchical structure, is published by [,,] where, in the main, (i) an optimal three-dimensional fibrovascular system that favours the palm functional design in terms of strength and stiffness, (ii) a palm stem that behaves as an engineering sandwich-like structure with a superior structural–mechanical function and properties, and (iii) a superior mechanical efficiency, between 1.2 and 1.4 times greater than the corresponding one to a tree-like structure of uniform density and fibres parallel to the stem’s axial direction; findings that reflect a local design optimum of this species that efficiently performs its biological and mechanical functions were found.
As previously stated, a better understanding of wood form–structure–function potentialities can lead to an enormous pool of fascinating inventions and solutions that will definitely continue revolutionising industrial and commercial trends. In Ecuador though, industries in the wood product manufacturing subsector (i.e., those that produce lumber, veneers, engineered wood products, structural wood frames and trusses, plywood, wood flooring and wood composites) have not parallelly evolved with the vertiginous development that other countries have achieved in this area, despite the fact the country is considered one of the greatest forest areas in the world. Thus, according to the Ecuadorian Ministry of Agriculture, Forestry and Fisheries, approximately 7 million hectares of timber forests have not been properly exploited up to now. It includes extensive plantations of eucalyptus (Eucalyptus globulus) and cypress (Cupressus macrocarpa) trees that are especially characteristic across the Central Highlands Region of Ecuador. It is, hence, inferred there is an absence of fundamental knowledge about the properties and potentials of these wood species. These were some of the aspects behind the work in this investigation that aims at analysing and comparing the wood tissue-structure at the microscopic level of hierarchical structure [,] of two representative woody species (i) a hardwood named as eucalyptus (Eucalyptus globulus) and (ii) a softwood named as cypress (Cupressus macrocarpa). Furthermore, the green tissue-microstructures of both species are investigated at three age groups (i.e., juvenile, mature and senile) to define their transitions (i.e., based on a scanning electron microscopy technique) as the tree species ages at its natural state (i.e., green state), which in turn are related to the progression of their corresponding mechanical properties. The findings in this investigation allow for a better understanding of the influence of the wood tissue-microstructure on the mechanical performance of the studied species. Further, the study also provides concept generators for potential future biomimetic and engineering applications.
2. Materials and Methods
2.1. Selection of Trees and Sampling
A total of six representative eucalyptus and cypress trees (i.e., three trees per species) of different age groups namely juvenile, mature and senile, were all sourced from the Central Highlands Region of Ecuador, Los Chillos valley specifically (0°18’53” S 78°26’36” O), with an average altitude of 2535 m above sea level, average temperature of 18° C and a mean annual rainfall of 1421 mm. The age range and group of each investigated tree were estimated and derived, respectively, from the classification given by Gatsuk et al. (1980) in [] in which trees are differentiated according to their development characteristics and reproductive function (see Table 1).

Table 1.
Age estimation derived from the height-perimeter relationship of the trees.
Prismatic block samples (approximately 235 mm × 235 mm × 240 mm) from each tree species and age group were extracted at a nominal height of 2 m measured from the base of the trunk. Subsequently and after bark removal (average thickness of 35 mm), each block sample was preserved into sealed plastic bags with moist paper towels prior to its immediate transfer to the laboratory. Cubic and prismatic green small-clear samples were extracted from the abovementioned block samples (i.e., the results obtained from the tested samples herein give characteristic structures and properties of the two studied species that correspond to the tree radial position comprised between 35 mm and 235 mm, measured from the periphery of the trunk without bark towards the pith, respectively) to be tested under the conditions detailed hereunder.
2.2. Wood Samples Softening Protocol
To achieve high-quality microphotographs by scanning electron microscopy (SEM) in this part of the investigation, effective softening and cutting techniques were combined with easily accessible tools. As a first try, a direct cut was made on a wood green small-clear sample by saw, scalpel and razor blades to obtain transversal, tangential and radial microphotographs. Inspection by optical microscopy revealed that these cutting methods considerably damaged the tissue structure. Thus, six wood softening protocols from the related literature were tested to find the easiest and most effective one that allowed neat observation of the wood species microstructures: (i) immersion in water at 100 °C [,], (ii) immersion in glycerine, (iii) maceration with distilled water and glycerine for 7 days []; (iv) immersion in 96% alcohol solution, distilled water and glycerine in a ratio of 1:1:3 []; (v) immersion in 96% alcohol and glycerine in a ratio of 1:1 [], and (vi) immersion in a softening solution (i.e., hydrogen peroxide, glacial acetic acid and distilled water in a ratio of 2:1:1) at 100 °C and then oven-drying at 60 °C []; however, none of them reproduced the expected results to fulfil the main purpose of the study. Two combinations of the abovementioned protocols were, therefore, evaluated to solve the issue: (vii) immersion in water at 100 °C followed by immersion in softening solution under a water bath at 100 °C, and then oven-drying at 60 °C, and (viii) begin applying the latter protocol (vii) and then immersion in 96% alcohol solution and glycerine in a ratio of 1:1. Samples were razor blade cut and stored in an oven at 60 °C, at least for 48 h until SEM observations. It was observed that immersion in 96% alcohol solution and glycerine 1:1 led to a wood samples hardening and, hence, protocol (viii) was discarded, leaving protocol (vii) as the most effective one.
2.2.1. Softening Protocol of Eucalyptus Samples
A total of 60 eucalyptus small-clear samples (e.g., 20 per age group), nominal size 10 mm × 10 mm × 5 mm, were placed separately in heat-resistant containers. A variation of the aforementioned protocol (vii) was applied, i.e., immersion in water at 100 °C for approximately 84 h, with a constant renewal of water; immersion in softening solution under a water bath for 6 h and then oven-drying for about 168 h at 60 °C, ensuring constant softening solution supply.
2.2.2. Softening Protocol of Cypress Samples
The same number of samples and nominal size as per the eucalyptus ones were tested herein. In this case, another variation of protocol (vii) was applied, i.e., immersion in water at 100 °C for approximately 42 h, with a constant renewal of water; immersion in softening solution under a water bath for 6 h and then oven-drying for about 72 h at 60 °C, ensuring constant softening solution supply.
2.3. Preparation of Wood Samples for SEM Observations and Electron Microscopy Photographs
Once the softening process was achieved, transversal, tangential and longitudinal cuts were performed under a stereomicroscope by using razor blades of 0.05 mm thickness. New razor blades were used for each sample. The wood samples’ dimensions were approximately 5 mm × 5 mm × 2 mm. The samples were dehydrated in an oven at 60 °C for at least 48 h prior to SEM inspection.
The dried samples were fixed onto aluminium holders using double-sided conductive carbon tape and sputter-coated for 60 seconds with a layer of 20 nm of gold (99.99% purity, Quorum Q150R ES). For each sample, images at different magnifications were obtained by using a Field Emission Gun Scanning Electron Microscope TESCAN MIRA3, with a resolution of 1.2 nm at 30 kV.
2.4. Image Processing Analyses
A total of 416 SEM images (i.e., 89 images of Cupressus macrocarpa and 327 of Eucalyptus globulus) were used to determine the microstructural characteristics of the investigated wood samples. The tissue-microstructure of softwoods was less complex than hardwoods, and, therefore, the number of images collected for cypress samples was smaller than the ones for eucalyptus. Indeed, the examination of eucalyptus vessel elements (conducted exclusively for the eucalyptus species) required one image per analysis, hence, the difference in the quantity of images used for each species.
The wood samples were analysed in terms of density, area, roundness and sphericity of vessels and tracheids for the hardwood species, and only of tracheids for the softwood species. The MATLAB’s image processing toolbox, with input by the algorithm developed by [], was used to fulfil this purpose. Specifically, the algorithm allowed for (i) image importation from SEM, (ii) image processing, and (iii) acquired data storage. After image importation, the empty parts (i.e., vessels or tracheids) showed up automatically as dark areas; the incomplete vessels/tracheids that appeared at the edges of each digital image were not included as part of this analysis. The spatial scattering of vessels/tracheids were quantified per square micrometre (#/µm2) to determine their density distribution. Moreover, for each vessel/tracheid, their corresponding area and shape was determined; the latter quantified by two parameters (i) roundness and (ii) sphericity. Simultaneously, the vessel/tracheid roundness (R) and sphericity (S) were determined as [],
where Requiv is the radius of an equivalent circle having the same area as the vessel/tracheid in the analysis (see Figure 1), Rcircums is the radius of the circumscribed circle (i.e., the smallest circle depicted by the entire contour of each vessel/tracheid as shown in Figure 1), A and P are the area and perimeter of the vessel/tracheid (i.e., the empty part or dark area), respectively. R and S are dimensionless with values ranging between zero to one, both reflecting the geometrical smoothness given by the likeness ratio between the circumscribed circle to the equivalent one.
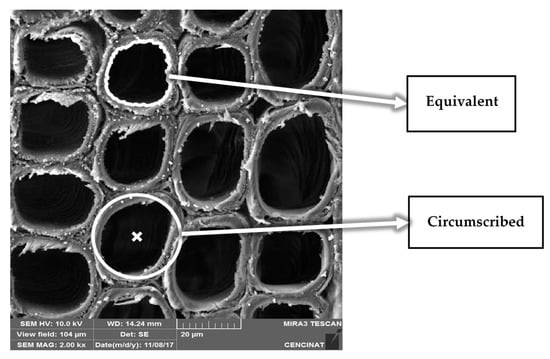
Figure 1.
Microphotograph of a cypress sample showing a group of longitudinal tracheids where, for visual understanding, one equivalent and one circumscribed circle is depicted. For this specific example, 12 cypress tracheids were analysed in terms of density, area, roundness and sphericity.
2.5. Physical–Mechanical Characterization
A total of 159 hardwood and softwood green samples (i.e., 90 eucalyptus samples and 69 cypress samples) were tested in this study to determine the density and moisture content properties of both species as well as the axial stiffness and strength in compression (i.e., modulus of elasticity (MOE)comp modulus of rupture (MOR)comp, respectively), and the bending stiffness and strength (i.e., MOEbend and MORbend, respectively). The mechanical tests were all carried out in an AGS-X Shimadzu universal testing machine (UTM), 300 kN capacity equipped with a non-contact digital video extensometer to measure deformations, which, in turn, were also double-checked by using 5 mm long single-element strain gauges glued on each sample using adhesive cyanoacrylate ester and coated with instant repair epoxy resin/tertiary amine. Experimental tests were all performed at room temperature and relative humidity, e.g., approximately 20 °C (+/−1 °C) and 42% (+/−1%), respectively.
2.5.1. Density and Moisture Content
Density measurements were performed on nominal 20 mm × 20 mm × 20 mm wood green samples following the DIN 52182 “Testing of Wood–Determination of Density” []. A total of 53 wood small-clear samples (i.e., 30 eucalyptus samples and 23 cypress samples) were tested to determine the (ρb) green density (i.e., the ratio of green weight Wg to green volume Vg) and (ρb) basic density (i.e., the ratio of oven-dry weight Wo to green volume Vg) as well as the corresponding moisture content (M.C.) of each sample. Out of the 30 eucalyptus samples, 10 were cut from juvenile trees, 10 from mature trees and 10 from senile trees. Likewise, out of the 23 cypress samples, 5 were cut from juvenile trees, 8 from mature trees and 10 from senile trees. The percentage of moisture contained in each wood sample was calculated as []
where mt is the mass of the sample at the time of the test, and mo is the oven-dry mass of each sample.
2.5.2. Green Compressive Stiffness and Strength
A total of 56 compressive tests were carried out on green wood small-clear samples (i.e., 30 eucalyptus samples and 26 cypress samples), nominal size of 20 mm × 20 mm × 20 mm. Out of the 30 eucalyptus samples, 10 were cut from juvenile trees, 10 from mature trees and 10 from senile trees. Similarly, out of the 26 cypress samples, 6 were cut from juvenile trees, 10 from mature trees and 10 from senile trees. In this case, 4 cypress juvenile samples were damaged when testing so that only 6 were considered for the subsequent analyses.
For the sampling material preparation, attention was paid to having the wood sample fibres parallel to the longitudinal axis (also referred to here as axial direction), with a +/- 5º tolerance. The selected samples were sanded to guarantee flat surfaces and, hence, full contact during testing. Each sample was labelled after sanding accordingly. To reproduce green conditions as in nature (i.e., reconstruction method []), samples were saturated with water using a vacuum-pressure container treatment system. Subsequently, all samples were fitted with strain gauges and tested in compression according to the DIN 52185 “Testing of Wood-Compression Test Parallel to Grain” []. The compressive tests were carried out in the UTM described hereinabove. The bottom platen of the UTM was fixed while the top platen was mounted on a half-sphere bearing which could rotate, so as to provide full contact between the platen and the samples (see Figure 2). A dry graphite powder coating was used between the samples and the testing platens to minimise friction. Each sample was then loaded in the longitudinal direction (i.e., parallel to the wood sample fibres) up to failure at a cross-head speed of 0.3 mm/min to reach failure between 3 to 4 min.
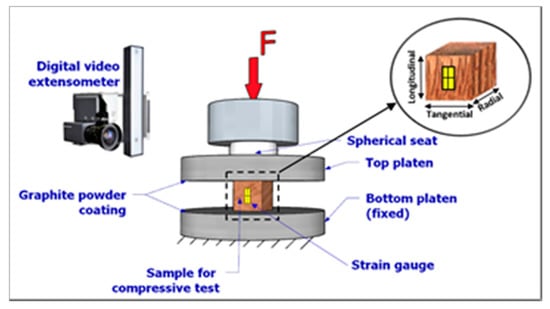
Figure 2.
Compressive sample test set-up.
The green compressive stiffness [i.e., the modulus of elasticity (MOEcomp)] and green compressive strength [i.e., the modulus of rupture (MORcomp)] were determined from this mechanical mode. Specifically, MOEcomp was calculated from the stress (σ) strain (ε) relationship given by Hooke’s law [] as
The compressive stiffness was then calculated by performing a linear regression on the linear elastic range (i.e., the proportional limit) of the stress–strain curves produced for each tested sample, where the slope of the curve gives the corresponding MOEcomp as explained previously (refer to Equation (4)).
The compressive strength that reflects the maximum load carrying capacity (Fmax) of the wood samples in the L direction of the applied load was calculated as []
where A is the measured cross-sectional area of the sample’s face perpendicular to the applied load F (see Figure 2).
2.5.3. Green Bending Stiffness and Strength
A total of 50 bending tests were carried out on prismatic green wood defect-free samples (i.e., 30 eucalyptus samples and 20 cypress samples), nominal size of 15 mm × 15 mm × 220 mm. Out of the 30 eucalyptus samples, 10 were cut from juvenile trees, 10 from mature trees and 10 from senile trees. Similarly, out of the 20 cypress samples, 4 were cut from juvenile trees, 6 from mature trees and 10 from senile trees. In this case, some cypress juvenile and mature samples were damaged during testing so that only 20 were considered for the subsequent analyses. Sampling material preparation followed the same procedure as per the compressive tests in terms of sample’s sanding, labelling and green conditions reproduction. A three-point bending test was performed on the samples, as shown in Figure 3, that reflects the bending test set-up. According to the DIN 52186 “Testing of Wood–Bending Test” [], each sample was positioned onto two lower supporting pins, which were placed 200 mm one with respect to the other. The UTM top platen was mounted onto one loading pin placed right in the middle of the system. Three-millimetre thick rubber pressure pads were used to minimise friction and prevent local damage between the sample facings and set of upper/lower pins. Each wood sample was then loaded up to failure at a cross-head speed of 2 mm/min to reach failure between 4 to 6 min.
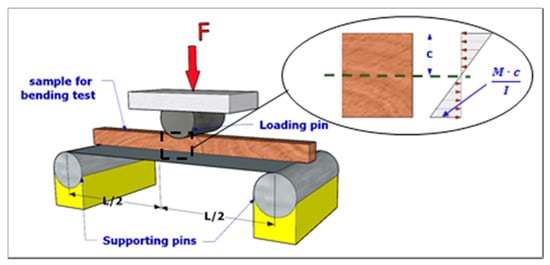
Figure 3.
Bending sample test set-up.
The green bending stiffness (i.e., the modulus of elasticity (MOEbend)) and green bending strength [i.e., the modulus of rupture (MORbend)] were determined from this mechanical mode. The MOEbend was calculated following the same procedure as per the MOEcomp, i.e., from Equation (4) and from the linear regression performed on the linear elastic range of the stress–strain curve for each tested sample under bending mode. The bending strength (i.e., the highest stress experienced by the entire cross-section of the wood sample at its moment of yield) was calculated by applying Equation (6) given in [] as
where M is the bending moment (N∙mm) produced by the applied load F (see Figure 3) that in turn is calculated by Equation (7), c (mm) is the distance from the neutral axis of the wood sample to the external wood fibre under the highest pressure at the loading point, I is the moment of inertia of the cross-section of the sample (mm4) and L is the length between the supporting pins where the wood sample is placed (i.e., 200 mm for this specific case, as mentioned previously).
2.6. Statistical Analyses
All results in this investigation were evaluated through statistical tests to confirm the stated tendencies of each studied variable. The normal distribution of the acquired data was verified by the Shapiro–Wilk test []; a p-value (i.e., the probability that a calculated statistical value is possible for a specific hypothesis) greater than the significance level of 0.05 was obtained for all cases, meaning the acquired data is normal. The Analysis of Variance (ANOVA) was then performed to identify the significant differences (p-value < 0.05) of each variable between both species and among group ages.
3. Results
3.1. Green Tissue-Microstructure
Microphotographs show a complex porous vascular system for the studied hardwood eucalyptus tissue-microstructure that comprises three main cell types (i) supportive longitudinal fibres, (ii) large amounts of vessel elements, and (iii) longitudinal and ray parenchyma cells, whereas the softwood resinous cypress shows a rather simpler tissue-microstructure with two cell types (i) elongated longitudinal tracheids and (ii) longitudinal and ray parenchyma cells. Henceforth, fibres (i.e., long narrow cells that primarily account for the mechanical support of the tree) and vessel elements were present only in hardwoods.
A total of 131 vessel elements (i.e., 65 juvenile, 32 mature and 34 senile) from the eucalyptus samples were measured. A careful inspection of the acquired images unveiled lignified vessel elements that become bigger and undergo change from quasi-circular to elliptical shape, for juvenile to senile samples, respectively (see Figure 4). Some vessel elements in senile samples showed tylosis, a condition induced by bladder-like distension of the parenchyma cell into the adjacent vessels (see Figure 4c).
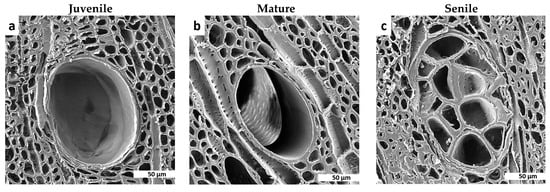
Figure 4.
Microphotographs of transverse cuts obtained in scanning electron microscopy (SEM) for the comparison of green tissue-microstructure transitions in Eucalyptus globulus samples showing vessel elements embedded in abundant parenchyma cells for (a) juvenile, (b) mature and (c) senile samples. The transition of vessel elements with a decrease in density, roundness and sphericity, and an increase in area can be seen in the microphotographs.
As seen in Figure 5, eucalyptus vessel elements (i) quasi-linearly decrease in density from green juvenile to green senile (p-value = 2.647 × 10⁻⁶) tissue-microstructures (see Figure 5a); (ii) its area did not relatively vary from juvenile to mature (p-value = 3.667 × 10⁻¹) but significantly increased from the latter to senile (p-value = 7.059 × 10⁻¹⁰) tissue-microstructure (see Figure 5b), and (iii) the vessel element shape significantly changed in terms of roundness (p-value = 3.752 × 10⁻⁵) and sphericity (p-value= 9.414 × 10⁻²²) from juvenile to senile tissue-microstructures (see Figure 5c,d, respectively).
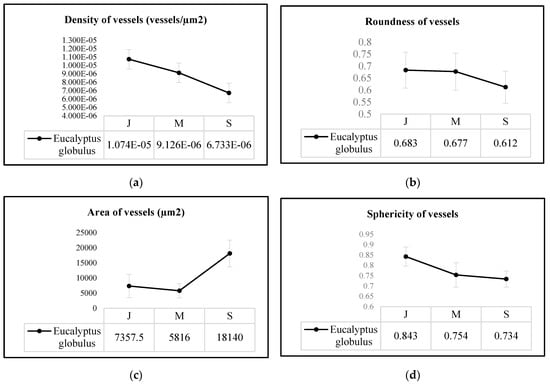
Figure 5.
Average values of (a) density, (b) area, (c) roundness and (d) sphericity of vessel elements from Eucalyptus globulus tissue-microstructure per age group, i.e., juvenile (J), mature (M) and senile (S).
A total of 385 longitudinal parenchyma cells (i.e., 98 juvenile, 131 mature and 156 senile) from the Eucalyptus globulus samples and 658 elongated lignified longitudinal tracheids (i.e., 233 juvenile, 250 mature and 175 senile) from the Cupressus macrocarpa samples were measured. The results of these analyses show a quasi-linear decrease in density (p-value = 2.820 × 10⁻¹⁰) with a consequent quasi-linear increase in area (p-value = 1.998 × 10⁻¹⁵) for the longitudinal tracheids from the cypress samples (see Figure 6a,b) that means the tracheids get bigger as the tissue gets older to transport larger amounts of nutrients, so there are fewer tracheids per µm2 in senile samples (see Figure 7d through Figure 7f). The analyses of density and area for the longitudinal parenchyma cells from the Eucalyptus globulus samples do not present clear tendencies, yet it could be inferred the variation of both parameters would likely be of similar trends as per the studied softwood species. Figure 7a through Figure 7c show a progressive increment in the thickness of longitudinal parenchyma cell-walls from juvenile to senile eucalyptus tissue-microstructure, a process that likely contributes to the progressive increment in mechanical resistance as the hardwood tissue ages. The differences in density (p-value = 3.362 × 10⁻²) and area (p-value = 3.279 × 10⁻²) between species is significant, meaning the eucalyptus longitudinal parenchyma cells have higher density and smaller area than the cypress longitudinal tracheids.
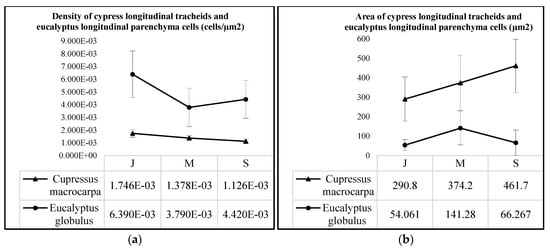
Figure 6.
Average values of (a) density and (b) area of longitudinal parenchyma cells and longitudinal tracheids from Eucalyptus globulus and Cupressus macrocarpa samples, respectively, per age group, i.e., juvenile (J), mature (M) and senile (S).
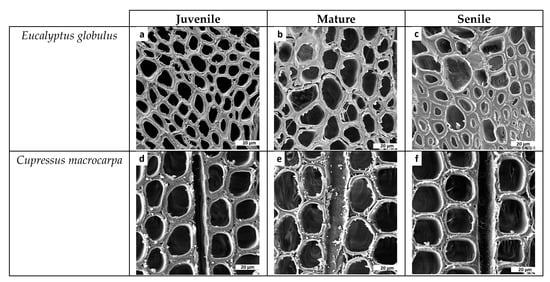
Figure 7.
Microphotographs of transverse cuts obtained in SEM for the comparison of green tissue-microstructure transitions in Eucalyptus globulus and Cupressus macrocarpa per age group. Figures (a) to (c) show the transitions of longitudinal parenchyma cells in Eucalyptus globulus, whereas Figure (d) to (f) show the transitions of longitudinal tracheids for Cupressus macrocarpa.
Table 2 and Table 3 show that the results of shape transitions in terms of roundness and sphericity for the eucalyptus longitudinal parenchyma cells and cypress longitudinal tracheids (p-value = 8.758 × 10⁻¹ and p-value = 7.590 × 10⁻¹, respectively), and for the eucalyptus/cypress ray parenchyma cells (p-value = 1.662 × 10⁻¹ and p-value = 1.250 × 10⁻¹, respectively) remain constant among the group ages. Similarly, in terms of roundness when comparing both species for the eucalyptus longitudinal parenchyma cells and cypress longitudinal tracheids (p-value = 9.609 × 10⁻¹) as well as for the eucalyptus/cypress ray parenchyma cells (p-value = 6.476 × 10⁻²) it occurs. Yet, in terms of sphericity, a significant difference between both species for the longitudinal cells (p-value = 1.718 × 10⁻²) and for the ray cells (p-value = 4.938 × 10⁻²) was found: which means that, contrary to the eucalyptus cells, the cypress longitudinal tracheids and ray parenchyma cells become closer to a perfect circular shape (see Figure 7).

Table 2.
Averages and standard deviations of roundness of the longitudinal parenchyma cells, longitudinal tracheids and ray parenchyma cells for Eucalyptus globulus and Cupressus macrocarpa per age group.

Table 3.
Averages and standard deviations of sphericity of the longitudinal parenchyma cells, longitudinal tracheids and ray parenchyma cells for Eucalyptus globulus and Cupressus macrocarpa per age group.
A total of 453 (i.e., 163 juvenile, 159 mature and 131 senile) ray parenchyma cells from the eucalyptus samples and 332 (i.e., 105 juvenile, 131 mature and 96 senile) from the cypress samples were measured and analysed. The tissue-microstructure transitions per age group for this specific component are presented in Figure 8. For the eucalyptus samples, from juvenile to senile ray parenchyma cells, the results show an increase in density and a decrease in area. For the cypress samples, the results reflect an increase in both density and area. However, the differences between species and group ages for density and area of the ray parenchyma cells are not significant (p-value > 0.05 in all cases).
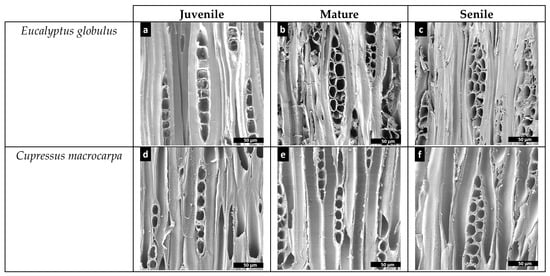
Figure 8.
Microphotographs of tangential cuts obtained in SEM for the comparison of green tissue-microstructure transitions in Eucalyptus globulus and Cupressus macrocarpa per age group. (a–c) show the transitions of ray parenchyma cells in Eucalyptus globulus, whereas Figure (d) to (f) show the corresponding transitions for Cupressus macrocarpa.
3.2. Density and Moisture Content
Results of the calculated basic densities and their corresponding saturated moisture contents for the 53-wood small-clear samples (i.e., 30 eucalyptus samples and 23 cypress samples) tested to fulfil the purposes in this part of the study are given in Table 4. Figure 9 plots the measured basic density against the measured moisture content of all samples shown per wood age group. The results from Figure 9 and Table 4 show that the average calculated basic density for senile eucalyptus samples was 1.04 and 1.12 times greater than the corresponding ones for mature and juvenile samples, respectively. For the cypress samples, it was 1.15 and 1.37 times greater than the mature and juvenile ones. Contrarily, the average moisture content of the juvenile eucalyptus samples was 1.12 and 1.17 times greater than the corresponding ones for mature and senile samples, respectively, and 1.06 and 1.09 times, respectively, greater for the cypress species; which denotes, the moisture content in wood species is inversely proportional to the basic density. Both properties, however, are well correlated with each other by the power functions shown in Figure 9. The ANOVA statistical analyses support these findings and show that there are significant differences between group ages and species for both basic density and moisture content (p-value < 0.05).

Table 4.
Measured basic densities and moisture contents per wood age group of the Eucalyptus globulus and Cupressus macrocarpa.
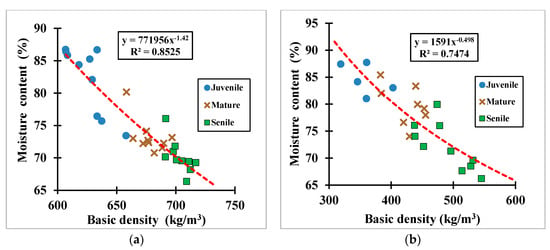
Figure 9.
Basic density vs. green moisture content measured per wood group age for (a) the eucalyptus samples, and (b) the cypress samples.
Overall, the average basic density of the eucalyptus samples was 1.53 times greater than the corresponding one to the cypress samples that reflects the eucalyptus wood tissue (i.e., hardwood tissue) is harder than the cypress wood tissue (i.e., softwood tissue). According to [,,], the mechanical properties in wood species are all linearly proportional to the basic density. Therefore, in this study, it is expected that the related mechanical properties for each wood species vary accordingly, i.e., higher modulus of resistance and modulus of elasticity for the eucalyptus species and vice versa for the cypress species.
3.3. Green Compressive Stiffness and Strength
Average results from the compressive tests carried out on the 56 hardwood and softwood green small-clear samples are given per group age in Table 5. Figure 10 plots for both species the calculated green MOR and MOE for this mechanical mode against the corresponding green densities.

Table 5.
Average green modulus of rupture (MOR) and modulus of elasticity (MOE) per wood group age of the Eucalyptus globulus and Cupressus macrocarpa samples tested under the compression mode.
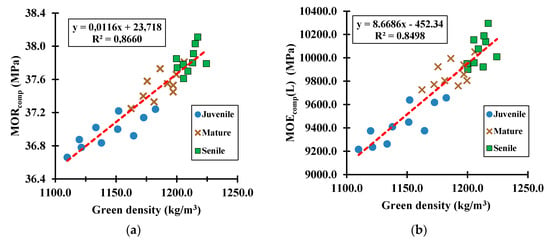
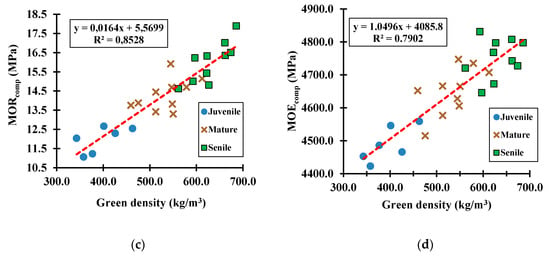
Figure 10.
Green samples tested under the compression mode to determine the relationship of green density versus (a) MOR for eucalyptus species, (b) MOE for eucalyptus species, (c) MOR for cypress species, and (d) MOE for cypress species.
The compressive MOR (p-value = 1.546 × 10⁻³) and MOE (p-value = 4.733 × 10⁻⁴) averages for green eucalyptus samples were 2.60 and 2.10 times greater, respectively, than the corresponding ones to the green cypress samples. It reflects a hardwood species that, at its natural state (i.e., green state), has more than twice the resistance to bear compressive stresses than softwood species; yet, it also reflects a softwood species that is about two times more flexible under the action of compressive loads than hardwood species. Further analyses, not included in this paper because of the research scope, showed a significant increase (e.g., 1.67 to 2.03 times) in the compressive MOR between green and air-dry samples for both species; concomitantly, the corresponding MOE for dry samples was about 1.27 times greater than the green samples, which means, wood becomes highly stiff and resistant as its tissue dries up. The same tendency was observed for the bending mechanical mode.
3.4. Green Bending Stiffness and Strength
Average results from the bending tests carried out on the 50 prismatic green hardwood and softwood samples are given per group age in Table 6. Figure 11 plots for both species the calculated green bending MOR and MOE against the corresponding green densities. Results from this mechanical mode showed similar tendencies for both species as per the wood performance under the compression mechanical mode (i.e., MOR and MOE progressively increased as the wood-tissue ages). Specifically, the total averages bending MOR (p-value = 1.402 × 10⁻⁴) and MOE (p-value = 3.381 × 10⁻³) for green eucalyptus samples were 1.82 and 2.16 times greater, respectively, than the corresponding ones to green cypress samples. The results reflected once again, a eucalyptus green tissue that was about two times more resistant and stiff under the influence of bending loads than the cypress green tissue.

Table 6.
Average green MOR and MOE per wood group age of the Eucalyptus globulus and Cupressus macrocarpa samples tested under the bending mode.
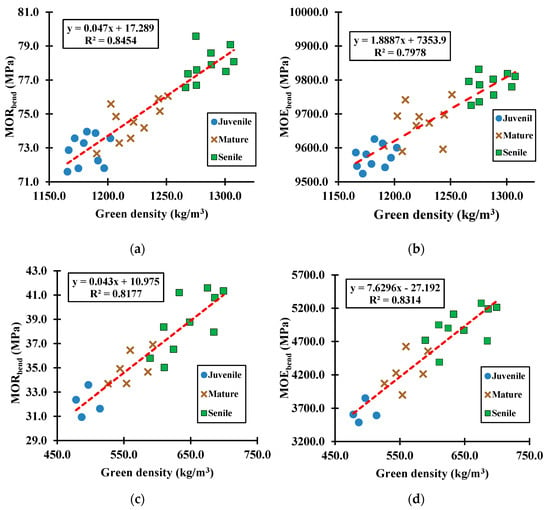
Figure 11.
Green samples tested under the bending mode to determine the relationship of green density versus (a) MOR for eucalyptus species, (b) MOE for eucalyptus species, (c) MOR for cypress species, and (d) MOE for cypress species.
From the ANOVA statistical analyses, it was found that all mechanical properties had a significant difference between species and among group ages (i.e., their p-value < 0.05).
4. Discussion
4.1. Green Tissue-Microstructure Analyses
As mentioned before, longitudinal cypress tracheids showed a quasi-linear decrease in density with a consequent quasi-linear increase in area that reflects the need of the tree to supply water, minerals and nutrients to the different parts as it grows. Moreover, the increase in the number of ray parenchyma cells likely occurred by the radial growth of the trunk that in turn demands higher water and nutrients flow throughout the wood tissue, while the decrease in the number of longitudinal tracheids was directly related to the increase in the lumen area of this component [].
The functions of tracheids in softwoods are for both transport and mechanical support, while in hardwoods, fibres and vessel elements are responsible for the mechanical resistance of the tree []. Density and lumen area of eucalyptus vessel elements quasi-linearly decreased and increased, respectively, as a function of the age group; these correlations for vessel elements were similar to the longitudinal tracheids in cypress species, meaning both cell types account for the transportation of water and nutrients in greater scales as the tissue ages. In the case of the cypress species, the area of the tracheids in the transversal cut was bigger than in the longitudinal cut, logically denoting that transport of water and nutrients is predominantly towards the vertical (axial) direction of a tree.
For eucalyptus samples, the vessel elements underwent a transition from quasi-circular to elliptical shape as a function of the tissue age (see Figure 4). The reason for this change may be explained by the fast tree trunk-tissue growth rate and the consequent adaptation of vessel elements to the new wood tissue area when sapwood turns into heartwood; in addition, the cell wall connections between parenchyma and vessel elements may exert structural pressure within the heartwood composition [,]. In cypress and eucalyptus samples, the shape parameters of roundness and sphericity in longitudinal and ray parenchyma cells remained quasi-constant as a function of age group. It seems then the circular or quasi-hexagonal shapes of the tracheids are the optimal geometry during all stages of growth. It suggests, though, future studies to be undertaken to fully characterise both species under the parameters investigated herein, thereby including representative wood samples from other trunk heights, peripheral positions and even different regions, altitudes, climatic conditions and ages. The knowledge acquired from such studies would be of relevant importance to better understand the influence of the cellular nature of both wood species on their overall biomechanical performances.
4.2. Wood Strength and Stiffness
From the acquired results in the compressive and bending mechanical modes, it can be noticed that, for both species, the green MOR and MOE progressively increased as the wood aged from juvenile to senile tissue. This finding accurately correlates [] in the context that biological materials are versatile because they experience a variation in material properties as they age or as a response to the forces they are exposed to, e.g., juvenile plant cell walls are ductile (i.e., able to undergo a change in form without breaking), whereas mature/senile plant cell walls are likely to be more resilient (i.e., capable of regaining its original position or shape after being exposed to external loadings).
From the literature reviewed in [], it was found that, for juvenile wood tissues, cellulose causes a gradual accumulation of this material on the cell-walls of the cambial region, whereas lignin does the similar process in mature and senile wood tissues, likely influencing the transition in shape of fibres, vessel elements, longitudinal tracheids and ray parenchyma cells, as seen in the microphotographs from Figure 4, Figure 7 and Figure 8. The cellulose microfibrils are more flexible than lignin that is rather rigid; thus, this singularity explains from one perspective, the reason why mature and senile wood tissues are more rigid and mechanically resistant (as shown in Figure 12 for eucalyptus species) than the juvenile ones [,,,], and logically explains also the transition in strength and flexibility of trees per age groups. In this context and from Figure 12, it is visibly clear that juvenile wood cell-walls were visibly thinner than the corresponding ones for the other group ages; thus, it could be inferred that with the time as the wood tissue-microstructure reaches its maturity state, several layers of the secondary cell wall are formed where all lignin accumulates and gives the tree trunk greater strength and stiffness. Lignin is a kind of complex organic polymer that forms basic structural materials in the support wood-tissues of trees. Trees become stiffer as age and external loads (e.g., wind pressure) are resisted with a material of high flexural rigidity, which is achieved by two possible strategies (i) the permanent formation of new lignified layers of cell walls that allows for better accumulation of material, increasing wood-tissue density and, therefore, increasing the modulus of elasticity, and (ii) by increasing the cell wall diameters through secondary growth, which results in a considerable increase in the moment of inertia of the tree trunk with a consequent increment of its flexural stiffness.
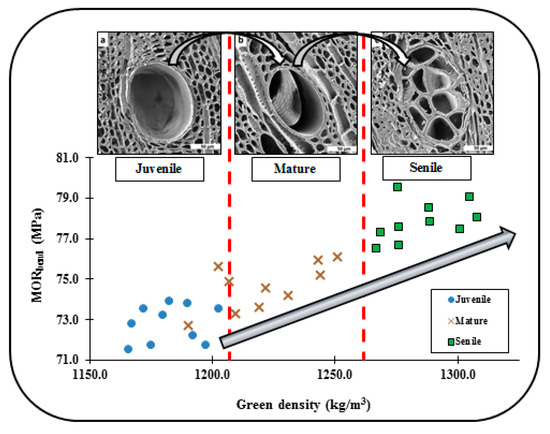
Figure 12.
The progressive increment in the thickness of cell-walls for vessel elements embedded in parenchyma cells from juvenile to senile eucalyptus tissue-microstructure likely influences on the linear increase in density and bending strength as the wood-tissue ages. It was found in this study that this is a common phenomenon for both studied species in terms of density, compressive and bending strength and stiffness. Yet, the cell-wall thickness augmentation is of greater magnitude for the eucalyptus species.
5. Conclusions
The composition of softwoods is simpler than hardwoods. Softwoods have fewer cell types (longitudinal tracheids, longitudinal and ray parenchyma), their arrangement is more regular, and its tissue-microstructure undergoes fewer changes in terms of shape and composition. The previously analysed mechanical performance is a logical derivation of the characteristic tissue-microstructure of the investigated species herein. Indeed, the characteristic porous vascular system made up of strong fibres, large vessel elements and abundant parenchyma, provide most of the structural support in hardwoods, as the characteristic longitudinal tracheids do for softwoods [,]. From the acquired results in this study, the complex vascular system of the hardwood tissue species that connect the top of the tree with the root system [], that in turn provides the higher eucalyptus mechanical strength, is microscopically visible. It can also be inferred, however, that, for the investigated softwood tissue-microstructure, the longitudinal tracheids and its typical elongated perforated plates likely influence on its higher flexibility [].
The statistical analyses determined that all studied variables for both species and age groups complied with the conditions of normality and analysis of variances, which allowed to technically state tendencies for the acquired results. From our experimental results (valid for the specific geographical region, altitude and prevailing climatic conditions in the area where sourced our wood samples as well as for the specific ages, trunk height and peripheral positions investigated herein), the progressive increment of cell-wall thickness as the wood-tissue ages, and this process is of greater magnitude for eucalyptus species (see Figure 4 and Figure 7), has been clearly identified for both species. The pre-eminence in compressive and flexural strengths (i.e., MORcomp and MORbend) of the hardwood tissue (i.e., eucalyptus species) makes it suitable for structural applications (e.g., at its dry state, it can be effectively used as beams, columns, portal frames and trusses in low-rise and mid-rise residential buildings), whereas the superior flexibility found in the softwood tissue (i.e., cypress species) could be well bio-mimicked into engineered wood products (EWP) and composite biopanels, where the balance between strength and rigidity is of high relevance. Nevertheless, further research is needed to validate our results and also to foresee other engineering applications that could be potentially derived from additional experimental tests (e.g., impact bending strength) and other methods of analysis [e.g., dynamic mechanical analyses (DMA), cell wall analyses (AFM—atomic force microscopy) and determination of the elastic modulus by the Derjaguin–Muller–Toporov (DMT) model to predict mechanical properties]. Indeed, the advanced knowledge, herein, partially contributes to the understanding of the inherent microstructure–performance relationship of eucalyptus and cypress wood tissues.
Author Contributions
Conceptualisation, O.M.G. and A.D.; methodology, O.M.G. and A.D.; software, A.V. and C.R.A.; validation, O.M.G. and A.D.; formal analysis, O.M.G., A.V. and A.G.; investigation, A.V., A.G., H.L.B. and K.V.; resources, O.M.G., A.V. and H.L.B.; data curation, A.V., A.G., C.R.A. and H.L.B.; writing—original draft preparation, O.M.G., A.V. and A.G.; writing—review and editing, O.M.G. and A.D.; data visualization, A.V., A.G. and C.R.A.; supervision, O.M.G.; project administration, O.M.G. All authors have read and agreed to the published version of the manuscript.
Funding
This research received no external funding.
Acknowledgments
The authors acknowledge both the Griffith University in Australia and the Armed Forces University ESPE in Ecuador for providing an adequate learning and technological environment that enabled us to successfully accomplish the objectives in this investigation. Technician Francisco Navas is especially acknowledged for providing laboratory technical support to undertake accurate experimental tests.
Conflicts of Interest
The authors declare no conflict of interest. This research was conducted in the absence of any commercial or financial relationships that could be construed as a potential conflict of interest.
References
- Alam, P. Biomimetic Composite Materials Inspired by Wood in Wood Composites; Elsevier: Amsterdam, The Netherlands, 2015; pp. 357–394. [Google Scholar] [CrossRef]
- Bar-Cohen, Y. Biomimetics: Nature Based Innovation; CRC Press: Boca Raton, FL, USA, 2011; ISBN 1439834768. [Google Scholar]
- Sandhaas, C.; Van de Kuilen, J. Material Model for Wood. Heron 2013, 2, 171–191. [Google Scholar]
- Harte, A. Introduction to Timber as an Engineering Material. In ICE Manual of Construction Materials; Institution of Civil Engineers: London, UK, 2009. [Google Scholar]
- Salmén, L. Wood morphology and properties from molecular perspectives. Ann. For. Sci. 2015, 72, 679–684. [Google Scholar] [CrossRef]
- Wilson, K.; White, D.J.B. The Anatomy of Wood: Its Diversity and Variability; Stobart & Son Ltd.: Cheshire, UK, 1986; ISBN 0854420339. [Google Scholar]
- Ross, R.; Bergman, R.; Cai, Z.; Carll, C.; Clausen, C.; Dietenberger, M.; Falk, R.; Wiemann, M.; Wiedenhoeft, A.; Glass, S.; et al. Wood Handbook: Wood as an Engineering Material; Forest Products Laboratory, General Technical Report FPL-GTR-190; United States, Department of Agriculture, Forest Service: Estacada, OR, USA, 2010; p. 509.
- Butterfield, B.; Meylan, B.; Peszlen, I. Three Dimensional Structure of Wood; Chapman and Hall Ltd.: London, UK, 1997; ISBN 9630488124. [Google Scholar]
- Wiedenhoeft, A.; Miller, R. Structure and Function of Wood. In Handbook of Wood Chemistry and Wood Composites; Taylor & Francis: Washington, DC, USA, 2005; pp. 9–32. ISBN 0-8493-1588-3. [Google Scholar]
- Lewin, D.W. The Eucalypti Hardwood Timbers of Tasmania: And the Tasmanian Ornamental and Softwood Timbers; Publisher Tasmania: Gray, Australia, 1906; Contributor Gerstein - University of Toronto. External-identifier: Urn:oclc:record:697755835; Available online: https://archive.org/details/eucalyptihardwoo00lewiuoft (accessed on 28 February 2020).
- Knippers, J.; Speck, T. Design and construction principles in nature and architecture. Bioinspiration Biomim. 2012, 7, 1–10. [Google Scholar] [CrossRef]
- Speck, T.; Burgert, I. Plant stems: Functional design and mechanics. Annu. Rev. Mater. Res. 2011, 41, 169–193. [Google Scholar] [CrossRef]
- González, O.M. The Ingenious Tree of Life—A Biomechanical Approach to Cocowood Science; Lambert Academic Publishing: Saarbrücken, Germany, 2018; ISBN 978-613-9-87000-4. [Google Scholar]
- González, O.M.; Gilbert, B.; Bailleres, H.; Guan, H. Senile coconut palm hierarchical structure as foundation for biomimetic applications. Adv. Comput. Mech. 2014, 553, 344–349. [Google Scholar] [CrossRef]
- González, O.M.; Nguyen, K. Senile coconut palms: Functional design and biomechanics of stem green tissue. Wood Mater. Sci. Eng. 2017, 12, 98–117. [Google Scholar] [CrossRef]
- Gatsuk, L.E.; Smirnova, O.V.; Vorontzova, L.I.; Zhukova, L.B.Z.A. Age states of plants of various growth forms: A review. J. Ecol. 1980, 68, 675–696. [Google Scholar] [CrossRef]
- Guridi, L. Método de ablandamiento de madera dura y muy dura para la obtención de cortes en xilotomo. Cienc. For. 1977, 2, 59–64. [Google Scholar]
- Samuel, L.; Shellhorn, W.; Robert, W. Rapid Method for preparing wood sections. Stain Technol. 2009, 32, 157–160. [Google Scholar] [CrossRef]
- Carrillo, I.; Aguayo, M.; Valenzuela, S. Variations in wood anatomy and fiber biometry of Eucalyptus globulus genotypes with different wood density. Wood Res. 2015, 1, 1–10. [Google Scholar]
- Schoch, W.; Heller, I.; Schweingruber, F.H.; Kienast, F. Wood Anatomy of Central European Species. 2004. Available online: http://www.woodanatomy.ch/preparation.html (accessed on 28 June 2019).
- Arroyo, C.A.; Debut, A.; Vaca, A.; Stael, C.; Guzman, K.; Cumbal, B. Reliable tools for quantifying the morphogical properties at the nanoscale. Biol. Med. 2016, 8, 1. [Google Scholar] [CrossRef]
- Wadell, H. Sphericity and roundness of rock particles. J. Geol. 1933, 41, 310–331. [Google Scholar] [CrossRef]
- DIN 52182. Testing of Wood: Determination of Density; Deutsches Institut für Normung: Berlin, Germany, 2013. [Google Scholar]
- DIN 52185. Testing of Wood: Compression Test Parallel to Grain; Deutsches Institut für Normung: Berlin, Germany, 2013. [Google Scholar]
- Ugural, A.C. Mechanics of Materials; John Wiley & Sons Inc.: Hoboken, NJ, USA, 2008; ISBN 978-0-471-72115-4. [Google Scholar]
- DIN 52186. Testing of Wood: Bending Test; Deutsches Institut für Normung: Berlin, Germany, 2013. [Google Scholar]
- Gutiérrez, H.; de la Vara, R. Análisis y Diseño de Experimentos, 3rd ed.; McGraw-Hill: New York, NY, USA, 2012; ISBN 970-10-6526-3. [Google Scholar]
- González, O.M.; Nguyen, K. Influence of density distribution on the mechanical efficiency of coconut stem green tissues. In Proceedings of the World Conference on Timber Engineering, Vienna, Austria, 22–25 August 2016, ISSN 978-3-903039-00-1. [Google Scholar]
- Richter, H.; Grosser, D.; Heinz, I.; Gasson, P. List of Microscopic Features for Softwood Identification. IAWA J. 2004, 25, 1–70. [Google Scholar] [CrossRef]
- Sperry, J.; Hacke, U.J.; Pitterman, J. Size and function in conifer tracheids and angiosperm vessels. Am. J. Bot. 2006, 10, 1490–1500. [Google Scholar] [CrossRef] [PubMed]
- Bamber, R. Sapwood and Heartwood; Forestry Commission of New South Wales: Bathurst, Australia, 1987; ISBN 0-7240-2067-5.
- Song, K.; Liu, B.; Jiang, X.; Yin, Y. Cellular Changes of tracheids and Ray Parenchyma Cells from Cambium to Heartwood in Cunninghamia Lanceolata. J. Trop. For. Sci. 2011, 23, 478–487. [Google Scholar]
- Niklas, K. Plant Biomechanics: An Engineering Approach to Plant Form and Function, 1st ed.; University of Chicago Press: Chicago, IL, USA; London, UK, 1992; ISBN 0226586316. [Google Scholar]
- González, O.M. An Engineering Approach to Understand Senile Coconut Palms as Foundation for Biomimetic Applications. Ph.D. Thesis, Griffith School of Sciences and Engineering, Griffith University, Gold Cosat, Queensland, Australia, 2015. [Google Scholar]
- González, O.M.; Gilbert, B.P.; Bailleres, H.; Guan, H. Compressive strength and stiffness of senile coconut palms stem green tissue. In Proceedings of the 23rd Australasian Conference on the Mechanics of Structures and Materials (ACMSM23), Byron Bay, Australia, 9–12 December 2014; pp. 88–886. [Google Scholar]
- González, O.M.; Nguyen, K.A. Cocowood Fibrovascular Tissue System—Another Wonder of Plant Evolution. Front. Plant Sci. 2016, 7, 65. [Google Scholar] [CrossRef] [PubMed]
- Conners, T. Distinguishing Softwoods from Hardwoods; University of Kentucky Agriculture and Natural Resources Publications: Lexington, KY, USA, 2015; Available online: https://uknowledge.uky.edu/anr_reports/105 (accessed on 20 November 2019).
- Zhao, Q. Lignification: Flexibility, biosynthesis and regulation. Trends Plant Sci. 2016, 21, 713–721. [Google Scholar] [CrossRef] [PubMed]
© 2020 by the authors. Licensee MDPI, Basel, Switzerland. This article is an open access article distributed under the terms and conditions of the Creative Commons Attribution (CC BY) license (http://creativecommons.org/licenses/by/4.0/).