Article

Role of the Dominant Species on the Distributions of Neighbor Species in a Subtropical Forest

1
Key Laboratory of Ecology of Rare and Endangered Species and Environmental Protection, Ministry of Education, Guangxi Normal University, Guilin 541006, China
2
College of Life and Environmental Science, Guilin University of Electronic Technology, Guilin 541004, China
3
Key Laboratory of Vegetation Restoration and Management of South China Botanical Garden of Degraded Ecosystems, Chinese Academy of Sciences, Guangzhou 510650, China
4
Center of Plant Ecology, Core Botanical Gardens, Chinese Academy of Sciences, Guangzhou 510650, China
5
Department of Renewable Resources, University of Alberta, Edmonton, AB T6G 2H1, Canada
6
College of Life Science, Anqing Normal University, Anqin 246011, China
7
Co-Innovation Center for Sustainable Forestry in Southern China, College of Biology and the Environment, Nanjing Forestry University, Nanjing 210037, China
*
Author to whom correspondence should be addressed.
Authors made equal contribution.
Forests 2020, 11(3), 352; https://doi.org/10.3390/f11030352
Submission received: 24 February 2020 / Revised: 18 March 2020 / Accepted: 18 March 2020 / Published: 20 March 2020
(This article belongs to the Special Issue Modeling of Species Distribution and Biodiversity in Forests)

Abstract

:
Understanding the role of dominant species in structuring the distribution of neighbor species is an important part of understanding community assembly, a central goal of ecology. Phylogenetic information helps resolve the multitude of processes driving community assembly and the importance of evolution in the assembly process. In this study, we classified species in a 20-ha subtropical forest in southern China into groups with different degrees of phylogenetic relatedness to the dominant species Castanopsis chinensis. Species surrounding individuals of C. chinensis were sampled in an equal area annulus at six spatial scales, counting the percent of relatives and comparing this to permutation tests of a null model and variance among species groups. The results demonstrated that dominant species affected their relatives depending on community successional stage. Theory would predict that competitive exclusion and density-dependence mechanisms should lead to neighbors that are more distant in phylogeny from C. chinensis. However, in mature forests distant relatives were subjected to competitive repulsion by C. chinensis, while environment filtering led to fewer distant species, regardless of scale. A variety of biological and non-biological factors appear to result in a U-shaped quantitative distribution determined by the dominant species C. chinensis. Scale effects also influenced the dominant species. As a dominant species, C. chinensis played an important role in structuring the species distributions and coexistence of neighbor species in a subtropical forest.

1. Introduction

Community assembly has been one of the major over-arching topics in community ecology with species distributions being fundamental to understanding community assembly [1]. In general, two processes are thought to be fundamental in shaping the spatial distributions of species in plant communities: niche and neutral processes [2]. Niche processes allows survival of species that are adapted to local habitats. Much prior research has examined how the distribution of species is the outcome of niche processes such as interactions between biological and ecological processes [3]. In contrast to niche processes, neutral processes suggest that plant communities can be modeled without regard for species identity resulting in random species distributions [4]. Recent studies suggest that both niche and neutral processes affect species distributions [5]. Thus so far, there are many studies examining processes and phenomena of community assembly assume species to be independent from one another. However, a species, especially a dominant species, may have directional and endogenous relationships with neighboring species and their distribution.
Ecological dominance is the degree to which a taxon within an ecological community is more numerous either numerically or by biomass [6]. For tree species in forests, species with most numerous and of largest size is considered as the dominant species. Phylogenetic relationships between a dominant species and its neighbors depend on the relative importance of the ecological mechanisms of community assembly involved. The study of these relationships is called “community phylogenetics” [7]. Considering that most traits are phylogenetically conserved niche conservatism was supported dominantly [8], although counter examples exist [9]. A descriptive statistic that indicates the strength of phylogenetic signal was derived [10], then used to quantify whether there was phylogenetic signal in plant-habitat associations – information critical for inferring which ecological process has influenced community assembly the most [11]. Close relatives to a neighbor species may represent the effects of environmental filtering given niche conservatism, while more distant relatives may represent the effects of competition for limited resources. Close relatives with similar phenotypes are filtered into a community from the regional species pool, and therefore, utilize analogous resources. Under limited resources, survival necessitates repulsion among closely related species thus preventing local coexistence [12]. Conversely, resource competition and predation or disease limit coexistence of close relative individuals and is widely acknowledged as negative density-dependence. Uriarte et al. [13] studied how neighbors influenced sapling growth in the Barro Colorado Island (BCI) plot finding that confamilial neighbors exerted stronger negative effects than non-confamilial neighbors. Both environmental filtering and negative density-dependence can be categorized into niche process, which differs from the neutral process of biodiversity proposed by Hubbell [1]. Thus, a third possibility is that neighbor species are neutral (random) in relationship to the dominant species. Predicted responses based on theory between phylogenetic distance of a dominant species and its neighbors are summarized in Table 1.
On the other hand, community assembly is recognized as a dynamic progression, one of which means as community succession. Community succession is a process of ecological change in the species structure of an ecological community over time [14]. Faith proposed that communities at early successional stages are expected to be colonized by the pioneer species that are well dispersed, and can tolerate harsh environments, while their competition interactions within communities are weak [15]. As succession proceeds and later arriving species are established, some ecologists found that the importance of biotic interactions would be increased [16]. That is, the interplay between environmental heterogeneity and competition interactions can have complex effects on the long-term persistence of the interacting species.
Dominant species play a key role in community structure, influencing the survival and distribution of others species [17]. Phylogenetic information helps resolve the multitude of processes structuring community assembly and the importance of evolution in the assembly process [7,18]. However, few studies focused on phylogenetic relationships between a dominant species and its neighbors, which could be a useful way to explore the mechanisms in community assembly. To address this gap, we explored, at the community level, the effect of a dominant species Castanopsis chinensis on their neighbor species in a 20 ha species-rich subtropical forest (Dinghushan Plot, DHS Plot) in southern China. C. chinensis is one of the most dominant tree species in lower subtropical China. It is a canopy species with its establishment providing subsequent suitable microenvironments for later successional species [5,19]. Based on the prediction in Table 1, we reason that environment filtering would lead to positive relationship between C. chinensis and phylogenetic distance of neighbor species and the abundance of closely related species will more than expected randomly distribution. Conversely, negative density-dependence lead to negative relationship between C. chinensis and phylogenetic distance of neighbor species and the abundance of distantly related species will more than expected randomly distribution. Our objectives here were to: (1) explore the distribution of neighbor species to the dominant species C. chinensis based on phylogenetic distance to test hypotheses with respect to relationships between dominant species and their neighbors (i.e., environmental filtering, negative density-dependence or neutrality; Table 1); and (2) test whether this relationship will be consistent across the successional stages of community development (i.e., successional and mature forests).

2. Methods

2.1. Study Area

The study area was located in the Dinghushan Mountain (112°30′39″–112°33′41″ E, 23°09′21″–23°11′30″ N) in Guangdong Province(The map in reference [20]). Dinghushan was the first Nature Reserve established in China in 1956. The reserve is covered by tropical-subtropical forests and comprised of low mountains and hilly landscapes. Dinghushan has a south subtropical monsoon climate with a mean annual temperature of 20.9 °C. Annual mean precipitation is 1929 mm with most of the precipitation occurring between April and September. Annual evaporation is 1115 mm and relative humidity averages 82% [21].
A permanent 20 ha (400 m × 500 m) plot called the DHS Plot was established in the Dinghushan reserve in November 2004. Investigating and mapping of trees was completed in October 2005. Field protocols followed that of the Center for Tropical Forest Science (CTFS) with all free standing trees and shrubs of ≥1 cm in diameter at breast height (DBH) identified, measured for height and diameter, and their location mapped [22,23]. The plot is characterized as having rough terrain with a steep hillside in the southeast corner. Topography varies between ridges and valleys with elevation ranging from 240 to 470 m a.s.l. In total, 71,457 individuals were mapped in the 20 ha plot. Thirty species were composed of singletons, while 110 species had fewer than 20 individuals [24].

2.2. Successional Stages

The forest is free of human disturbance for 400 years according to the records of a nearby Buddhist monastery. However, according to local history, the northeast part of the plot was assumed to be established approximately 60 years ago [25]. In order to confirm that these two parts of the plot are at different age and successional stage, we took advantage of distribution of Castanopsis chinensis and Pinus massoniana in the plot. C. chinensis is assumed to be the foundation tree species when Dinghushan subtropical forest is close to successional climax. P. massoniana is a pioneer species and its prosperity suggests early successional stage.
We found that the small and large individuals of C. chinensis were discriminately distributed in the plot. Generally, large trees of C. chinensis (DBH ≥40 cm) occurred mostly in the southeast corner of the plot, while P. massoniana occurred mostly within the west part of plot (Figure 1). The west part of the plot was planted to P. massoniana and then protected for more than 60 years (since the establishment of the nature reserve). P. massoniana is now in a state of recession with C. chinensis replacing P. massoniana.
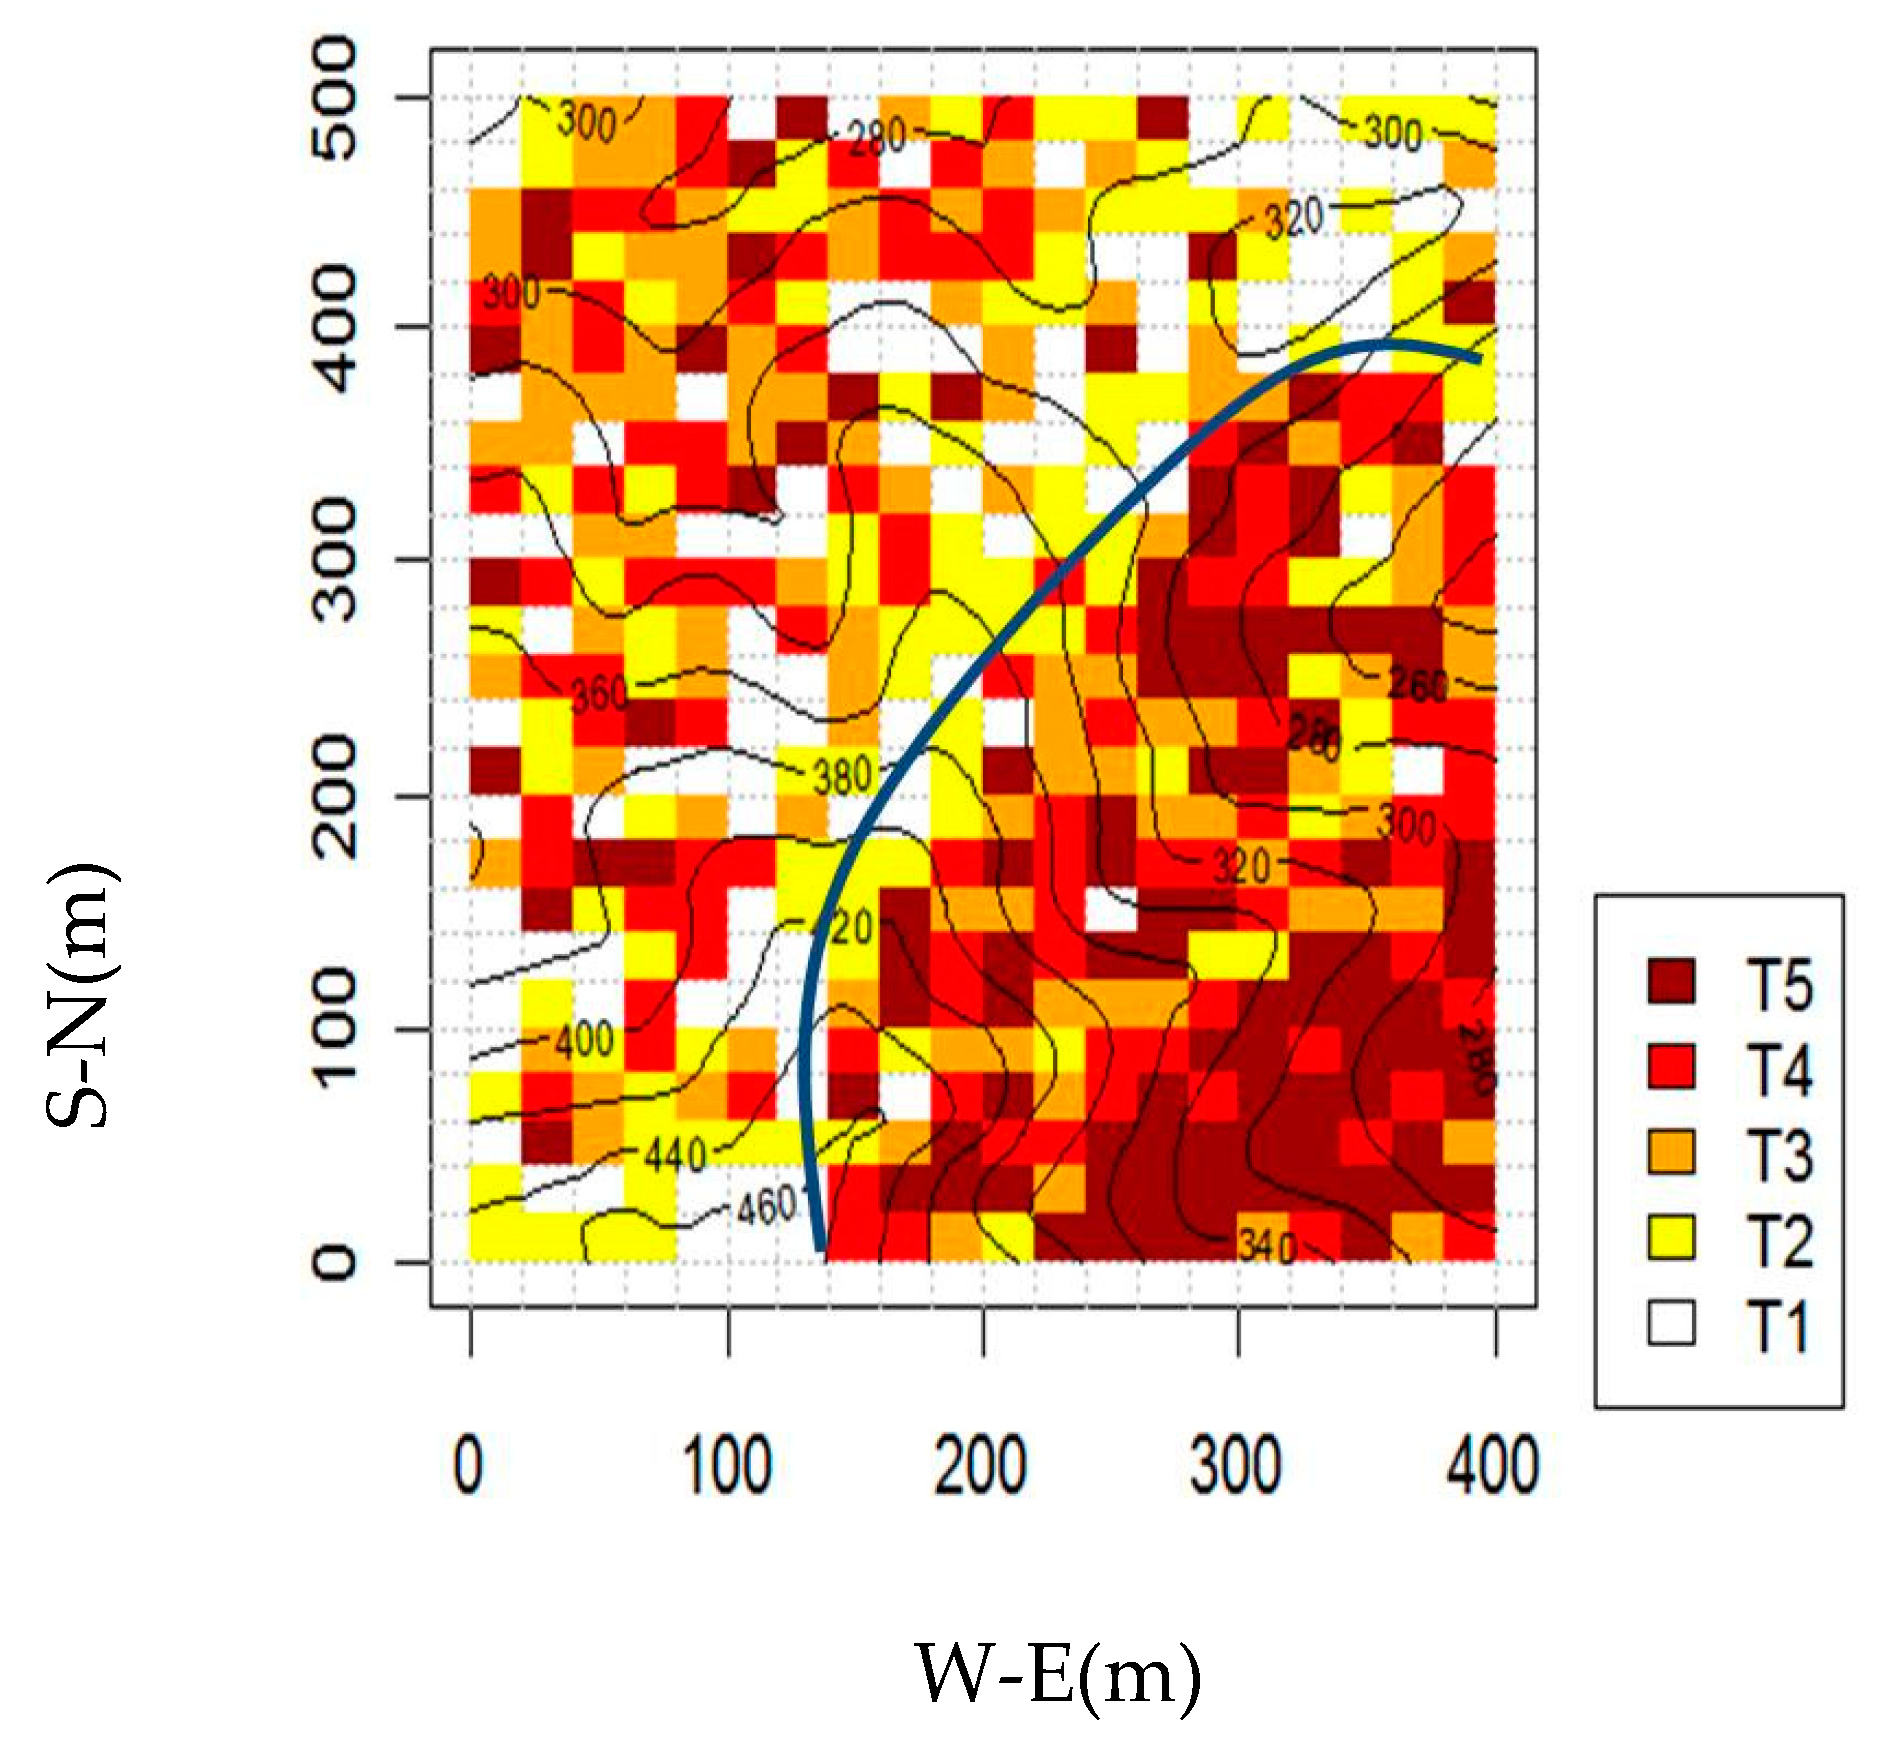
For determining the dividing line between these two parts, we calculated relative age of each 20 m × 20 m quadrat. We calculated the relative age of the biggest four trees in each quadrat, which is the dbh of each individual divided by the biggest one of the same species in DHS Plot [26]. The mean of the relative age of these four trees were taken as the relative age of the qudrate. The quadrats were classified into five groups (T1 to T5 from the youngest to the oldest) based on relative age (Figure 2). We obtained a line to separate the old-growth and the young subplots (the blue line in Figure 2). On the left of the line with light colored denoted the young patch, while on the right of the line with dark colored was the old-growth patch.

2.3. The Relatedness between Castanopsis chinensis and Other Species

We got the values of phylogenetic distance (relatedness) between C. chinensis with other tree species in the plot using three DNA barcode loci [27], standard barcode primers (rbcL, matK, trnH-psbA) were suggested by the Consortium for the Barcode of Life (http://barcoding.si.edu/). DNA sequences were generated for 1–2 tagged individuals located within the DHS plot. Genomic DNA was extracted from leaf and bark tissue using the standard CTAB protocol [28]. We then used Hierarchical cluster analysis to classify 194 species into six phylogenetically-similar groups using phylogenetic distance for 194 species (Table 2), from a closely related species group (Group 1) to distantly related species group (Group 6) respectively. Group 1 contains the fewest number of speice (Castanopsis fissa), distantly related species group contains a small number of the forest species (4 species), and the medium related species group 3 contains the largest number of species and highest abundance in the whole plot (Table 2).

2.4. Data Analysis

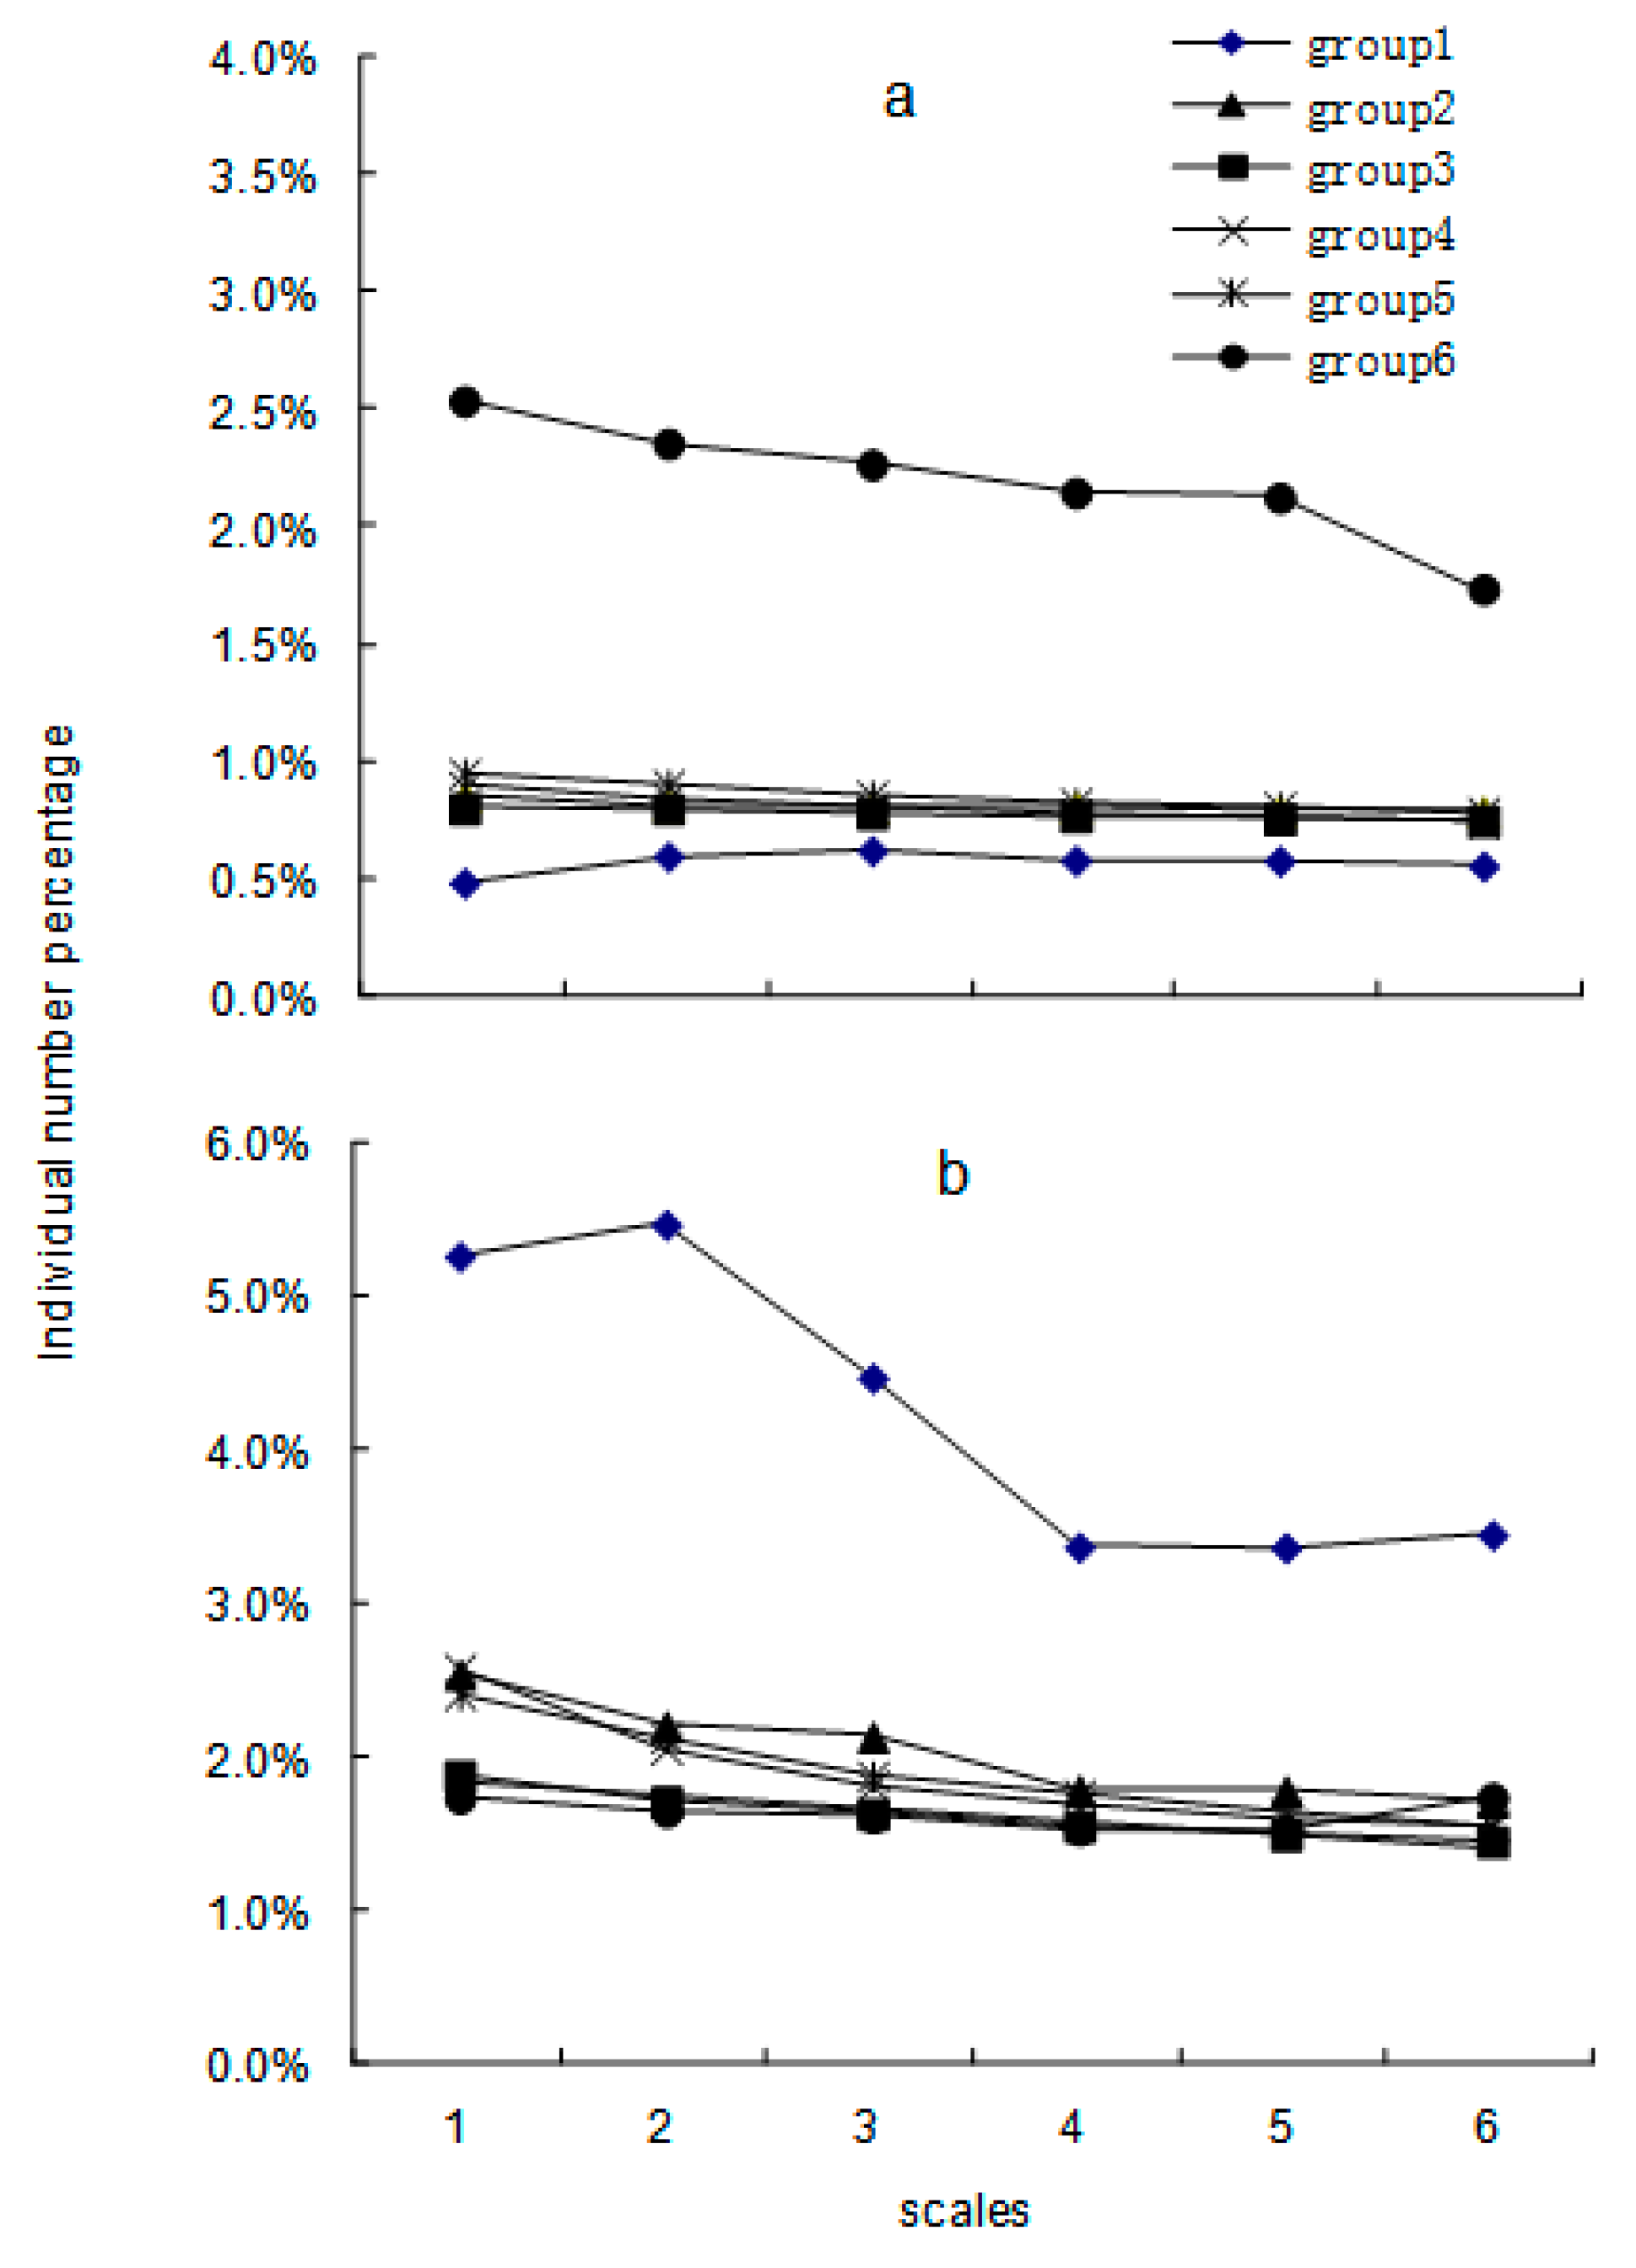
We used C. chinensis with DBH ≥10 cm as the center of distance annuli and sampled the number of individuals within each phylogenetic group. We used 20 m, the scale always used as the minimum observation size of forest plots, to test the phylogenetic relationships between C. chinensis and other individuals within the distance annulus. To avoid a sampling scale bias, we also reported the results for 28.28 m, 34.64 m, 40 m, 44.72 m, and 48.99 m with the same sampled area in the Supplementary Materials. There were 2061 C. chinensis trees in the succession forest, so there were 2061 sampling annulus. There are 161 C. chinensis trees in the mature forest, also 161 annulus are used to sample the mature forest. Individuals of each phylogenetic group within each annulus were counted and the mean number of individuals of each phylogenetic group calculated. Finally, we counted the mean individual percent (IP) of each phylogenetic group’s total abundance (Figure 3).
Specifically, we used simulations to estimate a null model of “individual percent” in each phylogenetic group by randomizing the label of the species name in the phylogenetic group to control for the effect of phylogenetic relationships. 999 random samples were simulated keeping the number of species of each phylogenetic group the same as reported in Table 2. However, the number of individuals of each phylogenetic group was randomly changed. Occasionally, the most closely-related (Group 1) and most distantly-related species (Group 6) were sampled with nearly the same number of individuals as Group 3. Individual percent was calculated for each simulation, thus resulting in 999 individual percentages. If the observed percentage fell within the 2.5th and 97.5th quartiles, then we failed to reject the null hypothesis of a random distribution of phylogenetic relationships, otherwise we concluded that there was a significant phylogenetic relationship between the dominant species C. chinensis and neighbor tree species.
In order to test the robustness of our results we perform Mantel test. We measured the correlation between two matrices in each annulus with 999 permutations: the matrix of phylogenetic distance between C. chinensis and other trees and the matrix of geographic distance between C. chinensis and other trees. The oberservation value of Mantel test is the coefficient of correlation r. All analyses were conducted in R2.6.2 platform, which was available from R Foundation for Statistical Computing, Vienna, Austria (ISBN 3-900051-07-0, http://www.R-project.org). And the Mantel test was completed using R package “ADE4” [29].
In order to test phylogenetic signal of functional traits, the current functional trait data were used to verify whether there is pedigree conservatism in Dinghushan sample plots (Table S1). The descriptive statistic K presented in Blomberg et al. was used to measure the phylogenetic signal [10]. The significance of the observed K value was determined using a permutation test. To evaluate the significance of the phylogenetic signal K, we generated a null expectation of K under no phylogenetic signal by randomizing the names of taxa 1000 times in the phylogeny [11], and a probability (p-value) that the observed K is higher than randomization is calculated. Thus, this probability indicates statistical significance of phylogenetic signal of a functional trait across a phylogeny.

3. Results

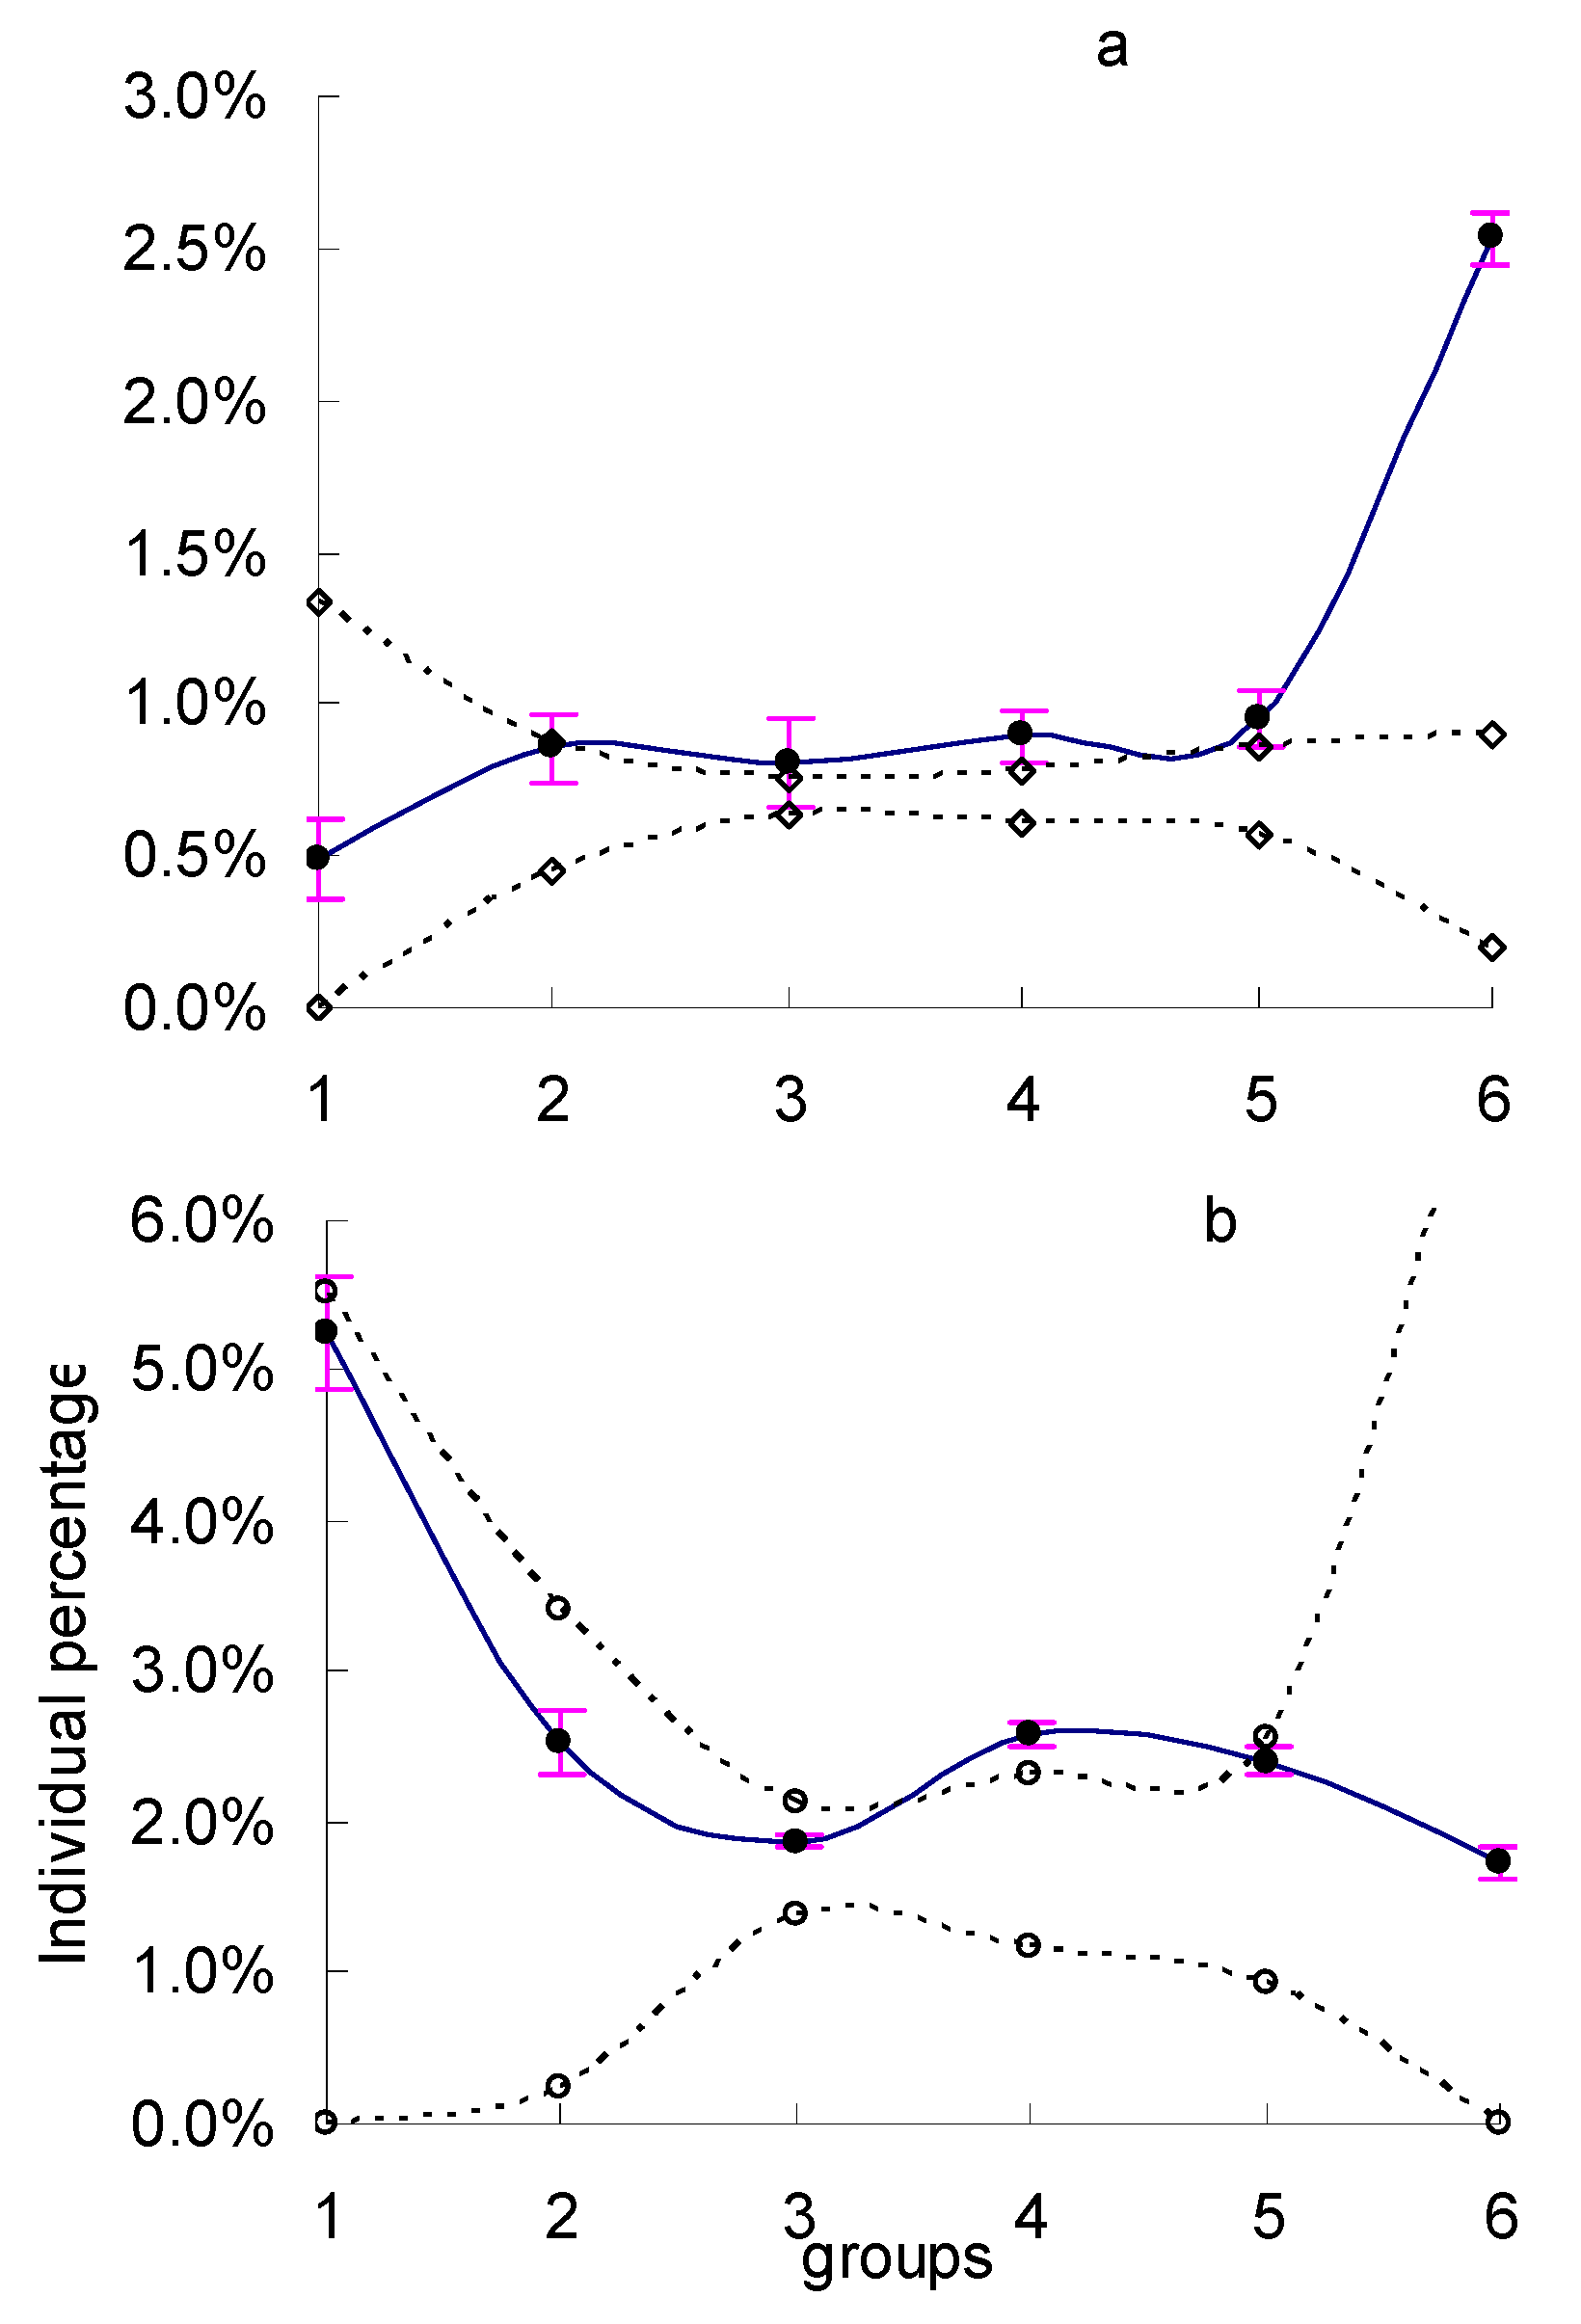
For the whole plot (20 ha), evaluation of the genetic distribution of neighboring trees with C. chinensis demonstrated a scale-invariant relationship between phylogenetic distance of neighboring trees and C. chinensis (Figure S1; Figure S2). Based on data from all subplots, the relationship of phylogenetic distance of C. chinensis and the percent of neighbors within different annuli suggested that neighbors of C. chinensis were either more likely to be closely related or more distantly related. Specifically, C. chinensis had more individuals of Group 1 (more closely-related) and Group 6 (more distantly-related) than expected from a null distribution. Groups 3 and 4 represented intermediate relatedness to C. chinensis and had the lowest percent of individuals adjacent to C. chinensis across all observed scales (Figure S2). However, in the successional forests, the results indicated that the percentage of neighbor trees of C. chinensis was higher than the values expected from a null model, except for the most closely related species (i.e., Group 1), at all observed scales (Figure 4a; Figure S3). Meanwhile, in the mature forest, the frequency of neighbors around C. chinesis for the phylogenetically closely related species (Group 1,2,3,5) and most phylogenetically distantly related species (Group 6) were random. But for the groups 4, the frequency of those species was higher than null model expected (Figure 4b). Group 1 was significantly more abundant depending on the scale across all observed scales (Figure S4).
The results of Mantel test showed that in the whole plot, there was no significant positive or negative correlations existed between geographic distance between C. chinensis and other trees, and phylogenetic distance between C. chinensis and other trees (p-value = 0.644>0.05, Observation value = 0.002). However, in mature forests, negative relationship was found between geographic distance between C. chinensis and other trees, and phylogenetic distance between C. chinensis and other trees (p-value = 0.027 < 0.05, Observation value = −0.017). In the successional forests, the results indicated that correlation between geographic distance between C. chinensis and other trees, and phylogenetic distance between C. chinensis and other trees was positive (p-value = 0.039<0.05, Observation value = 0.018).
Seven traits of 194 species used in this study were also tested by K values, and the K values of all 7 species were between 0 and 1. We used p-value to judge the significance of the functional character phylogenetic signal by comparing the K value with the random distribution. The results of testing phylogenetic signal showed that five of seven traits exhibit significant phylogenetic signals (p < 0.05), leaf thickness was marginally significant (p = 0.06), and leaf area was not significant (p = 0.956; Table S1).

4. Discussion

The relationship between phylogenetic distance and ecological similarity is a key topic of community assembly [30]. Phylogenetic relationships influence the strength of species’ interactions (competition or facilitation) [31]. Five of seven traits exhibit significant phylogenetic signals and the result showed phylogenetically conserved in Dinghushan plot. Previous studies have found that closely related species tend to more directly compete with one another [12]. However, examples are known of facilitation between congeneric species which are known to be closely related species [32]. In what circumstances facilitation or competition occurs among closely related species is largely unknown and in need of further study. To our knowledge, our study is the first to test, from the perspective of the competitor, whether the relationship of neighbor species to a dominant species relates its phylogenetic distance. Results demonstrated that across the 20 ha Dinghushan plot, more closely-related species and more distantly-related species were more likely to have individuals around the dominant species C. chinensis than expected by a null (random) model (Figure 4; Figure S1). Dominant species may provide facilitation for more closely-related relatives [32] resulting in more individuals from closely related species. At the same time, the distribution of 90% of the species (abundance ≥20) in the DHS plot was affected by topographic factors (e.g., slope, aspect, convexity, and elevation) [33]. It may promote competition in the same terrain, so more distantly-related species could make sufficient use of local resources that would differ from a dominant competitor thus supporting more individuals and species. Only the moderately-related species were neither facilitated by dominant species, nor differentiated enough to adapt to the competition surrounding our dominant competitors.
We also tested the role of dominant species in structuring neighbors at different successional stages in the same plot. Different successional stages led to different interactions among species (Figure 4) manifested by different community composition and distribution patterns. As illustrated in this study, the role of a dominant species on their surrounding species can change during community succession. The correlation between the DBH matrix of all C. chinensis and the geographical distance matrix from C. chinensis to other individuals were positively related in the whole plot by Mantel test (p-value = 0.032<0.05, Observation value = 0.029). That is, the larger DBH of C. chinensis, the more space it occupies, the greater the geographical distance between C. chinensis and other individuals. The mature patch of forest in the DHS plot experienced at least 400 years of succession after formal protection. Dominant species C. chinensis had large average sizes (average DBH 49 cm; largest tree in plot of 175 cm DBH) inferring a size advantage over other tree species. Large C. chinensis trees were primarily distributed along the ridge of the mountain (Figure 1) and dominated the top of the canopy, interferes with the relationship between the normal geographical distance matrix and the phylogenetic distance. This was the reason for the mantel test between geographic distance between C. chinensis and other trees, and phylogenetic distance between C. chinensis and other trees, give very low coefficients of correlations (observed value) and not very low p value. The spatial separation between plot with dominance of C. chinensis or P. massoniana can cause biased p-value as Guillot et Rousset’s research [34]. And the mantel test revealed that, there were positive or negative correlations between geographic distance and phylogenetic distance in the successional forest or mature forest. Prior studies in this plot reported the distribution of 24 species were associated with niche differentiation [33], and with seedling mortality being related to patterns in the terrain [35]. Therefore, habitat selection (environmental filtering) can be suggested as another mechanism influencing the distribution of neighboring trees.
In the younger successional forest (60 years of age) derived from tree plantings of P. massoniana, C. chinensis is still the dominant species (abundance 2113, average DBH 25.2 cm). A null model test rejected the distribution of the most phylogenetically-related species (e.g., Group 1) around C. chinensis. Neighbors having greater phylogenetic distance were more likely to occur around C. chinensis (Figure 4a). A recent study suggested that intra-specific competitive exclusion and density-dependence appear to play important roles in tree mortality in this subtropical forest [36]. The successional patch of forest had more individuals and higher densities than the mature patch of forest. Competitive exclusion and density-dependence here should be stronger resulting in larger percentages of neighbors occurring from more distant-related groups.
The effect of the dominant species on its neighbor species differed among successional and mature forests (Figure 3 and Figure 4). This may explain why some studies found that more related species were aggregated [37,38], while others showed a repulsion of related species [16,39]. Target species may not have been common enough and/or phylogenetic relationships were not fully considered. We suggest that competitive exclusion or stable coexistence of neighboring species is determined partly by which successional phase that species occurs in. Spatial aggregation generally decreases with DBH, aggregation is weaker at larger diameter classes is largely due to self thinning [20], competitive associations were more frequently intraspecific than interspecific (Shen, 2013 [36]). In this study, individuals which DBH ≥40 cm are mainly distributed in mature forests, the frequency of neighbors around C. chinesis for the phylogenetically closely related species and most phylogenetically distantly related species (Group 6) were random. However, in the successional forests, young trees are most, the percentage of neighbor trees of C. chinensis was the most closely related species (i.e., Group 1), at all observed scales (Figure 4a; Figure S2).
In summary, we found that, as a dominant species, Castanopsis chinensis played an important role in structuring the species distributions and coexistence of neighbor species in a subtropical forest. Community successional stages and environmental filtering appeared to affect neighbor species relationships.

Supplementary Materials

The following are available online at https://www.mdpi.com/1999-4907/11/3/352/s1, Figure S1: Distribution of neighbor trees within a 20 m radius to Castanopsis chinensis based on phylogenetic distance (six ordinal groups) in whole plot; Figure S2: Distribution of neighbor trees at six scales to Castanopsis chinensis based on phylogenetic distance (six ordinal groups) in whole plot; Figure S3: Distribution of neighbor trees at six scales to Castanopsis chinensis based on phylogenetic distance (six ordinal groups) in succession forest; Figure S4: Distribution of neighbor trees at six scales to Castanopsis chinensis based on phylogenetic distance (six ordinal groups) in mature forest; Table S1: Results from a test for phylogenetic signal in the functional trait data the 20 ha DHS plot, using the K statistic.

Author Contributions

W.Y., L.L. and J.L. designed the study, S.W. and L.L. performed analyses, S.W., H.C., Z.W., L.M. and X.O. collected data, S.W., L.L. and J.L. wrote the first draft of the manuscript. W.Y., S.E.N. and J.L. contributed substantially to revisions. All authors have read and agreed to the published version of the manuscript.

Funding

The study was funded by Strategic Priority Research Program of the Chinese Academy of Sciences (XDB31030000), the National Key R&D Program of China (grand No. 2017YFC0505802), National Natural Science Foundation of China (No. 41371078,No. 31870506, 31460155), Natural Science Foundation of Jiangsu Province (BK20181398), Key Laboratory of Ecology of Rare and Endangered Species and Environmental Protection (Guangxi Normal University), Ministry of Education, China and Chinese Forest Biodiversity Monitoring Network.

Acknowledgments

We appreciate Zhongliang Huang for the help of collecting data. We are grateful to Yue Bin for insightful suggestions on the revision of the MS. We thank many individuals who contributed to the field survey of the Dinghu plot. This plot is part of the Center for Tropical Forest Science, a global network of large-scale demographic tree plots. We would like to thank all of the reviewers and editors for reading the manuscript and providing useful feedback.

Conflicts of Interest

The authors declare no conflict of interest.

References

  1. Hubbell, S.P. The Unified Neutral Theory of Biodiversity and Biogeography; Princeton University Press: Princeton, NJ, USA, 2001. [Google Scholar]
  2. Legendre, P.; Mi, X.; Ren, H.; Ma, K.; Yu, M.; Sun, I.F.; He, F. Partitioning beta diversity in a subtropical broad-leaved forest of China. Ecology 2009, 90, 663–674. [Google Scholar] [CrossRef] [Green Version]
  3. He, F.L.; Duncan, P.R. Density-Dependent Effects on Tree Survival in an Old-Growth Douglas Fir Forest. J. Ecol. 2000, 88, 676–688. [Google Scholar] [CrossRef]
  4. Swenson, N.G.; Enquist, B.J.; Thompson, J.; Zimmerman, J.K. The influence of spatial and size scale on phylogenetic relatedness in tropical forest communities. Ecology 2007, 88, 1770–1780. [Google Scholar] [CrossRef] [Green Version]
  5. Wang, Z.F.; Lian, J.Y.; Huang, G.M.; Ye, W.H.; Cao, H.L.; Wang, Z.M. Genetic groups in the common plant species Castanopsis chinensis and their associations with topographic habitats. Oikos 2012, 121, 2044–2051. [Google Scholar] [CrossRef]
  6. Martorell, C.; Freckleton, R.P. Testing the roles of competition, facilitation and stochasticity on community structure in a species-rich assemblage. J. Ecol. 2014, 102, 74–85. [Google Scholar] [CrossRef]
  7. Cavender-Bares, J.; Kozak, K.H.; Fine, P.V.A.; Kembel, S.W. The merging of community ecology and phylogenetic biology. Ecol. Lett. 2009, 12, 693–715. [Google Scholar] [CrossRef]
  8. Peterson, A.T. Ecological niche conservatism: A time-structured review of evidence. J. Biogeogr. 2011, 38, 817–827. [Google Scholar] [CrossRef]
  9. Gerhold, P.; Cahill, J.F.; Winter, M.; Bartish, I.V.; Prinzing, A. Phylogenetic patterns are not proxies of community assembly mechanisms (they are far better). Funct. Ecol. 2015, 29, 600–614. [Google Scholar] [CrossRef]
  10. Blomberg, S.P.; Garland, T.; Ives, A.R. Testing for phylogenetic signal in comparative data: Behavioral traits are more labile. Evolution 2003, 57, 717–745. [Google Scholar] [CrossRef]
  11. Pei, N.C.; Lian, J.Y.; Erickson, D.L.; Swenson, N.G.; Kress, W.J.; Ye, W.H.; Ge, X.J. Exploring Tree-Habitat Associations in a Chinese Subtropical Forest Plot Using a Molecular Phylogeny Generated from DNA Barcode Loci. PLoS ONE 2011, 6, e21273. [Google Scholar] [CrossRef]
  12. Mooney, K.A.; Jones, P.; Agrawal, A.A. Coexisting congeners: demography, competition, and interactions with cardenolides for two milkweed-feeding aphids. Oikos 2008, 117, 450–458. [Google Scholar] [CrossRef]
  13. Uriarte, M.; Canham, C.D.; Thompson, J.; Zimmerman, J.K. A neighborhood analysis of tree growth and survival in a hurricane-driven tropical forest. Ecol. Monogr. 2004, 74, 591–614. [Google Scholar] [CrossRef]
  14. Réjou-Méchain, M.; Flores, O.; Pélissier, R.; Fayolle, A.; Fauvet, N.; Gourlet-Fleury, S. Tropical tree assembly depends on the interactions between successional and soil filtering processes. Glob. Ecol. Biogeogr. 2014, 23, 1440–1449. [Google Scholar] [CrossRef]
  15. Faith, D.P. Conservation evaluation and phylogenetic diversity. Biol. Conserv. 1992, 61, 1–10. [Google Scholar] [CrossRef]
  16. Letcher, S.G.; Chazdon, R.L.; Andrade, A.C.S.; Bongers, F.; Breugel, M.V.; Finegan, B.; Laurance, S.G.; Mesquita, R.; Martínez Ramos, M.; Williamson, G.B. Phylogenetic community structure during succession: Evidence from three Neotropical forest sites. Perspect. Plant. Eco. 2012, 14, 79–87. [Google Scholar] [CrossRef]
  17. Paine, R.T. Intertidal community structure: experimental studies on the relationship between a dominant competitor and its principal predator. Oecologia 1974, 15, 93–120. [Google Scholar] [CrossRef]
  18. Vamosi, S.; Heard, S.; Vamosi, J.; Webb, C. Emerging patterns in the comparative analysis of phylogenetic community structure. Mol. Ecol. 2009, 18, 572–592. [Google Scholar] [CrossRef]
  19. Ren, H.; Yang, L.; Liu, N. Nurse plant theory and its application in ecological restoration in lower subtropics of China. Prog. Nat. Sci. 2008, 18, 137–142. [Google Scholar] [CrossRef]
  20. Li, L.; Huang, Z.L.; Ye, W.H.; Cao, H.L.; Wei, S.G.; Wang, Z.G.; Lian, J.Y.; Sun, Y.F.; Ma, K.P.; He, F.L. Spatial distributions of tree species in a subtropical forest of China. Oikos 2009, 118, 495–502. [Google Scholar] [CrossRef]
  21. Ye, W.H.; Cao, H.L.; Huang, Z.L.; Lian, J.Y.; Wang, Z.G.; Li, L.; Wei, S.G.; Wang, Z.M. Community structure of a 20 hm2 lower subtropical evergreen broadleaved forest plot in Dinghushan, China. J. Plant. Ecol.-China 2008, 32, 274–286. [Google Scholar]
  22. Wei, S.G.; Li, L.; Walther, B.A.; Ye, W.H.; Huang, Z.L.; Cao, H.L.; Lian, J.Y.; Wang, Z.G.; Chen, Y.Y. Comparative performance of species-richness estimators using data from a subtropical forest tree community. Ecol. Res. 2010, 25, 93–101. [Google Scholar] [CrossRef]
  23. Harms, K.E.; Condit, R.; Hubbell, S.P.; Foster, R.B. Habitat associations of trees and shrubs in a 50-ha neotropical forest plot. J. Ecol. 2001, 89, 947–959. [Google Scholar] [CrossRef]
  24. Li, L.; Wei, S.-G.; Huang, Z.-L.; Ye, W.-H.; Cao, H.-L. Spatial patterns and interspecific associations of three canopy species at different life stages in a subtropical forest, China. J. Integr. Plant Biol. 2008, 50, 1140–1150. [Google Scholar] [CrossRef]
  25. Zhang, H.D.; Wang, B.S.; Zhang, C.C.; Qiu, H.X. A study of plant community of Dinghushan in Gaoyao, Guangdong. Acta Sci. Nat. Univ. Sunyatseni 1955, 159–225. [Google Scholar]
  26. Lian, J.Y.; Chen, C.; Huang, Z.L.; Cao, H.L.; Ye, W.H. Community composition and stand age in a subtropical forest, southern China. Biodivers. Sci. 2015, 23, 174–182. [Google Scholar] [CrossRef]
  27. Kress, W.J.; Erickson, D.L.; Jones, F.A.; Swenson, N.G.; Perez, R.; Sanjur, O.; Bermingham, E. Plant DNA barcodes and a community phylogeny of a tropical forest dynamics plot in Panama. Proc. Natl. Acad. Sci. USA 2009, 106, 18621–18626. [Google Scholar] [CrossRef] [Green Version]
  28. Doyle, J.; Doyle, J. A rapid DNA isolation procedure for small quantities of fresh leaf tissue. Phytochem. Bull. 1986, 19, 11–15. [Google Scholar]
  29. Chessel, D.; Dufour, A.B.; Thioulouse, J. The ade4 package-I- One-table methods. R News 2004, 4, 5–10. [Google Scholar]
  30. Cadotte, M.W.; Dinnage, R.; Tilman, D. Phylogenetic diversity promotes ecosystem stability. Ecology 2012, 93, 223–233. [Google Scholar] [CrossRef] [Green Version]
  31. Hughes, A.R.; Inouye, B.D.; Johnson, M.T.; Underwood, N.; Vellend, M. Ecological consequences of genetic diversity. Ecol. Lett. 2008, 11, 609–623. [Google Scholar] [CrossRef]
  32. Beltrán, E.; Valiente-Banuet, A.; VerdúVerd, M. Trait divergence and indirect interactions allow facilitation of congeneric species. Ann. Bot. 2012, 110, 1369–1376. [Google Scholar] [CrossRef]
  33. Wang, Z.; Ye, W.; Cao, H.; Huang, Z.; Lian, J.; Li, L.; Wei, S.; Sun, I.F. Species-topography association in a species-rich subtropical forest of China. Basic Appl. Ecol. 2009, 10, 648–655. [Google Scholar] [CrossRef]
  34. Guillot, G.; Rousset, F. Dismantling the Mantel tests. Methods Ecol. Evol. 2013, 4, 336–344. [Google Scholar] [CrossRef] [Green Version]
  35. Bin, Y.; Lian, J.; Wang, Z.; Ye, W.; Cao, H. Tree Mortality and Recruitment in a Subtropical Broadleaved Monsoon Forest in South China. J. Trop. For. Sci. 2011, 23, 57–66. [Google Scholar]
  36. Shen, Y.; Santiago, L.S.; Ma, L.; Lin, G.J.; Lian, J.Y.; Cao, H.L.; Ye, W.H. Forest dynamics of a subtropical monsoon forest in Dinghushan, China: recruitment, mortality and the pace of community change. J. Trop. Ecol. 2013, 29, 131–145. [Google Scholar] [CrossRef] [Green Version]
  37. Cornwell, W.; Ackerly, D. Community assembly and shifts in plant trait distributions across an environmental gradient in coastal California. Ecol. Monogr. 2009, 79, 109–126. [Google Scholar] [CrossRef] [Green Version]
  38. Kembel, S.W.; Hubbell, S.P. The phylogenetic structure of a neotropical forest tree community. Ecology 2006, 87, S86–S99. [Google Scholar] [CrossRef]
  39. Darwin, C. On The Origin of Species by Means of Natural Selection. Am. Anthropol. 1963, 61, 176–177. [Google Scholar]
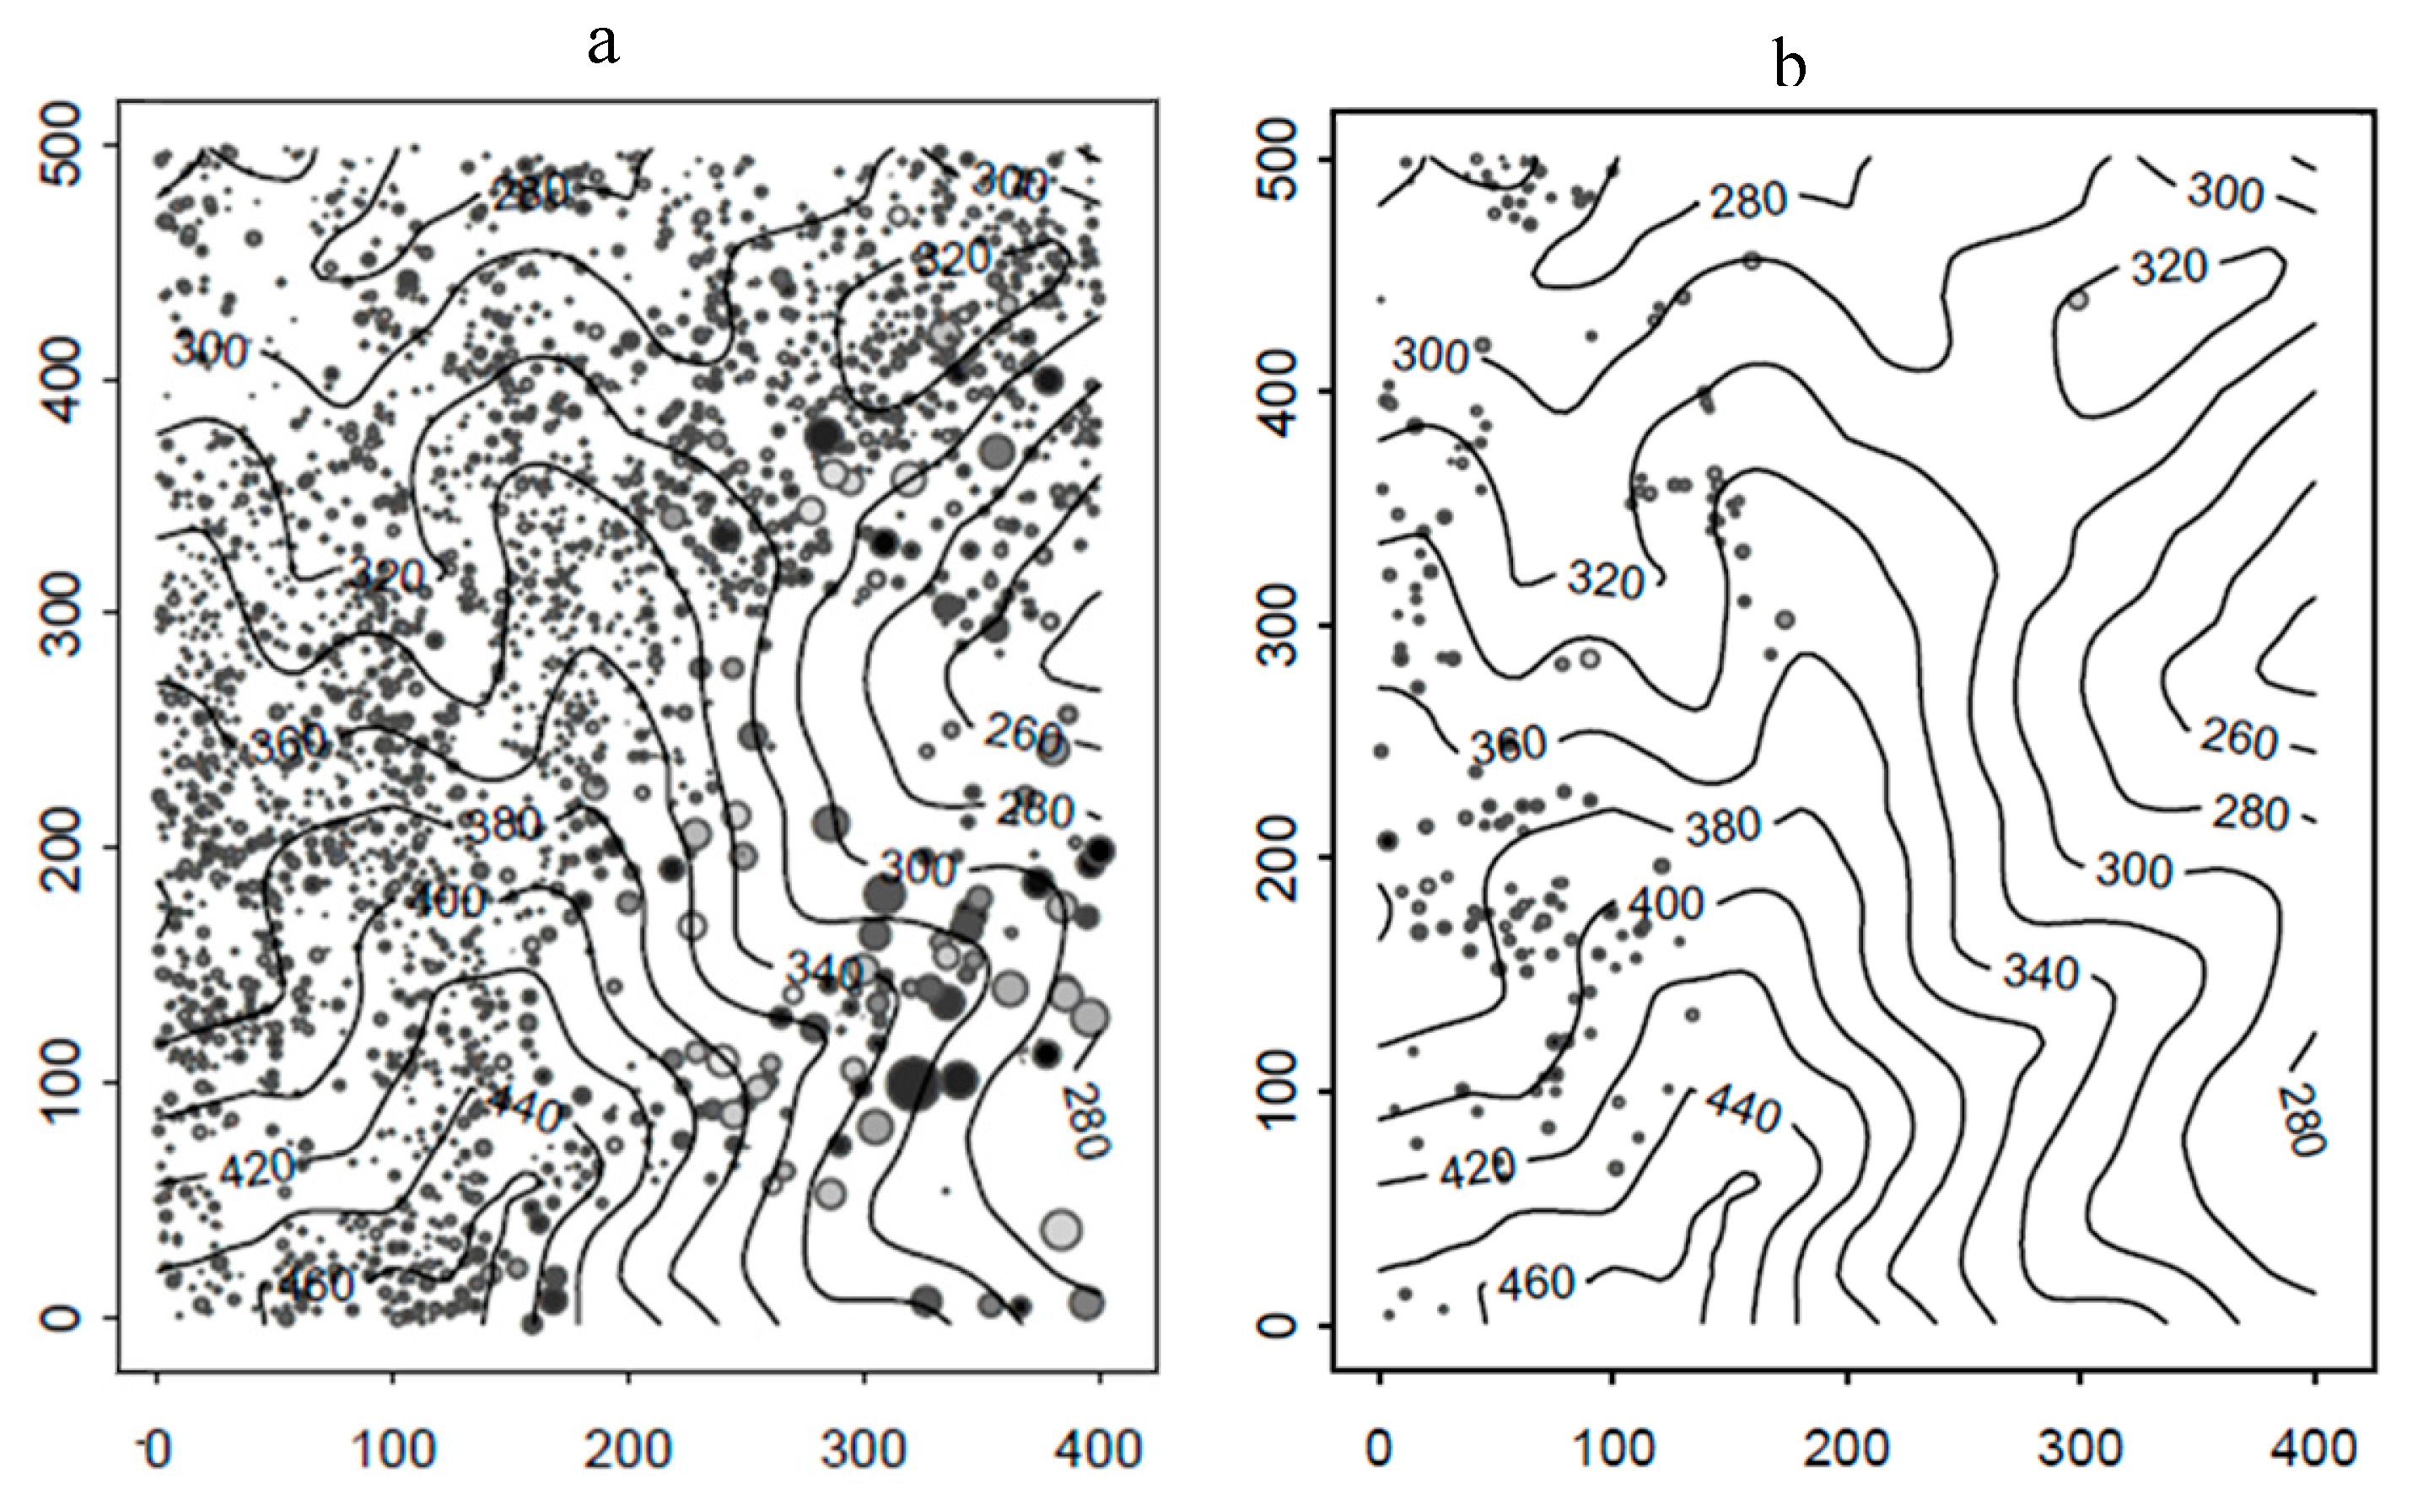
Figure 1. Distribution of Castanopsis chinensis (a) and Pinus massoniana (b) trees ≥ 1 cm DBH in the 20 ha DHS plot. Dot size was characterized in equal proportion of individual’s DBH.
Forests 11 00352 g001
Figure 2. Location of successional forest (left of blue line) and mature forest (right of blue line) within the 20 ha (400 m × 500 m) plot in DHS Plot. From the oldest to the youngest: T5, T4, T3, T2, T1.
Forests 11 00352 g002
Figure 3. Six species groups quantitative distribution around Castanopsis chinensis at six scales in succession forest (a) and mature forest (b). Horizontal axis is scales number representing outer diameter of annulus around C. chinensis: 20 m, 28.28 m, 34.64 m, 40 m, 44.72 m, and 48.99 m. The vertical axis represents percent of neighbors within that group.
Forests 11 00352 g003
Figure 4. Distribution of neighbor trees within a 20 m radius to Castanopsis chinensis based on phylogenetic distance (six ordinal groups) in succession forest (a), and mature forest (b). Horizontal axis is group number representing increasing phylogenetic distance of neighbors to C. chinensis, while the vertical axis represents percent of neighbors within that group. Dashed lines represent the upper (97.5%) and lower (2.5%) confidence envelope for a null (neutral) hypothesis, while the solid blue line represents observed distributions for each of the six phylogenetic groups, the purple line represents the standard error.
Forests 11 00352 g004
Table 1. Predicted effects of different ecological processes on community structure of a dominant species relative to the phylogenetic distance of its neighbors.
Ecological Process (Hypothesis)Predicted Relationship
Environmental filter hypothesisPositive relationship between dominant species and phylogenetic distance of neighbor species due to close relatives with similar phenotypic utilizing analogous resources.
Negative density-dependence hypothesisNegative relationship between dominant species and phylogenetic distance of neighbor species due to resource competition and predation or disease limiting coexistence of conspecific individuals.
Neutrality hypothesisNo relationship between dominant and phylogenetic distance of neighbor species (null/neutral model)
Table 2. Number of species and individuals of trees surrounding the dominant tree Castanopsis chinensis in the 20 ha DHS plot as classified by phylogenetic distance (group) to C. chinensis.
Phylogenetic Distance
(Group No.)
Whole PlotSuccession ForestMature Forest
Sp. No.Ind. No.Sp. No.Ind. No.Sp. No.Ind. No.
1127311301143
291743912966447
3992981181142588715553
454228714514932447939
527142122210892243320
642304196234