Shifts in Foliage Biomass and Its Vertical Distribution in Response to Operational Nitrogen Fertilization of Douglas-Fir in Western Oregon


Abstract
1. Introduction
2. Materials and Methods
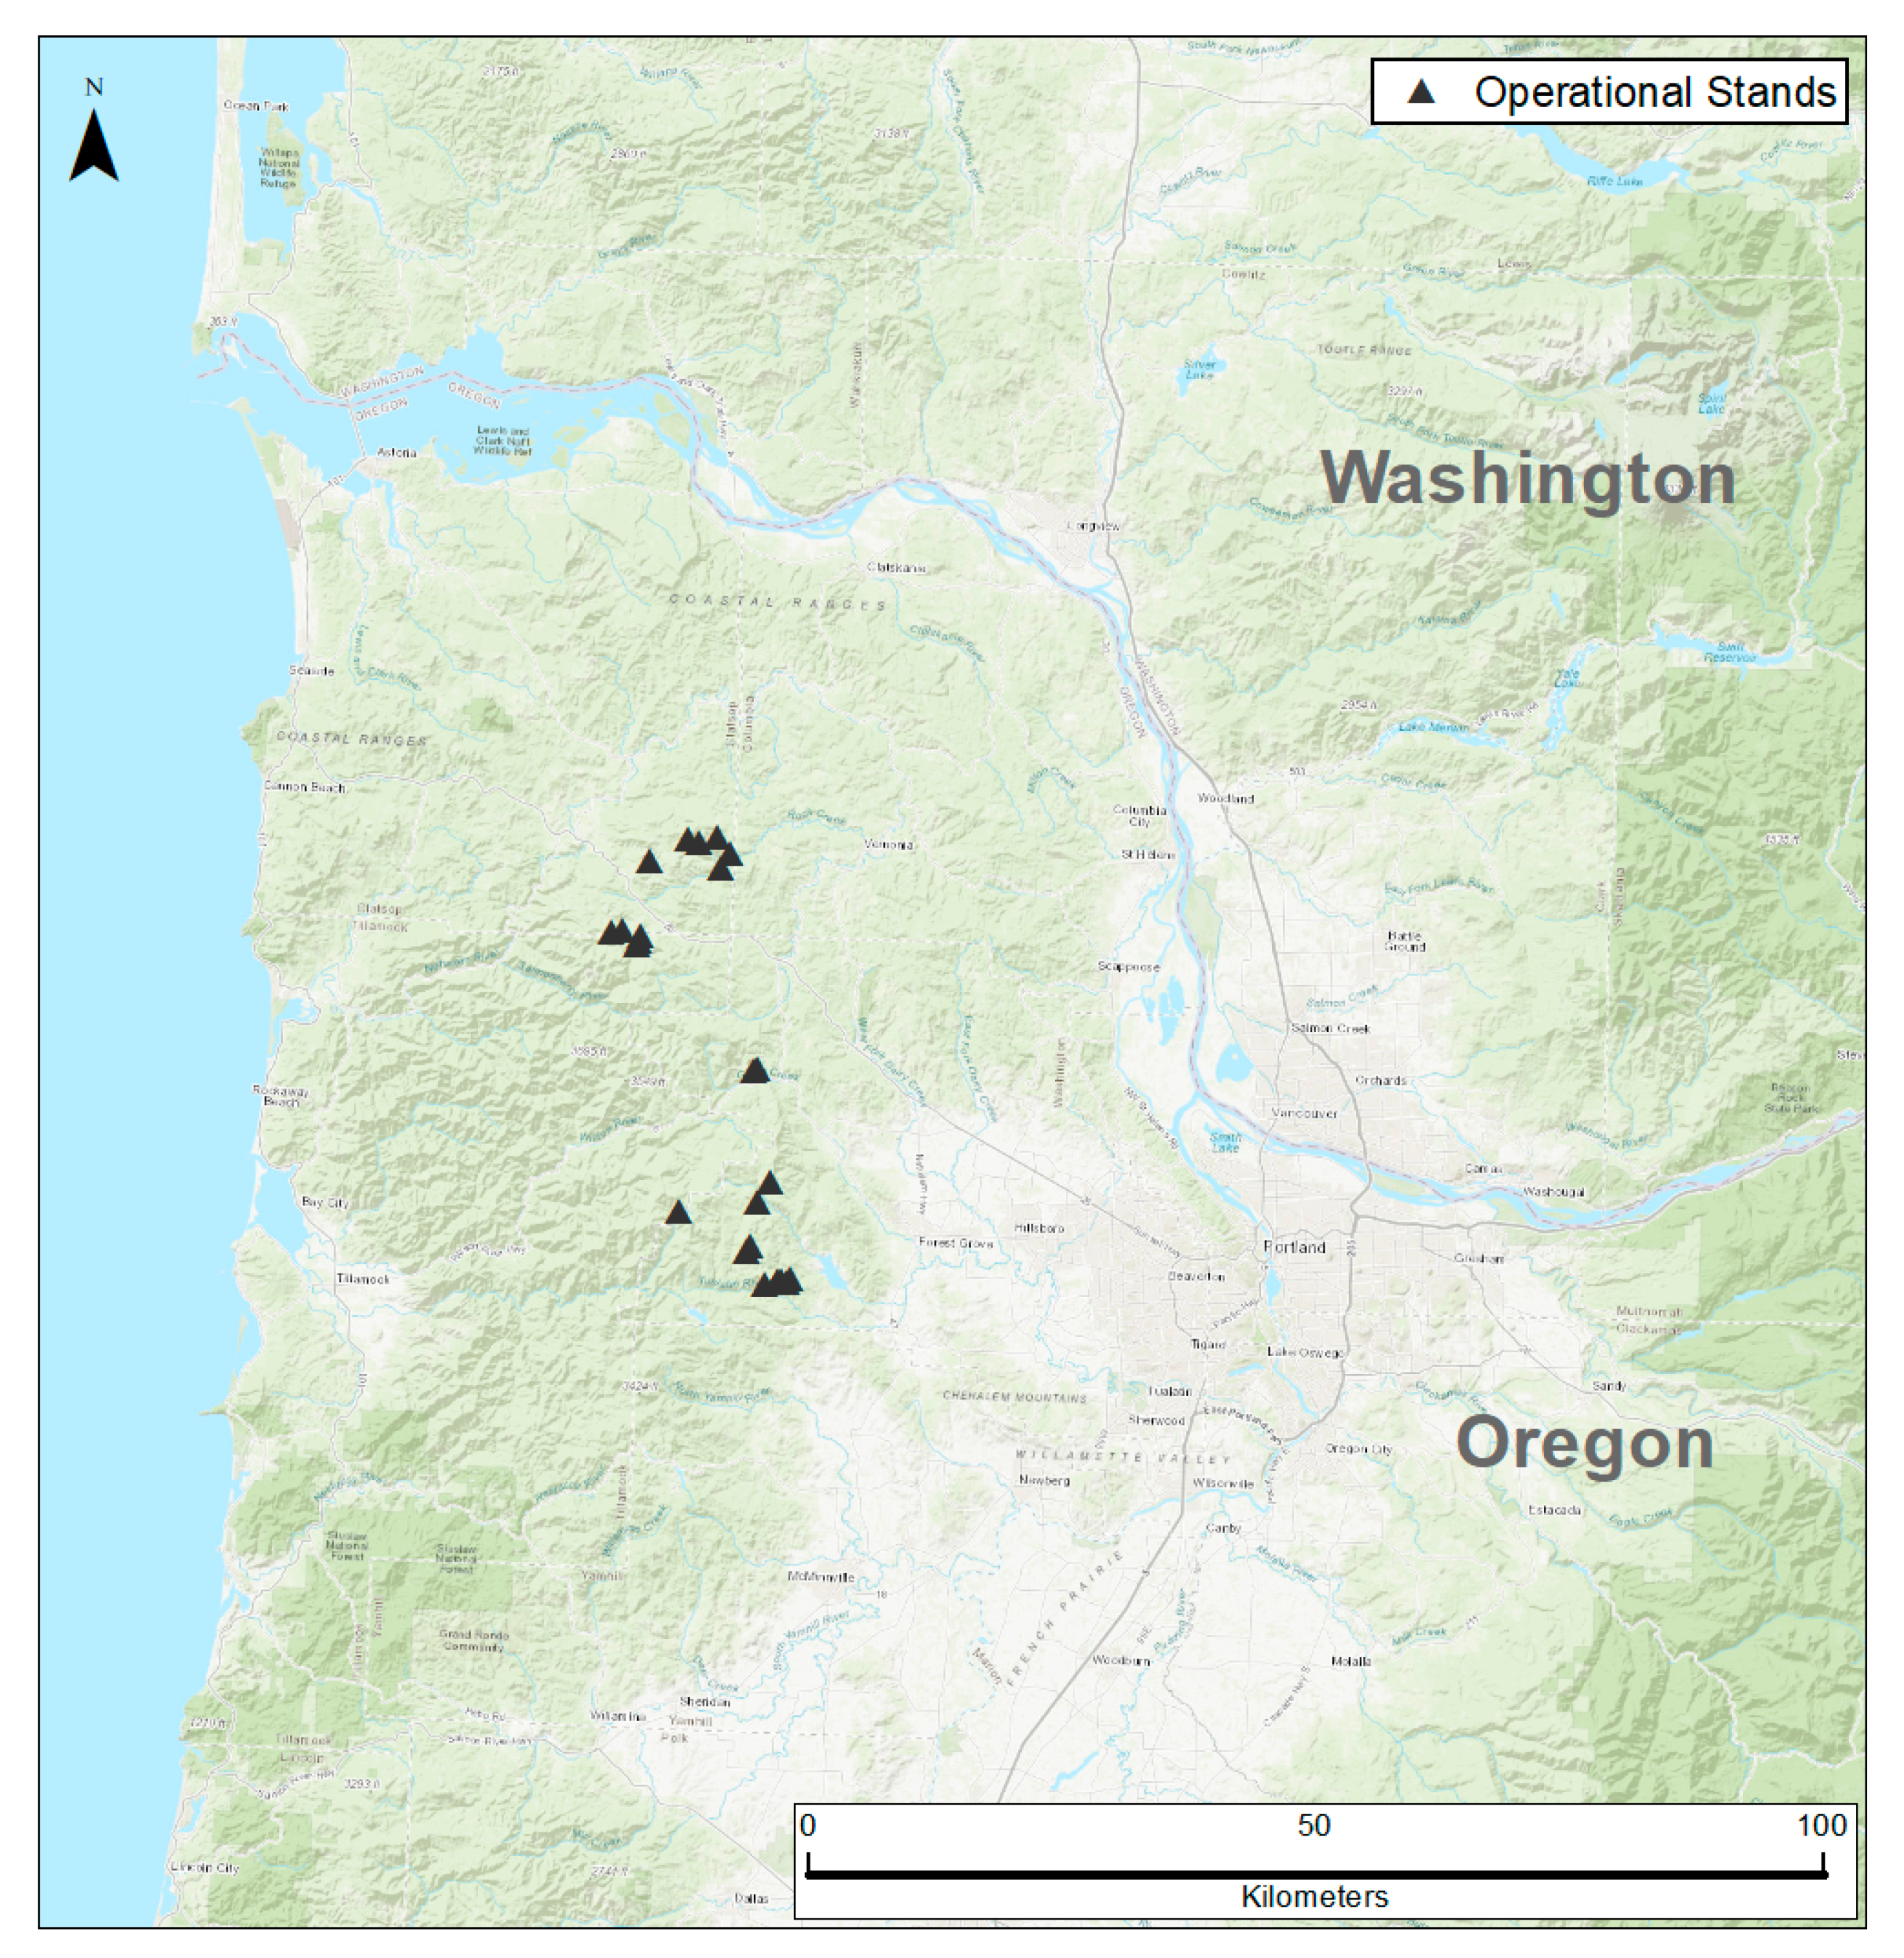
2.1. Study Area
2.2. Data Collection
2.3. Statistical Analyses
2.3.1. Branch-Level Foliage Mass
2.3.2. Total Crown Foliage Mass
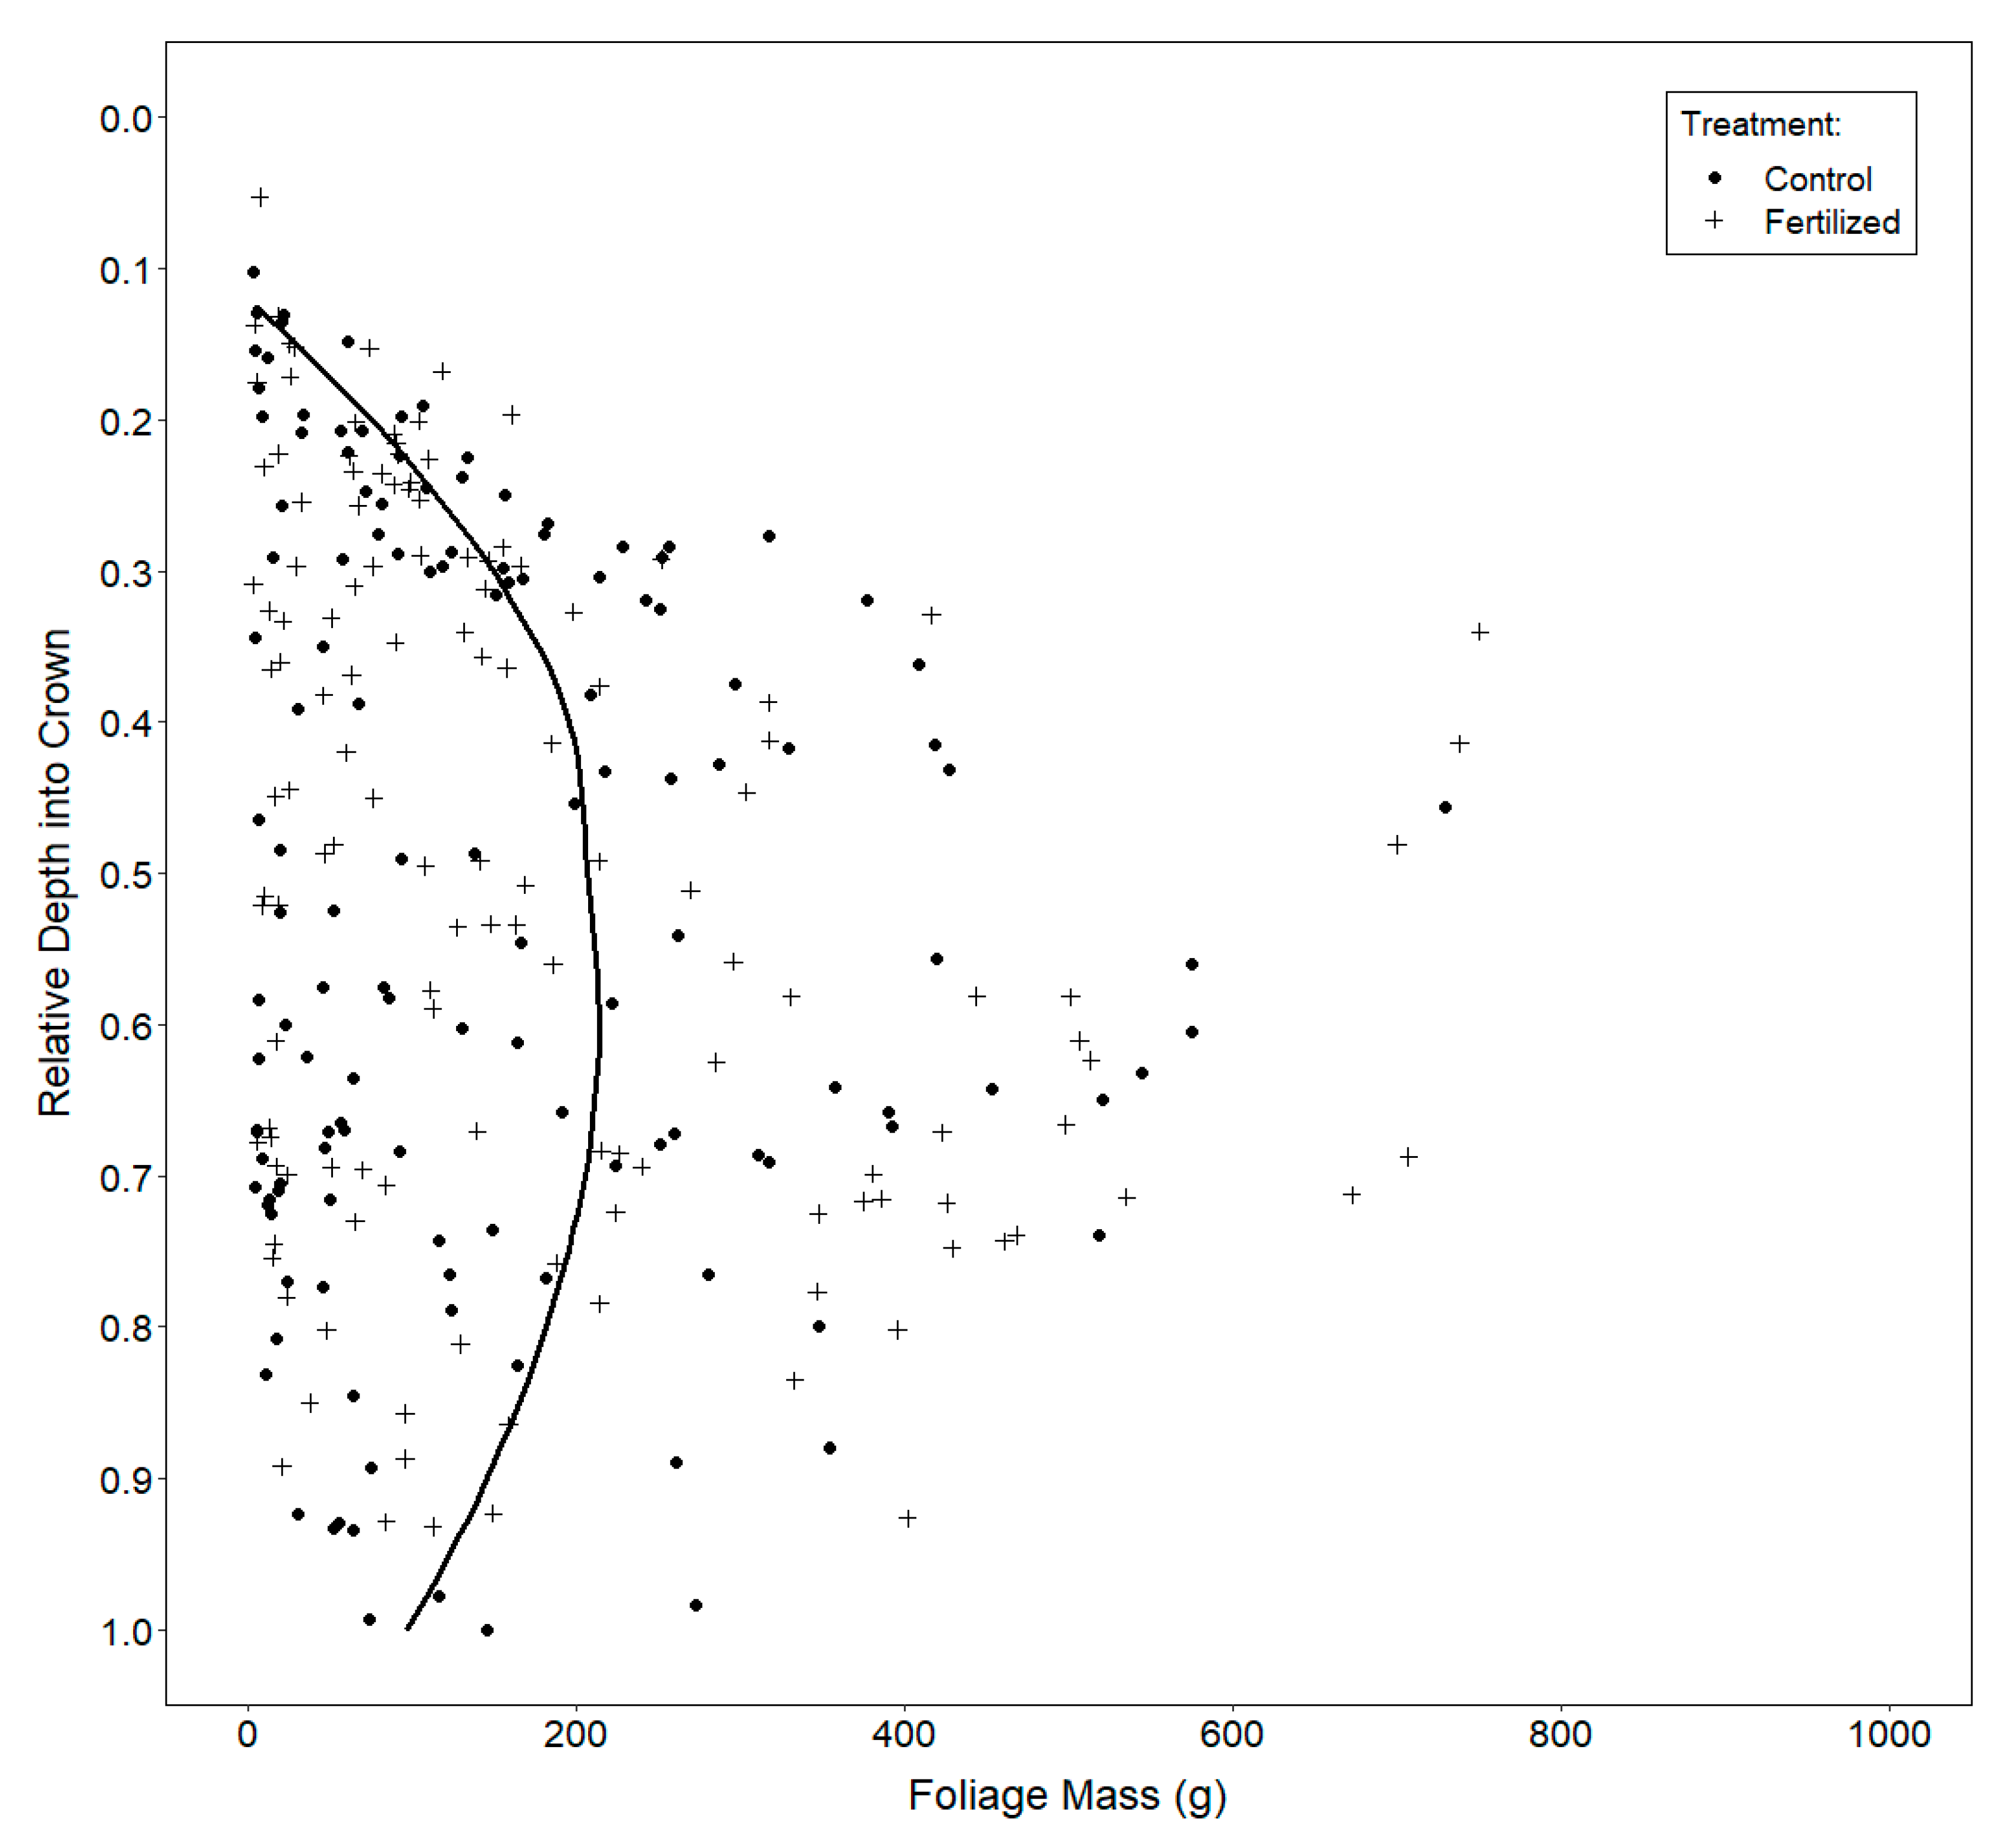
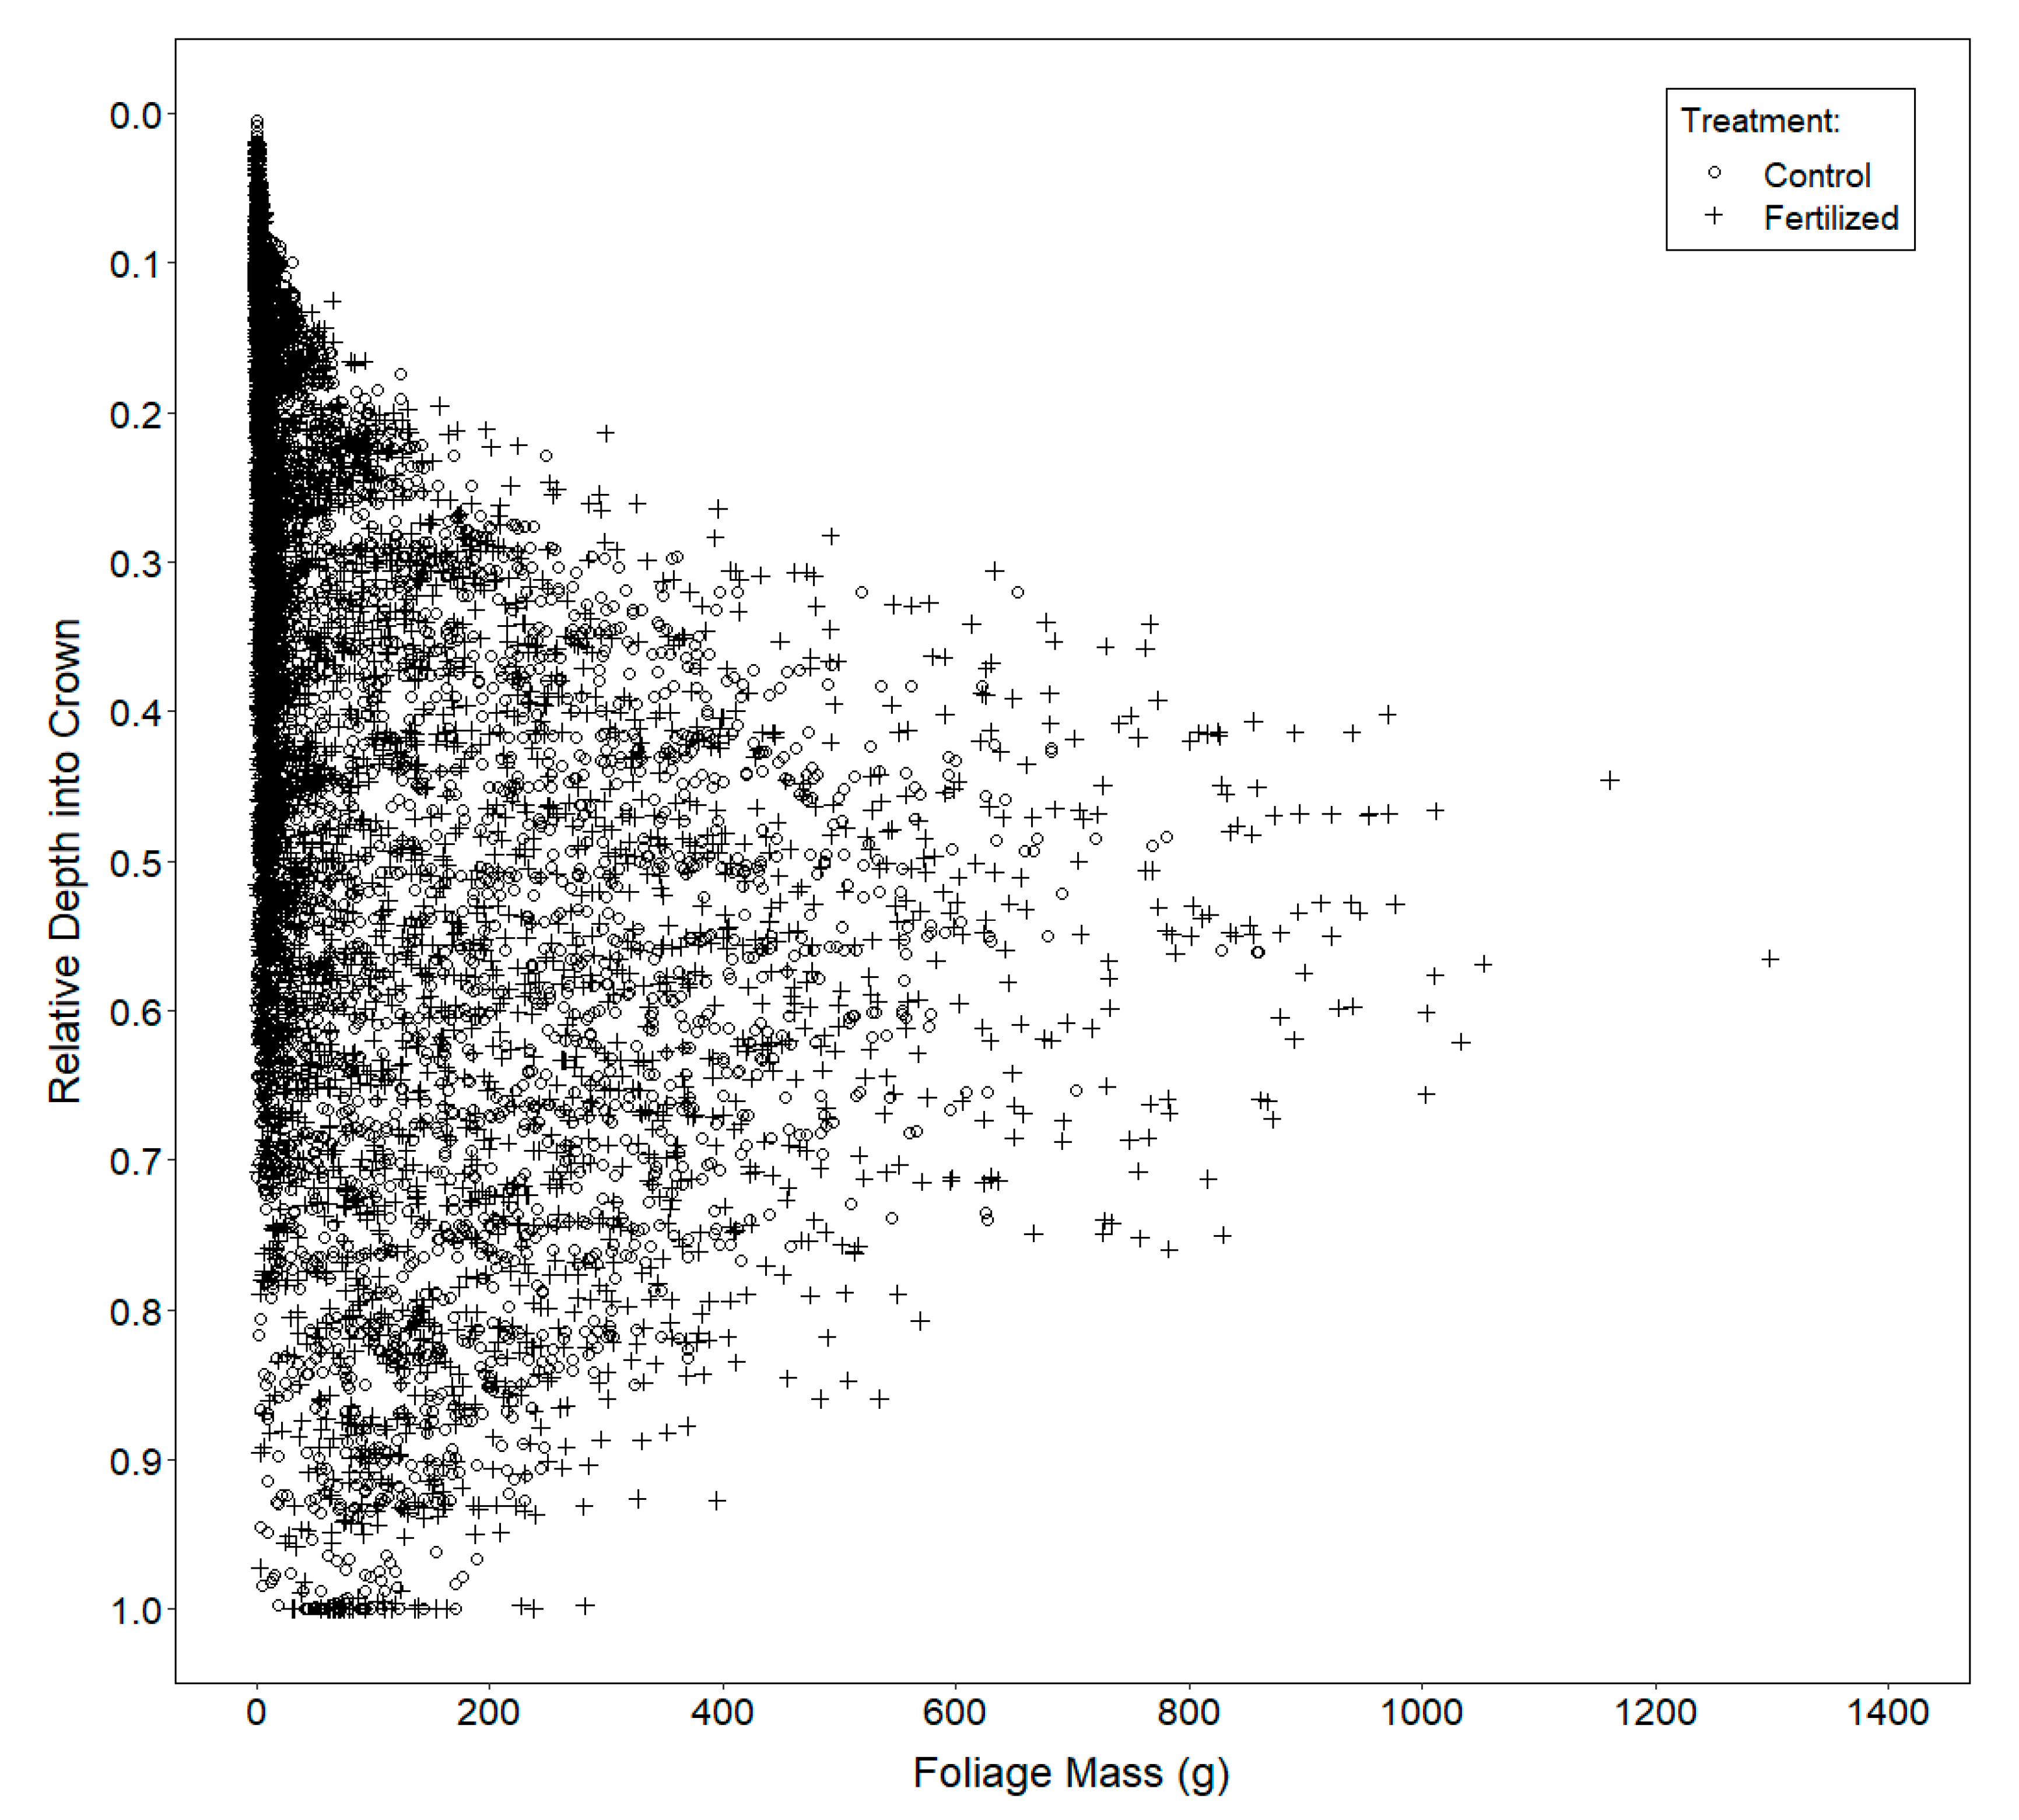
2.3.3. Vertical Distribution of Foliage
3. Results
3.1. Branch-Level Foliage Mass
3.2. Total Crown Foliage Mass
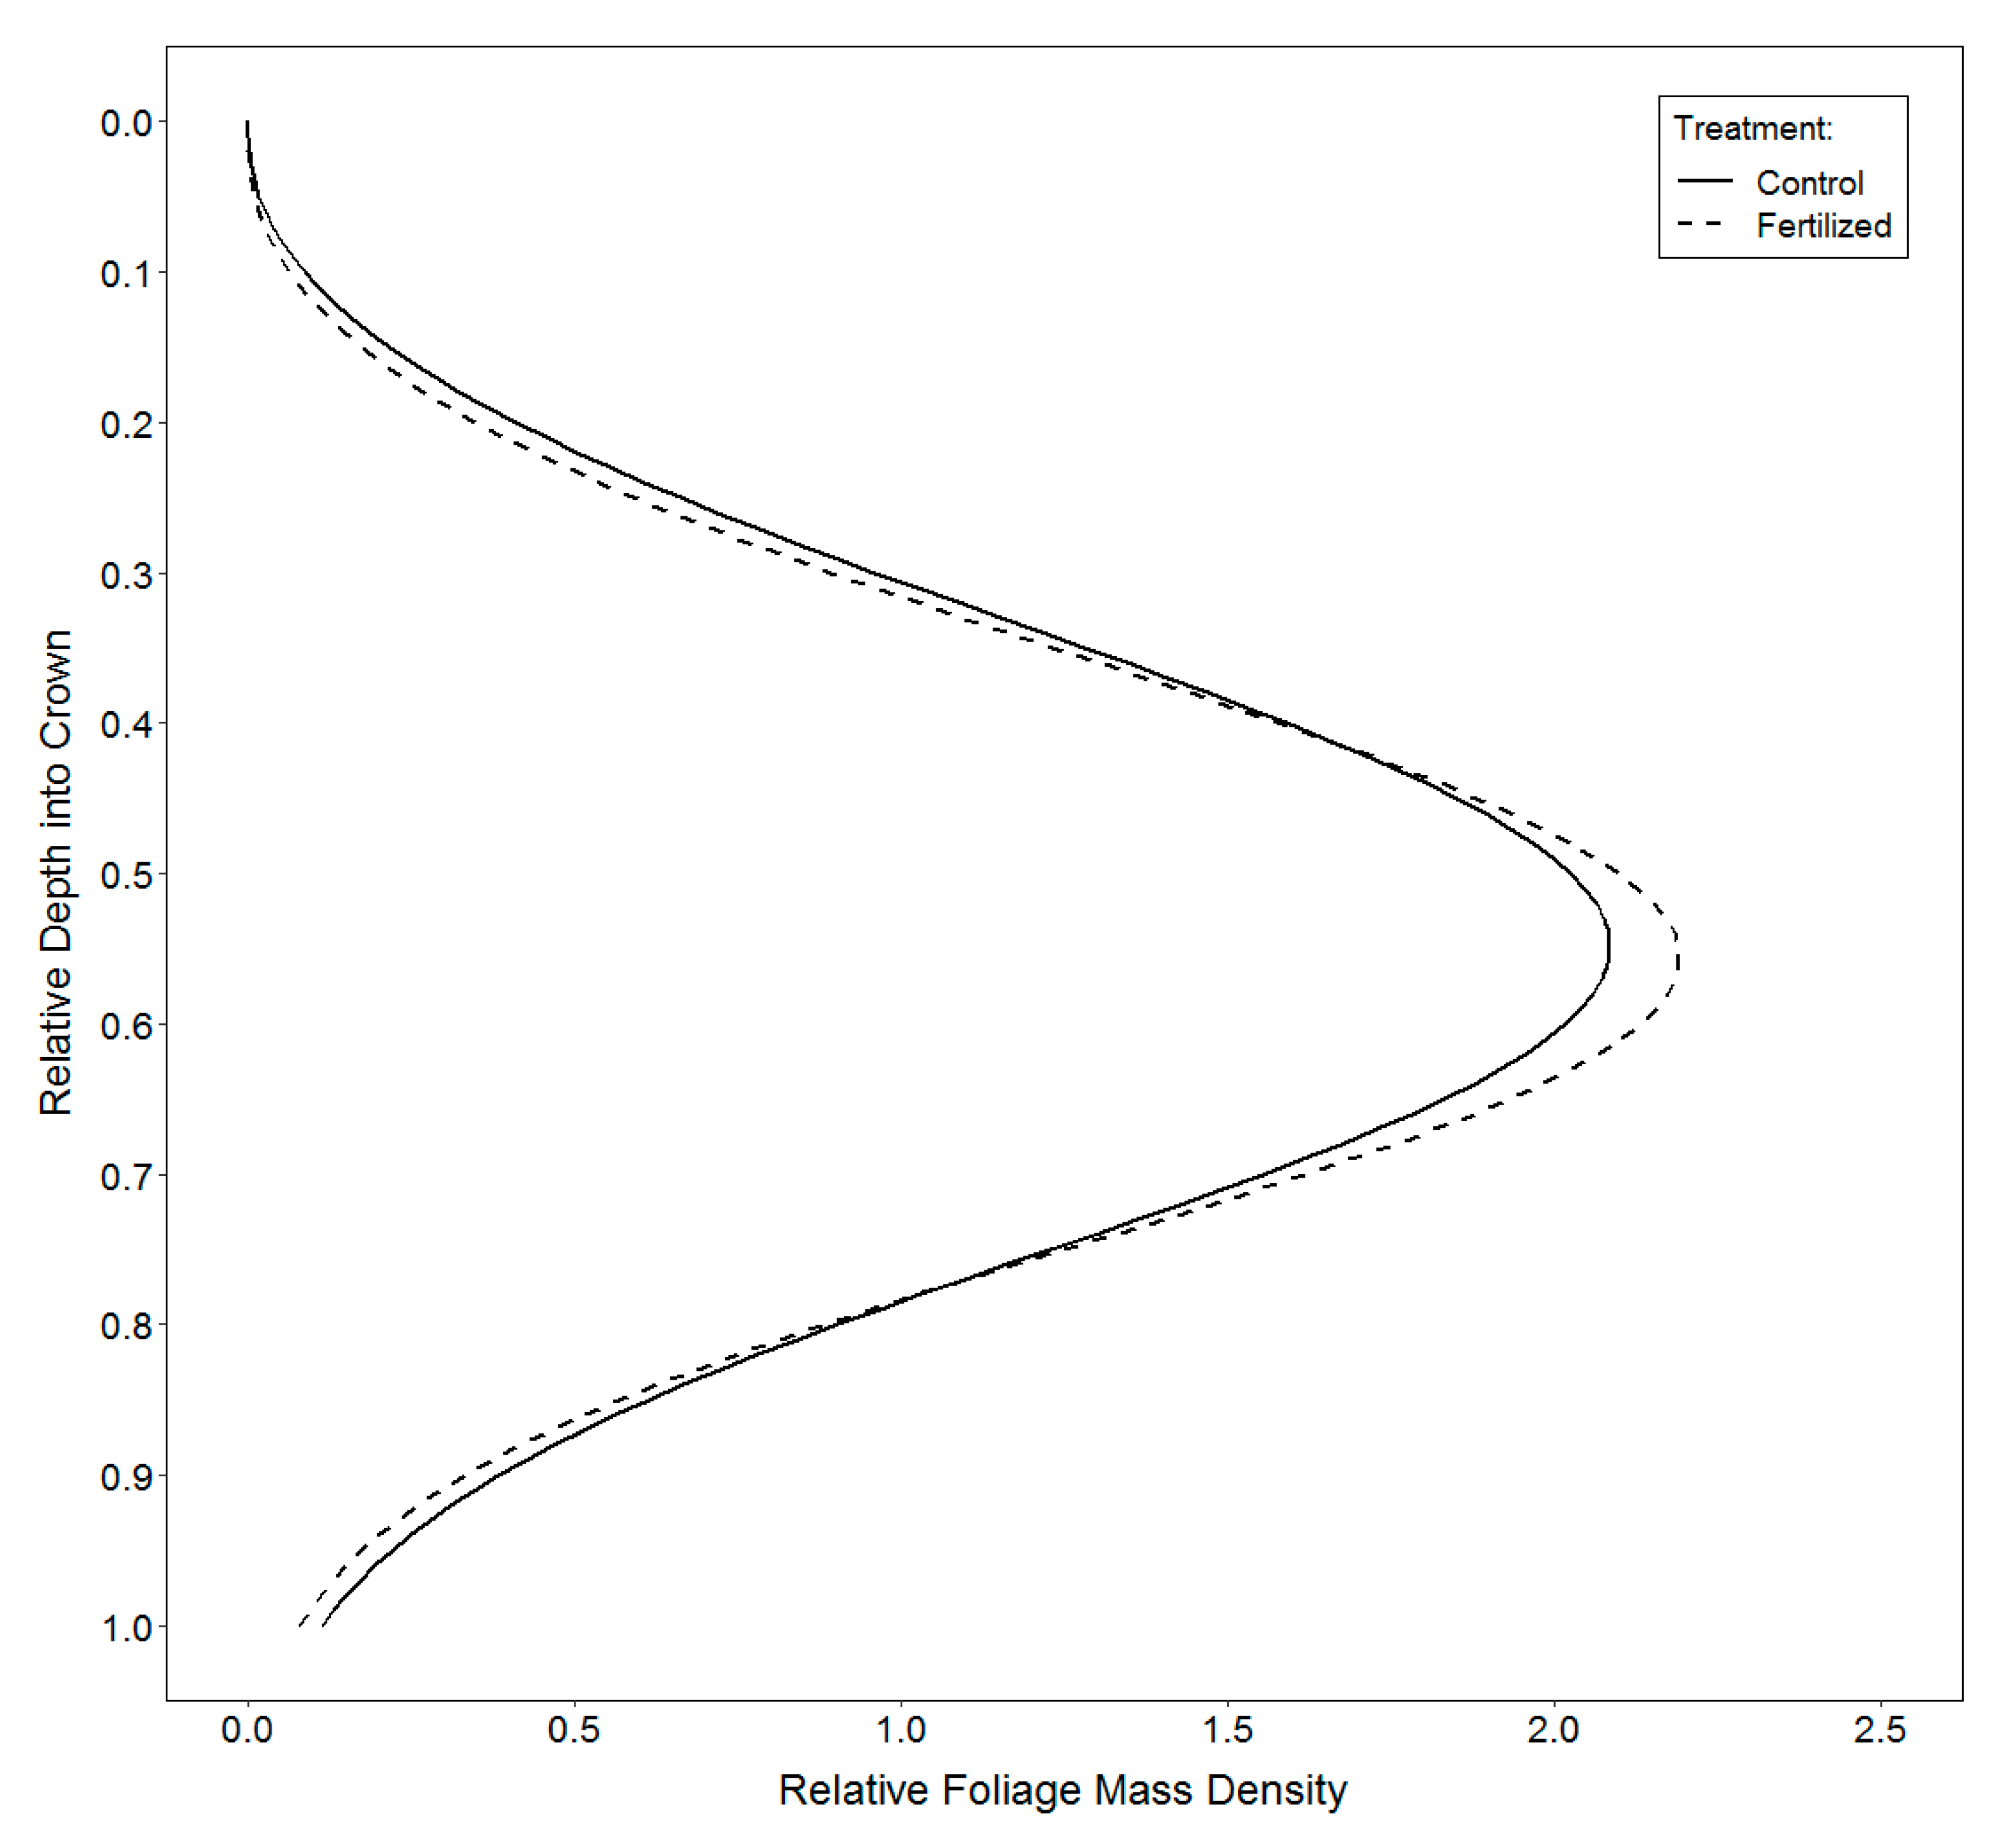
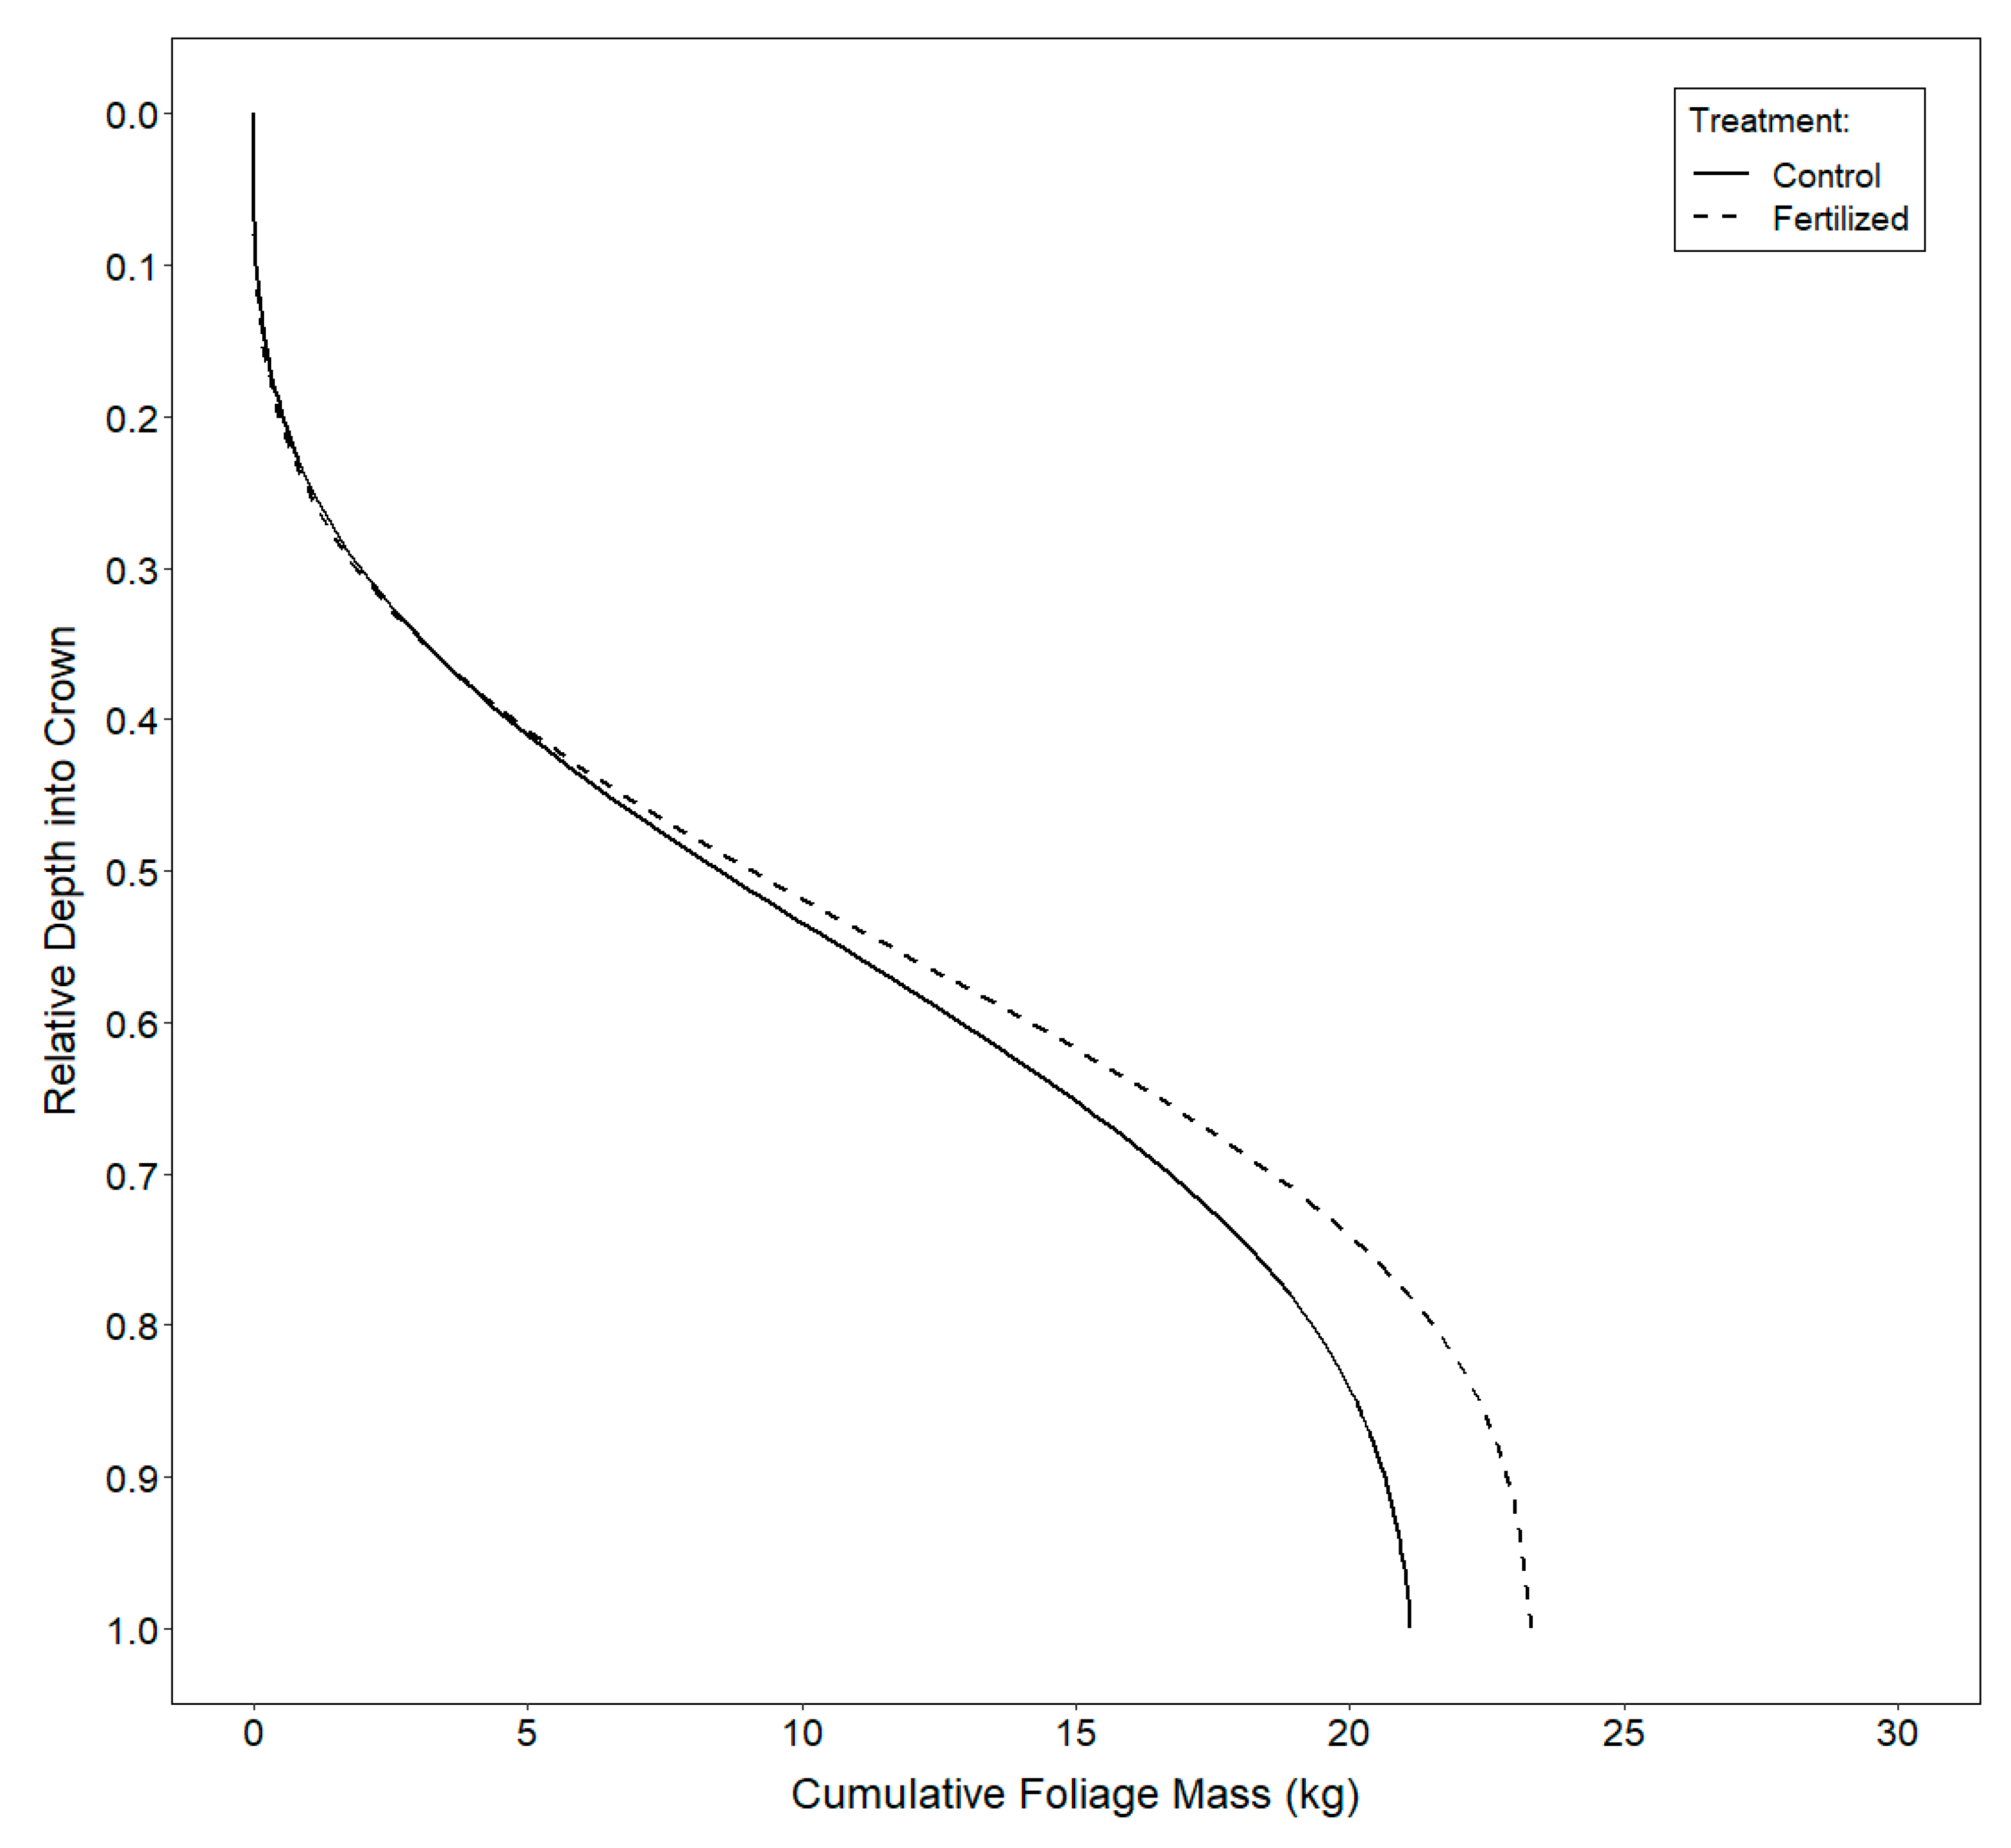
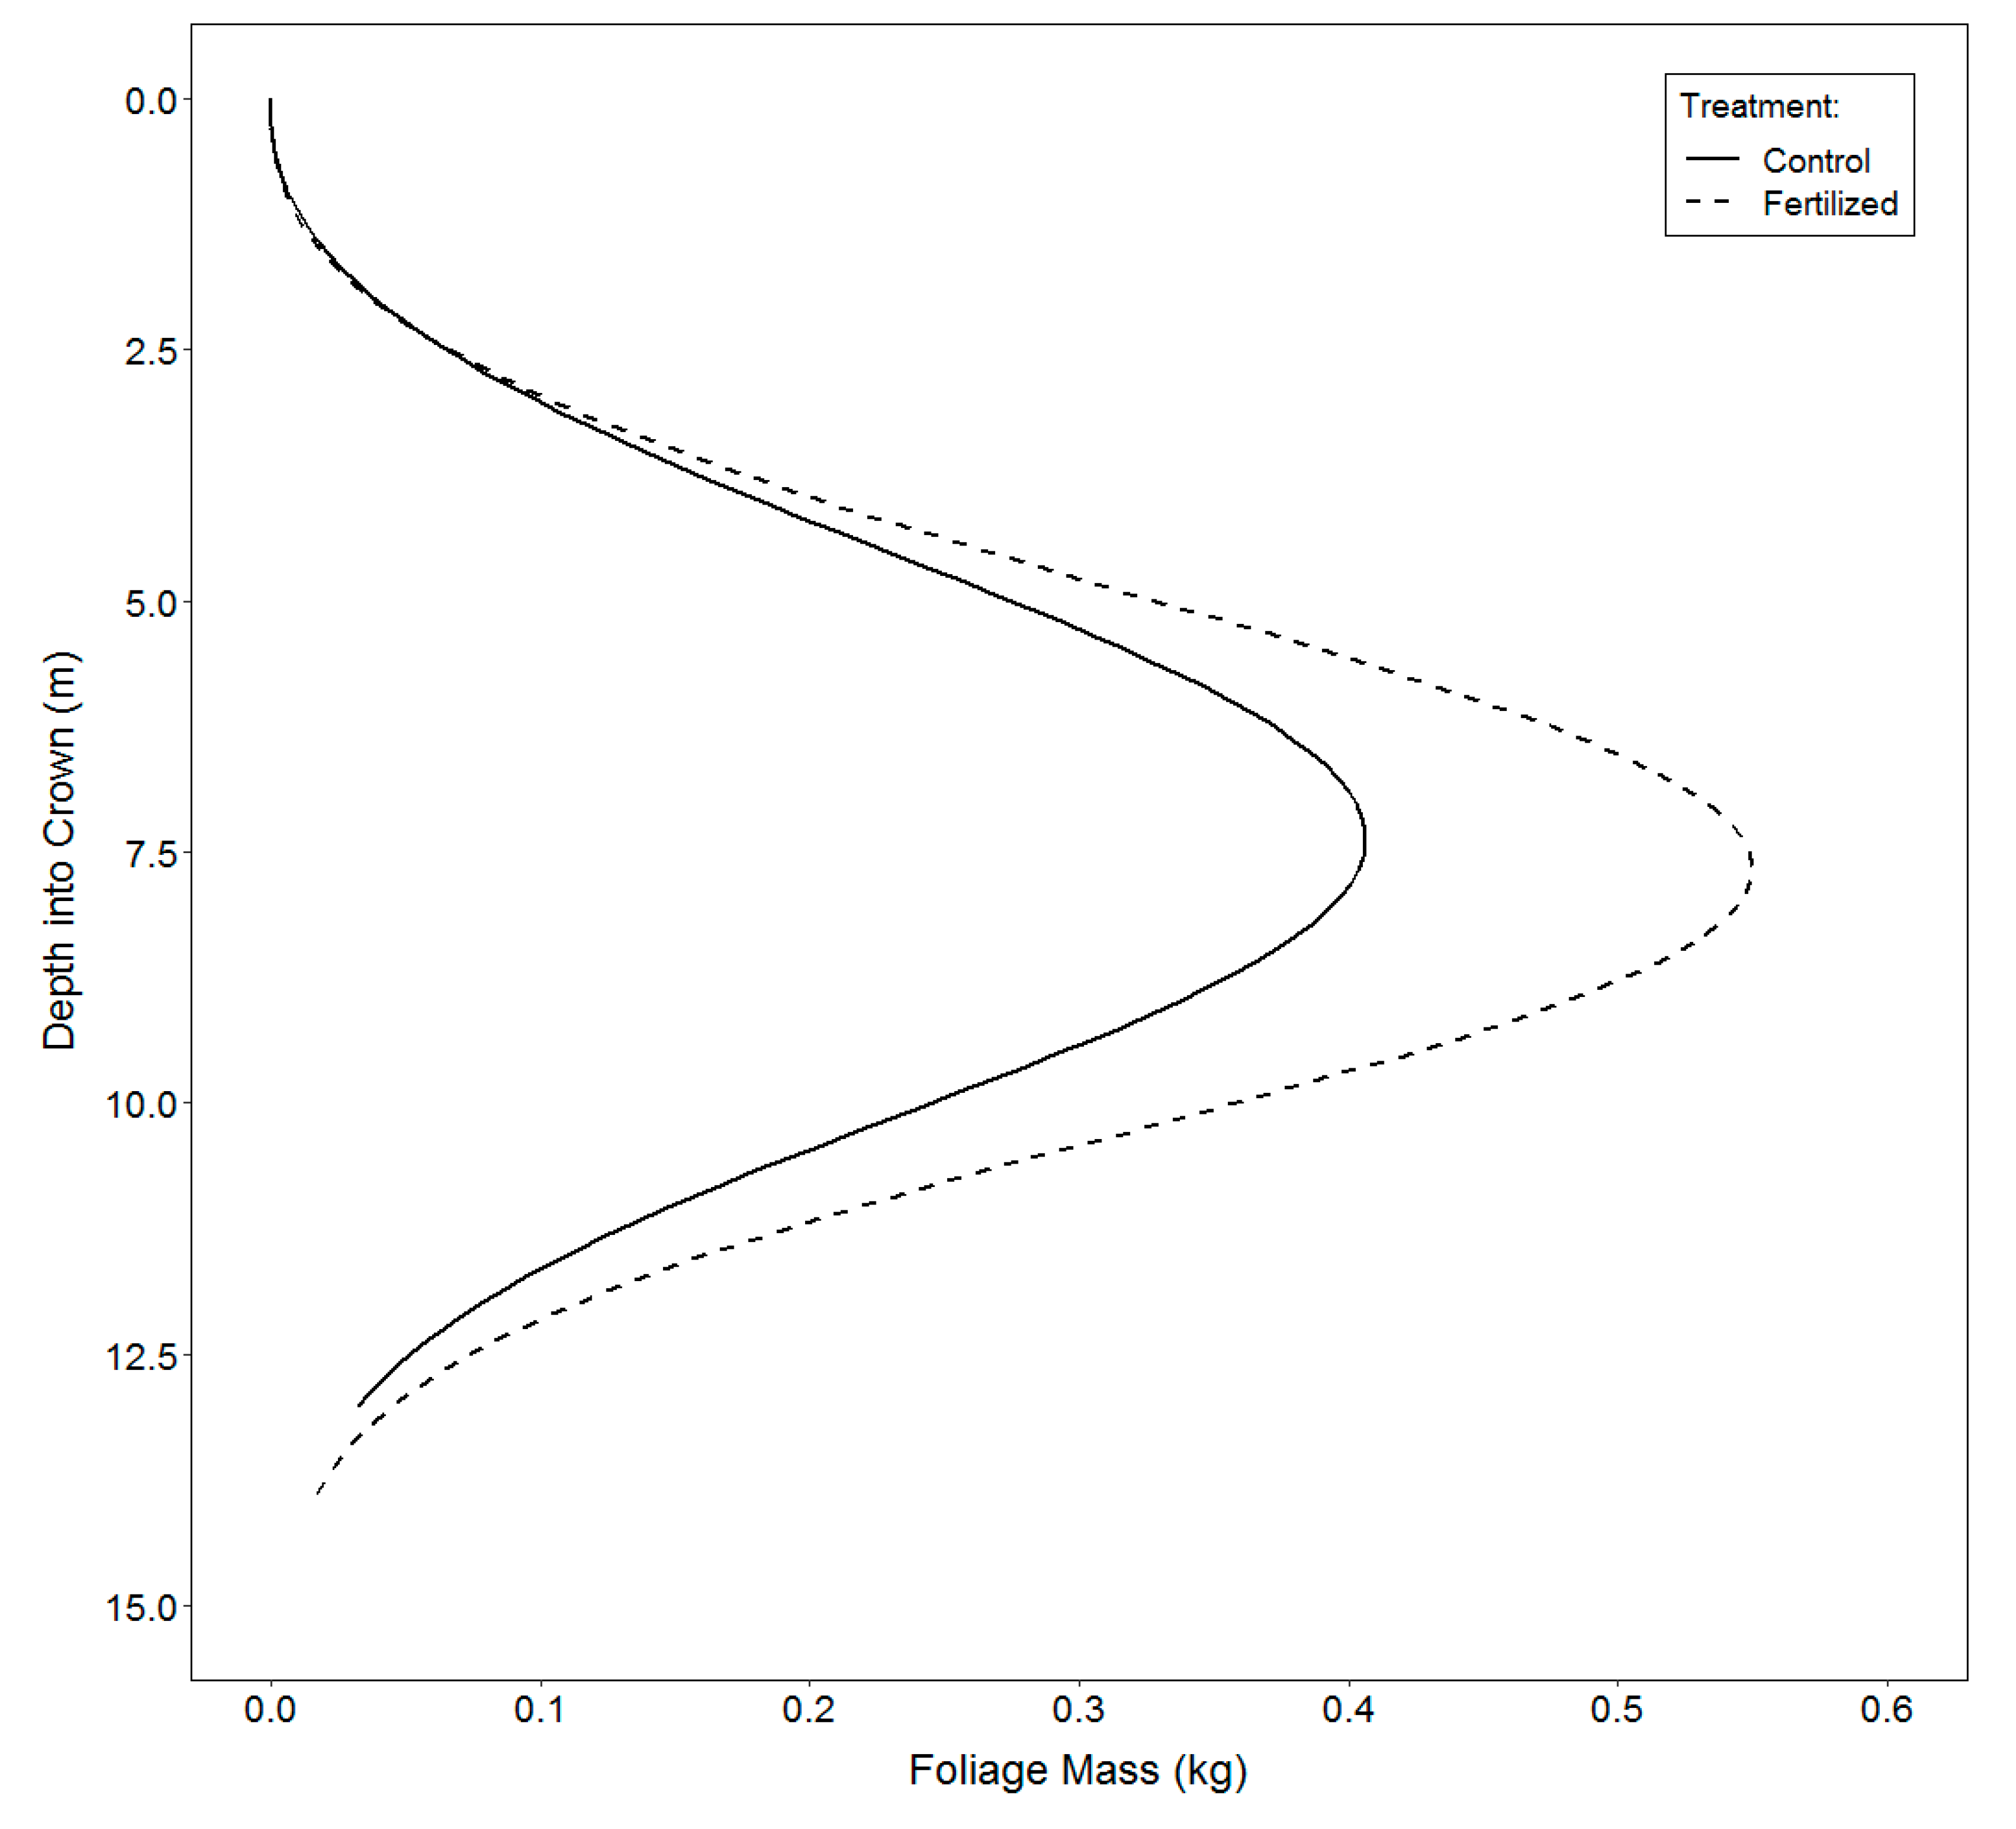
3.3. Vertical Distribution of Foliage
4. Discussion
4.1. Branch-Level Foliage Mass
4.2. Total Crown Foliage Mass
4.3. Vertical Distribution of Foliage
5. Conclusions
Author Contributions
Funding
Acknowledgments
Conflicts of Interest
References
- Briggs, G.E.; Kidd, F.; West, C. A Quantitative Analysis of Plant growth: Part II. Ann. Appl. Biol. 1920, 7, 202–223. [Google Scholar] [CrossRef]
- Pretzsch, H. Forest Dynamics, Growth and Yield; Springer: Berlin/Heidelberg, Germany, 2009; p. 664. [Google Scholar]
- Monserud, R.A. Evaluating forest models in a sustainable forest management context. FMBIS 2003, 1, 35–47. [Google Scholar]
- Blake, J.I.; Somers, G.L.; Ruark, G.A. Perspectives on process modeling of forest growth responses to environmental stress. In Process Modeling of Forest Grotwth Responses to Environmental; Stress Dixon, R., Meldahl, R., Ruark, G., Warren, W., Eds.; Timber Press: Portland, OR, USA, 1990; pp. 9–17. [Google Scholar]
- Korol, R.L.; Milner, K.S.; Running, S.W. Testing a mechanistic model for predicting stand and tree growth. For. Sci. 1996, 42, 139–153. [Google Scholar] [CrossRef]
- Horn, H.S. The Adaptive Geometry of Trees; Princeton University Press: Princeton, NJ, USA, 1971. [Google Scholar]
- Weiskittel, A.R.; Maguire, D.A.; Monserud, R.A.; Johnson, G.P. A hybrid model for intensively managed Douglas-fir plantations in the Pacific Northwest, USA. Eur. J. For. Res. 2010, 129, 325–338. [Google Scholar] [CrossRef]
- Brix, H. Effects of thinning and nitrogen fertilization on branch and foliage production in Douglas-fir. Can. J. For. Res. 1981, 11, 502–511. [Google Scholar] [CrossRef]
- Brix, H. Effects of thinning and nitrogen fertilization on growth of Douglas-fir: Relative contribution of foliage quantity and efficiency. Can. J. For. Res. 1983, 13, 167–175. [Google Scholar] [CrossRef]
- Maguire, D.A.; Kershaw, J.A., Jr.; Hann, D.W. Predicting the effects of silvicultural regime on branch size and crown wood core in Douglas-fir. For. Sci. 1991, 37, 1409–1428. [Google Scholar] [CrossRef]
- Maguire, D.A.; Bennett, W.S. Patterns in vertical distribution of foliage in young coastal Douglas-fir. Can. J. For. Res. 1996, 26, 1991–2005. [Google Scholar] [CrossRef]
- Weiskittel, A.R.; Kershaw, J.A., Jr.; Hofmeyer, P.V.; Seymour, R.S. Species differences in total and vertical distribution of branch- and tree-level leaf area for the five primary conifer species in Maine, USA. For. Ecol. Manag. 2009, 258, 1695–1703. [Google Scholar] [CrossRef]
- Williams, G.M.; Nelson, A.S.; Affleck, D.L.R. Vertical distribution of foliar biomass in western larch (Larix occidentalis). Can. J. For. Res. 2017, 48, 42–57. [Google Scholar] [CrossRef]
- Curtis, R.O.; Reukema, D.L. Crown development and site estimates in a Douglas-fir plantation spacing test. For. Sci. 1970, 16, 287–301. [Google Scholar] [CrossRef]
- Schreuder, H.T.; Swank, W.T. Coniferous stands characterized with the Weibull distribution. Can. J. For. Res. 1974, 4, 518–523. [Google Scholar] [CrossRef]
- Hagihara, A.; Hozumi, K. An estimate of the photosynthetic production of individual trees in a Chamaecyparis obutsa plantation. Tree Physiol. 1986, 1, 9–20. [Google Scholar] [CrossRef] [PubMed]
- Mori, S.; Hagihara, A. Crown profile of foliage area characterized with the Weibull distribution in a hinoki (Chamaecyparis obtusa) stand. Trees 1991, 5, 149–152. [Google Scholar] [CrossRef]
- Gillespie, A.R.; Allen, H.L.; Vose, J.M. Amount and vertical distribution of foliage of young loblolly pine trees as affected by canopy position and silvicultural treatment. Can. J. For. Res. 1994, 24, 1337–1344. [Google Scholar] [CrossRef]
- Gilmore, D.W. Crown Structure, Stem Form Development, and Foliage-Sapwood Area Relationships for Balsam Fir in Central Maine. Ph.D. Dissertation, University of Maine, Orono, ME, USA, 1995. [Google Scholar]
- Xu, M.; Harrington, T.B. Foliage biomass distribution of loblolly pine as affected by tree dominance, crown size, and stand characteristics. Can. J. For. Res. 1998, 28, 887–892. [Google Scholar] [CrossRef]
- Utsugi, H.; Arakim, M.; Kawasaki, T.; Ishizuka, M. Vertical distributions of leaf area and inclination angle, and their relationship in a 46-year-old Chamaecyparis obtusa stand. For. Ecol. Manag. 2006, 225, 104–112. [Google Scholar] [CrossRef]
- Stephens, G.R. Productivity of Red Pine, 1. Foliage distribution in tree crown and stand canopy. Agric. Meteorol. 1969, 6, 275–282. [Google Scholar] [CrossRef]
- van Hees, A.F.M.; Bartelink, H.H. Needle area relationships of Scots pine in the Netherlands. For. Ecol. Manag. 1993, 58, 19–31. [Google Scholar] [CrossRef]
- Wang, Y.P.; Jarvis, P.G.; Benson, M.L. Two-dimensional needle-area density distribution within the crowns on Pinus radiata. For. Ecol. Manag. 1990, 32, 217–237. [Google Scholar] [CrossRef]
- Garber, S.M.; Maguire, D.A. The response of vertical foliage distribution to spacing and species composition in mixed conifer stands in central Oregon. For. Ecol. Manag. 2005, 211, 341–355. [Google Scholar] [CrossRef]
- Maguire, D.A.; Mainwaring, D.B.; Turnblom, E.; Harrison, R.; Bluhm, A. Vertical foliage distribution in response to thinning and fertilization: Links to productivity. In CIPS Annual Report; Maguire, D., Mainwaring, D., Eds.; Center for Intensive Planted-forest Silviculture (CIPS), College of Forestry, Oregon State University: Corvallis, OR, USA, 2016; pp. 53–60. [Google Scholar]
- Nelson, A.S.; Weiskittel, A.R.; Wagner, R.G. Development of branch, crown, and vertical distribution leaf area models for contrasting hardwood species in Maine, USA. Trees 2014, 28, 17–30. [Google Scholar] [CrossRef]
- Nelson, A.S.; Wagner, R.G.; Weiskittel, A.R.; Saunders, M.R. Effects of species composition, management intensity, and shade tolerance on vertical distribution of leaf area index in juvenile stands in Maine, USA. Eur. J. For. Res. 2015, 134, 281–291. [Google Scholar] [CrossRef]
- Larson, P.R. Stem form development of forest trees. For. Sci. Monogr. 1963, 5, 1–42. [Google Scholar] [CrossRef]
- Tadaki, Y. Some discussions on the leaf biomass of forest stands and trees. Bull. Gov. For. Exp. Stn. Tokyo Jpn. 1966, 184, 135–159. [Google Scholar]
- Baldwin, V.C., Jr.; Doughterty, P.M.; Burkhart, H.E. A linked model for simulating stand development and growth processes of loblolly pine. In The Productivity of Southern Forest Ecosystems in a Changing Environment; Mickler, R., Fox, S., Eds.; Ecology Study Service; Springer: New York, NY, USA, 1998; Volume 128. [Google Scholar] [CrossRef]
- Baldwin, V.C., Jr.; Burkhart, H.E.; Westfall, J.A.; Peterson, K.D. Linking growth and yield and process models to estimate impact of environmental changes on growth of loblolly pine. For. Sci. 2001, 47, 77–82. [Google Scholar]
- Emmingham, W.H.; Waring, R.H. An index of photosynthesis for comparing forest sites in western Oregon. Can. J. For. Res. 1977, 7, 165–174. [Google Scholar] [CrossRef]
- Gower, S.T.; Reich, P.B.; Son, Y. Canopy dynamics and aboveground production of five tree species with different leaf longevities. Tree Physiol. 1993, 12, 327–345. [Google Scholar] [CrossRef]
- Lim, H.-W.; Oren, R.; Palmroth, S.; Torngern, P.; Mörling, T.; Näsholm, T.; Lundmark, T.; Helmisaari, H.-S.; Leppälammi-Kujansuu, J.; Linder, S. Inter-annual variability of precipitation constrains the production response of boreal Pinus sylvestris to nitrogen fertilization. For. Ecol. Manag. 2015, 348, 31–45. [Google Scholar] [CrossRef]
- Peterson, C.E.; Hazard, J.W. Response of coastal Douglas-fir to nitrogen fertilization in the Pacific Northwest. Forest Sci. 1990, 36, 625–640. [Google Scholar] [CrossRef]
- Miller, R.H.; Pienaar, L.V. Seven-Year Response of 35-Year-Old Douglas-Fir to Nitrogen Fertilizer; PNW-RP-165; USDA Forest Service, PNW Research Station: Portland, OR, USA, 1973. [Google Scholar]
- Bengston, G.W. Finest fertilization in the United States: Progress and outlook. J. For. 1979, 78, 222–229. [Google Scholar] [CrossRef]
- Peterson, C.; Ryan, P.; Gessel, S.P. Response of Northwest Douglas-fir stands to urea: Correlations with forest soil properties. Soil Sci. Soc. Am. J. 1984, 48, 162–169. [Google Scholar] [CrossRef]
- Miller, R.E.; Barker, P.R.; Peterson, C.; Webster, S.R. Using nitrogen fertilizers in management of coast Douglas-fir. In Douglas-Fir: Stand Management for the Future, Proceedings of a Symposium, Seattle, WA, USA, 18–20 June 1985; Contribution No. 55; Oliver, C.D., Ed.; College of Forest Resources, University of Washington: Seattle, WA, USA, 1987. [Google Scholar]
- Walker, R.B.; Gessel, S.P. Mineral Deficiencies of Coastal Northwest Conifers; Contribution No. 70; Institute of Forest Resources, University of Washington: Seattle, WA, USA, 1991. [Google Scholar]
- Littke, K.M.; Harrison, R.B.; Zabowski, D.; Coil, M.A.; Briggs, D.G. Prediction of Douglas-fir fertilizer response using biogeoclimatic properties in the coastal Pacific Northwest. Can. J. For. Res. 2014, 44, 1253–1264. [Google Scholar] [CrossRef]
- Brix, H. Fertilization and Thinning Effect on a Douglas-Fir Ecosystem at Shawnigan Lake: A Synthesis of Project Results; FRDA Report 196; Pacific Forestry Centre, Forestry Canada: Victoria, BC, Canada; Research Branch, BC Ministry of Forests: Victoria, BC, Canada, 1993. [Google Scholar]
- Cornejo-Oviedo, E.H.; Voelker, S.L.; Mainwaring, D.B.; Maguire, D.A.; Meinzer, F.C.; Brooks, J.R. Basal area growth, carbon isotope discrimination, and intrinsic water use efficiency after fertilization of Douglas-fir in the Oregon Coast Range. For. Ecol. Manag. 2017, 389, 285–295. [Google Scholar] [CrossRef]
- Grier, C.C.; Running, S.W. Leaf area of mature northwestern coniferous forests: Relation to site water balance. Ecology 1977, 58, 893–899. [Google Scholar] [CrossRef]
- Nemani, R.R.; Running, S.W. Testing a theoretical climate-soil-leaf area hydrologic equilibrium of forests using satellite data and ecosystem simulation. Agric. For. Meteor. 1989, 44, 245–260. [Google Scholar] [CrossRef]
- Banerjee, T.; Linn, R. Effect of vertical canopy architecture on transpiration, thermoregulation and carbon assimilation. Forests 2018, 8, 198. [Google Scholar] [CrossRef]
- Bauerle, W.L.; Bowden, J.D. Separating foliar physiology from morphology reveals the relative roles of vertically structured transpiration factors within red maple crowns and limitations of larger scale models. J. Exp. Bot. 2011, 62, 4295–4307. [Google Scholar] [CrossRef]
- Toda, M.; Yokozawa, M.; Sumida, A.; Watanabe, T.; Hara, T. Foliage profiles of individual trees determine competition, self-thinning, biomass, and NPP of a Cryptomeria japonica forest stand: A simulation study based on a stand-scale process-based forest model. Ecol. Model. 2009, 220, 2272–2280. [Google Scholar] [CrossRef]
- Brix, H.; Mitchell, A.K. Thinning and nitrogen fertilization effects on sapwood development and relationships of foliage quantity to sapwood area and basal area in Douglas-fir. Can. J. For. Res. 1983, 13, 384–389. [Google Scholar] [CrossRef]
- Kershaw, J.A., Jr. Crown Structure and Stem Form Development in Young Stands of Western Hemlock. Ph.D. Dissertation, University of Washington, Seattle, WA, USA, 1993. [Google Scholar]
- Putney, J.D. Assessing Mechanisms of Douglas-Fir Growth Response to Operational Nitrogen Fertilization in Western Oregon. Master’s Thesis, Oregon State University, Corvallis, OR, USA, 2019. [Google Scholar]
- Bruce, D. Consistent height-growth and growth-rate estimates for remeasured plots. For. Sci. 1981, 27, 711–725. [Google Scholar] [CrossRef]
- Cleveland, W.S.; Devlin, S.J. Locally weighted regression: An approach to regression analysis by local fitting. JASA 1988, 83, 596–610. [Google Scholar] [CrossRef]
- Kershaw, J.A., Jr.; Maguire, D.A. Crown structure in western hemlock, Douglas-fir, and grand fir in western Washington: Trends in branch-level mass and leaf area. Can. J. For. Res. 1995, 25, 1897–1912. [Google Scholar] [CrossRef]
- Pinheiro, J.; Bates, D.; DebRoy, S.; Sarkar, D.; R Core Team. nlme: Linear and Nonlinear Mixed Effects Models. Package version 3.1-131. 2017. Available online: https://CRAN.R-project.org/package=nlme. (accessed on 30 December 2019).
- R Core Team. R: A Language and Environment for Statistical Computing. Version 3.4.0, “You Stupid Darkness,” R Foundation for Statistical Computing, Vienna, Austria. 2017. Available online: http://www.R-project.org/. (accessed on 30 December 2019).
- Burnham, K.P.; Anderson, D.R. Model Selection and Inference: A Practical Information-Theoretic Approach, 2nd ed.; Springer: New York, NY, USA, 2002. [Google Scholar]
- Kvålseth, T.O. Cautionary note about R2. Am. Stat. 1985, 39, 279–285. [Google Scholar] [CrossRef]
- Kenefic, L.S.; Seymour, R.S. Leaf area prediction models for Tsuga canadenis in Maine. Can. J. For. Res. 1999, 29, 1574–1582. [Google Scholar] [CrossRef]
- Monserud, R.A.; Marshall, J.D. Allometric crown relations in three northern Idaho conifer species. Can. J. For. Res. 1999, 29, 521–535. [Google Scholar] [CrossRef]
- Rawlings, J.O.; Pantula, S.G.; Dickey, D.A. Applied Regression Analysis: A Research Tool, 2nd ed.; Springer: New York, NY, USA, 1998. [Google Scholar]
- Kutner, M.H.; Nachtscheim, C.J.; Neter, J.; Li, W. Applied Linear Statistical Models, 5th ed.; McGraw-Hill Irwin: New York, NY, USA, 2005. [Google Scholar]
- Stenberg, P.; Smolander, H.; Kellomäki, S. Description of crown structure for light interception models: Angular and spatial distribution of shoots in young Scots pine. Stud. For. Suec. 1993, 191, 43–50. [Google Scholar]
- Robinson, A.P. Preserving correlation while modelling diameter distributions. Can. J. For. Res. 2004, 34, 221–232. [Google Scholar] [CrossRef]
- Weiskittel, A.R. Personal Communication; University of Maine: Orono, ME, USA, 2019. [Google Scholar]
- Zellner, A.; Theil, H. Three-stage least squares: Simultaneous estimation of simultaneous equations. Econometricia 1962, 30, 54–78. [Google Scholar] [CrossRef]
- Henningsen, A.; Hamann, J.D. systemfit: A package for estimating systems of simultaneous equations in R. J. Stat. Softw. 2007, 23, 1–40. Available online: https://cran.r-project.org/package=systemfit. (accessed on 30 December 2019). [CrossRef]
- Schmidt, P. Three-stage least squares with different instruments for different equations. J. Econom. 1990, 43, 389–394. [Google Scholar] [CrossRef]
- McElroy, M.B. Goodness of fit for seemingly unrelated regressions. J. Econom. 1977, 6, 381–387. [Google Scholar] [CrossRef]
- Maguire, D.A.; Brissette, J.C.; Gu, L. Crown structure and growth efficiency of red spruce in uneven-aged, mixed-species stands in Maine. Can. J. For. Res. 1998, 28, 1233–1240. [Google Scholar] [CrossRef]
- Ek, A.R. A model for estimating branch weight and branch leaf weight in biomass studies. For. Sci. 1979, 25, 303–306. [Google Scholar] [CrossRef]
- Kantola, A.; Mäkelä, A. Crown development in Norway spruce [Picea abies (L.) Karst.]. Trees 2004, 18, 408–421. [Google Scholar] [CrossRef]
- Weiskittel, A.R.; Maguire, D.A.; Monserud, R.A. Modeling crown structural responses to competing vegetation control, thinning, fertilization, and Swiss needle cast in coastal Douglas-fir of the Pacific Northwest, USA. For. Ecol. Manag. 2007, 245, 96–109. [Google Scholar] [CrossRef]
- Dean, T.J.; Long, J.N. Variation in sapwood area-leaf are relations within two stands of lodgepole pine. For. Sci. 1986, 32, 749–758. [Google Scholar] [CrossRef]
- Shinozaki, K.; Yoda, K.; Hozumi, K.; Kira, T. A quantitative analysis of plant form—The pipe model theory: I. basic analyses. Jpn. J. Ecol. 1964, 14, 97–105. [Google Scholar] [CrossRef]
- Grier, C.C.; Waring, R.H. Conifer foliage mass related to sapwood area. For. Sci. 1974, 20, 205–206. [Google Scholar] [CrossRef]
- Waring, R.H.; Schroefer, P.E.; Oren, R. Application of the pipe model theory to predict canopy leaf area. Can. J. For. Res. 1982, 12, 556–560. [Google Scholar] [CrossRef]
- Maguire, D.A.; Hann, D.W. The relationship between gross crown dimensions and sapwood area at crown base in Douglas-fir. Can. J. For. Res. 1989, 19, 557–565. [Google Scholar] [CrossRef]
- Brix, H.; Ebell, L.F. Effects of nitrogen fertilization on growth, leaf area, and photosynthesis rate in Douglas-fir. For. Sci. 1969, 15, 189–196. [Google Scholar] [CrossRef]
- Tamm, C.O. Response of spruce forest ecosystems to controlled changes in nutrient regime, maintained over periods up to 13 years. In Stability of Spruce Forest Ecosystems, Proceedings of International Symposium; Klimo, E., Ed.; University of Agriculture: Brno, Czechoslovakia, 1980; pp. 423–433. [Google Scholar]
- Pallardy, S.; Kozlowski, T.T. Physiology of Woody Plants, 3rd ed.; Elsevier Science: Burlington, MA, USA, 2010. [Google Scholar]
- Jerez, M.; Dean, T.J.; Cao, Q.V.; Roberts, S.D. Describing leaf area distribution in loblolly pine trees with Johnson’s SB function. For. Sci. 2005, 51, 93–101. [Google Scholar] [CrossRef]
- Hann, D.W. ORGANON User’s Manual, Edition 9.1; College of Forestry, Oregon State University: Corvallis, OR, USA, 2011. [Google Scholar]
- Waring, R.H. Estimating forest growth and efficiency in relation to canopy leaf area. Adv. Ecol. Res. 1983, 13, 327–354. [Google Scholar] [CrossRef]
- Waring, R.H.; Schlesinger, W.H. Forest Ecosystems: Concepts and Management; Academic Press: Orlando, FL, USA, 1985. [Google Scholar]
- Landsberg, J.J. Physiological Ecology of Forest Production; Academic Press: London, UK, 1986. [Google Scholar]
- Smith, F.W.; Long, J.N. The influence of canopy architecture on stemwood production and growth efficiency of Pinus contorta var. latifolia. J. Appl. Ecol. 1989, 26, 681–691. [Google Scholar] [CrossRef]
- Waring, R.H.; Thies, W.G.; Muscato, D. Stem growth per unit of leaf area: A measure of tree vigor. For. Sci. 1980, 26, 112–117. [Google Scholar] [CrossRef]
- Long, J.N.; Smith, F.W. Determinants of stemwood production in Pinus contorta var. latifolia forests: The influence of site quality and stand structure. J. Appl. Ecol. 1990, 27, 847–856. [Google Scholar] [CrossRef]
- Kaufmann, M.R.; Ryan, M.G. Physiographic, stand, and environmental effects on individual tree growth and growth efficiency in subalpine trees. Tree Physiol. 1986, 2, 47–59. [Google Scholar] [CrossRef]
- Assman, E. The Principles of Forest Yield Study: Studies in the Organic Production, Structure, Increment and Yield of Forest Stands; Pergamon Press: Oxford, UK, 1970. [Google Scholar]
- Weiskittel, A.R.; Hann, D.W.; Kershaw, J.A., Jr.; Vanclay, J.K. Forest Growth and Yield Modeling; Wiley-Blackwell: Oxford, UK, 2011. [Google Scholar]
- Landsberg, J.J. Physiology in forest models: History and the future. FBMIS 2003, 1, 49–63. [Google Scholar]
- Snowdon, P.; Woollons, R.C.; Benson, M.L. Incorporation of annual climatic indices into models of Pinus radiata in a spacing experiment. New For. 1998, 16, 101–123. [Google Scholar] [CrossRef]
- Henning, J.G.; Burk, T.E. Improving growth and yield estimates with a process model derived growth index. Can. J. For. Res. 2004, 34, 1274–1282. [Google Scholar] [CrossRef]
- Dzierzon, H.; Mason, E.G. Towards a nationwide growth and yield model for radiata pine plantations in New Zealand. Can. J. For. Res. 2006, 36, 2533–2543. [Google Scholar] [CrossRef]
- Pinjuv, G.; Mason, E.G.; Watt, M. Quantitative validation and comparison of a range of forest growth model types. For. Ecol. Manag. 2006, 236, 37–46. [Google Scholar] [CrossRef]


| Treatment: | Control | Fertilized | ||
|---|---|---|---|---|
| Attribute | Average | Range | Average | Range |
| D (cm) | 26.82 | 20.10–35.20 | 28.19 | 21.00–38.50 |
| H (m) | 20.48 | 15.10–26.10 | 21.04 | 15.70–27.40 |
| HCB (m) | 7.14 | 1.97–13.27 | 7.41 | 1.81–14.70 |
| CL (m) | 13.34 | 11.03–16.85 | 13.64 | 10.10–18.20 |
| CR (%) | 66.46 | 51.58–88.13 | 66.21 | 40.73–88.47 |
| Treatment | Control | Fertilized | ||
|---|---|---|---|---|
| Crown Third/Attribute | Average | Range | Average | Range |
| Lower Third (>5 mm & <15 mm) | n = 14 | n = 12 | ||
| BH (m) | 9.83 | 6.21–16.40 | 11.15 | 6.33–17.18 |
| BD (mm) | 10.13 | 5.3–14.8 | 11.23 | 5.8–14.9 |
| BL (cm) | 116.71 | 52–188 | 138.80 | 68–204 |
| LLF (cm) | 35.79 | 7–100 | 47.50 | 6–85 |
| BFM (g) | 18.81 | 5.2–46.8 | 29.28 | 6.0–84.2 |
| Lower Third (>15 mm) | n = 31 | n = 33 | ||
| BH (m) | 9.96 | 3.58–15.60 | 10.38 | 2.88–17.56 |
| BD (mm) | 27.02 | 16.2–40.6 | 31.24 | 17.8 -45.6 |
| BL (cm) | 263.42 | 26–410 | 308.97 | 196–430 |
| LLF (cm) | 75.65 | 3–175 | 79.36 | 10–175 |
| BFM (g) | 179.71 | 18.1–519.0 | 288.51 | 21.0–706.7 |
| Middle Third (>5 mm & <15 mm) | n = 15 | n = 17 | ||
| BH (m) | 12.86 | 7.11–20.50 | 14.90 | 8.93–20.06 |
| BD (mm) | 9.27 | 5.3–14.4 | 9.51 | 5.6–13.9 |
| BL (cm) | 101.80 | 46–218 | 100.19 | 52–181 |
| LLF (cm) | 11.47 | 1–35 | 8.56 | 0–40 |
| BFM (g) | 32.66 | 4.8–68.0 | 41.12 | 9.1–108.3 |
| Middle Third (>15 mm) | n = 30 | n = 29 | ||
| BH (m) | 13.08 | 7.42–20.82 | 13.21 | 8.36–19.83 |
| BD (mm) | 24.16 | 15.2–34.8 | 24.24 | 15.9–38.1 |
| BL (cm) | 233.40 | 144–322 | 244.97 | 136–359 |
| LLF (cm) | 15.47 | 0–65 | 19.13 | 2–48 |
| BFM (g) | 310.23 | 82.5–729.1 | 309.70 | 111.6–750.2 |
| Upper Third (>5 mm & <15 mm) | n = 14 | n = 16 | ||
| BH (m) | 17.63 | 11.87–23.86 | 18.23 | 13.59–23.00 |
| BD (mm) | 9.21 | 5.0–14.8 | 9.29 | 5.1–14.6 |
| BL (cm) | 71.57 | 18–152 | 72.13 | 25–123 |
| LLF (cm) | 1.29 | 0–6 | 3.47 | 0–13 |
| BFM (g) | 21.99 | 3.2–61.4 | 25.15 | 3.4–64.4 |
| Upper Third (>15 mm) | n = 30 | n = 26 | ||
| HT (m) | 16.30 | 11.14–22.47 | 17.30 | 11.75–24.42 |
| BD (mm) | 20.04 | 15.2–29.6 | 18.92 | 15.3–32.7 |
| BL (cm) | 169.07 | 128–238 | 160.88 | 115–252 |
| LLF (cm) | 7.00 | 0–18 | 9.42 | 1–22 |
| BFM (g) | 155.26 | 56.4–377.1 | 127.26 | 65.3–416.5 |
| Total Branches (N): | N = 134 | N = 133 | ||
| Parameter | Estimate | Standard Error | p-Value |
|---|---|---|---|
| α0 | 0.9729 | 0.1401 | <0.0001 |
| α1 | 2.2813 | 0.0412 | <0.0001 |
| α2 | 1.7271 | 0.0283 | <0.0001 |
| α3 | 2.2111 | 0.0758 | <0.0001 |
| σδ32 | 0.00496 | 0.0039 | |
| σε12 | 0.0162 | 0.0078 | |
| t | 1.9280 | ||
| df = 254 | wRMSE = 27.8748 g | Rg2 = 0.8752 | |
| Parameter | Estimate | Standard Error | p-Value |
|---|---|---|---|
| β0 | 185.4341 | 59.9687 | 0.0074 |
| β1 | 2.7154 | 0.4193 | <0.0001 |
| β2 | 0.8080 | 0.1771 | 0.0004 |
| β3 | −1.7845 | 0.4638 | 0.0016 |
| β4 | 0.0135 | 0.0044 | 0.0074 |
| σδ12 | 0.000266 | 0.000183 | |
| σε22 | 2.552 | 0.8208 | |
| df = 15 | RMSE = 1.3751 kg | Rg2 = 0.9671 | |
| Model | RMSE (g) | MAB (g) |
|---|---|---|
| Unbinned | ||
| Weibull-Right Truncated | 678.1 | 438.3 |
| Weibull | 679.6 | 438.1 |
| Beta | 708.2 | 472.6 |
| Johnson’s SB | 789.1 | 543.1 |
| Binned | ||
| Weibull-Right Truncated | 678.7 | 437.0 |
| Weibull | 681.9 | 438.6 |
| Beta | 686.0 | 448.1 |
| Johnson’s SB | 695.8 | 459.2 |
| Parameter | Estimate | Standard Error | p-Value |
|---|---|---|---|
| Kurtosis (Scale) Parameter η | |||
| ρ0 | 3.5636 | 0.3118 | <0.0001 |
| ρ1 | 0.4003 | 0.0235 | <0.0001 |
| ρ2 | −9.7729 | 0.9289 | <0.0001 |
| ρ3 | −0.4895 | 0.0358 | <0.0001 |
| RMSE = 0.3101 | Rg2 = 0.9164 | ||
| Skew (Shape) Parameter β | |||
| κ0 | 1.7529 | 0.4007 | <0.0001 |
| κ1 | −9.7482 | 2.7050 | 0.0009 |
| κ2 | 0.7830 | 0.2090 | 0.0006 |
| κ3 | 0.1212 | 0.0514 | 0.0240 |
| RMSE = 0.1548 | Rg2 = 0.4166 | ||
| System | |||
| df = 72 | RM2 = 0.8555 | ||
© 2020 by the authors. Licensee MDPI, Basel, Switzerland. This article is an open access article distributed under the terms and conditions of the Creative Commons Attribution (CC BY) license (http://creativecommons.org/licenses/by/4.0/).
Share and Cite
Putney, J.D.; Maguire, D.A. Shifts in Foliage Biomass and Its Vertical Distribution in Response to Operational Nitrogen Fertilization of Douglas-Fir in Western Oregon. Forests 2020, 11, 511. https://doi.org/10.3390/f11050511
Putney JD, Maguire DA. Shifts in Foliage Biomass and Its Vertical Distribution in Response to Operational Nitrogen Fertilization of Douglas-Fir in Western Oregon. Forests. 2020; 11(5):511. https://doi.org/10.3390/f11050511
Chicago/Turabian StylePutney, Jacob D., and Douglas A. Maguire. 2020. "Shifts in Foliage Biomass and Its Vertical Distribution in Response to Operational Nitrogen Fertilization of Douglas-Fir in Western Oregon" Forests 11, no. 5: 511. https://doi.org/10.3390/f11050511
APA StylePutney, J. D., & Maguire, D. A. (2020). Shifts in Foliage Biomass and Its Vertical Distribution in Response to Operational Nitrogen Fertilization of Douglas-Fir in Western Oregon. Forests, 11(5), 511. https://doi.org/10.3390/f11050511