Interactive Effects of Stock Type and Forest Vegetation Management Treatments on Douglas-Fir Seedling Growth and Survival—Ten-Year Results


Abstract
1. Introduction
2. Materials and Methods
2.1. Study Design
2.2. Tree and Vegetation Measurements
2.3. Soil Moisture Measurements
2.4. Statistical Analysis
3. Results
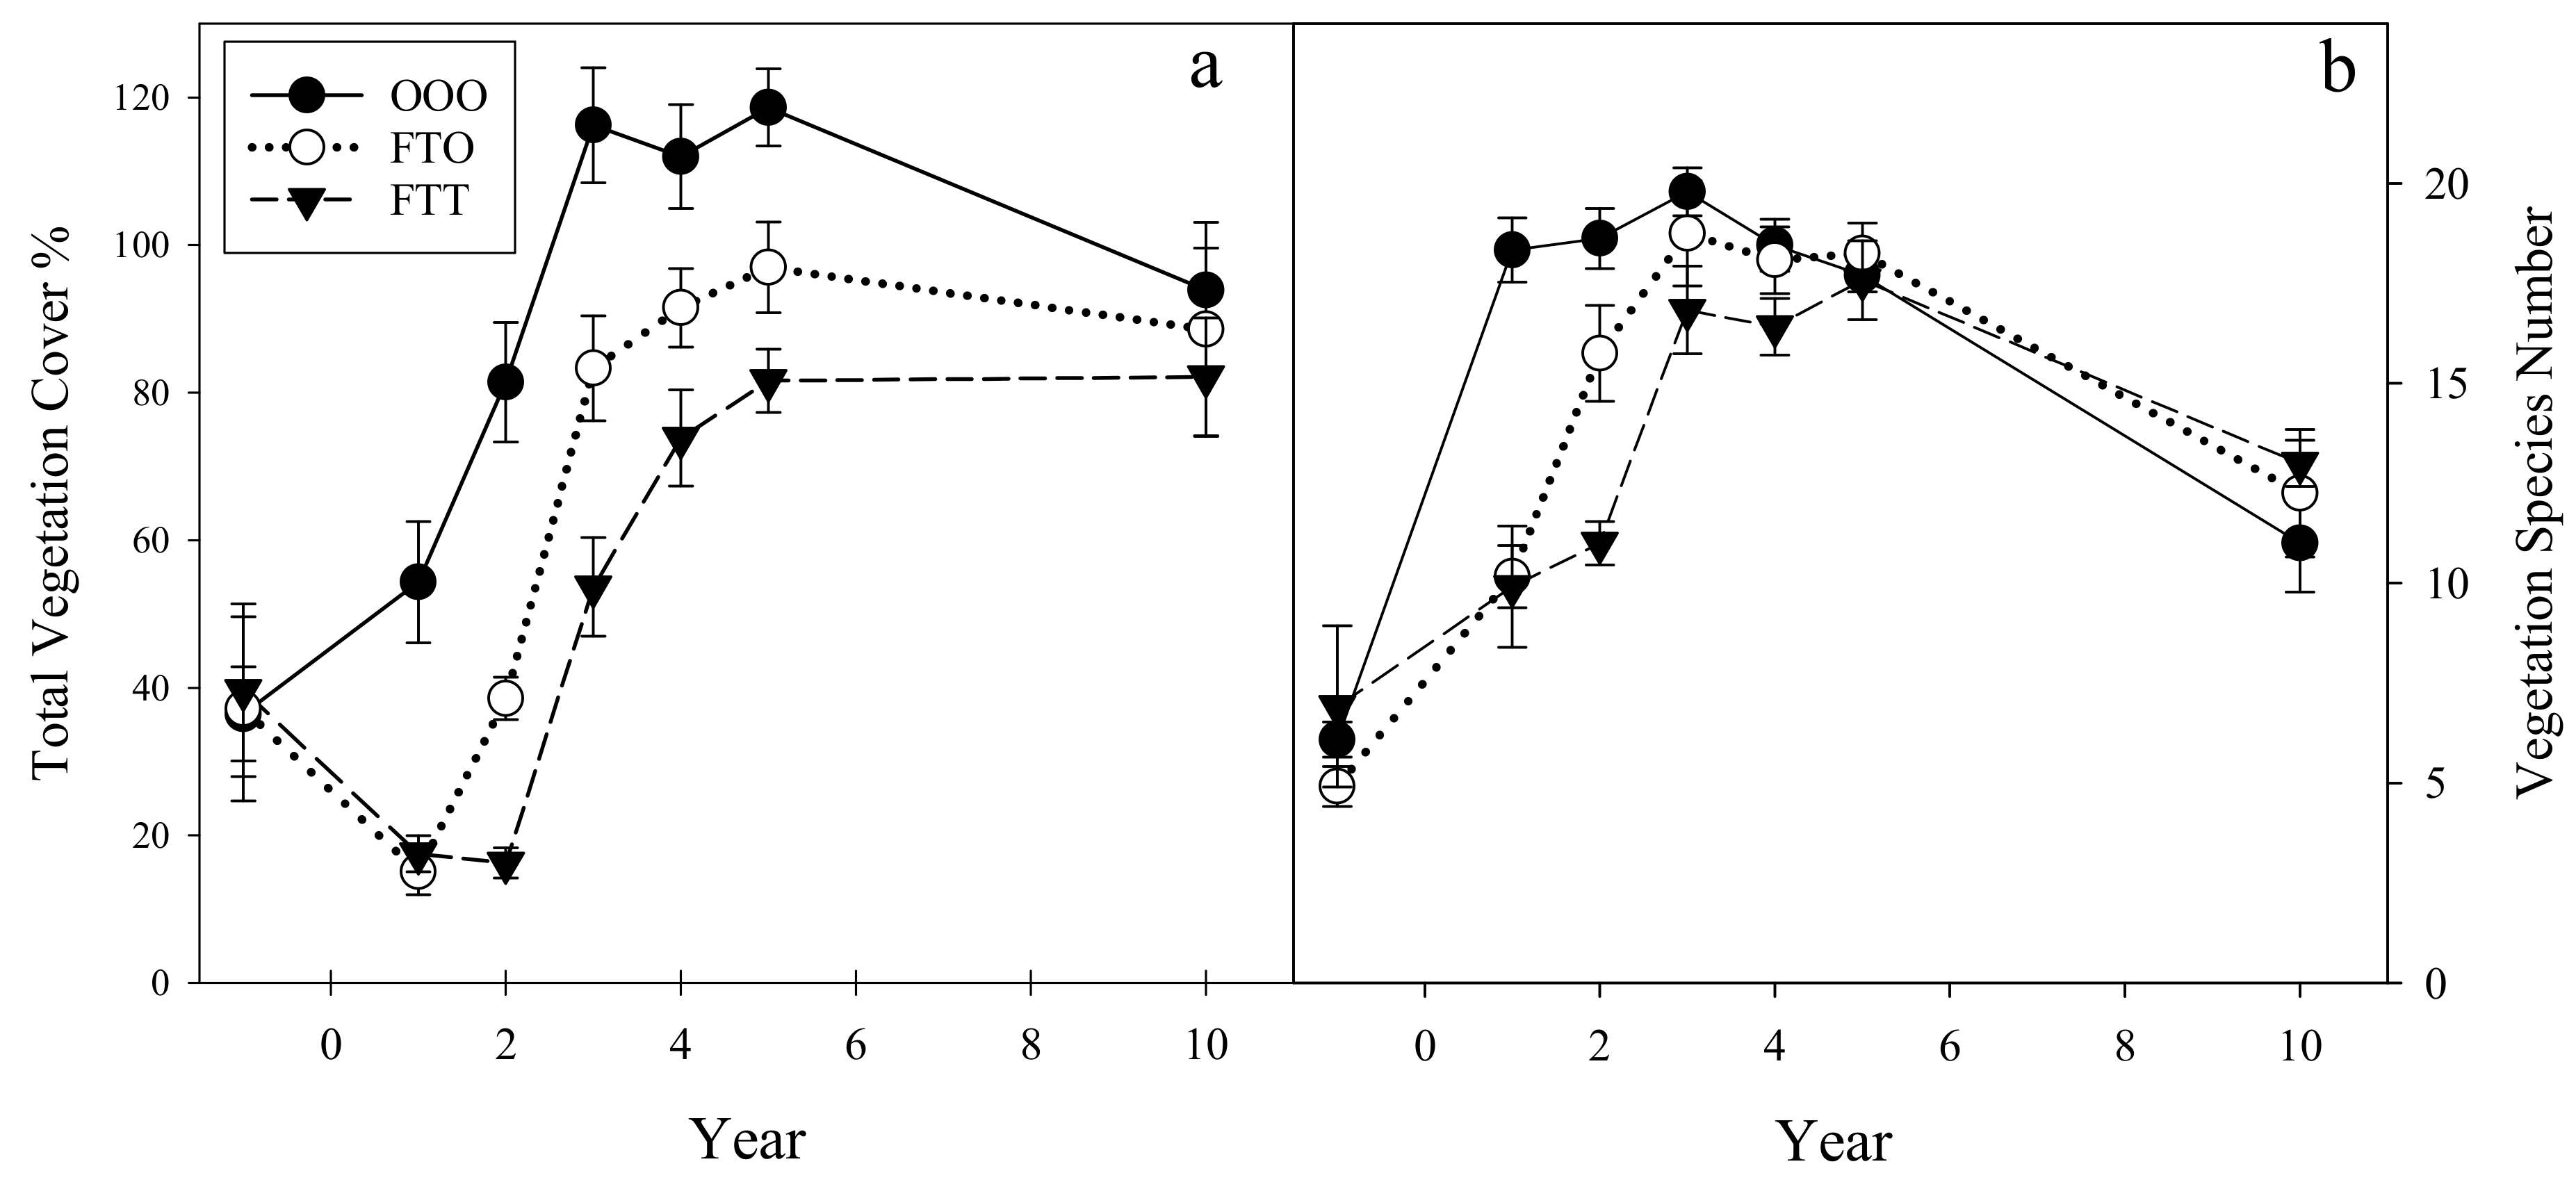
3.1. Plant Community Dynamics
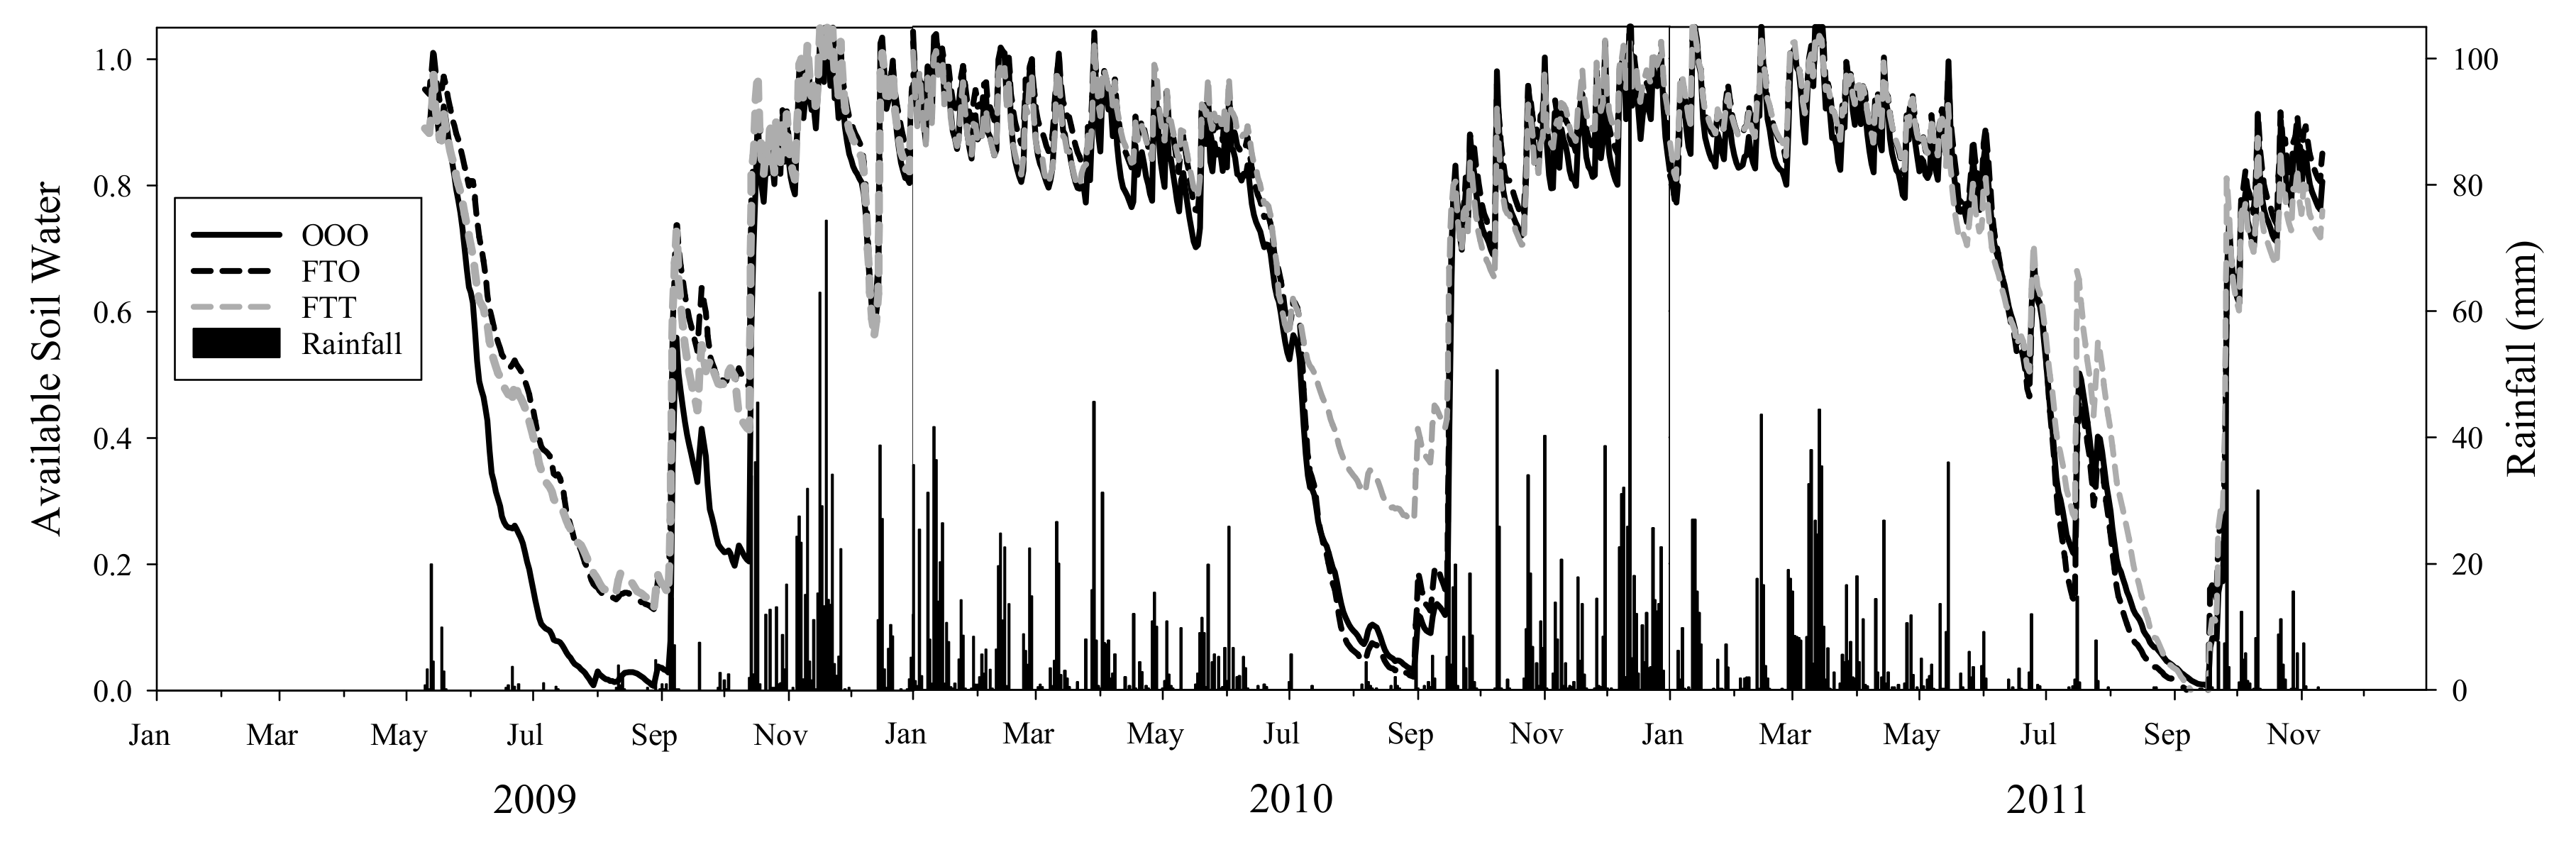
3.2. Soil Moisture
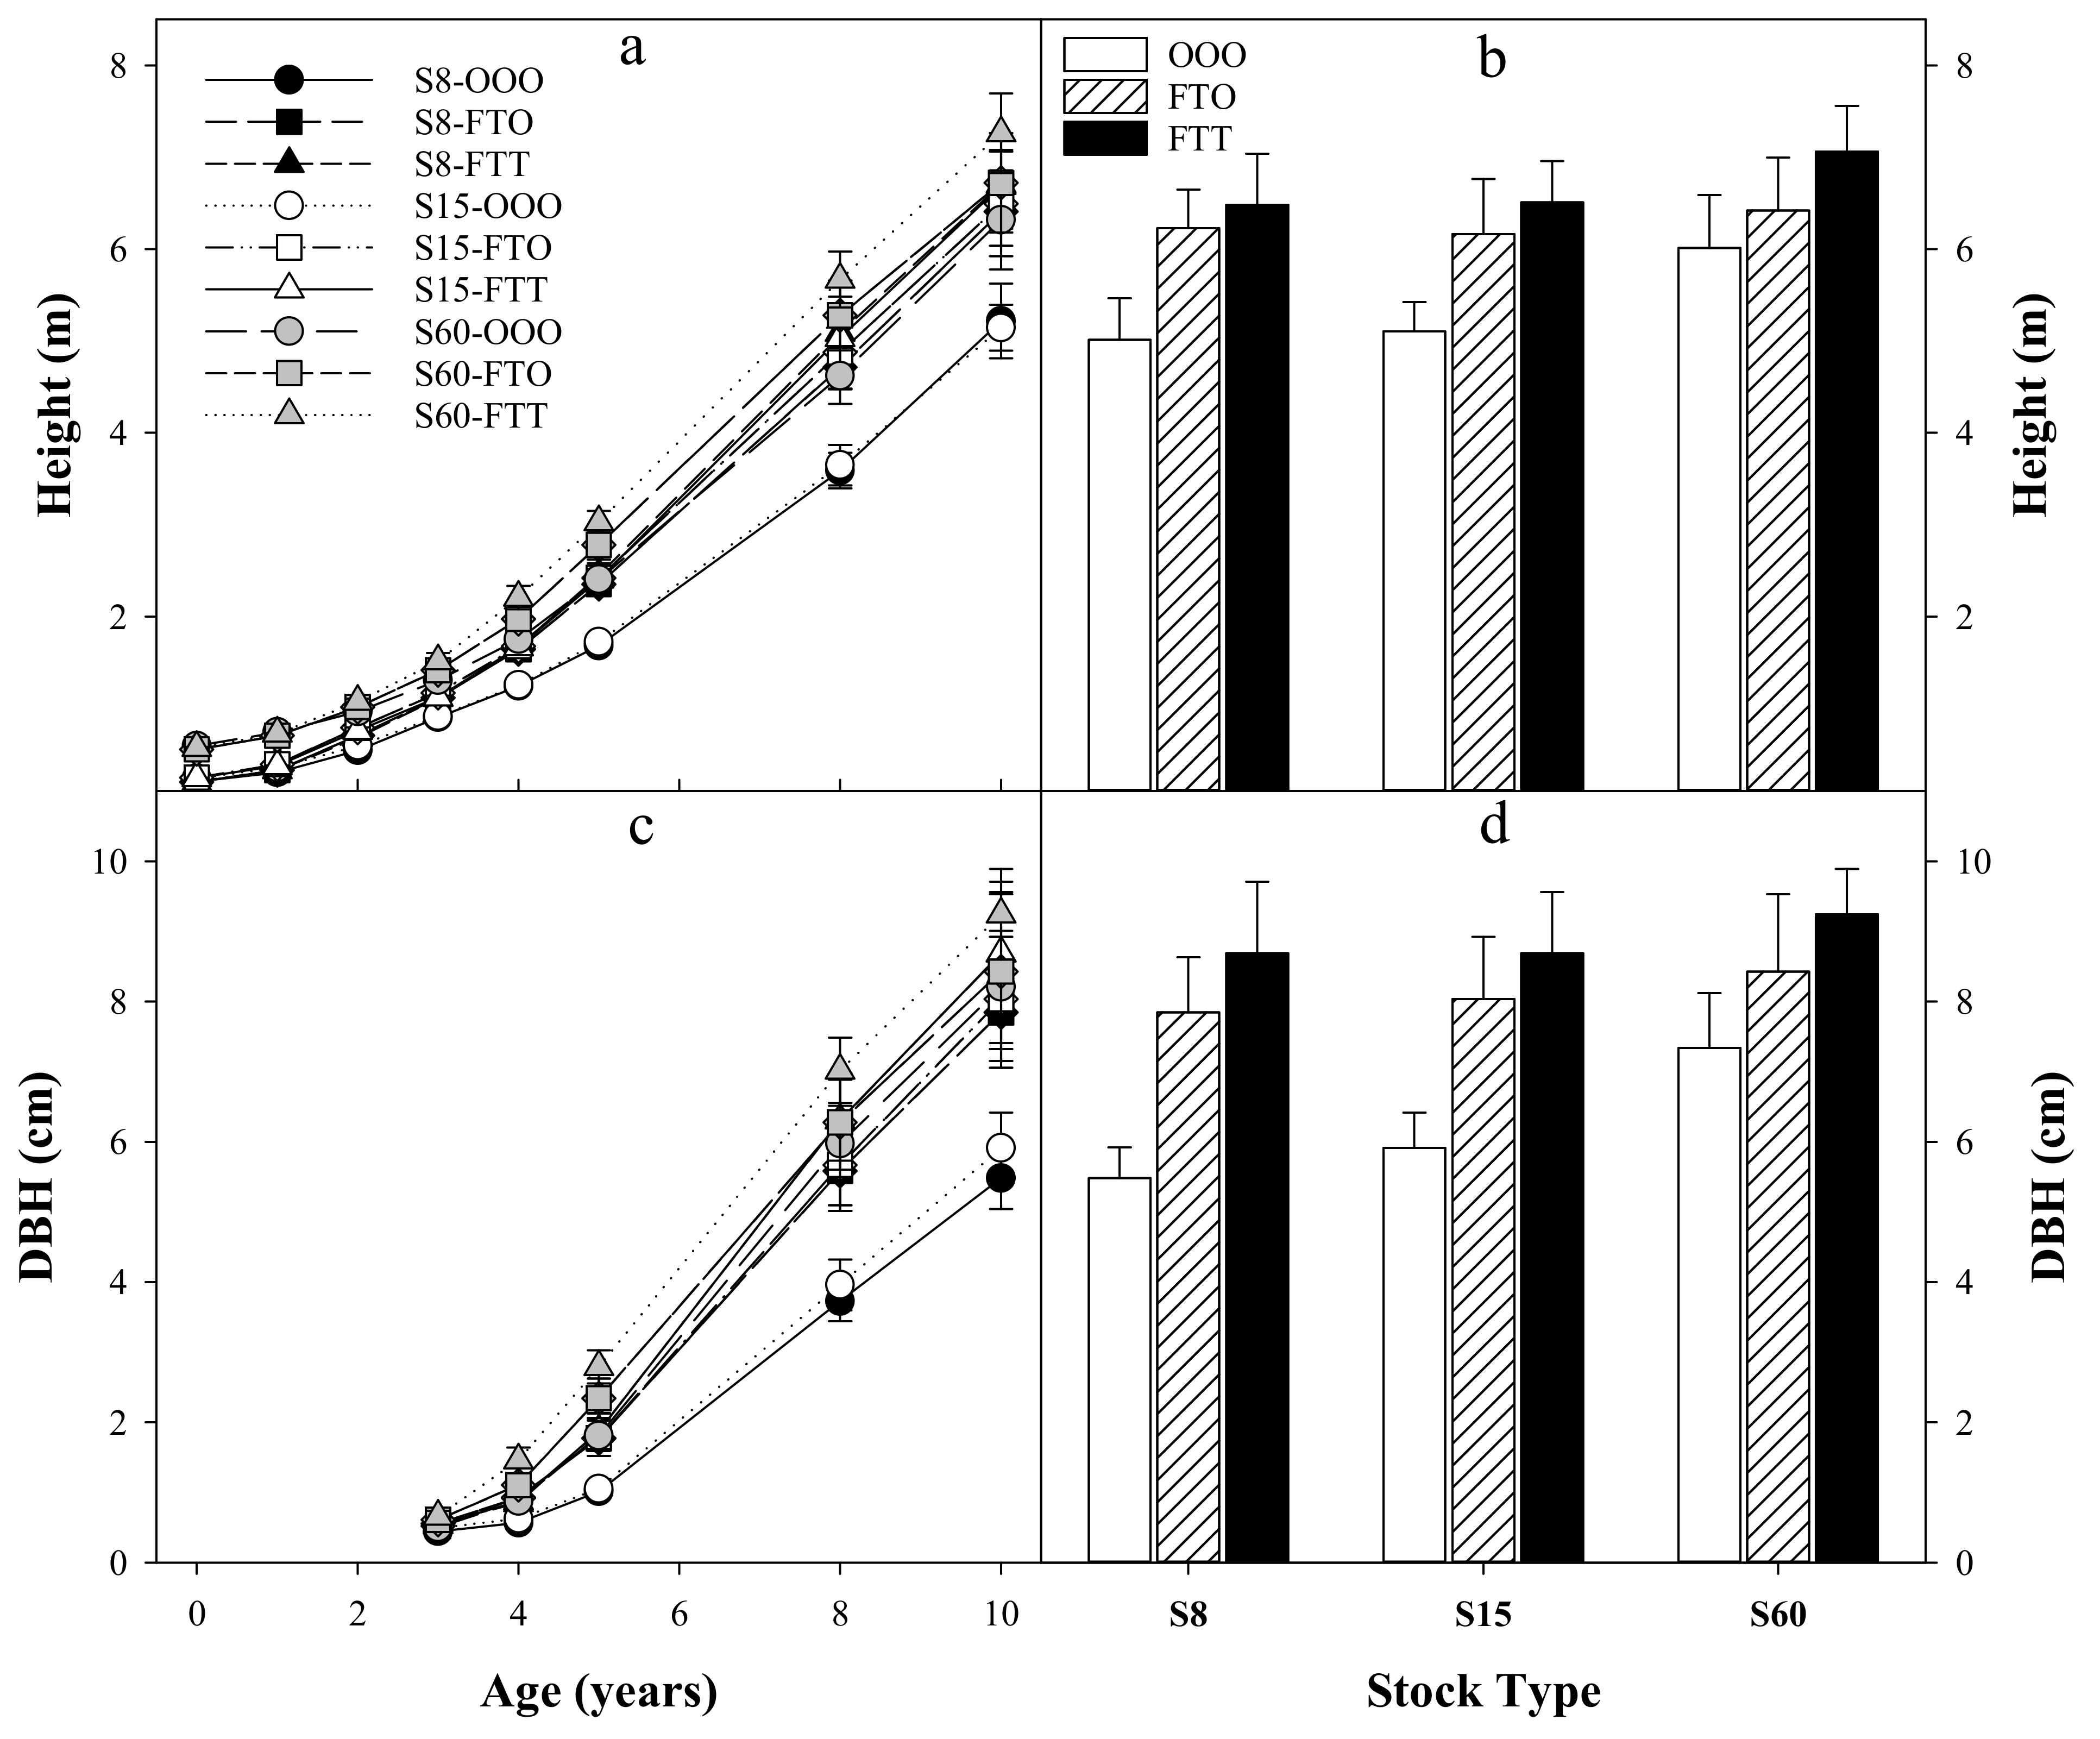
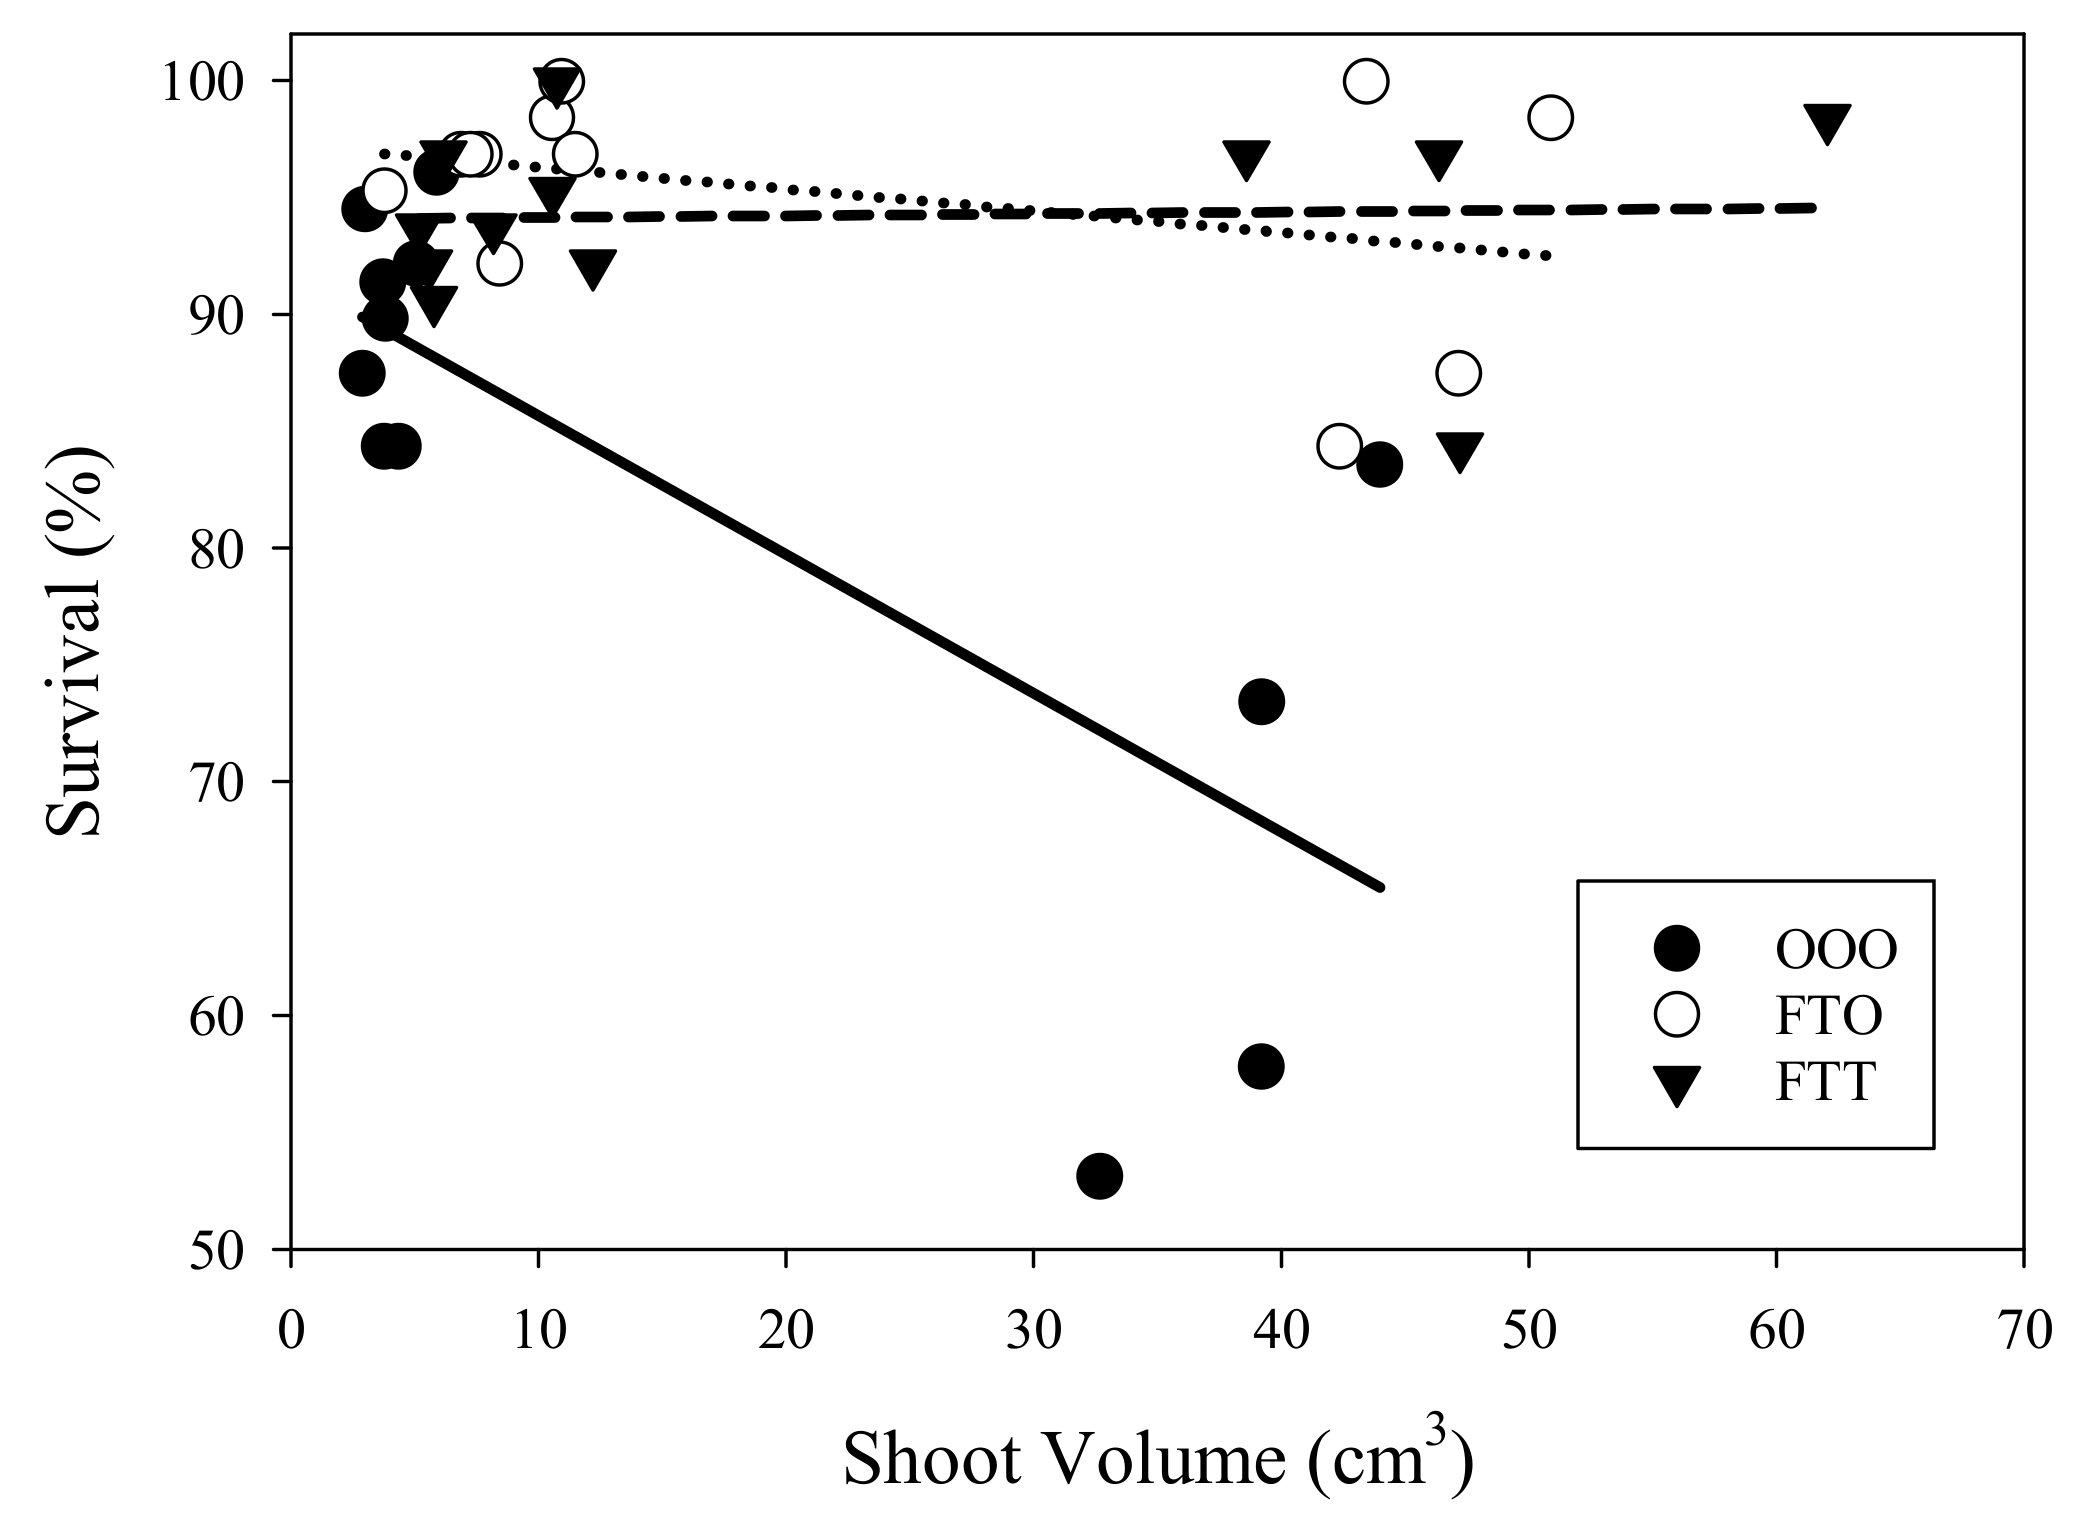
3.3. Seedlings
4. Discussion
5. Conclusions
Author Contributions
Funding
Acknowledgments
Conflicts of Interest
References
- Fox, T.R.; Jokela, E.J.; Allen, H.L. The Development of Pine Plantation Silviculture in the Southern United States. J. For. 2007, 105, 337–347. [Google Scholar]
- Vargas, F.; Rubilar, R.; Gonzalez-Benecke, C.A.; Sanchez-Olate, M.; Aracena, P. Long-term response to area of competition control in Eucalyptus globulus plantations. New For. 2018, 49, 383–398. [Google Scholar] [CrossRef]
- Flamenco, H.N.; Gonzalez-Benecke, C.A.; Wightman, M.G. Long-term effects of vegetation management on biomass stock of four coniferous species in the Pacific Northwest United States. For. Ecol. Manag. 2019, 432, 276–285. [Google Scholar] [CrossRef]
- Brancalion, P.H.S.; Campoe, O.; Mendes, J.C.T.; Noel, C.; Moreira, G.G.; van Melis, J.; Stape, J.L.; Guillemot, J. Intensive silviculture enhances biomass accumulation and tree diversity recovery in tropical forest restoration. Ecol. Appl. 2019, 29, e01847. [Google Scholar] [CrossRef] [PubMed]
- Jokela, E.J.; Martin, T.A.; Vogel, J.G. Twenty-Five Years of Intensive Forest Management with Southern Pines: Important Lessons Learned. J. For. 2010, 108, 338–347. [Google Scholar]
- Gonçalves, J.L.M.; Alvares, C.A.; Higa, A.R.; Silva, L.D.; Alfenas, A.C.; Stahl, J.; Ferraz, S.F.; Lima, W.; Brancalion, P.H.S.; Hubner, A.; et al. Integrating genetic and silvicultural strategies to minimize abiotic and biotic constraints in Brazilian eucalypt plantations. For. Ecol. Manag. 2013, 301, 6–27. [Google Scholar] [CrossRef]
- Dinger, E.J.; Rose, R. Integration of soil moisture, xylem water potential, and fall–spring herbicide treatments to achieve the maximum growth response in newly planted Douglas-fir seedlings. Can. J. For. Res. 2009, 39, 1401–1414. [Google Scholar] [CrossRef]
- Gonzalez-Benecke, C.A.; Dinger, E.J. Use of water stress integral to evaluate relationships between soil moisture, plant water stress and stand productivity in young Douglas-fir trees. New For. 2018, 49, 775–789. [Google Scholar] [CrossRef]
- Balandier, P.; Collet, C.; Miller, J.H.; Reynolds, P.E.; Zedaker, S.M. Designing forest vegetation management strategies based on the mechanisms and dynamics of crop tree competition by neighboring vegetation. Forestry 2006, 79, 3–27. [Google Scholar] [CrossRef]
- Dimock, E.J.; Beebe, T.F.; Collard, E.B. Planting-Site Preparation with Herbicides to Aid Conifer Reforestation. Weed Sci. 1983, 31, 215–221. [Google Scholar] [CrossRef]
- Newton, M.; Preest, D.S. Growth and Water Relations of Douglas Fir (Pseudotsuga menziesii) Seedlings under Different Weed Control Regimes. Weed Sci. 1988, 36, 653–662. [Google Scholar] [CrossRef]
- Rose, R.; Rosner, L.S.; Ketchum, J.S. Twelfth-year response of Douglas-fir to area of weed control and herbaceous versus woody weed control treatments. Can. J. For. Res. 2006, 36, 2464–2473. [Google Scholar] [CrossRef]
- Maguire, D.A.; Mainwaring, D.B.; Rose, R.; Garber, S.M.; Dinger, E.J. Response of coastal Douglas-fir and competing vegetation to repeated and delayed weed control treatments during early plantation development. Can. J. For. Res. 2009, 39, 1208–1219. [Google Scholar] [CrossRef]
- Wightman, M.G.; Gonzalez-Benecke, C.A.; Dinger, E.J. The Influence of Containerized Stock Type on the Growth and Survival of Douglas-fir Seedlings. Tree Plant. Notes 2018, 61, 134–141. [Google Scholar]
- Van Driessche, R. Absolute and relative growth of Douglas-fir seedlings of different sizes. Tree Physiol. 1992, 10, 141–152. [Google Scholar] [CrossRef] [PubMed]
- Rose, R.; Haase, D.L.; Kroiher, F.; Sabin, T. Root Volume and Growth of Ponderosa Pine and Douglas-Fir Seedlings: A Summary of Eight Growing Seasons. West. J. Appl. For. 1997, 12, 69–73. [Google Scholar] [CrossRef][Green Version]
- Haase, D.L.; Rose, R.; Trobaugh, J. Field Performance of Three Stock Sizes of Douglas-fir Container Seedlings Grown with Slow-release Fertilizer in the Nursery Growing Medium. New For. 2006, 31, 1–24. [Google Scholar] [CrossRef]
- Dumroese, K.R.; Landis, T.D.; Pinto, J.R.; Haase, D.L.; Wilkinson, K.W.; Davis, A.S. Meeting forest restoration challenges: Using the target plant concept. Reforesta 2016, 1, 37–52. [Google Scholar] [CrossRef]
- Harrington, J.T.; Mexal, J.G.; Fisher, J.T. Volume Displacement Provides a Quick and Accurate Way to Quantify New Root Production. Tree Plant. Notes 1994, 45, 121–124. [Google Scholar]
- Ritchie, J.T. Soil water availability. Plant Soil 1981, 58, 327–338. [Google Scholar] [CrossRef]
- Littell, R.C.; Milliken, G.A.; Stroup, W.W.; Wolfinger, R.D. SAS System for Mixed Models; SAS Institute Inc.: Cary, NC, USA, 1996. [Google Scholar]
- Dinger, E.J.; Rose, R. Initial fall-spring vegetation management regimes improve moisture conditions and maximize third-year Douglas-fir seedling growth in a Pacific Northwest plantation. N. Zeal. J. For. Sci. 2010, 40, 93–108. [Google Scholar]
- Lambers, H.; Chapin, S.F.; Pons, L.P. Plant Physiological Ecology, 2nd ed.; Springer: New York, NY, USA, 2008; pp. 247–255. [Google Scholar]
- Frasher, L.; Turkington, R.; Chanway, C.P. The biology of Canadian weeds. 102. Gaultheria shallon Pursh—PubAg. Can. J. Plant Sci. 1993, 73, 1233–1247. [Google Scholar] [CrossRef]
- Mallik, A.U.; Prescott, C.E. Growth Inhibitory Effects of Salal on Western Hemlock and Western Red Cedar. Agron. J. 2001, 93, 85–92. [Google Scholar] [CrossRef]
- Prescott, C.E.; Sajedi, T. The role of salal in forest regeneration problems in coastal British Columbia: Problem or symptom? For. Chron. 2008, 84, 29–36. [Google Scholar] [CrossRef]
- Willoughby, I.H.; Forster, J.; Stokes, V.J. Gaultheria shallon can be controlled by the herbicides picloram, triclopyr or glyphosate if they are applied at the correct time of year. New For. 2018, 49, 757–774. [Google Scholar] [CrossRef]
- Price, D.T.; Black, T.A.; Kelliher, F.M. Effects of salal understory removal on photosynthetic rate and stomatal conductance of young Douglas-fir trees. Can. J. For. Res. 1986, 16, 90–97. [Google Scholar] [CrossRef]
- Boateng, J.O.; Haeussler, S.; Bedford, L. Boreal Plant Community Diversity 10 Years After Glyphosate Treatment. West. J. Appl. For. 2000, 15, 15–26. [Google Scholar] [CrossRef]
- Lautenschlager, R.A.; Sullivan, T.P. Effects of herbicide treatments on biotic components in regenerating northern forests. For. Chron. 2002, 78, 695–731. [Google Scholar] [CrossRef]
- Comeau, P.G.; Harper, G.J. Effects of vegetation control treatments for release of Engelmann spruce from a mixed-shrub community in southern British Columbia—Year 15 results. For. Chron. 2009, 85, 583–592. [Google Scholar] [CrossRef][Green Version]
- Comeau, P.G.; Fraser, E.C. Plant Community Diversity and Tree Growth Following Single and Repeated Glyphosate Herbicide Applications to a White Spruce Plantation. Forests 2018, 9, 107. [Google Scholar] [CrossRef]
- Johansson, K.; Hajek, J.; Sjölin, O.; Normark, E. Early performance of Pinus sylvestris and Picea abies—A comparison between seedling size, species, and geographic location of the planting site. Scand. J. For. Res. 2015, 30, 388–400. [Google Scholar]
- Regan, D.J.; Apostol, K.G.; Davis, A.S. Stocktype Influences Western White Pine Seedling Size 6 Years after Outplanting. Tree Plant. Notes 2015, 58, 37–41. [Google Scholar]
- Dinger, E.J.; Rose, R. Combining Weed Control. Intensity and Seedling Stock Size to Maximize Douglas-Fir Productivity and Economic Return; VMRC 2008–2009 Annual Report; Oregon State University Publishing: Corvallis, OR, USA, 2009; pp. 22–29. [Google Scholar]


| Treatment | Vegetation Control | Stock Size | |
|---|---|---|---|
| 1 | OOO | No-action Control | S8 |
| 2 | FTO | Fall Site Preparation + Spring Release in Year 1 | S8 |
| 3 | FTT | Fall Site Preparation + Spring Release in Years 1 and 2 | S8 |
| 4 | OOO | No-action Control | S15 |
| 5 | FTO | Fall Site Preparation + Spring Release in Year 1 | S15 |
| 6 | FTT | Fall Site Preparation + Spring Release in Years 1 and 2 | S15 |
| 7 | OOO | No-action Control | S60 |
| 8 | FTO | Fall Site Preparation + Spring Release in Year 1 | S60 |
| 9 | FTT | Fall Site Preparation + Spring Release in Years 1 and 2 | S60 |
| Stock | H (cm) | RCD (mm) | H:D (cm cm−1) | Shoot Volume (cm3) | Root Volume (cm3) | S:R |
|---|---|---|---|---|---|---|
| S8 | 24.0 ± 0.5 a | 3.3 ± 0.1 a | 74.7 ± 2.0 a | 6.5 ± 0.3 a | 6.1 ± 0.3 a | 1.11 ± 0.05 b |
| S15 | 29.9 ± 0.6 b | 3.7 ± 0.1 b | 82.7 ± 2.1 b | 12.0 ± 0.6 b | 9.6 ± 0.5 a | 1.32 ± 0.06 a |
| S60 | 68.0 ± 1.2 c | 8.9 ± 0.1 c | 76.8 ± 1.7 a | 56.1 ± 1.8 c | 51.5 ± 3.4 b | 1.25 ± 0.07 ab |
| Stock | FVM Treatment | Height M | DBH cm | Tree Vol dm3 | TPH Trees ha−1 | Stand Vol m3 ha−1 |
|---|---|---|---|---|---|---|
| S8 | OOO | 5.0 ± 0.5 a | 5.5 ± 0.5 a | 9.4 ± 2.0 a | 770 ± 58 ab | 7.5 ± 1.7 a |
| S8 | FTO | 6.2 ± 0.5 bc | 7.8 ± 0.9 cd | 20.5 ± 5.3 ab | 837 ± 48 b | 17.4 ± 4.9 abcd |
| S8 | FTT | 6.5 ± 0.6 bc | 8.7 ± 1.2 cd | 25.9 ± 7.9 b | 896 ± 33 b | 23.0 ± 6.6 cd |
| S15 | OOO | 5.1 ± 0.4 a | 5.9 ± 0.6 ab | 11.0 ± 2.5 a | 789 ± 60 ab | 8.4 ± 2.1 ab |
| S15 | FTO | 6.2 ± 0.7 bc | 8.0 ± 1.0 cd | 21.7 ± 7.6 ab | 883 ± 37 b | 18.6 ± 5.5 abcd |
| S15 | FTT | 6.5 ± 0.5 bc | 8.7 ± 1.0 cd | 25.5 ± 6.7 b | 841 ± 46 b | 21.3 ± 5.5 cd |
| S60 | OOO | 6.0 ± 0.7 ab | 7.3 ± 0.9 bc | 18.0 ± 5.4 ab | 621 ± 73 a | 11.9 ± 5.1 abc |
| S60 | FTO | 6.4 ± 0.7 bc | 8.4 ± 1.3 cd | 25.0 ± 9.3 b | 837 ± 52 b | 20.4 ± 7.3 bcd |
| S60 | FTT | 7.1 ± 0.6 c | 9.2 ± 0.7 d | 29.3 ± 5.9 b | 879 ± 53 b | 25.4 ± 4.4 cd |
| Variable | FVM | Stock Type | Stock Type x FVM |
|---|---|---|---|
| Height | <0.001 | 0.004 | 0.438 |
| DBH | <0.001 | 0.001 | 0.413 |
| Tree Volume | <0.001 | 0.051 | 0.889 |
| TPH | <0.001 | 0.222 | 0.195 |
| Stand Volume | <0.001 | 0.217 | 0.965 |
| Stock Type | FVM Regime | Seedlings | Planting Crew | FVM | Total Establishment Cost |
|---|---|---|---|---|---|
| S8 | OOO | $269 | $120 | - | $389 |
| S8 | FTO | $269 | $120 | $270 | $659 |
| S8 | FTT | $269 | $120 | $405 | $794 |
| S15 | OOO | $376 | $120 | - | $496 |
| S15 | FTO | $376 | $120 | $270 | $766 |
| S15 | FTT | $376 | $120 | $405 | $901 |
| S60 | OOO | $1343 | $140 | - | $1483 |
| S60 | FTO | $1343 | $140 | $270 | $1753 |
| S60 | FTT | $1343 | $140 | $405 | $1888 |
© 2019 by the authors. Licensee MDPI, Basel, Switzerland. This article is an open access article distributed under the terms and conditions of the Creative Commons Attribution (CC BY) license (http://creativecommons.org/licenses/by/4.0/).
Share and Cite
Wightman, M.G.; Gonzalez-Benecke, C.A.; Dinger, E.J. Interactive Effects of Stock Type and Forest Vegetation Management Treatments on Douglas-Fir Seedling Growth and Survival—Ten-Year Results. Forests 2019, 10, 1002. https://doi.org/10.3390/f10111002
Wightman MG, Gonzalez-Benecke CA, Dinger EJ. Interactive Effects of Stock Type and Forest Vegetation Management Treatments on Douglas-Fir Seedling Growth and Survival—Ten-Year Results. Forests. 2019; 10(11):1002. https://doi.org/10.3390/f10111002
Chicago/Turabian StyleWightman, Maxwell G., Carlos A. Gonzalez-Benecke, and Eric J. Dinger. 2019. "Interactive Effects of Stock Type and Forest Vegetation Management Treatments on Douglas-Fir Seedling Growth and Survival—Ten-Year Results" Forests 10, no. 11: 1002. https://doi.org/10.3390/f10111002
APA StyleWightman, M. G., Gonzalez-Benecke, C. A., & Dinger, E. J. (2019). Interactive Effects of Stock Type and Forest Vegetation Management Treatments on Douglas-Fir Seedling Growth and Survival—Ten-Year Results. Forests, 10(11), 1002. https://doi.org/10.3390/f10111002