Review

Stand Structural Characteristics Are the Most Practical Biodiversity Indicators for Forest Management Planning in Europe

1
Forest Research Centre (CEF), School of Agriculture, University of Lisbon, Tapada da Ajuda, 1349-017 Lisbon, Portugal
2
Center for Applied Ecology ‘‘Prof. Baeta Neves’’ (CEABN-InBIO), School of Agriculture, University of Lisbon, Tapada da Ajuda, 1349-017 Lisbon, Portugal
3
Ecosystem Dynamics and Forest Management Group, School of Life Sciences, Technical University of Munich, Hans-Carl-von-Carlowitz-Platz 2, 85354 Freising, Germany
4
Institute of Silviculture, Department of Forest and Soil Sciences, University of Natural Resources and Life Sciences (BOKU) Vienna, Peter-Jordan-Straße 82, 1190 Vienna, Austria
5
Gund Institute for Environment, University of Vermont, 617 Main Street, Burlington, VT 05405, USA
*
Author to whom correspondence should be addressed.
Forests 2020, 11(3), 343; https://doi.org/10.3390/f11030343
Submission received: 24 February 2020 / Revised: 15 March 2020 / Accepted: 17 March 2020 / Published: 19 March 2020

Abstract

:
Including biodiversity assessments in forest management planning is becoming increasingly important due to the importance of biodiversity for forest ecosystem resilience provision and sustainable functioning. Here we investigated the potential to include biodiversity indicators into forest management planning in Europe. In particular, we aimed to (i) identify biodiversity indicators and data collection methods for biodiversity assessments at the stand and landscape levels, and (ii) evaluate the practicality of those indicators for forest management planning. We performed a literature review in which we screened 188 research studies published between 1990 and 2020. We selected 94 studies that fulfilled the inclusion criteria and examined in more detail. We considered three aspects of biodiversity: structure, composition, and function, and four forest management categories: unmanaged, managed, plantation, and silvopastoral. We used three criteria to evaluate the practicality of forest biodiversity indicators: cost-effectiveness, ease of application, and time-effectiveness. We identified differences in the practicality of biodiversity indicators for their incorporation into management plans. Stand-level indicators are more practical than landscape-level indicators. Moreover, structural biodiversity indicators (e.g., large trees, canopy openness, and old forest stands) are more useful in management plans than compositional indicators, as these are easily observable by non-professionals and can be obtained by forest inventories. Compositional indicators such are vascular plants, fungi, bryophyte, lichens, and invertebrate species are hard to identify by non-professionals and thus are impractical. Functional indicators (e.g., nutrient cycling) are not sufficiently addressed in the literature. Using recently updated existing databases (e.g., national forest inventories and bird atlases) is very time and cost-efficient. Remote sensing and other technology (e.g., smartphone applications) are promising for efficient data collection in the future. However, more research is needed to make these tools more accurate and applicable to a variety of ecological conditions and scales. Until then, forest stand structural variables derived from inventories can help improve management plans to prepare European forests towards an uncertain future.

1. Introduction

Forests host much of the world’s biodiversity [1,2] and most terrestrial species inhabit these ecosystems [3,4]. Biodiversity is “the variety of life on Earth and the natural patterns it forms” [5]. Forest biodiversity is the variety of all forms of life and its organization within the forest area [6,7]. The world’s terrestrial ecosystems encompass a forest area of 30.6%, with a declining trend [8]. In contrast, Europe’s forest cover of currently 33% (215 million ha) is increasing [9]. The leading threat to biodiversity is the loss and the extreme alteration of ‘once naturally dynamic forests’ mainly due to competitive land use [10,11,12]. Even though there is limited proof of the current effect of climate change on biodiversity, researchers propose that climate change could outperform habitat destruction by land use and become the leading threat to biodiversity in the future [13,14].
Biodiversity is critical for forest ecosystem resilience as it determines the adaptive capacity of a community and sustainable provisioning of ecosystem services [15,16]. Therefore, to prepare forests for an uncertain future, biodiversity conservation became one of the most important aspects of forest management planning. Biodiversity includes a scope of spatial scales and has components related to the forest structure, (e.g., tree dimensions, canopy complexity, deadwood, and understory), composition (e.g., diversity within and between species, or species communities), and function (e.g., succession, decomposition, nutrient cycling) [17,18,19,20]. Due to the complexity of biodiversity across multiple components and scales, extensive evaluations of biodiversity are arduous and costly to embrace, even for stands of generally basic structure and organization [18,19,20,21]. Therefore, it is necessary to develop indicators to facilitate its assessment and integration into forest management plans [22]. Such indicators are ‘surrogate measures of other components of forest biodiversity’ that are used for the assessment of temporal and spatial changes of biodiversity [4,23]. Indicators need to be practical for the use of scientists and forest managers with different backgrounds. Practical indicators ideally are simple to evaluate, repeatable, economic, and ecologically important [24,25]. While numerous studies thoroughly addressed the importance of biodiversity indicators for biodiversity assessment [21,26,27], the practical usefulness of those indicators in sustainable forestry is still affected by perplexity and misconception [28,29,30]. Some of the leading problems that might cause the confusion about which indicator to choose from are (a) different spatial scales (i.e., the same indicator might not work for stand and landscape scale), (b) forest managers with different educational backgrounds (i.e., some managers might not understand why and where to use specific indicators), (c) unclear definition of the indicator and target levels (i.e., it is often unclear which biodiversity value is measured and according to what target level action needs to be undertaken) [30], and (d) facility to measure indicators repeatedly. Another challenge is to make a compromise between comprehensive biodiversity assessments and the cost-effectiveness of tools that can be used by forest managers to derive biodiversity indicators [12]. There are several reviews related to the use of biodiversity indicators in forest management planning in Europe [31,32,33]. However, no study has summarized yet the practicality of forest biodiversity indicators and methods for data collection. In particular, open questions are (i) what is the state of the art of the practicality of forest biodiversity assessment, and (ii) which biodiversity aspects are more and which are less amenable for forest managers, and why?
Our study sheds light into those questions. Based on a literature review, we discuss the practicality of biodiversity indicators and tools to collect biodiversity information in European forests. We distinguish between stand and landscape level as both are important in forest management planning. Moreover, we account for different forest management categories, including unmanaged forests, managed forests, plantations, and silvopastoral systems. The review includes four sections:
(1)
Biodiversity indicators in European forest research
(2)
Integrating biodiversity indicators into forest management
(3)
Practical data collection
(4)
Literature gaps and implications with forest management planning

2. Materials and Methods

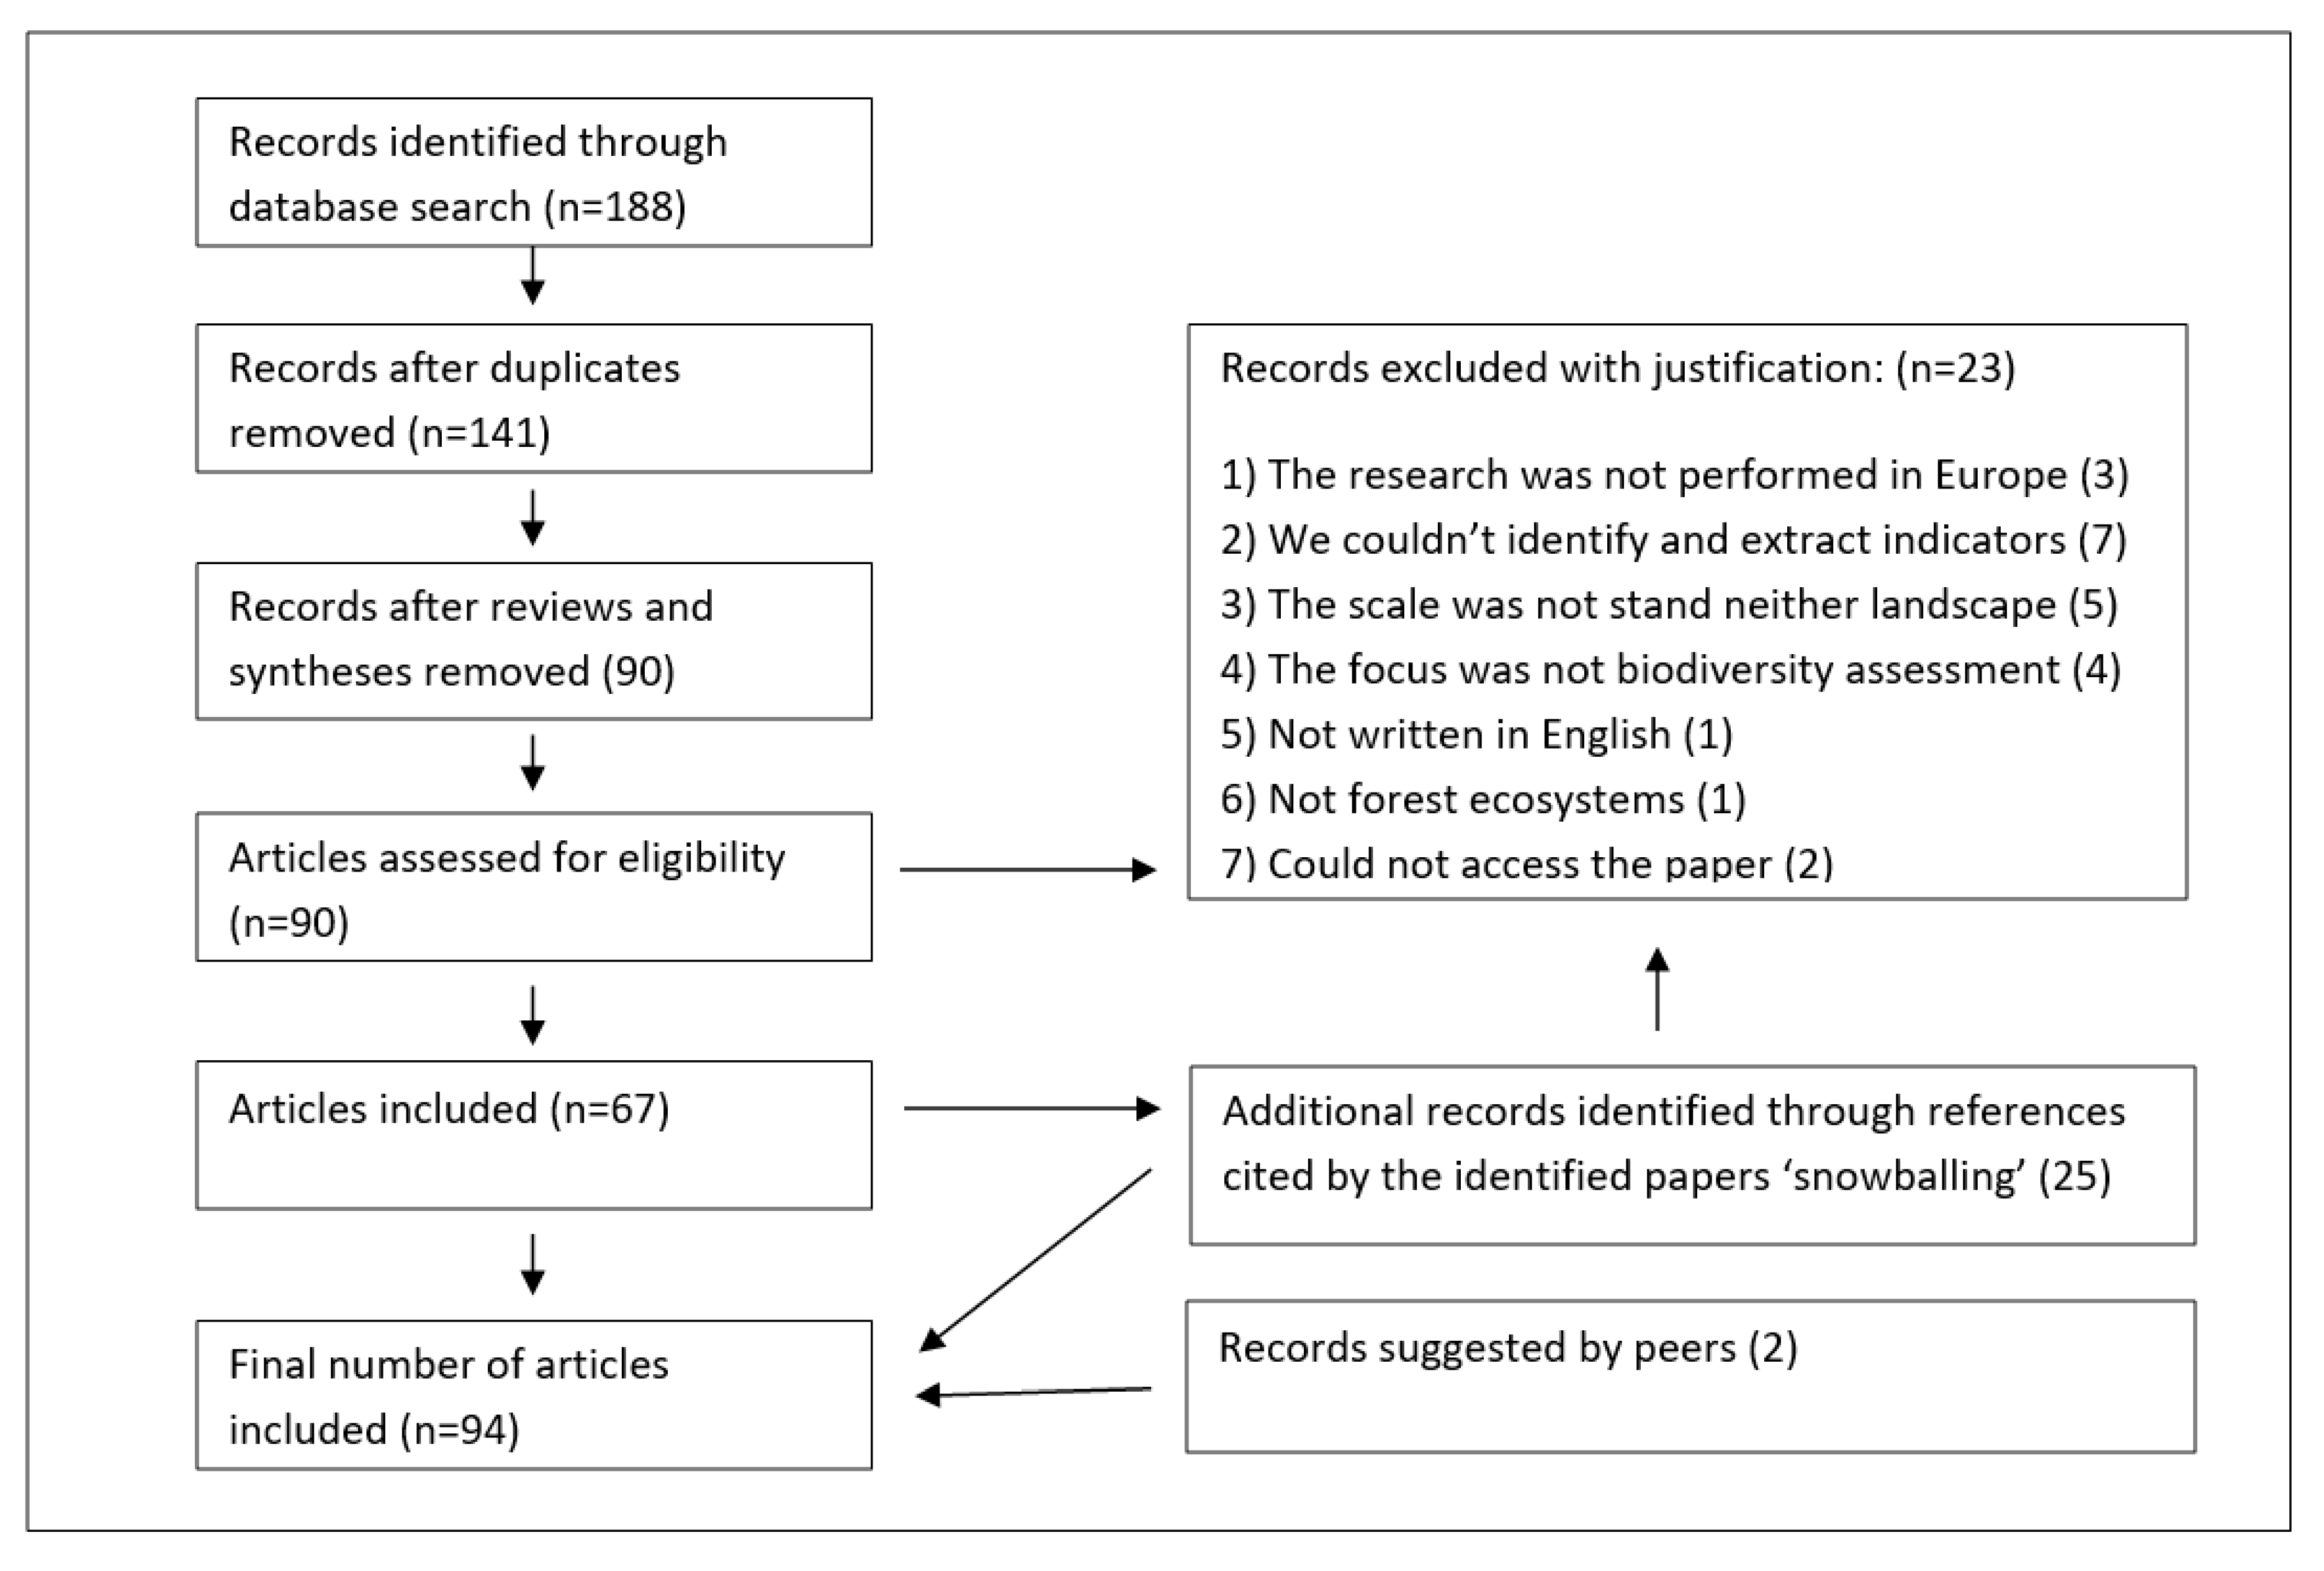
2.1. Literature Review

We searched for scientific papers on forest biodiversity indicators used in forest management planning in Europe. We followed the PRISMA (Preferred Reporting Items for Systematic reviews and Meta-Analyses) statement in designing our review protocol [34,35]. The cutoff date for the inclusion of publications was February 16th, 2020. We used three combinations of search terms in Google Scholar and Web of Science: forest AND management AND planning AND biodiversity AND indicators; “forest management planning” AND biodiversity AND indicators; “forest management planning” AND “biodiversity indicators”. The studies we found were published between 1990 and 2020. Additionally, we screened references cited by identified papers (‘snowballing’). We evaluated the relevance of each study based on title and abstract first, and if necessary, we read the introduction and methods of the remaining studies to determine whether to include it in our review.
The inclusion criteria for the literature were:
  • The research study was performed in Europe;
  • Published in a peer-reviewed scientific journal;
  • Written in English;
  • The scale of research was stand or/and landscape;
  • The focus was on forest biodiversity assessment;
  • Biodiversity indicators and methods for data collection were clearly reported and extractable.
We selected 188 papers for further investigation, from which 94 papers were finally analyzed for the review (Figure 1). More details on the search strategy and the selection of the papers are listed as supporting information in supplementary material in Table S1.

2.2. Data Extraction

From each study we extracted (a) the country/countries in which the study was conducted; (b) the type of biodiversity indicators (compositional, structural or functional); (c) the methods for data collection relevant for those indicators; (d) the scale at which the indicator was used; (e) type of forest where indicators were tested; (f) practicality of the indicator for management.

2.3. Evaluation of Practicality

We evaluated the practicality of biodiversity indicators and techniques for forest biodiversity data collection according to:
  • Cost-effectiveness, i.e., what were the costs per hectare in Euros? How much workforce is required?
  • Ease (simplicity) of application, i.e., are these indicators simple to use by forest managers with different backgrounds and can they identify the indicators (e.g., recognize the plant, animal species, or forest structural variables), and collect the data?
  • Time-effectiveness, i.e., what is the time required for data gathering and assessment?
Ecological meaningfulness is another important aspect of practical indicators (apart from cost-effectiveness, ease, and time-effectiveness). However, we did not assess it here as different indicators may have multiple impacts on ecosystem functioning and services outcomes. For instance, saproxylic beetles and other decomposers are important for nutrient cycling and thus the productivity of forests [36], whereas structural complexity provides niches for several species with different life traits and thus structurally complex ecosystems exhibit a high resilience towards environmental change [36,37,38,39].

3. Biodiversity Indicators in European Forest Research

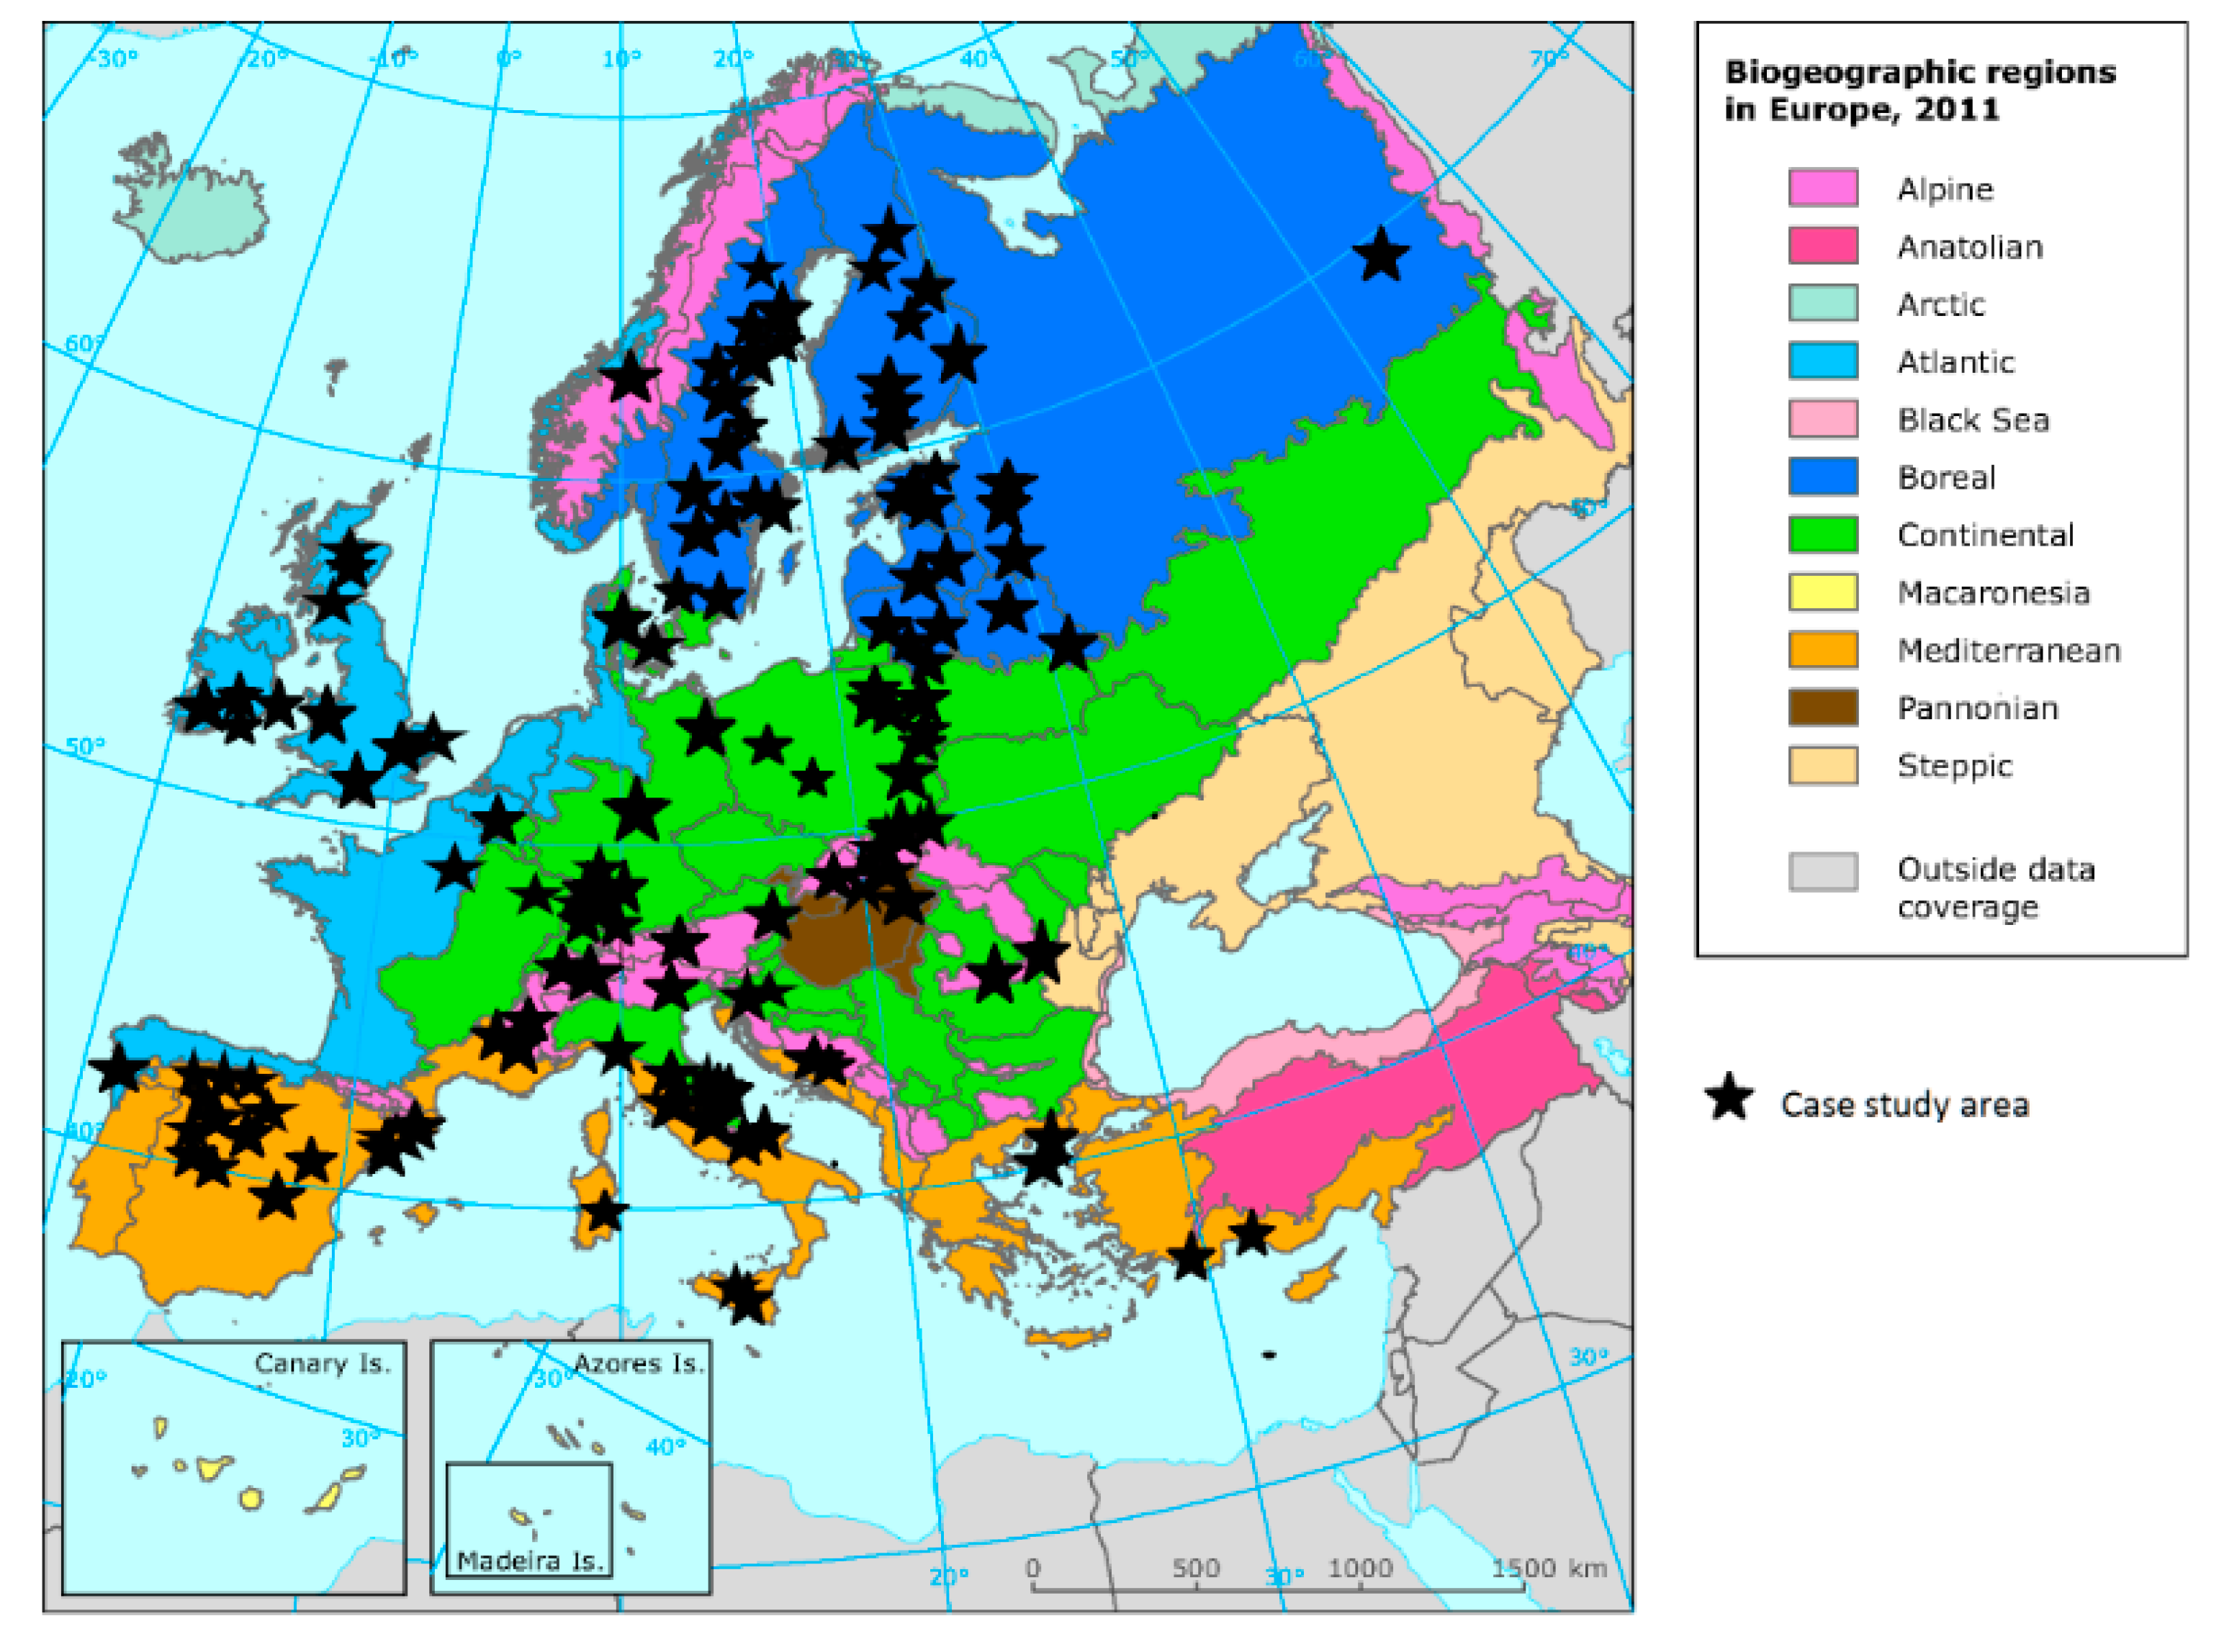
3.1. Geographic Distribution of Case Studies

The case studies were not evenly distributed across Europe. The majority of case studies were distributed around the Baltic Sea rim (Figure 2). The greatest number of case studies was from Italy (13 studies), Poland (12), Sweden (12), Germany (9), and Finland (8).
The practicality of forest biodiversity indicators and data collection methods was addressed in 57 studies (out of 94) (Figure 3). Out of the 57, 34 studies addressed practical data collection methods, 22 addressed practicality of indicators, and one addressed both. Six studies explicitly clearly stated that they have chosen indicators practical for forest managers or non-professionals and explained why [12,25,40,41,42,43].
We did not identify any studies in the first decade of the study period (Figure 4). In the second decade, all the studies we selected were addressing practicality, while in the third decade approximately 60% of studies did not address practicality.

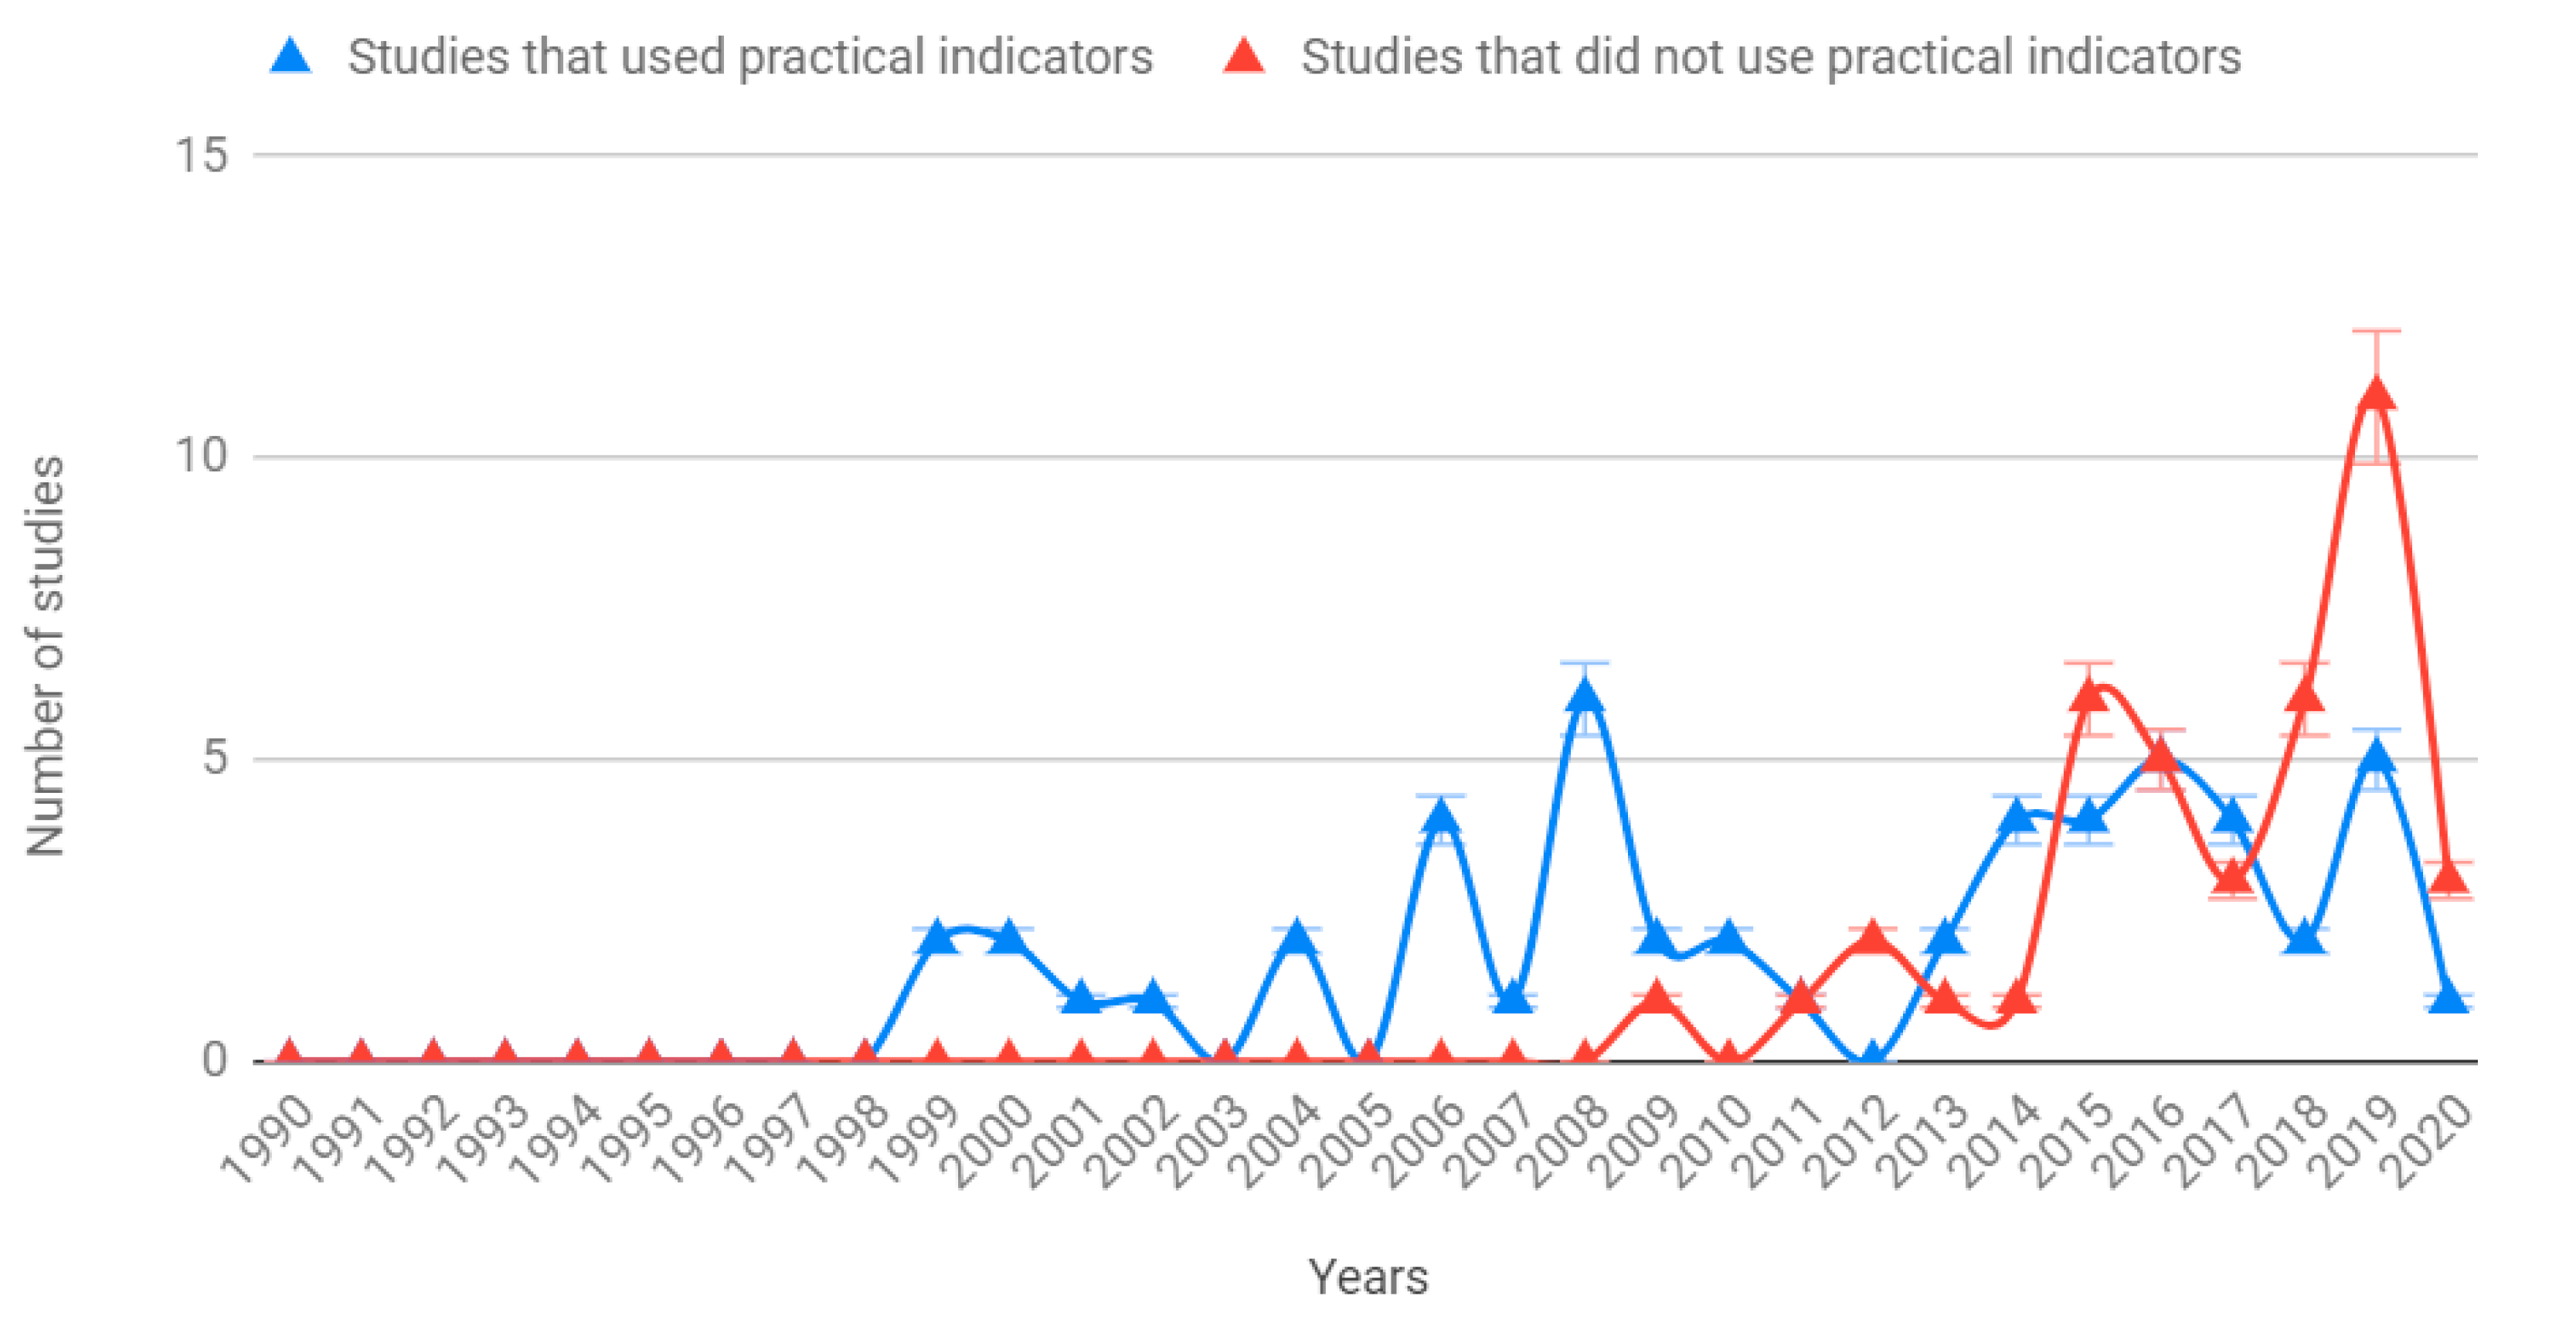
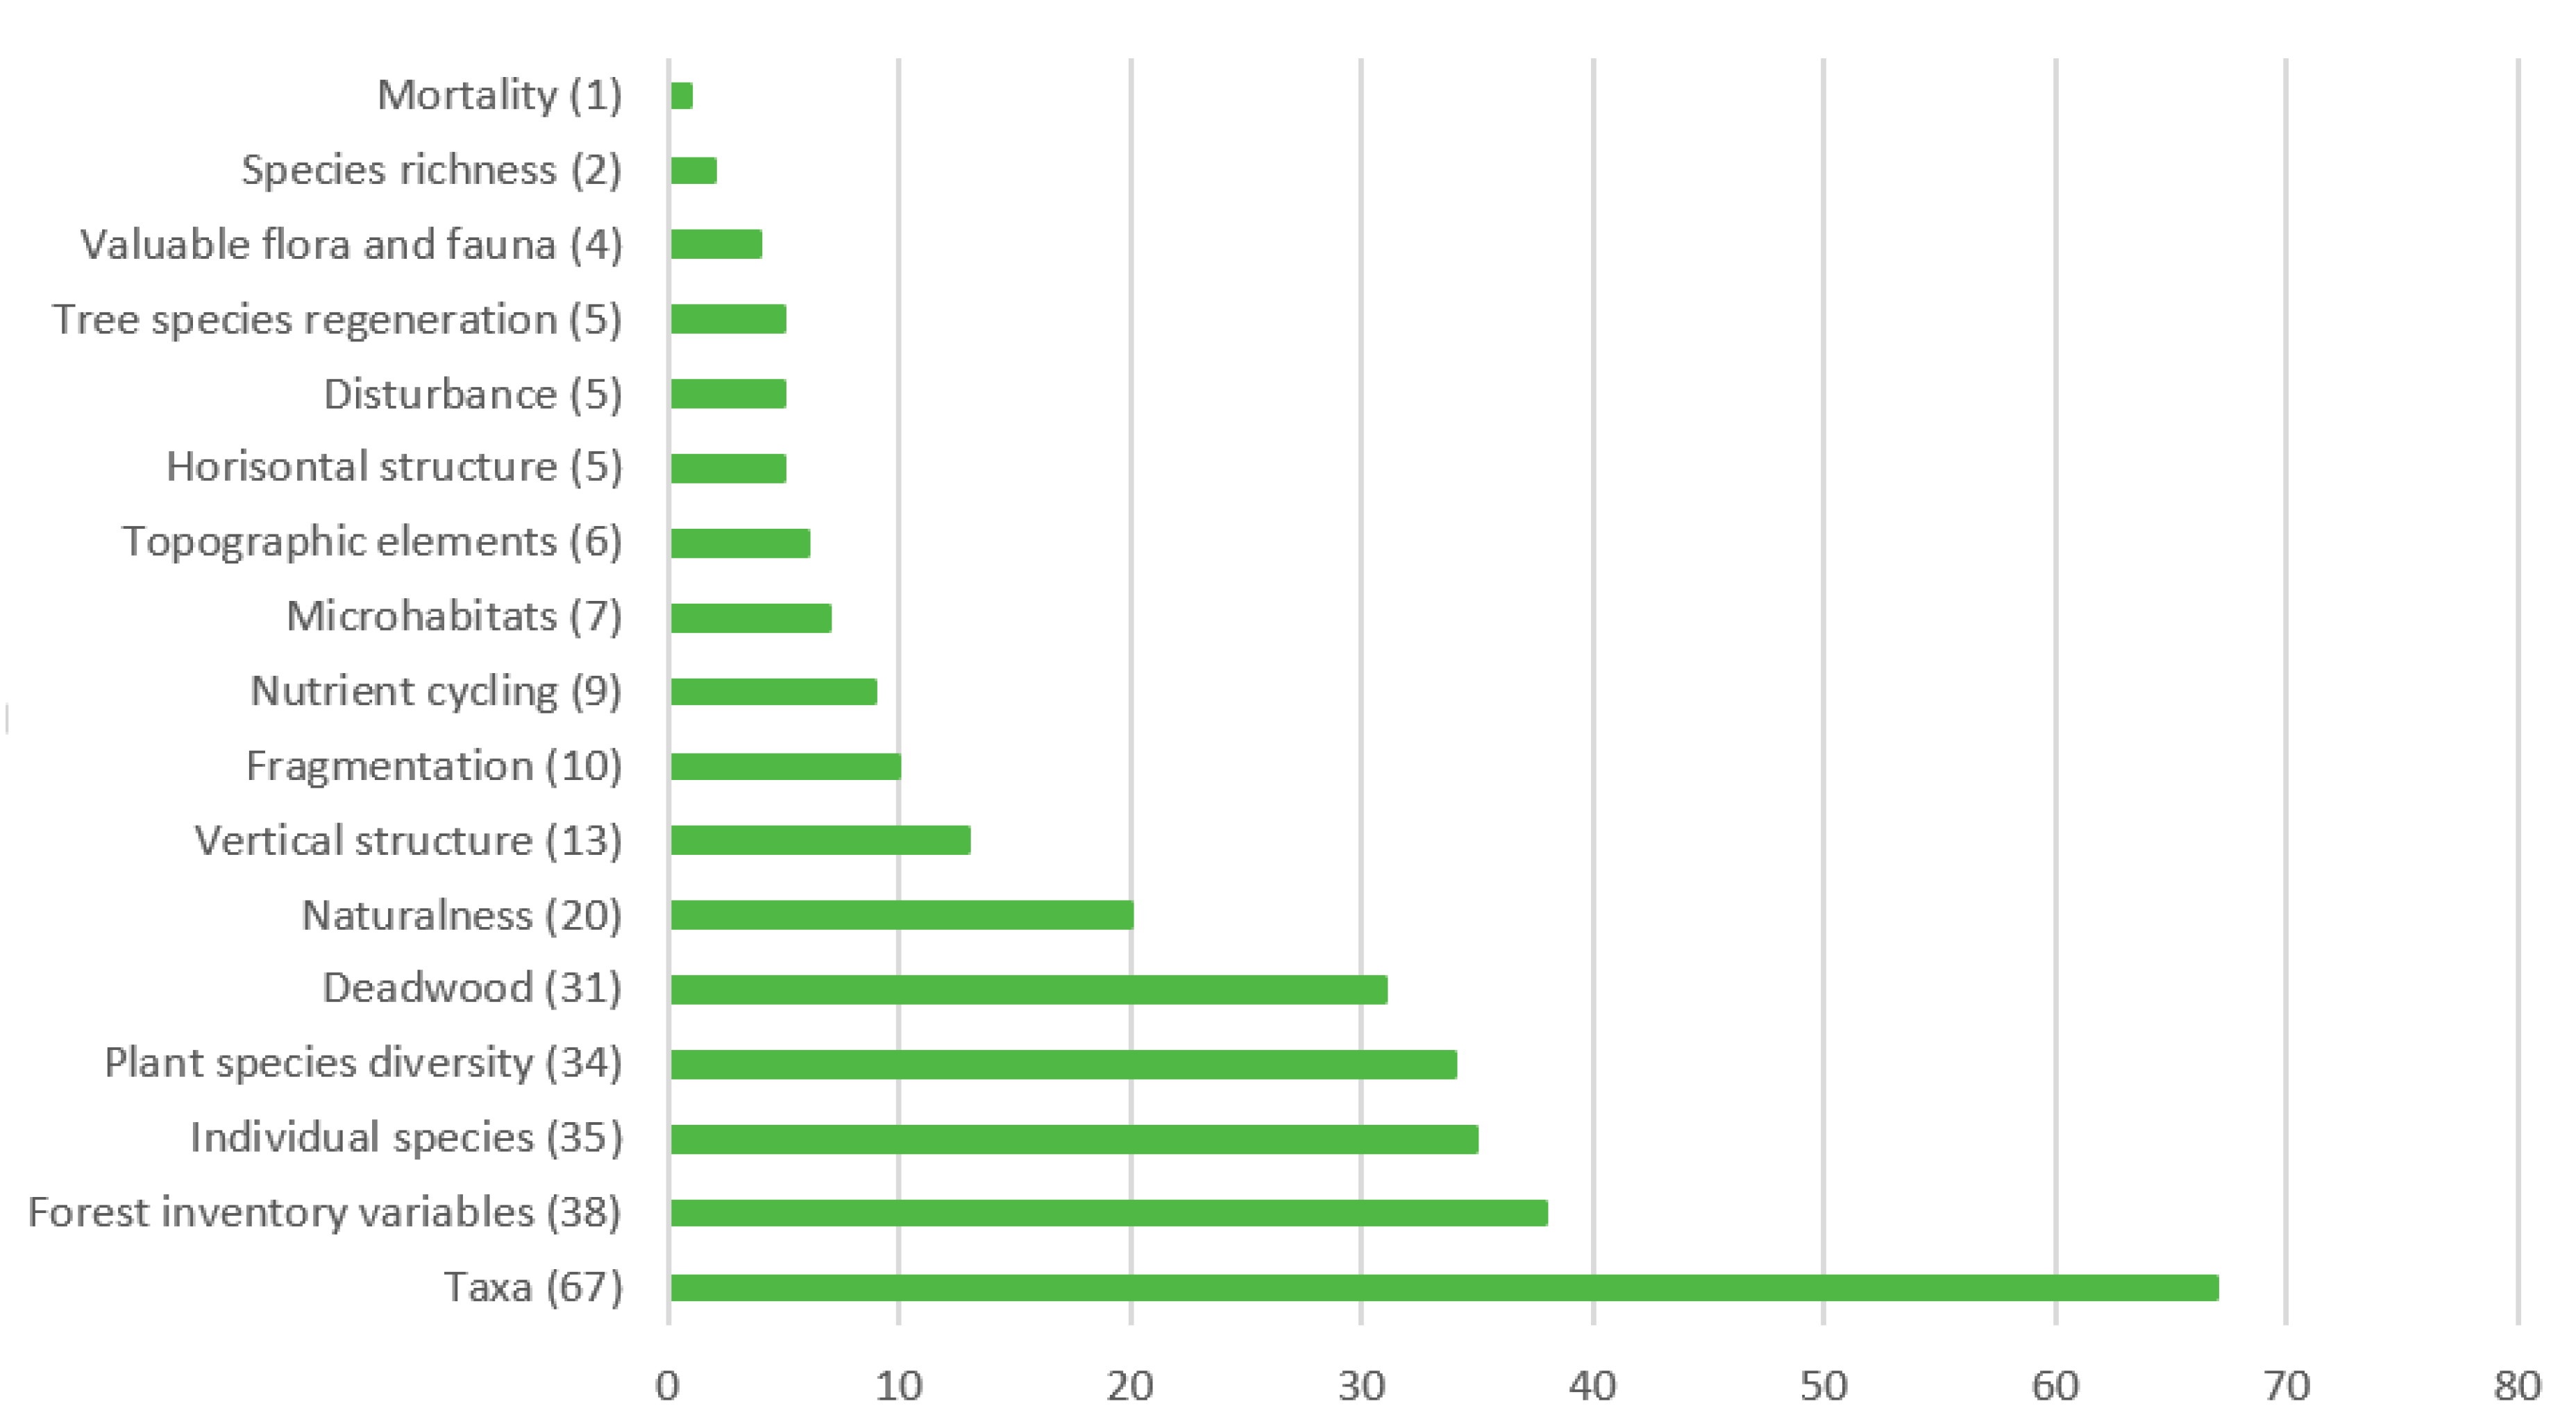
3.2. Forest Biodiversity Indicators Used in Studies

The most represented biodiversity attributes related to forest structure were forest inventory variables (Figure 5 and Table S2 in supporting material) and deadwood (DW). Regarding forest composition, taxa were the most represented where birds, bryophytes, and fungi dominated in the literature. Valuable flora and fauna were least covered. Generally, functional indicators (e.g., nitrogen, phosphorus, and other nutrients availabilities) were underrepresented in comparison to structural and compositional indicators. Studies were mainly addressing composition (39.6%), structure and composition (26.4%), structure (18.7%), structure, composition, and function (9.9%), structure and function (3.3%), composition and function (1.1%), and function (1.1%).
Regarding the scale, the studies at the stand scale were dominant (55.3%) over the studies at the landscape scale (31.9%) in the 94 articles revised. Additionally, there were studies addressing stand and landscape levels simultaneously (12.8%). The greatest number of studies at the stand scale addressed managed conifer forests (18), followed by managed broadleaved (16) and managed mixed forests (15). At the landscape scale, managed conifer forests dominate the number of studies (12), followed by broadleaved managed forests (10) and mixed managed forests (9). Managed forests are fairly covered at both scales. The least number of studies are on silvopastoral systems at stand (1) and landscape scales (1) and broadleaved plantations at both scales (one each). We found no studies covering mixed plantations at the stand and landscape scale. Some studies did not clearly state the scale of analysis (6.4%) as well as type of forest (e.g., managed, unmanaged, plantation) (11.7%) being addressed.

4. Integrating Biodiversity Indicators into Forest Management

Only four studies reported costs and time effectiveness of biodiversity assessment [12,40,41,44]. Most of the studies reported practicality of indicators if these are ‘easy to evaluate’ but frequently without explaining why precisely. Additionally, the definition of ‘easy to evaluate’ varied among studies, where some linked it with ease to recognize the species [25,45] and others with the efforts to collect the data [4,46]. It can be concluded that the definition is fuzzy. However, it is challenging to improve clarity as practical features are rarely strictly independent, but rather correlated (e.g., easy to evaluate saves time and money).

4.1. The Practicality of Forest Biodiversity Indicators

4.1.1. Forest Species Composition

Tree species composition is easy to use (Table 1) and data is available from national (NFI) and local forest inventories [4]. Some studies have revealed that plant species diversity is a good proxy for overall biodiversity [4,47,48,49]. However, there were also studies reporting that assessing understory plant species composition is impractical, albeit without explaining why [50,51,52]. Possibly, identifying herbaceous or even shrub plant species may require specific and additional training as that is required for identifying tree species [43,53]. Some authors found plant species diversity and particularly understory vegetation (Table 2) less useful since it is often not included in NFIs or is not collected in a standardized way across countries [4,54]. We also found some authors reported vascular plants as more cost-effective indicators than other taxa [55,56]. In contrast, other authors found vascular plants and lichens hard to recognize by non-specialists [57,58]. Angelstam and Dönz-Breuss [12], for example, conducted studies in Austria, Poland, Russia, Italy, and Scotland and found that pendulous lichen is not a practical indicator at large scales, due to variable frequency of occurrence. Additionally, fungi are costly and time-consuming for the assessment due to seasonal variation and demand for professional knowledge for identification [59]. Moreover, fungi’s fruiting bodies have a short life and are hard to detect [60,61]. Fungi monitoring typically requires many surveys within a year, but see Ambrosio et al. [61]. Nevertheless, species recognition by non-specialists may be possible in the future through molecular ecology method called DNA metabarcoding [62]. Barsoum et al. [62] applied this technique for assessing arthropod biodiversity and compared it with surrogate measures of biodiversity, with a high degree of correspondence.
Carabidae (ground beetles) that feed on arthropods can be used as indicators of arthropod diversity [52,69]. Carabidae may have many advantages as indicators such as wide distribution across a range of terrestrial habitats, ecologically and taxonomically are a well-known group, and relatively easy to capture by trapping techniques [46,70,71,72]. Syrphidae (hoverflies) have also been suggested as indicators of a diversity of habitat conditions [52]. However, invertebrate species are challenging to identify by non-specialists, and time-consuming and expensive to sample [25].
Birds are frequently reported as the most practical biodiversity indicators, namely at larger scales [25,57,58] and are particularly relevant to assess habitat fragmentation [73,74,75,76]. However, birds are more suitable indicators of habitat structure than habitat species composition [77], since its abundance and richness is mainly correlated with forest structure and less with tree species composition [78,79,80].
Habitat requirements of birds are most commonly reported in comparison to all other taxa [58,81] which makes birds more practical than other taxa [55,56]. Nevertheless, for this reason, birds are so frequently used as surrogates of biodiversity, and not due to their ‘unique intrinsic value’ as biodiversity indicators [73,82]. However, some authors find birds and other large vertebrates unsuitable as indicators for overall biodiversity, as these are ‘highly mobile generalists that lack established tolerance levels and correlations with ecosystem change’ [46,83].

4.1.2. Forest Structure

Deadwood is an easily observable and thus practical indicator [2,20,64]. Pesonen et al. [41] compared the efficiency of various methods for the data collection on deadwood in Central Finland. The assessment of one type of deadwood material on a 400 m2 area took on average 3.4 min, and the time required for the walk between plots was estimated at approximately 2 km h−1.
Vertical structural diversity is often analyzed in forest management planning, and thus it is well known to forest managers [20,50,51]. Canopy cover, stand age, and the proximity of old woodlands are easily recognizable by non-specialists, ecologically meaningful, and suitable for various types of forests [2]. Large trees are also used as biodiversity indicators in some studies [12,63]. Further, these attributes are typically easily extractable from NFIs [4].

4.1.3. Forest Ecosystem Functioning

Practical functional forest biodiversity indicators at the stand scale, reported in the literature, are stand age, thinning frequency, wet microhabitats, elevation, and available phosphorus [25]. Stand age and thinning frequency can be extracted from stand registers or NFIs. However, the authors did not explain why they selected phosphorus as a potential indicator and how practical it is to assess. Additionally, while it is understandable that stand age reflects tree growth, it is not clear what is the contribution of thinning frequency, wet microhabitats, and elevation for forest ecosystem functioning. Uprooting, wood-decaying bracket fungi and ungulate browsing were used as practical indicators in a study of [12]. The authors indicated that the first two indicators are found together in most cases. However, fungi demand professional knowledge for the identification and are time-consuming and costly to monitor [59], which decreases the feasibility of this indicator for decaying processes. The authors did not explain why they selected browsing as a biodiversity indicator and why it is practical to use it.

4.1.4. Indicator and Umbrella Species

As it is mostly impossible to measure all aspects of biodiversity in practice, indicator species are often used as proxies for biodiversity [84,85,86,87]. Woodpeckers (Dendrocopos sp.) were used as an indicator species for biodiversity aspects at the landscape scale such as naturalness [88] and avian diversity [65]. Suitability of woodpeckers as an indicator species lies in the fact that this species depends on critical forest resources that are rarely found in managed forests (e.g., deadwood, large trees) and therefore it is expected that other taxa of conservation value (also dependent on these resources) could be found within the area of a woodpecker as well [89]. Treecreepers (Certhia brachydactyla) were used as an indicator of the effect of fragmentation on habitat suitability and abundance of local species. Among invertebrates, hoverflies were applied as an indicator species of the role of open spaces in maintaining biodiversity [90]. However, some authors argue that indicators should embrace different species, with diverging mobility and habitat preferences [30,91,92,93]. Therefore, Vangansbeke et al. [93] used a group of indicator species: crested tit (Lophophanes cristatus), coal tit (Periparus ater), nightjar (Caprimulgus europaeus), and common lizard (Zootica vivipara) to estimate biodiversity at stand-scale. The results demonstrated a significant relationship between biodiversity and occurrence probability of these species, except for the common lizard.
A similar aspect to indicator species is umbrella species. Conservation of umbrella species contributes to an array of other species depending on the same resources [89,94,95]. Typically, capercaillie (Tetrao urogallus) is tested for this role and particularly for avian biodiversity in temperate forests [96] or forests with rich diversity [97]. However, indicator and umbrella species should be taken cautiously, and the relationship between the indicator and indicandum needs to be tested and validated rigorously before using them [87,98,99,100,101].

4.1.5. Correlation and Surrogacy

Testing a correlation between different biodiversity aspects and therefore estimating if one aspect can be used as a surrogate for another may facilitate biodiversity assessment. The most used surrogates for biodiversity are bird species richness, and micro-habitat diversity as these are easy to sample and to quantify [45]. Stand structure parameters, soil class, and plant species composition are reported as positively correlated in a study by Gao et al. [4]. Landscape structural metrics such are patch shape, proximity, texture (e.g., land cover classes), diversity, and size, proved good indicators of overall species richness, woody plants, orthopterans, and reptiles in a study by Schindler et al. [67]. For further information on the results of correlation used in studies, see supplementary materials, Table S3.
To decrease the odds of creating erroneous or biased surrogates of biodiversity, some authors suggested the use of several taxonomic groups, instead of a single taxon [62,102,103]. It is also important to note that using many highly correlated indices creates a problem with the interpretation of the results and does not provide new information [104,105].

5. Practical Data Collection

Data collection was the most time-consuming part of biodiversity assessment (ca 70% of the time), while planning (ca 9%), data management (ca 15%), and analysis (ca 6%), required less time in studies from Scotland, Austria, Poland, Italy, and Russia [12]. The study also found that daily workforce of 23–43 person-days was needed for biodiversity assessment, where 23 were required in the case studies with lowland areas and 43 with hilly areas. The number of person-days also depended on the complexity of forests, weather conditions, and accessibility [12].

5.1. Sampling Methods

Sampling is a practical method for data collection since only a sub-set of interest (e.g., trees) and their spatial relationship is measured if the area is large [106]. However, some sampling methods are more practical than others. Namely, line-intersect sampling for deadwood volume estimation is less time consuming than other sampling methods such as circular sample plots [107] or systematically distributed sample plots [65,108,109]. However, Fridman and Walheim [65] stressed that ‘the use of line intersect sampling would have caused problems with the determination of all variables needed for breaking down the DW-results on, e.g., stand age, forest type, and forest management operations performed’. Medium size plots (ca 25 m) proved to be more efficient than large plots (50 m) for deadwood volume estimation [41]. Further, Motz et al. [106] tested the efficiency of angle count and fix radius methods for tree diversity measures sampling. Fixed-radius plots were superior in measuring most indicators (e.g., stems per hectare and all spatially explicit diversity indices), and the effectiveness of this method increased with higher diameter variation. The results of this study refer to most representative Central European forests and apply to various scales.

5.2. National Forest Inventories (NFIs)

Using existing datasets, such as NFIs, saves time and money [4,68]. The data on forest structure from NFIs can be used for the development of ecological indicators for the assessment of valuable habitats and forest protection zones at the landscape level [68,110,111]. Martín-Queller et al. [66] used the data for gamma tree, and shrub species richness assessment in silvopastoral systems from the Third Spanish NFI (Table 3). Similarly, Torras and Saura [63] also used NFI data for the estimation of snags (stems/ha), large-diameter trees, shrub species abundance, shrub species richness, tree species richness, and tree species diversity in managed and unmanaged conifer, mixed, and broadleaved forests. However, the information related to the herb layer was not available in the NFI.
The data on deadwood is usually not adequately provided in NFIs such as in boreal countries [12]. Only recently, the information on lying and standing deadwood is starting to be included in forest inventories in some regions. Another challenge is the accuracy of information regarding the amount of deadwood, generated by severe disturbances [112]. Not all NFIs have the same standards for deadwood assessment, which creates the problem for comparison of the results from different inventories [65].

5.3. Flora and Fauna Atlases

The data on bird populations of some studies investigated here were from National Ornithological Society [114,116], or Museums of Natural History [68]. Further, a National Bird Atlas was a source of information on bird composition and occupancy in some studies [87,89]. Data on bird composition were obtained from the National Forest Research Institute [97], and gamekeepers register [115]. Studies collecting fauna data harnessed atlases and registers for bird data only, while no data of other animal species were obtained from such sources. Most of the authors used bird maps and atlases as a baseline for the comparison with their own data. We have not found any study using vegetation maps or registers to investigate the flora of forests.

5.4. Remote Sensing

Collecting forest biodiversity data by remote sensing technology was applied in numerous studies and is considered broad-scale, accurate, and more cost-effective and faster than field sampling [40,41,45,59,68,113,117,118,119]. Ozdemir et al. [45] used satellite images to predict bird species richness and micro-habitat diversity in brutian pine (Pinus brutia) forest ecosystems in Turkey. They reported this approach as ‘potentially’ more efficient (faster and cost-efficient) than field measurements. Thers et al. [59] used the 2014–2015 Danish national airborne Light Detection and Ranging (LiDAR) scanning survey (Danmarks Højdemodel, DHM/Punktsky) for assessing fungal species richness. The results showed that it is ‘promising that LiDAR-based variables hold information suitable for detecting major gradients in fungal richness and composition’. Müller and Brand [40] also used LiDAR to estimate habitat variables, to model activity, richness, and composition of assemblages of forest-dwelling beetles, and compare it to ground-based measurements. The results demonstrated that remote sensing provides more cost-effective data on biodiversity, even in mountain forests, in comparison to ground-based assessment.
Airborne LiDAR data is an accurate and feasible source of information on forest structure, such as height and biomass-related aspects, even on large and complex areas [113]. Pesonen et al. [41] found that the assessment of laying and standing deadwood by the airborne LiDAR is successful in conservation areas in Finland. However, regarding managed forest, this method can only be used as an auxiliary source, since the dynamics of deadwood in managed forests is quite different. Instead, using LiDAR data together with aerial photographs or stand-register data adds to deadwood sampling efficiency, even more than using only LiDAR data [41].
Some authors reported remote sensing as ‘potentially’ more efficient than field data collection [45,59], which leads to the conclusion that precise estimation of efficiency is lacking. However, Müller and Brand [40] provided a precise report on the costs of biodiversity assessment by remote sensing technology. They used LiDAR to estimate habitat variables, to model activity, richness, and composition of assemblages of forest-dwelling beetles, and compare it to ground-based measurements. The price for LiDAR assessment was 16 €/ha, the price for field data for habitat variables was 100€/ha and the price for data on beetles was 260€/ha. An additional advantage of LiDAR assessment is that costs decrease with the extent of the study area due to some fixed costs [40]. Given that costs of LiDAR variables are 5%–10% of ground-based measurement costs and that the proportion of explained variance compared with field measurement is high, remote sensing data has great potential in forest biodiversity modelling [40,120].

5.5. Camera Traps

Güthlin et al. [44] compared two techniques of field measurements for the estimation of red fox (Vulpes vulpes) abundance: camera traps and feces counting. The comparison took costs and precision into account. They divided costs into categories: initial costs, running costs for the equipment, travelling costs, and person-days. The total costs of feces counting were 17,057€, while camera traps cost 16,323 €. However, the precision of the camera traps was lower than the precision of the feces counts.

5.6. Smartphone Applications

A participatory GIS application for smartphones has been developed in Finland to collect the data on cultural, recreational, and biodiversity aspects from local people [43]. The application contains a component with information on forest management, ecology, and history of the area. In the second component, the visitors are asked to leave general feedback on landscape, infrastructure, or application functioning, and attach the photo. The third component is a game that is developed to attract more participants to share their opinion on the aesthetical and ecological state of the forest. In the game, the visitors are asked to answer the questions regarding structural and compositional biodiversity such as: should there be more trees; should there be bigger trees; should it be more open; should there be more tree species. No training or age limit is required, as long as the individual is capable of using a smartphone.
A similar smartphone application for forest biodiversity data collection was developed in Hungary to complement existing forest and conservation data with missing aspects such are canopy composition and structure, deadwood, herbs, microhabitats, disturbances, shrubs, and regeneration [42]. The advantage is that this method is simple, fast, and requires less effort than forest inventory. The method provides more detailed and reproducible information that is comparable with existing databases. It requires relatively low workforce per plot and has user-friendly direct database recording (no special equipment is required). The users do not need to be professionals; however, the training is necessary. The application was developed for low-mountain forests in Hungary; nevertheless, it could be modified for other forests.
Possible implications in regard to the use of applications for biodiversity data collection are in the structuring questions for the application users [43]. Hence, the more the questions are non-structured and open-ended, the harder it is for forest managers to analyze it further. Therefore, it would be optimal for forest managers to receive mainly straightforward numerical information. The advantage is that smartphone applications, as a technique, are very popular and will be unmistakably progressively used in the future [43]. Most of the forest stakeholders own a smartphone, which makes the use of it more amenable [43,121]. However, the stakeholders who tested the app in the study from Finland were secondary school students and teachers [43]. The study from Hungary presented the protocol and, thus there was no testing. Though, they stated that the app is intended for forest management and nature conservation purposes.

6. Literature Gaps and Implications for Forest Management Planning

Our review revealed a lack of studies on biodiversity indicators for the Atlantic region, particularly France. Eastern Europe is poorly represented, in particular Boreal, Continental, Steppic and Anatolian regions. In Central Europe, the case studies are mainly concentrated on the Alpine region, while Continental regions are missing. The research on biodiversity in Europe is still ‘heavily biased toward countries with high gross domestic product’ [122,123]. Additionally, there is a bias in case studies areas, where the studies from Central Europe repeatedly use the same study areas (e.g., the Black Forest, the Carpathians, the Alps).
Another problem our study identified here is an inconsistency in the definition of biodiversity. Many scientists have defined composition as biodiversity aspect, while, e.g., nutrient cycling or soil pH, they defined as environmental variables. Even though these interpretations are not erroneous, there is a problem with comparing the results from different studies that did not define biodiversity aspects equally. Even worse, the biodiversity definition is often missing in studies. Therefore, Feest [77,124] suggests the development of a common measure of biodiversity consisting of indices such are species richness, evenness, population, biomass, and conservation value, to facilitate biodiversity assessments. Additionally, species interactions should assemble the list of biodiversity aspects [124,125].
Most authors focused more on data collection practical methods and less on indicators themselves. There is a need to test and report more information on time and cost-efficiency and amenability of indicators. Though, it is clear that data collection is the most time-consuming part of biodiversity assessment [12]. Most of the studies focused on the response of biodiversity on some pressure and very few on measuring the state of biodiversity per se. In such way, the indicators are mainly indirect [77] and only reflect the changes in biodiversity response to certain pressure over time.
We found that plant species diversity is often used as a surrogate for overall biodiversity [4,47,48,49]. However, herb species may be particularly hard to identify by non-specialists [57,58]. Data collection is expensive and mostly unavailable from NFIs [4]. Therefore, future research needs to focus on resolving which plant species or taxonomic groups may be easier to identify by non-specialists and from such species assess those working better as biodiversity indicators. Additionally, DNA metabarcoding is an innovative method for species recognizing and seems promising for non-specialist use [62]. Combining this method with smartphone applications for species identification, that are lately progressively developed, would be a more cost-efficient way for overcoming taxonomic impediment then investing in taxonomic training.
Further, we found only one study that reported functional indicators at the landscape scale, and in general, a few studies reported compositional biodiversity at the landscape scale. The practicality of landscape biodiversity indicators needs to be addressed in future research, particularly functional indicators which seems to be underrepresented and rarely estimated in European research studies. Since there are only a few studies that used functional biodiversity indicators, there is not enough evidence to discuss the practicality of this category of indicators. We assume that underlying reason is the fact that functional indicators are very complex and require expensive laboratory equipment for the assessment. No studies included nitrogen deposition as an indicator, even though that Nitrogen Critical Load Exceedance (NCLE) was projected to have greater consequences to European biodiversity than global change [77,124,126,127,128,129]. For instance, nitrogen deposition could create new interconnections between lichens and forest stand properties [130,131].
With a view on data collection, more research and investment into modern technologies (LiDAR and smartphone apps) is needed to improve the accuracy and applicability. Overall, future research should integrate forest structure, tree species composition, and ecosystem functionality to provide broader knowledge on habitat assessment and modelling [113].

7. Conclusions

Vascular plants and generally herb layer, fungi, bryophyte, lichens, and invertebrates are mostly reported as impractical biodiversity indicators as their identification is challenging for non-professionals, and the data is mainly unavailable in NFIs. This is problematic since plant species diversity is a key indicator of overall biodiversity [4,47,48,49,63]. Structural variables (e.g., old stands, large trees, and canopy cover) at stand scale [2,4,12,25] are easily observable by non-professionals and are available in NFIs, which makes them practical. Deadwood is easily observable at stand [2,20,63] and landscape scales [67,132,133], but often unavailable in NFIs. Generally, stand-level biodiversity indicators are more practical for forest managers than landscape-level indicators, because forest management is primarily acting on stand scale [25,134]. Even though there is great relevance in maintaining biodiversity in production forest stands [135], landscape level is also important and requires more attention in future research. Additionally, functional indicators are not sufficiently reported in the literature, and, thus, there is not enough evidence to discuss their practicality. Using the results from correlations and surrogacy relationships between indicators is a straightforward way to decrease the time and expenses for biodiversity assessments. However, surrogacy relationships can be spurious and must be tested under multifarious conditions [87,98,99,100,101].
Choosing the right sampling method and the right size of a plot can also contribute to efficient biodiversity assessments [41]. NFIs are a good source of data on indicators such as tree and shrub species diversity, and stand age [2,63,66]. Bird registers and atlases can be very useful and are mainly used as a baseline in bird biodiversity research. Remote sensing technique for data collection is more cost-effective and faster than field one at both stand and landscape scales, though more research is needed to provide a precise estimation of biodiversity. Another advantage is that remotely sensed data is easier to update in comparison to traditional ways of collecting data, which simplifies monitoring and reduces costs [123]. Smartphone applications are promising tools for biodiversity assessment by non-professionals, but future research needs to focus on increasing their accuracy for the assessment on all levels of biodiversity, at different scales and ecological conditions. A more accurate and precise estimation of biodiversity will help scientists and practitioners to design biodiversity-oriented management plans that ultimately increase the adaptive capacity of forests towards future environmental changes. Additionally, it will facilitate testing policy goal implementation and clarify setting new policy targets in biodiversity conservation.

Supplementary Materials

The following are available online at https://www.mdpi.com/1999-4907/11/3/343/s1, Table S1: Search strategy table; list of papers included in review/lists of papers excluded from the review; Table S2: Biodiversity attributes and indicators used in the literature sorted by type of biodiversity (structure, composition, function): Table S3: Correlations; File S1: Definitions.

Author Contributions

M.Ć. carried out all the reference searches and wrote the manuscript. Conceptualization, M.Ć. M.N.B, J.G.B.; methodology, M.Ć.; formal analysis, M.Ć.; writing—original draft preparation, M.Ć.; writing—review and editing, M.Ć, M.N.B, D.T., J.G.B; supervision, M.N.B., J.G.B., D.T.; project administration, J.G.B.; funding acquisition M.N.B, J.G.B.; All authors have read and agreed to the published version of the manuscript.

Funding

This research was funded by Fundação para a Ciência e a Tecnologia (FCT) Portugal, under a grant number [PD/BD/114076/2015] and Principal Investigator contract to MNB (IF 1171/2014); BIOECOSYS project “Forest ecosystem management decision-making methods an integrated bio-economic approach to sustainability” [PTDC/ASP-SIL/30391/2017] and Forest Research Centre a research unit funded by Fundação para a Ciência e a Tecnologia I.P. (FCT), Portugal [UIDB/00239/2020]; CERTFOR project “Effects of forest certification on the conservation of cork oak woodlands” [PTDC/ASP-SIL/31253/2017] and Centre for Applied Ecology “Prof. Baeta Neves” (CEABN-InBIO) research unit funded FEDER funds through the Operational Programme for Competitiveness Factors—COMPETE and by National Funds through FCT under the [UID/BIA/50027/2013] and POCI-01-0145-FEDER-006821.

Acknowledgments

We thank Ivana Živojinović and anonymous reviewers for very useful comments that considerably improved previous versions of the manuscript.

Conflicts of Interest

The authors declare no conflict of interest.

References

  1. Kapos, V.; Iremonger, S. Achieving global and regional perspectives on forest biodiversity and conservation. In Assessment of Biodiversity for Improved Forest Planning; Bachman, P., Kohl, M., Paivinen, R., Eds.; Springer: Dordrecht, The Netherlands, 1998; pp. 3–14. [Google Scholar]
  2. Coote, L.; Dietzsch, A.C.; Wilson, M.W.; Graham, C.T.; Fuller, L.; Walsh, A.T.; Irwin, S.; Kelly, D.L.; Mitchell, F.J.; Kelly, T.C.; et al. Testing indicators of biodiversity for plantation forests. Ecol. Ind. 2013, 32, 107–115. [Google Scholar] [CrossRef]
  3. Ozanne, C.H.P.; Anhuf, D.; Boulter, S.L.; Keller, M.; Kitching, R.L.; Körner, C.; Meinzer, F.C.; Mitchell, A.W.; Nakashizuka, T.; Silva Dias, P.L.; et al. Biodiversity meets the atmosphere: a global view of forest canopies. Science 2003, 301, 183–186. [Google Scholar] [CrossRef] [PubMed] [Green Version]
  4. Gao, T.; Hedblom, M.; Emilsson, T.; Nielsen, A.B. The role of forest stand structure as biodiversity indicator. For. Ecol. Manage. 2014, 330, 82–93. [Google Scholar] [CrossRef]
  5. CBD, Convention on Biological Diversity 2000. Available online: https://www.cbd.int/convention/guide/?id=web (accessed on 28 January 2020).
  6. Hunter, M.L., Jr. Wildlife, forests, and forestry: Principles of managing forests for biological Diversity; Prentice-Hall: Englewood Cliffs, NJ, USA, 1990; p. 370. [Google Scholar]
  7. Winter, S.; McRoberts, R.E.; Bertini, R.; Chirici, G.; Bastrup-Birk, A.; Rondeux, J.; Brändli, U.B.; Marchetti, M. The Need for Harmonized Estimates of Forest biodiversity Indicators. In National Forest Inventories: Contributions to Forest Biodiversity Assessments; Springer: Dordrecht, The Netherlands, 2011. [Google Scholar]
  8. FAO. The State of World’s Forests. 2018. Available online: http://www.fao.org/state-of-forests/en/ (accessed on 27 July 2019).
  9. Forest Europe. State of Europe’s forests 2015. In Proceedings of the Ministerial Conference on the Protection of Forests in Europe, Madrid, Spain, 20–1 October 2015. [Google Scholar]
  10. Peterken, G. Natural Woodland: Ecology and Conservation in Northern Temperate Regions; Cambridge University Press: Cambridge, UK, 1996. [Google Scholar]
  11. Anonymous. Decision No 1600/2002/EC of the European parliament and of the council of 22 July 2002 laying down the Sixth Community Environment Action Programme. Off. J. Eur. Communities 2002, 10. [Google Scholar]
  12. Angelstam, P.; Dönz-Breuss, M. Measuring Forest Biodiversity at the Stand Scale: An Evaluation of Indicators in European Forest History Gradients. Ecol. Bull. 2004, 51, 305–332. [Google Scholar]
  13. Leadley, P.; Pereira, H.M.; Alkemade, R.; Fernandez-Manjarres, J.F.; Proenca, V.; Scharlemann, J.P.W.; Walpole, M.J. Biodiversity scenarios: projections of 21st century change in biodiversity and associated ecosystem services. Tech. Ser. 50 2010, 132. [Google Scholar]
  14. Bellard, C.; Bertelsmeier, C.; Leadley, P.; Thuiller, W.; Courchamp, F. Impacts of climate change on the future of biodiversity. Ecol. Lett. 2012, 15.4, 365–377. [Google Scholar] [CrossRef] [Green Version]
  15. MEA-Millennium Ecosystem Assessment. 2005. Available online: https://millenniumassessment.org/en/Framework.html (accessed on 1 May 2019).
  16. Proença, V.M.; Pereira, H.M.; Guilherme, J.; Vicente, J. Plant and bird diversity in natural forests and in native and exotic plantations in NW Portugal. Acta Oecol. 2010, 36, 219–226. [Google Scholar] [CrossRef]
  17. Anonymous. Criteria and Indicators for the Conservation and Sustainable Management of Temperate and Boreal Forests; The Montreal process; Canadian Forest Service: Quebec, Canada, 1995.
  18. Ferris-Kaan, R.; Peace, A.J.; Humphrey, J.W. Assessing structural diversity in managed forests. In Assessment of Biodiversity for Improved Forest Planning. European Forest Institute Proceedings No. 18; Bachmann, P., Kohl, M., Paivinen, R., Eds.; Springer: Dordrecht, The Netherlands, 1998; pp. 331–342. [Google Scholar]
  19. Heywood, V.H.; Baste, I. Introduction. In Global Biodiversity Assessment. United Nations Environment Programme; Heywood, V.H., Ed.; Cambridge University Press: Cambridge, UK, 1995; pp. 1–2. [Google Scholar]
  20. Ferris, R.; Peace, A.J.; Newton, A.C. Macrofungal communities of lowland Scots pine (Pinus sylvestris L.) and Norway spruce (Picea abies (L.) Karsten.) plantations in England: relationships with site factors and stand structure. For. Ecol. Manage. 2000, 131, 255–267. [Google Scholar] [CrossRef]
  21. Noss, R.F. Indicators for monitoring biodiversity: A hierarchical approach. Conserv. Biol. 1990, 4, 355–364. [Google Scholar] [CrossRef]
  22. Morelli, F. Indicator species for avian biodiversity hotspots: Combination of specialists and generalists is necessary in less natural environments. J. Nat. Cons. 2015, 27, 54–62. [Google Scholar] [CrossRef]
  23. Boutin, S.; Haughland, D.L.; Schieck, J.; Herbers, J.; Bayne, E. A new approach to forest biodiversity monitoring in Canada. For. Ecol. Manage. 2009, 258, S168–S175. [Google Scholar] [CrossRef]
  24. Ferris, R.; Humphrey, J.W. A review of potential biodiversity indicators for application in British forests. Forestry 1999, 72, 313–328. [Google Scholar] [CrossRef]
  25. Smith, G.F.; Gittings, T.; Wilson, M.; French, L.; Oxbrough, A.; O’Donoghue, S.; Iremonger, S. Identifying practical indicators of biodiversity for stand-level management of plantation forests. Biodiv. Cons. 2008, 17, 991–1015. [Google Scholar] [CrossRef]
  26. Noss, R.F. Assessing and monitoring forest biodiversity: A suggested framework and indicators. For. Ecol. Manage. 1999, 115, 135–146. [Google Scholar] [CrossRef]
  27. Lindenmayer, D.B.; Margules, C.R.; Botkin, D.B. Indicators of biodiversity for ecologically sustainable forest management. Cons. Bio. 2000, 14, 941–950. [Google Scholar] [CrossRef]
  28. Failing, L.; Gregory, R. Ten common mistakes in designing biodiversity indicators for forest policy. J. Environ. Manage. 2003, 68, 121–132. [Google Scholar] [CrossRef] [Green Version]
  29. Whitman, A.A.; Hagan, J.M. Final Report to the National Commission on Science For sustainable Forestry: Biodiversity Indicators for Sustainable Forestry; National Center for Science and the Environment: Washington, DC, USA, 2003; 48p. [Google Scholar]
  30. Heink, U.; Kowarik, I. What are indicators? On the definition of indicators in ecology and environmental planning. Ecol. Ind. 2010, 10, 584–593. [Google Scholar] [CrossRef]
  31. Gao, T.; Nielsen, A.B.; Hedblom, M. Reviewing the strength of evidence of biodiversity indicators for forest ecosystems in Europe. Ecol. Ind. 2015, 57, 420–434. [Google Scholar] [CrossRef]
  32. Ezquerro, M.; Pardos, M.; Diaz-Balteiro, L. Operational research techniques used for addressing biodiversity objectives into forest management: an overview. Forests 2016, 7, 229. [Google Scholar] [CrossRef] [Green Version]
  33. Lexer, M.J.; Lexer, W.; Hasenauer, H. The use of forest models for biodiversity assessment at the stand level. For. Syst. 2000, 9, 297–316. [Google Scholar]
  34. Moher, D.; Liberati, A.; Tetzlaff, J.; Altman, D.G. The PRISMA Group. Preferred Reporting Items for Systematic Reviews and Meta-Analyses: The PRISMA Statement. PLoS Med. 2009, 6, e1000097. [Google Scholar] [CrossRef] [PubMed] [Green Version]
  35. Xiao, Y.; Watson, M. Guidance on Conducting a Systematic Literature Review. J. Plann. Edu. Rese. 2017, 39, 1–20. [Google Scholar] [CrossRef]
  36. Parisi, F.; Pioli, S.; Lombardi, F.; Fravolini, G.; Marchetti, M.; Tognetti, R. Linking deadwood traits with saproxylic invertebrates and fungi in European forests—A review. iForest 2018, 11, 423–436. [Google Scholar] [CrossRef] [Green Version]
  37. Winter, S.; Fischer, H.S.; Fischer, A. Relative quantitative reference approach for naturalness assessments of forests. For. Ecol. Manage. 2010, 259, 1624–1632. [Google Scholar] [CrossRef]
  38. Bani, A.; Pioli, S.; Ventura, M.; Panzacchi, P.; Borruso, L.; Tognetti, R.; Tonon, G.; Brusetti, L. The role of microbial community in the decomposition of leaf litter and deadwood. Appl. Soil Ecol. 2018, 126, 75–84. [Google Scholar] [CrossRef]
  39. Parisi, F.; Di Febbraro, M.; Lombardi, F.; Biscaccianti, A.B.; Campanaro, A.; Tognetti, R.; Marchetti, M. Relationships between stand structural attributes and saproxylic beetle abundance in a Mediterranean broadleaved mixed forest. For. Ecol. Manage. 2019, 432, 957–966. [Google Scholar] [CrossRef]
  40. Müller, M.; Brand, R. Assessing biodiversity by remote sensing in mountainous terrain: The potential of LiDAR to predict forest beetle assemblages. J. Appli. Ecol. 2009, 46, 897–905. [Google Scholar] [CrossRef]
  41. Pesonen, A.; Kangas, A.; Maltamo, M.; Packalen, P. Effects of auxiliary data source and inventory unit size on the efficiency of sample-based coarse woody debris inventory. For. Ecol. Manage. 2010, 259, 1890–1899. [Google Scholar] [CrossRef]
  42. Standovár, T.; Szmorad, F.; Kovács, B.; Kelemen, K.; Plattner, M.; Roth, T.; Pataki, Z. A novel forest state assessment methodology to support conservation and forest management planning. Commun. Ecol. 2016, 17, 167–177. [Google Scholar] [CrossRef] [Green Version]
  43. Kangas, A.; Rasinmäk, J.; Eyvindson, K.; Chambers, P. A Mobile Phone Application for the Collection of Opinion Data for Forest Planning Purposes. Envir. Manage. 2015, 55, 961–971. [Google Scholar] [CrossRef] [PubMed]
  44. Güthlin, D.; Storch, I.; Küchenhoff, H. Toward Reliable Estimates of Abundance: Comparing Index Methods to Assess the Abundance of a Mammalian Predator. PLoS ONE 2014, 9, e94537. [Google Scholar] [CrossRef] [PubMed]
  45. Ozdemir, I.; Mert, A.; Ozkan, U.Y.; Aksan, S.; Unal, Y. Predicting bird species richness and micro-habitat diversity using satellite data. For. Ecol. Manage. 2018, 424, 483–493. [Google Scholar] [CrossRef]
  46. Mullen, K.; O’Halloran, J.; Breen, J.; Giller, P.; Pithon, J.; Kelly, T. Distribution and composition of carabid beetle (Coleoptera, Carabidae) communities across the plantation forest cycle—Implications for management. For. Ecol. Manage. 2008, 256, 624–632. [Google Scholar] [CrossRef]
  47. Simonson, S.E.; Opler, P.A.; Stohlgren, T.J.; Chong, G.W. Rapid assessment of butterfly diversity in a montane landscape. Biodiv. Conserv. 2001, 10, 1369–1386. [Google Scholar] [CrossRef]
  48. Sauberer, N.; Zulka, K.P.; Abensperg-Traun, M.; Berg, H.M.; Bieringer, G.; Milasowszky, N.; Moser, D.; Plutzar, C.; Pollheimer, M.; Storch, C.; et al. Surrogate taxa for biodiversity in agricultural landscapes of eastern Austria. Biol. Conserv. 2004, 117, 181–190. [Google Scholar] [CrossRef]
  49. Bräuniger, C.; Knapp, S.; Kühn, I.; Klotz, S. Testing taxonomic and landscape surrogates for biodiversity in an urban setting. Landsc. Urban Plan. 2010, 97, 283–295. [Google Scholar] [CrossRef]
  50. Ratcliffe, P.R. Biodiversity in Britain’s Forests; Forestry Authority: Edinburgh, Scotland, 1993.
  51. Arsenault, A.; Bradfield, G.E. Structural-compositional variation in three age-classes of temperate rainforests in southern coastal British Columbia. Can. J. Bot. 1995, 73, 54–64. [Google Scholar] [CrossRef]
  52. Humphrey, J.W.; Hawes, C.; Peace, A.J. Relationships between insect diversity and habitat characteristics in plantation forests. For. Ecol. Manage. 1999, 113, 11–21. [Google Scholar] [CrossRef]
  53. Michel, A.K.; Winter, S. Tree microhabitat structures as indicators of biodiversity in Douglas-fir forests of different stand ages and management histories in the Pacific Northwest. USA. For. Ecol. Manage. 2009, 257, 1453–1464. [Google Scholar] [CrossRef]
  54. Chirici, G.; McRoberts, R.E.; Winter, S.; Bertini, R.; Brändli, U.B.; Asensio, I.A.; Bastrup-Birk, A.; Rondeux, J.; Barsoum, N.; Marchetti, M. National forest inventory contributions to forest biodiversity monitoring. For. Sci. 2012, 58, 257–268. [Google Scholar] [CrossRef] [Green Version]
  55. Juutinen, A.; Mönkkönen, M. Testing alternative indicators for biodiversity conservation in old-growth boreal forests: ecology and economics. Ecol. Econom. 2004, 50, 35–48. [Google Scholar] [CrossRef]
  56. Thingstad, P.G.; Daverdin, M.; Speed, J.D.M. Modelling Capercaillie Tetrao urogallus lek sites distribution and their limiting factors in a central Norwegian managed forest landscape. Ornis Norv. 2018, 41, 1–12. [Google Scholar] [CrossRef]
  57. Uliczka, H.; Angelstam, P.; Roberge, J.M. Indicator species and biodiversity monitoring systems for non-industrial private forest owners: is there a communication problem? Ecol. Bull. 2004, 51, 379–384. [Google Scholar]
  58. Naumov, V.; Manton, M.; Elbakidze, M.; Rendenieks, Z.; Priednieks, J.; Uhlianets, S.; Angelstam, P. How to reconcile wood production and biodiversity conservation? The Pan-European boreal forest history gradient as an “experiment”. J. Envir. Manage. 2018, 218, 1–13. [Google Scholar] [CrossRef]
  59. Thers, H.; Brunbjerg, A.K.; Læssøe, T.; Ejrnæs, R.; Bøcher, P.K.; Svenning, J.C. Lidar-derived variables as a proxy for fungal species richness and composition in temperate Northern Europe. Rem. Sens. Envir. 2017, 200, 102–113. [Google Scholar] [CrossRef]
  60. Kirk, P.M.; Cannon, P.F.; Minter, D.W.; Stalpers, J.A. Dictionary of the Fungi, 10th ed.; CAB Internation Wallingford: Wallingford, UK, 2008; p. 771. [Google Scholar]
  61. Ambrosio, E.; Mariotti, M.G.; Zotti, M.; Cecchi, G.; Di Piazza, S.; Feest, A. Measuring macrofungal biodiversity quality using two different survey approaches: A case study in broadleaf Mediterranean forests. Ecol. Ind. 2018, 85, 1210–1230. [Google Scholar] [CrossRef]
  62. Barsoum, N.; Bruce, C.; Forster, J.; Ji, Y.Q.; Yu, D.W. The devil is in the detail: Metabarcoding of arthropods provides a sensitive measure of biodiversity response to forest stand composition compared with surrogate measures of biodiversity. Ecol. Ind. 2019, 101, 313–323. [Google Scholar] [CrossRef]
  63. Torras, O.; Saura, S. Effects of silvicultural treatments on forest biodiversity indicators in the Mediterranean. For. Ecol. Manage. 2008, 255, 3322–3330. [Google Scholar] [CrossRef]
  64. Hodge, S.J.; Peterken, G.F. Deadwood in British forests: priorities and a strategy. Forestry 1998, 71, 99–112. [Google Scholar] [CrossRef] [Green Version]
  65. Fridman, J.; Walheim, M. Amount, structure, and dynamics of dead wood on managed forestland in Sweden. For. Ecol. Manage. 2000, 131, 23–36. [Google Scholar] [CrossRef]
  66. Martín-Queller, E.; Gil-Tena, A.; Saura, S. Species richness of woody plants in the landscapes of Central Spain: the role of management disturbances, environment and non-stationarity. J. Veg. Sci. 2011, 2, 238–250. [Google Scholar] [CrossRef]
  67. Schindler, S.; von Wehrden, H.; Poirazidis, K.; Wrbka, T.; Kati, V. Multiscale performance of landscape metrics as indicators of species richness of plants, insects and vertebrates. Ecol. Ind. 2013, 31, 41–48. [Google Scholar] [CrossRef]
  68. Romero-Calcerrada, R.; Luque, S. Habitat quality assessment using Weights-of-Evidence based GIS modelling: The case of Picoides tridactylus as species indicator of the biodiversity value of the Finnish forest. Ecol. Modell. 2006, 196, 62–76. [Google Scholar] [CrossRef]
  69. Day, K.R.; Carthy, J. Changes in carabid beetle communities accompanying a rotation of Sitka spruce. Agric. Ecosys. Environ. 1988, 24, 407–415. [Google Scholar] [CrossRef]
  70. Thiele, H.U. Carabid Beetles in their Environments: A Study on Habitat Selection by Adaptations in Physiology and Behaviour; Springer: Berlin, Germany, 1997; p. 369. [Google Scholar]
  71. Butterfield, J. Carabid community succession during the forestry cycle in conifer plantations. Ecography 1997, 20, 614–625. [Google Scholar] [CrossRef]
  72. Vanbergen, A.J.; Woodcock, B.A.; Watt, A.D. Effect of land-use heterogeneity on carabid communities at the landscape scale. Ecography 2005, 28, 3–16. [Google Scholar] [CrossRef]
  73. Gregory, R.D.; Vořišek, P.; Noble, D.G.; Van Strien, A.; Klvaňová, A.; Eaton, M.; Burfield, I.J. The generation and use of bird population indicators in Europe. Bird Conserv. Internat. 2008, 18, 223–244. [Google Scholar] [CrossRef] [Green Version]
  74. Carrillo-Rubio, E.; Kery, M.; Morreale, S.J. Use of multispecies occupancy models to evaluate the response of bird communities to forest degradation associated with logging. Conserv. Bio. 2014, 28, 1034–1044. [Google Scholar] [CrossRef]
  75. Czeszczewik, D.; Zub, K.; Stanski, T.; Sahel, M.; Kapusta, A.; Walankiewicz, W. Effects of forest management on bird assemblages in the Bialowieza Forest, Poland. iForest 2014, 8, 377–385. Available online: http://www.sisef.it/iforest/contents/?id=ifor1212-007 (accessed on 9 January 2019). [CrossRef] [Green Version]
  76. Basile, M.; Valerio, F.; Balestrieri, R.; Posillico, M.; Bucci, R.; Altea, T.; Matteucci, G. Patchiness of forest landscape can predict species distribution better than abundance: the case of a forest-dwelling passerine, the short-toed treecreeper, in central Italy. PeerJ 2016, 4, e2398. [Google Scholar] [CrossRef] [PubMed] [Green Version]
  77. Feest, A. The Utility of the Streamlining European Biodiversity Indicators 2010 (SEBI 2010). Ecol. Ind. 2013, 28, 16–21. [Google Scholar] [CrossRef]
  78. Mosimann, P.; Naef-Daenzer, B.; Blattner, M. Die Zusammensetzung der Avifauna in typischen Waldgesellschaften der Schweiz. D. Ornitholog. Beobachter 1987, 84, 275–299. [Google Scholar]
  79. Müller-Buser, M. Die Avifauna der Bergföhrenwälder des Schweizerischen Nationalparks im Ofenpassgebiet. D. Ornitholog. Beobachter 2002, 99, 1–18. [Google Scholar]
  80. Bujoczek, M.; Rybicka, J.; Bujoczek, L. Effects of disturbances in a subalpine forest on its structural indicators and bird diversity. Ecol. Ind. 2020, 112, 106126. [Google Scholar] [CrossRef]
  81. Angelstam, P.; Dönz-Breuss, M.; Roberge, J.M. Targets and tools for the maintenance of forest biodiversity: An introduction. Ecol. Bull. 2004, 51, 11–24. [Google Scholar]
  82. Lešo, P.; Kropil, R.; Kajtoch, Ł. Effects of Forest Management on Bird Assemblages in Oak-Dominated Stands of the Western Carpathians—Refuges for Rare Species. For. Ecol. Manage. 2019, 453, 117620. [Google Scholar] [CrossRef]
  83. Hilty, J.; Merenleder, A. Faunal indicator taxa selection for monitoring ecosystem health. Bio. Conser. 2000, 92, 185–197. [Google Scholar] [CrossRef]
  84. Hawskworth, D.L.; Rose, F. Qualitative scale for estimating sulphur dioxide in England and Wales using epiphytic lichens. Nature 1970, 227, 145–148. [Google Scholar]
  85. Block, W.M.; Brennan, L.A.; Gutiérrez, R.J. The use of guilds and guild-indicators for assessing habitat suitability. In Wildlife; Verner, J., Morrison, M.L., Ralph, C.J., Eds.; The University of Wisconsin Press: Madisonm, WI, USA, 1996; pp. 109–113. [Google Scholar]
  86. Furness, R.W.; Greenwood, J.J.D. (Eds.) Birds as Monitors of Environmental Change; Chapman & Hall: London, UK, 1993. [Google Scholar]
  87. Mikusiński, G.; Gromadzki, M.; Chylarecki, P. Woodpeckers as indicators of forest bird diversity. Conserv. Biol. 2001, 15, 208–217. [Google Scholar] [CrossRef]
  88. Roberge, J.-M.; Angelstam, P.; Villard, M.-A. Specialised woodpeckers and naturalness in hemiboreal forests—Deriving quantitative targets for conservation planning. Bio. Conserv. 2008, 141, 997–1012. [Google Scholar] [CrossRef]
  89. Roberge, J.-M.; Mikusinski, G.; Svensson, S. The white-backed woodpecker: umbrella species for forest conservation planning? Biodiv. Conserv. 2008, 17, 2479–2494. [Google Scholar] [CrossRef]
  90. Gittings, T.; O’Halloran, J.; Kelly, T.; Giller, P.S. The Contribution of Open Spaces to the Maintenance of Hoverfly (Diptera, Syrphidae) Biodiversity in Irish Plantation Forests. For. Ecol. Manage. 2006, 237, 290–300. [Google Scholar] [CrossRef]
  91. Rodriguez-Prieto, I.; Bennett, V.J.; Zollner, P.A.; Mycroft, M.; List, M.; Fernández-Juricic, E. Simulating the responses of forest bird species to multi-use recreational trails. Landsc. Urban. Plan. 2014, 127, 164–172. [Google Scholar] [CrossRef]
  92. Pakkala, T.; Linden, A.; Tiainen, J.; Tomppo, E.; Kouki, J. Indicators of forest biodiversity: which bird species predict high breeding bird assemblage diversity in boreal forests at multiple spatial scales? Ann. Zool. Fenn. 2014, 51, 457–476. [Google Scholar] [CrossRef] [Green Version]
  93. Vangansbeke, P.; Blondeel, H.; Landuyt, D.; De Frenne, P.; Gorissen, L.; Verheyen, K. Spatially combining wood production and recreation with biodiversity conservation. Biodiv. Conserv. 2017, 26, 3213–3239. [Google Scholar] [CrossRef]
  94. Fleishman, E.; Murphy, D.D.; Brussard, P.F. A new method for selection of umbrella species for conservation planning. Ecol. Appl. 2000, 10, 569–579. [Google Scholar] [CrossRef]
  95. Suter, W.; Graf, R.F.; Hess, R. Capercaillie (Tetrao urogallus) and Avian Biodiversity: Testing the Umbrella-Species Concept. Cons. Bio. 2002, 16, 3. [Google Scholar] [CrossRef]
  96. Roberge, J.-M.; Angelstam, P. Usefulness of the umbrella species concept as a conservation tool. Cons. Bio. 2004, 18, 76–85. [Google Scholar] [CrossRef]
  97. Mikoláš, M.; Svitok, M.; Tejkal, M.; Leitão, P.J.; Morrissey, R.C.; Svoboda, M.; Fontaine, J.B. Evaluating forest management intensity on an umbrella species: Capercaillie persistence in central Europe. For. Ecol. Manage. 2015, 354, 26–34. [Google Scholar] [CrossRef]
  98. Niemi, G.J.; Hanowski, J.M.; Lima, A.R.; Nicholls, T.; Weiland, N. A critical analysis on the use of indicator species in management. J. Wildl. Manage. 1997, 61, 1240–1252. [Google Scholar] [CrossRef]
  99. Prendergast, J.R.; Eversham, B.C. Species richness covariance in higher taxa: empirical tests of the biodiversity indicator concept. Ecography 1997, 20, 210–216. [Google Scholar] [CrossRef]
  100. Landres, P.B.; Verner, J.; Thomas, J.W. Ecological uses of vertebrate indicator species: A critique. Cons. Bio. 1988, 2, 316–328. [Google Scholar] [CrossRef]
  101. Lindenmayer, D.B. Future directions for biodiversity conservation in managed forests: Indicator species, impact studies and monitoring programs. For. Ecol. Manage. 1999, 115, 277–287. [Google Scholar] [CrossRef]
  102. Sabatini, F.M.; Burrascano, S.; Azzella, M.M.; Barbati, A.; De Paulis, S.; Di Santo, D.; Facionia, L.; Giuliarelli, D.; Lombardi, F.; Maggi, O.; et al. One taxon does not fit all: Herb-layer diversity and stand structural complexity are weak predictors of biodiversity in Fagus sylvatica forests. Ecol. Ind. 2016, 69, 126–137. [Google Scholar] [CrossRef] [Green Version]
  103. Larrieu, L.; Gosselin, F.; Archaux, F.; Chevalier, R.; Corriol, G.; Dauffy-Richard, E.; Deconchat, M.; Gosselin, M.; Ladet, S.; Savoie, J.-M.; et al. Cost-efficiency of cross-taxon surrogates in temperate forests. Ecol. Ind. 2018, 87, 56–65. [Google Scholar] [CrossRef]
  104. Jones, K.B.; Neale, A.C.; Nash, M.S. Predicting nutrient and sediment loadings to streams from landscape metrics: A multiple watershed study from the United States Mid-Atlantic Region. Lands. Ecol. 2001, 16, 301–312. [Google Scholar] [CrossRef]
  105. Li, H.; Wu, J. Use and misuse of landscape metrics. Lands. Ecol. 2004, 19, 389–399. [Google Scholar] [CrossRef] [Green Version]
  106. Motz, K.; Sterba, H.; Pommerening, A. Sampling measures of tree diversity. For. Ecol. Manage. 2010, 260, 1985–1996. [Google Scholar] [CrossRef]
  107. Karahalil, U.; Başkent, E.Z.; Sivrikaya, F.; Kılıç, B. Analyzing deadwood volume of Calabrian pine (Pinus brutia Ten.) in relation to stand and site parameters: a case study in Köprülü Canyon National Park. Environ. Monit. Assess. 2017, 189, 112. [Google Scholar] [CrossRef]
  108. Warren, W.G.; Olsen, P.F. A line intersect technique for assessing logging waste. For. Sci. 1964, 10, 267–276. [Google Scholar]
  109. Polit, J.-I.; Brown, S. Mass and nutrient content of deadwood in a central Illinois floodplain forest. Wetlands 1996, 16, 488–494. [Google Scholar] [CrossRef]
  110. Luque, S.; Riutta, T.; Joensuu, J.; Rautjarvi, N.; Tomppo, E. Multi-source forest inventory data for biodiversity monitoring and planning at the forest landscape level. In Monitoring and Indicators of Forest Biodiversity in Europe—From Ideas to Operationality; Marchetti, M., Ed.; EFI, European Forest Institute: Joensuu, Finland, 2004; proceedings no. 51; pp. 430–444. [Google Scholar]
  111. Luque, S.; Riutta, T.; Joensuu, J.; Tomppo, E. Spatial analysis and remote sensing for biodiversity monitoring and planning at the forest landscape level. In Actes Hermes-science CASSINI’04, 7eme Conference GDR SIGMA; Geomatique et Analyse Spatiale: Grenoble, France, 2004; pp. 149–155. [Google Scholar]
  112. Roberge, J.-M.; Lämås, T.; Lundmark, T.; Ranius, T.; Felton, A.; Nordin, A. Relative contributions of set-asides and tree retention to the long-term availability of key forest biodiversity structures at the landscape scale. J. Environ. Manage. 2015, 154, 284–292. [Google Scholar] [CrossRef] [PubMed]
  113. Bottalico, F.; Chirici, G.; Giannini, R.; Mele, S.; Mura, M.; Puxeddu, M.; Travaglini, D. Modeling Mediterranean forest structure using airborne laser scanning data. Internat. J. App. Earth Observ. Geoinfo. 2017, 57, 145–153. [Google Scholar] [CrossRef]
  114. Treinys, R.; Mozgeris, G.; Skuja, S. Can intensified forestry be responsible for changes in habitat usage by the forest-dwelling Black Stork? Eur. J. Forest Res. 2016, 135, 1175–1186. [Google Scholar] [CrossRef]
  115. Suchant, R.; Braunisch, V. Multidimensional habitat modelling in forest management—A case study using capercaillie in the Black Forest, Germany. Ecol. Bull. 2004, 51, 455–469. [Google Scholar]
  116. Lõhmus, A.; Nellis, R.; Pullerits, M.; Leivits, M. The Potential for Long-Term Sustainability in Seminatural Forestry: A Broad Perspective Based on Woodpecker Populations. Environ. Manage. 2016, 57, 558–571. [Google Scholar] [CrossRef]
  117. Lindberg, E.; Roberge, J.-M.; Johansson, T.; Hjältén, J. Can Airborne Laser Scanning (ALS) and Forest Estimates Derived from Satellite Images Be Used to Predict Abundance and Species Richness of Birds and Beetles in Boreal Forest? Remote Sens. 2015, 7, 4233–4252. [Google Scholar] [CrossRef] [Green Version]
  118. Mura, M.; McRoberts, R.E.; Chirici, G.; Marchetti, M. Estimating and mapping forest structural diversity using airborne laser scanning data. Remote Sens. Environ. 2015, 170, 133–142. [Google Scholar] [CrossRef]
  119. Tracz, W.; Ciurzycki, W.; Zaniewski, P.; Kwaśny, Ł.; Marciszewska, K.; Mozgawa, J. Identification of Zones with High Potential for Biological Diversity on Dormant Forested Landslides. Eur. J. Forest Res. 2019, 138, 363–373. [Google Scholar] [CrossRef] [Green Version]
  120. Lefsky, M.A.; Cohen, W.B.; Parker, G.G.; Harding, D.J. Lidar remote sensing for ecosytem studies. BioScience 2002, 52, 19–30. [Google Scholar] [CrossRef]
  121. MacKerron, G.; Mourota, S. Happiness is greater in natural environments. Glob. Environ. Change 2013, 23, 992–1000. [Google Scholar] [CrossRef] [Green Version]
  122. Pereira, H.M.; Cooper, H.D. Towards the global monitoring of biodiversity change. Tren. Ecol. Evol. 2006, 21, 123–129. [Google Scholar] [CrossRef] [PubMed]
  123. Jones, J.P.; Collen, B.E.N.; Atkinson, G.; Baxter, P.W.; Bubb, P.; Illian, J.B.; Nicholson, E. The Why, What, and How of Global Biodiversity Indicators Beyond the 2010 Target. Cons. Bio. 2011, 25, 450–457. [Google Scholar] [CrossRef] [PubMed]
  124. Feest, A.; Aldred, T.D.; Jedamzik, K. Biodiversity Quality: A Paradigm for Biodiversity. Ecol. Ind. 2010, 10, 1077–1082. [Google Scholar] [CrossRef] [Green Version]
  125. Hooper, D.U.; Chapin, F.S., III; Ewel, J.J.; Hector, A.; Inchausti, P.; Lavorel, S.; Lawton, J.H.; Lodge, D.M.; Loreau, M.; Naeem, S.; et al. Effects of biodiversity on ecosystem functioning: A consensus of current knowledge. Ecol. Monographs 2005, 75, 3–35. [Google Scholar] [CrossRef]
  126. Bobbink, R.; Hornung, M.; Roelofs, J.G.M. The effects of air-borne nitrogen pollutants on species diversity in natural and semi-natural European vegetation. J. Ecol. 1998, 86, 717–738. [Google Scholar] [CrossRef]
  127. Feest, A. Research to Test the Integration of the Nitrogen Critical Load Exceedence Model (EG4) into the 2010 Target by Linking it to the Butterfly Indicator (EG1); European Environment Agency: Copenhagen, Denmark, 2008; p. 34.
  128. Maskell, L.C.; Smart, S.M.; Bullock, J.M.; Thompson, K.; Stevens, C.J. Nitrogen deposition causes widespread loss of species richness in British Habitats. Glob. Change Biol. 2010, 16, 671–679. [Google Scholar] [CrossRef]
  129. Stevens, C.J.; Dise, N.B.; Mountford, J.O.; Gowing, D.J. Impact of nitrogen deposition on the species richness of grasslands. Science 2004, 303, 1876–1879. [Google Scholar] [CrossRef] [Green Version]
  130. Dirnböck, T.; Grandin, U.; Bernhardt-Römermann, M.; Beudert, B.; Canullo, R.; Forsius, M.; Grabner, M.-T.; Holmberg, M.; Kleemola, S.; Lundin, L.; et al. Forest floor vegetation response to nitrogen deposition in Europe. Glob. Change Biol. 2014, 20, 429–440. [Google Scholar] [CrossRef]
  131. Miina, J.; Hallikainen, V.; Härkönen, K.; Merilä, P.; Packalen, T.; Rautio, P.; Salemaa, M.; Tonteri, T.; Tolvanen, A. Incorporating a Model for Ground Lichens into Multi-Functional Forest Planning for Boreal Forests in Finland. For. Ecol. Manage. 2020, 460, 117912. [Google Scholar] [CrossRef]
  132. Groom, G.; Mücher, C.A.; Ihse, M.; Wrbka, T. Remote sensing in landscape ecology: experiences and perspectives in a European context. Lands. Ecol. 2006, 21, 391–408. [Google Scholar] [CrossRef]
  133. Schindler, S.; Poirazidis, K.; Wrbka, T. Towards a core set of landscape metrics for biodiversity assessments: A case study from Dadia National Park, Greece. Ecol. Ind. 2008, 8, 502–514. [Google Scholar] [CrossRef]
  134. Simila, M.; Kouki, J.; Monkkonen, M.; Sippola, A.L.; Huhta, E. Co-variation and indicators of species diversity: Can richness of forest-dwelling species be predicted in northern boreal forests? Ecol. Ind. 2006, 6, 686–700. [Google Scholar] [CrossRef]
  135. Nordström, E.-M.; Nieuwenhuis, M.; Başkent, E.Z.; Biber, P.; Black, K.; Borges, J.G.; Bugalho, M.N.; Corradini, G.; Felton, A. Forest decision support systems for analysis of ecosystem services provisioning at landscape scale under global climate and market change scenarios. Eur. J. Forest Res. 2019, 138, 561–581. [Google Scholar] [CrossRef]
Figure 1. PRISMA (Preferred Reporting Items for Systematic reviews and Meta-Analyses) flow diagram of the literature review.
Forests 11 00343 g001
Figure 2. Distribution of case studies across biogeographic regions in Europe (note: nine studies had more than one case study area).
Forests 11 00343 g002
Figure 3. Ratio of the total number of case studies and the number of case studies that were addressing the practicality of the biodiversity indicators used. Analysis per country.
Forests 11 00343 g003
Figure 4. Temporal evolution of studies on biodiversity indicators, which address (blue) and do not address (red) practicability of the indicators and data collection methods applied. Note that our review includes studies until February 16 (i.e., the year 2020 is incomplete).
Forests 11 00343 g004
Figure 5. Number of biodiversity indicators used in reviewed studies. For details how indicators are explained and sorted by type of biodiversity (structure, composition, and function) see supporting material, Table S2.
Forests 11 00343 g005
Table 1. Practical indicators for various management categories at stand and landscape-level reported in the literature (* indicates the property; - indicates unknown).
Practical Aspects of IndicatorManagement Category
ScaleType of BiodiversityPractical IndicatorCost-efficient to SampleEasy to RecognizeTime-efficient to SampleUnmanaged ForestManaged ForestsPlantationsSilvopastoral System
StandCompos.Vascular plants [55,56}* *
StandCompos.Carabidae beetles [46] ******
StandCompos.Spiders [25] * *
StandCompos.Hoverflies [25] * *
StandCompos.Tree species composition (richness, abundance, and diversity) [4,63] * *****
StandCompos.Shrub species composition (richness, abundance, and diversity) [63]* *****
StandStruct.Deadwood [2,12,20,63,64,65]*****
StandStruct.Canopy cover [2,4]******
StandStruct.Special trees (occurrence of moss and lichen-covered, bent, damaged, hollow and forked trees) [12] * ***
StandStruct.Proximity to native forests [25]******
StandStruct.Large trees (mature trees) [12,63] * ** *
StandStruct.Old forest stands [12] * **
StandStruct.Deciduous trees [12] * **
StandFuncti.Stand age [2,12,25]*** *
StandFuncti.Available phosphorus (P) [25] *
StandFuncti.Elevation [25]*** *
StandFuncti.Uprooted trees [12] *
StandFuncti.Thinning frequency [25]*** *
StandFuncti.Wood-decaying bracket fungi [12] ***
Lands.Compos.Birds [25,55,56,58]* ****
Lands.Compos.Tree species richness [66]* * *
Lands.Compos.Shrub species richness [66]* * *
Lands.Compos.Valuable habitats [4]* ***
Lands.Struct.Patch shape, proximity, texture, diversity, and size [67]-------
Table 2. Impractical indicators for various management categories at stand scale reported in the literature (* indicates the property). Note that we did not identify impractical landscape scale indicators.
Impractical Aspects of IndicatorManagement Category
Scale Type of BiodiversityImpractical Indicator and Authors Expensive to Sample Hard to RecognizeTime-consuming to SampleUnmanaged ForestManaged ForestPlantationSilvopastoral System
Stand Compos.Vascular plants [57,58] ******
StandCompos.Lichens [12,57,58] * ***
StandCompos.Fungi [59]*****
StandCompos.Bryophyte [25] * **
StandCompos.Invertebrate species [25]***
StandCompos.Plant species diversity [4,54] ******
StandCompos.Herb layer [68] *****
Table 3. Practical methods for data collection for different biodiversity attributes in three types of forests and types of biodiversity (structure, composition, and function) Note: not all the authors reported the types of forests clearly, and thus we put in the table information only about those which are clearly reported.
Scale and Type of BiodiversityIndicator (Attribute)Practical Data Collection Method for Managed ForestsPractical Data Collection Method for Unmanaged ForestsPractical Data Collection Method for PlantationsPractical Data Collection for Silvopastoral Systems
Stand
Structure
DeadwoodSmartphone app [42]; NFI [63]Smartphone app [42]; LiDAR [41]; NFI [63]; line-intersect sampling [107] --
StructureBig treesSmartphone app [43]; NFI [63]Smartphone app [43]; NFI [63]--
StructureTree densitySmartphone app [43]Smartphone app [43]--
StructureMicro-habitat diversitySatellite images [45]Satellite images [45]--
StructureBiomassLiDAR [113]LiDAR [113]LiDAR [113]-
StructureHeightLiDAR [113]LiDAR [113]LiDAR [113]-
CompositionTree species diversitySmartphone app [43]; NFI [63]Smartphone app [43]; NFI [63]--
CompositionShrub species diversityNFI [63]NFI [63]--
CompositionHerbsSmartphone app [42]Smartphone app [42] --
CompositionBird species richnessSatellite images [45]; National Ornithological Society [114]; National bird atlas [89]; gamekeeper register [115]Satellite images [45]; National Ornithological Society [114]; gamekeeper register [115]--
CompositionFungal species richnessLiDAR [59] --
CompositionComposition of forest-dwelling beetlesLiDAR [40]LiDAR [40]--
Function DisturbancesSmartphone app [42]Smartphone app [42]--
RegenerationSmartphone app [42]Smartphone app [42] -
Landscape
Structure
DeadwoodLiDAR + inventory data + aerial photographs [41]LiDAR [41]--
StructureMicro-habitat diversitySatellite images [45]Satellite images [45]--
StructureHeightLiDAR [113] --
StructureBiomassLiDAR [113] --
CompositionTree species -NFI [66]
CompositionShrub species -NFI [66]
CompositionBird species richnessSatellite images [45]; National Ornithological Society [114,116]; Museum of Natural History [68]; National bird atlas [87] Satellite images [45]; National Ornithological Society [116]; National bird atlas [87]--

