Deforestation and Connectivity among Protected Areas of Tanzania


Abstract
1. Introduction
2. Data and Method
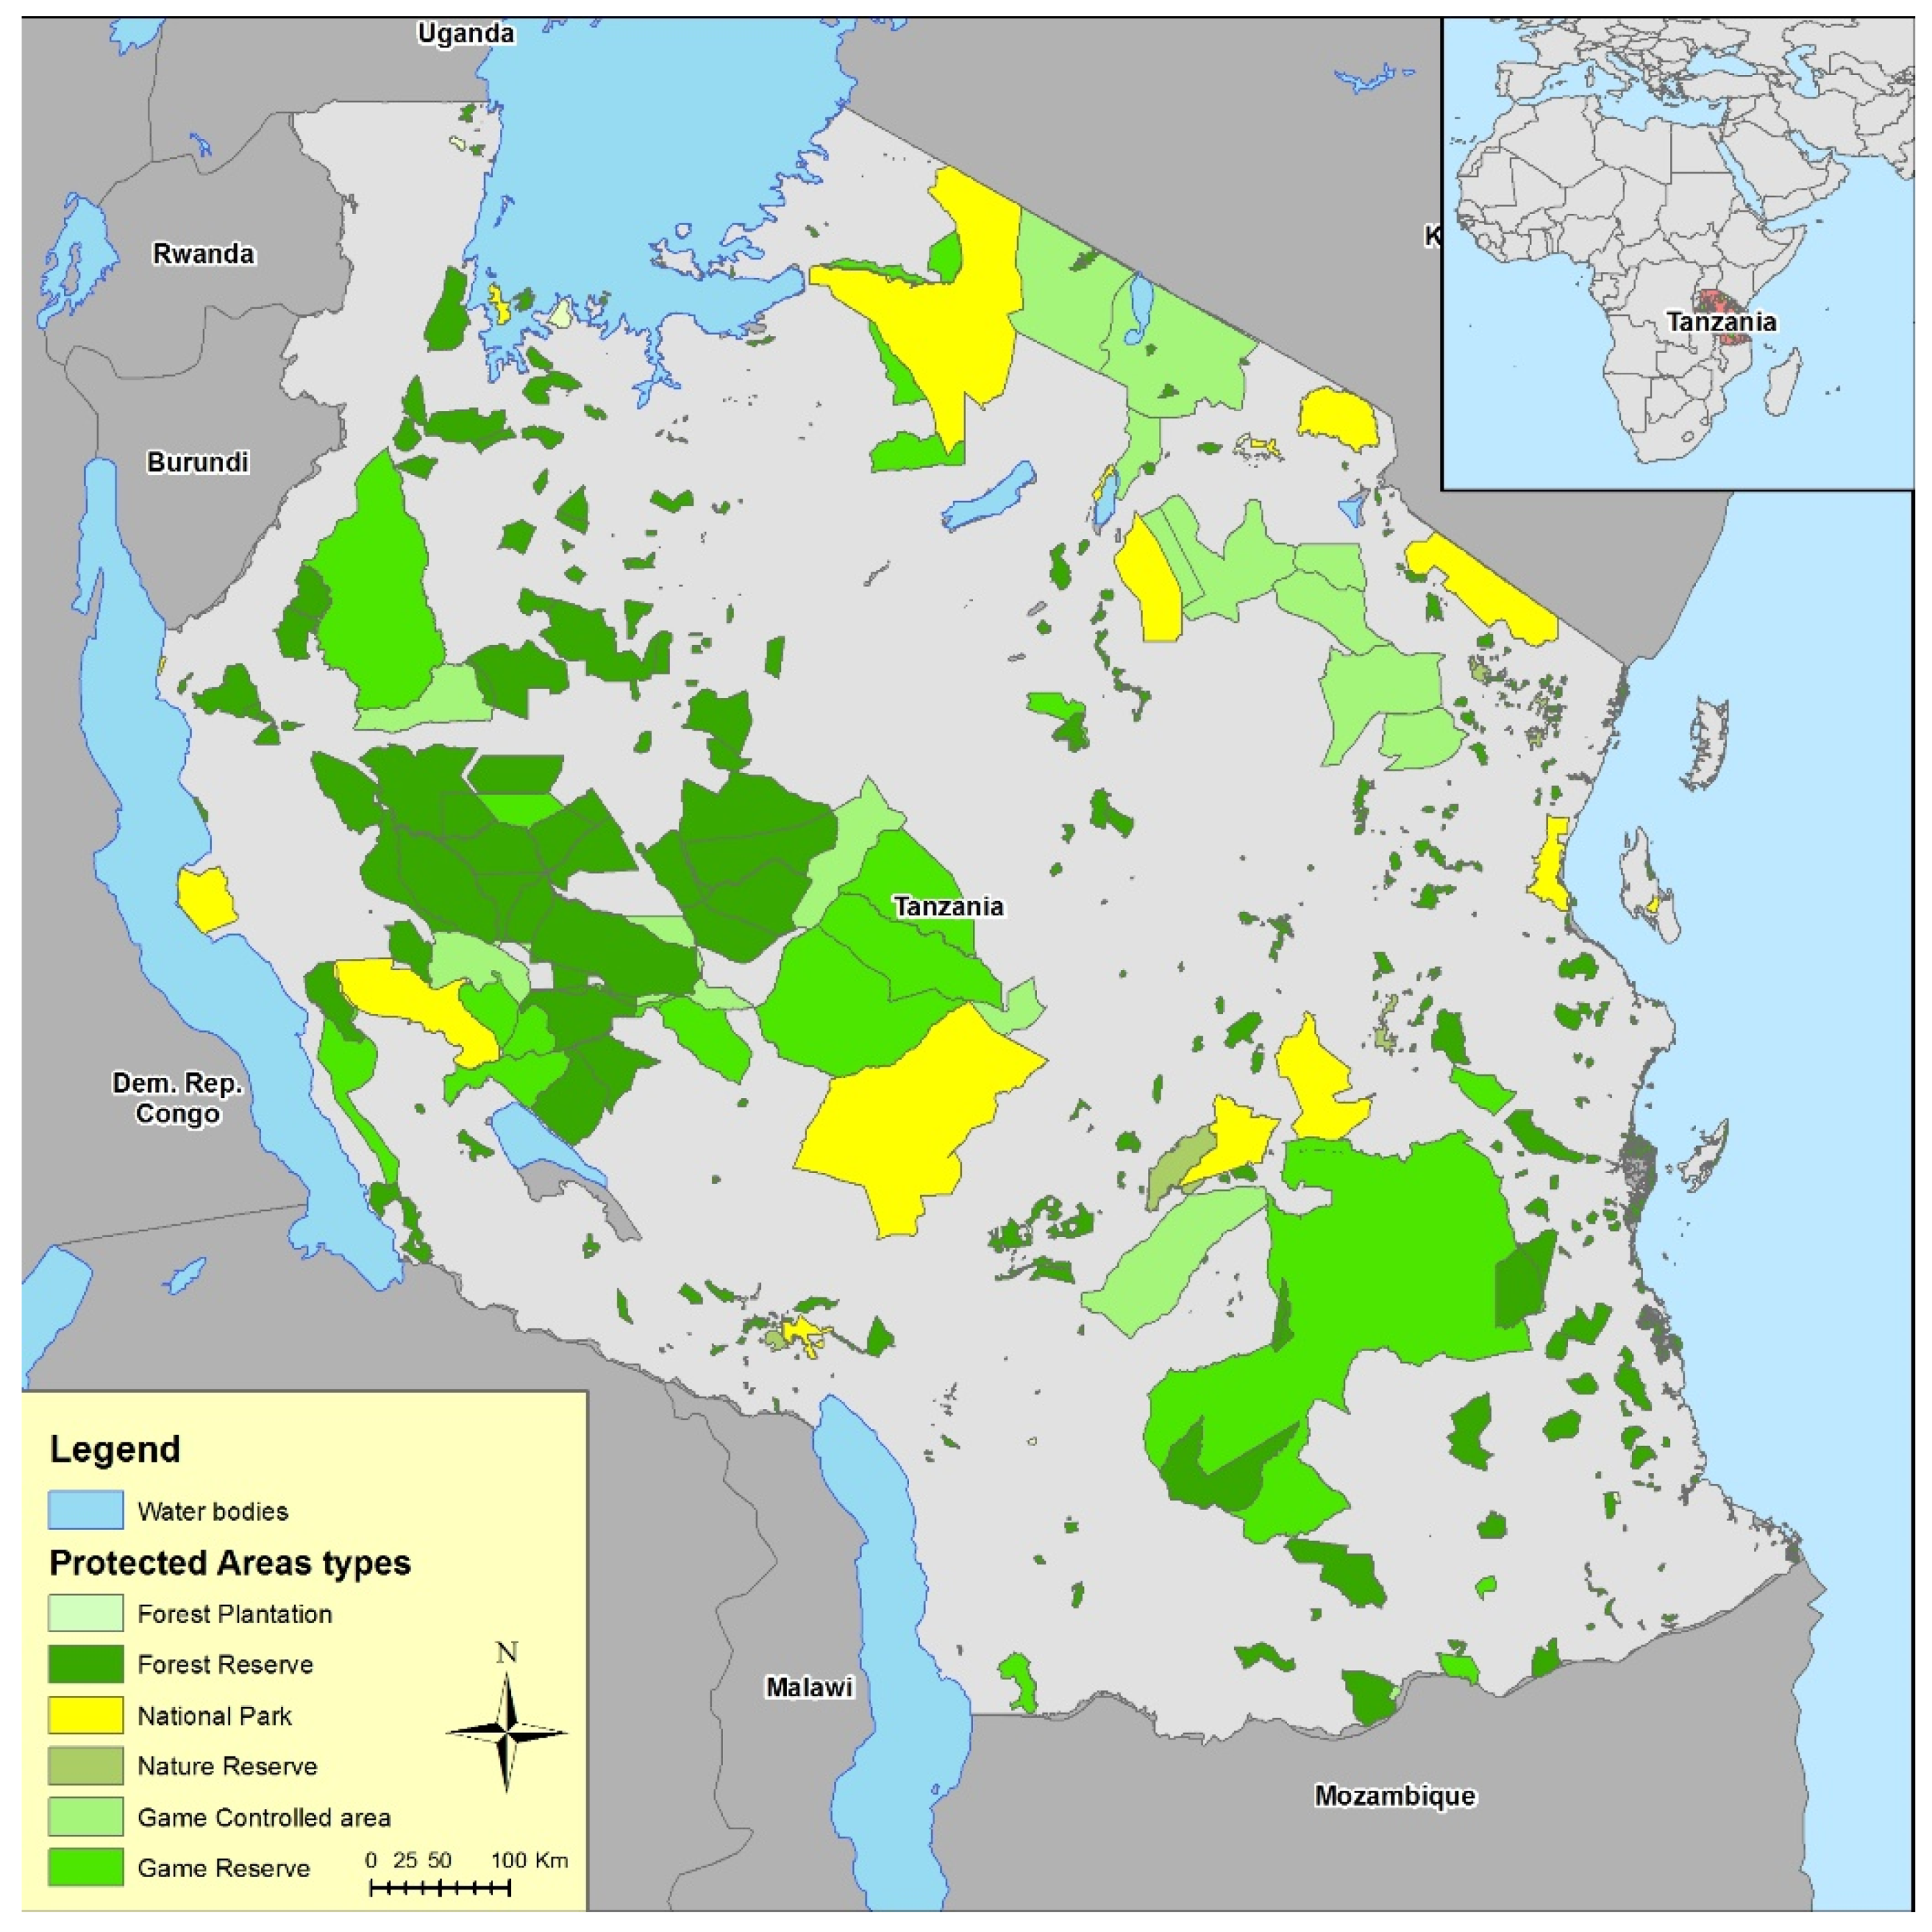
2.1. Study Area
2.2. Data
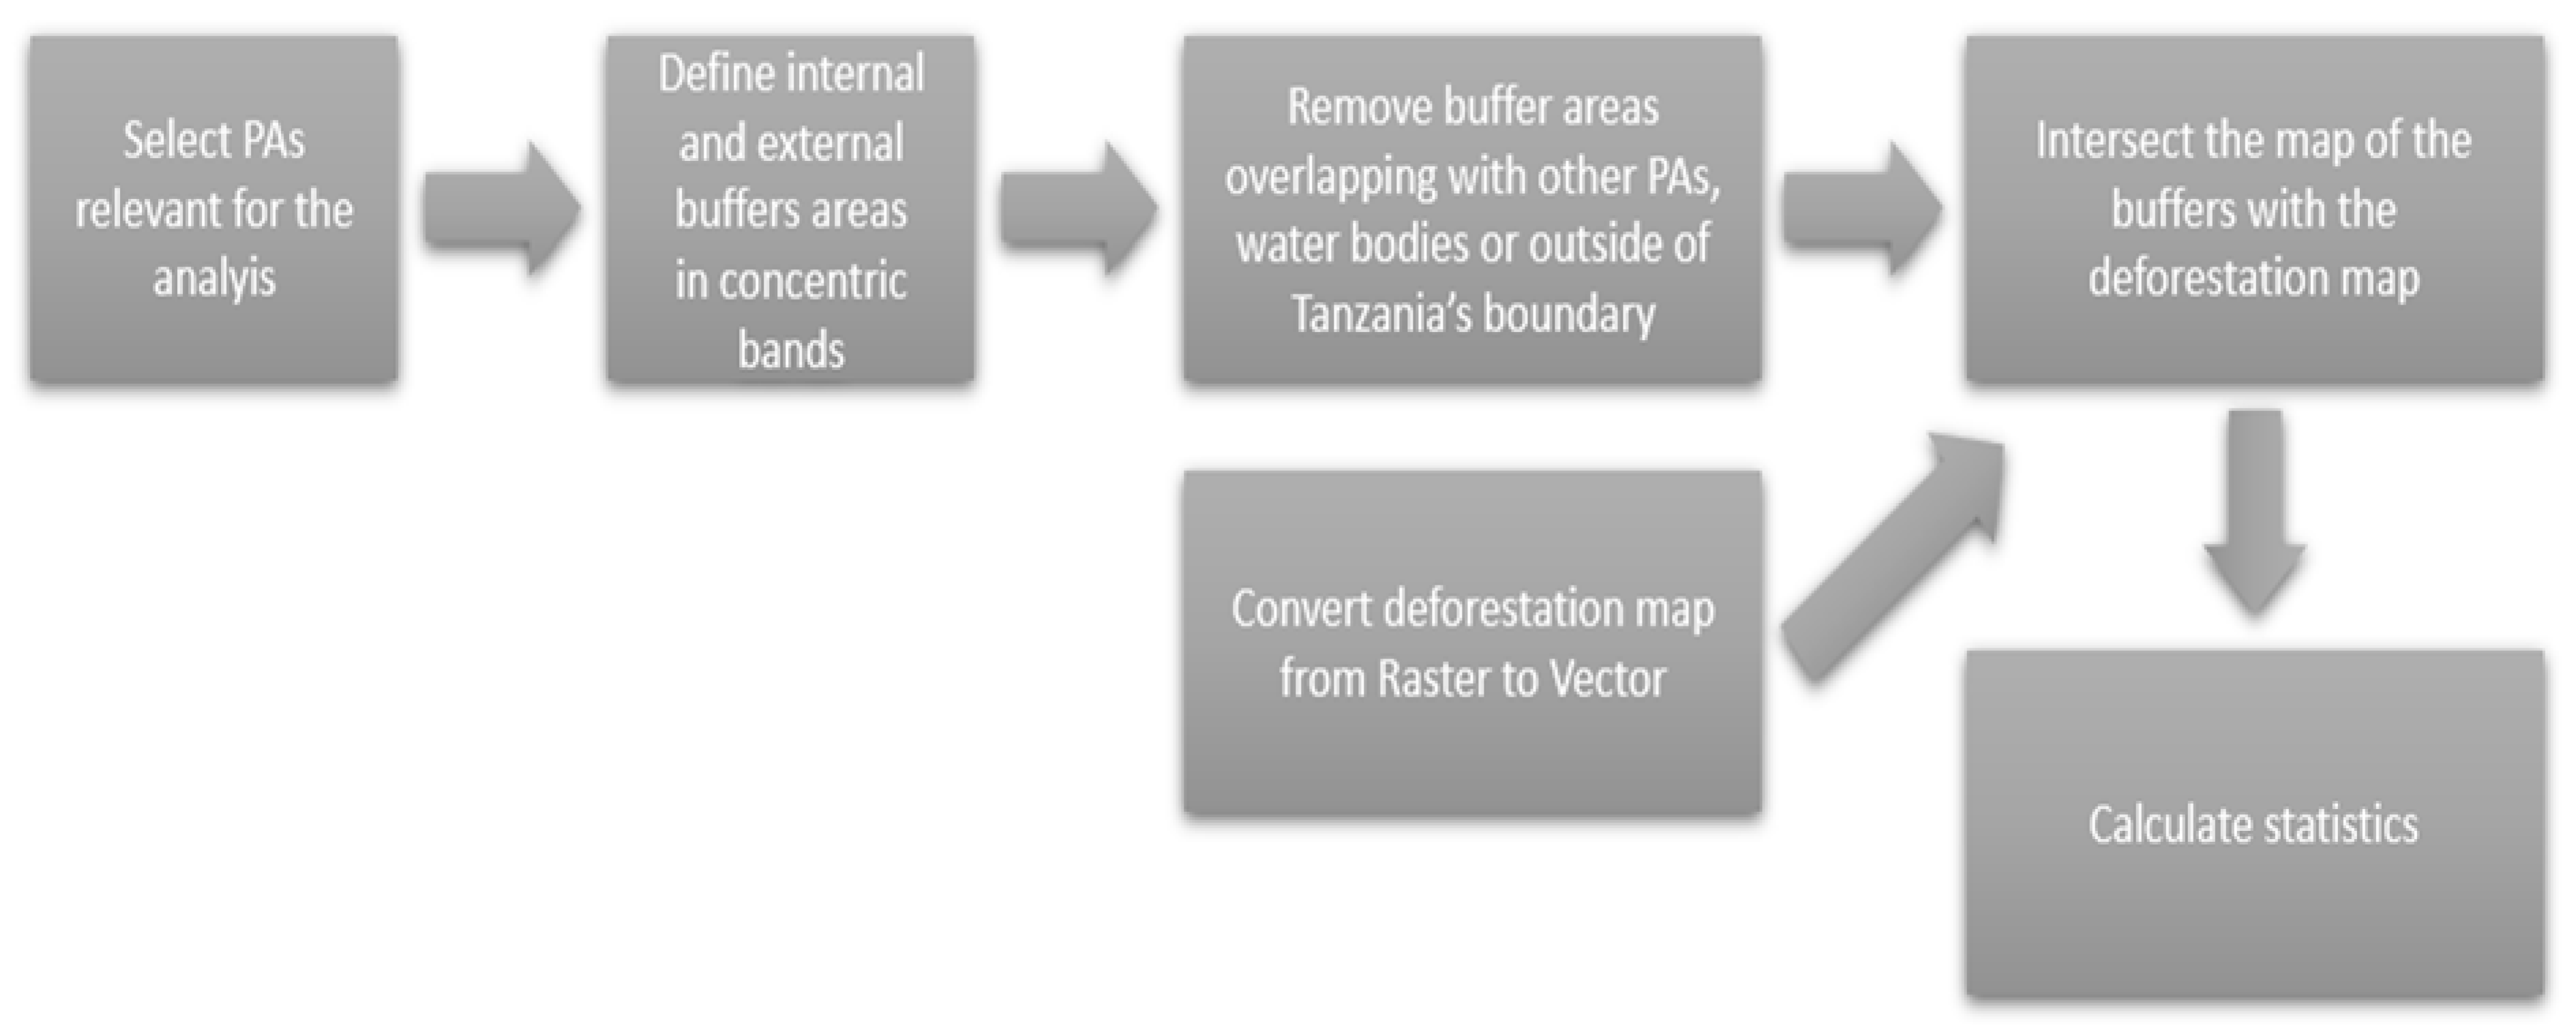
2.3. Statistical Analysis
3. Results
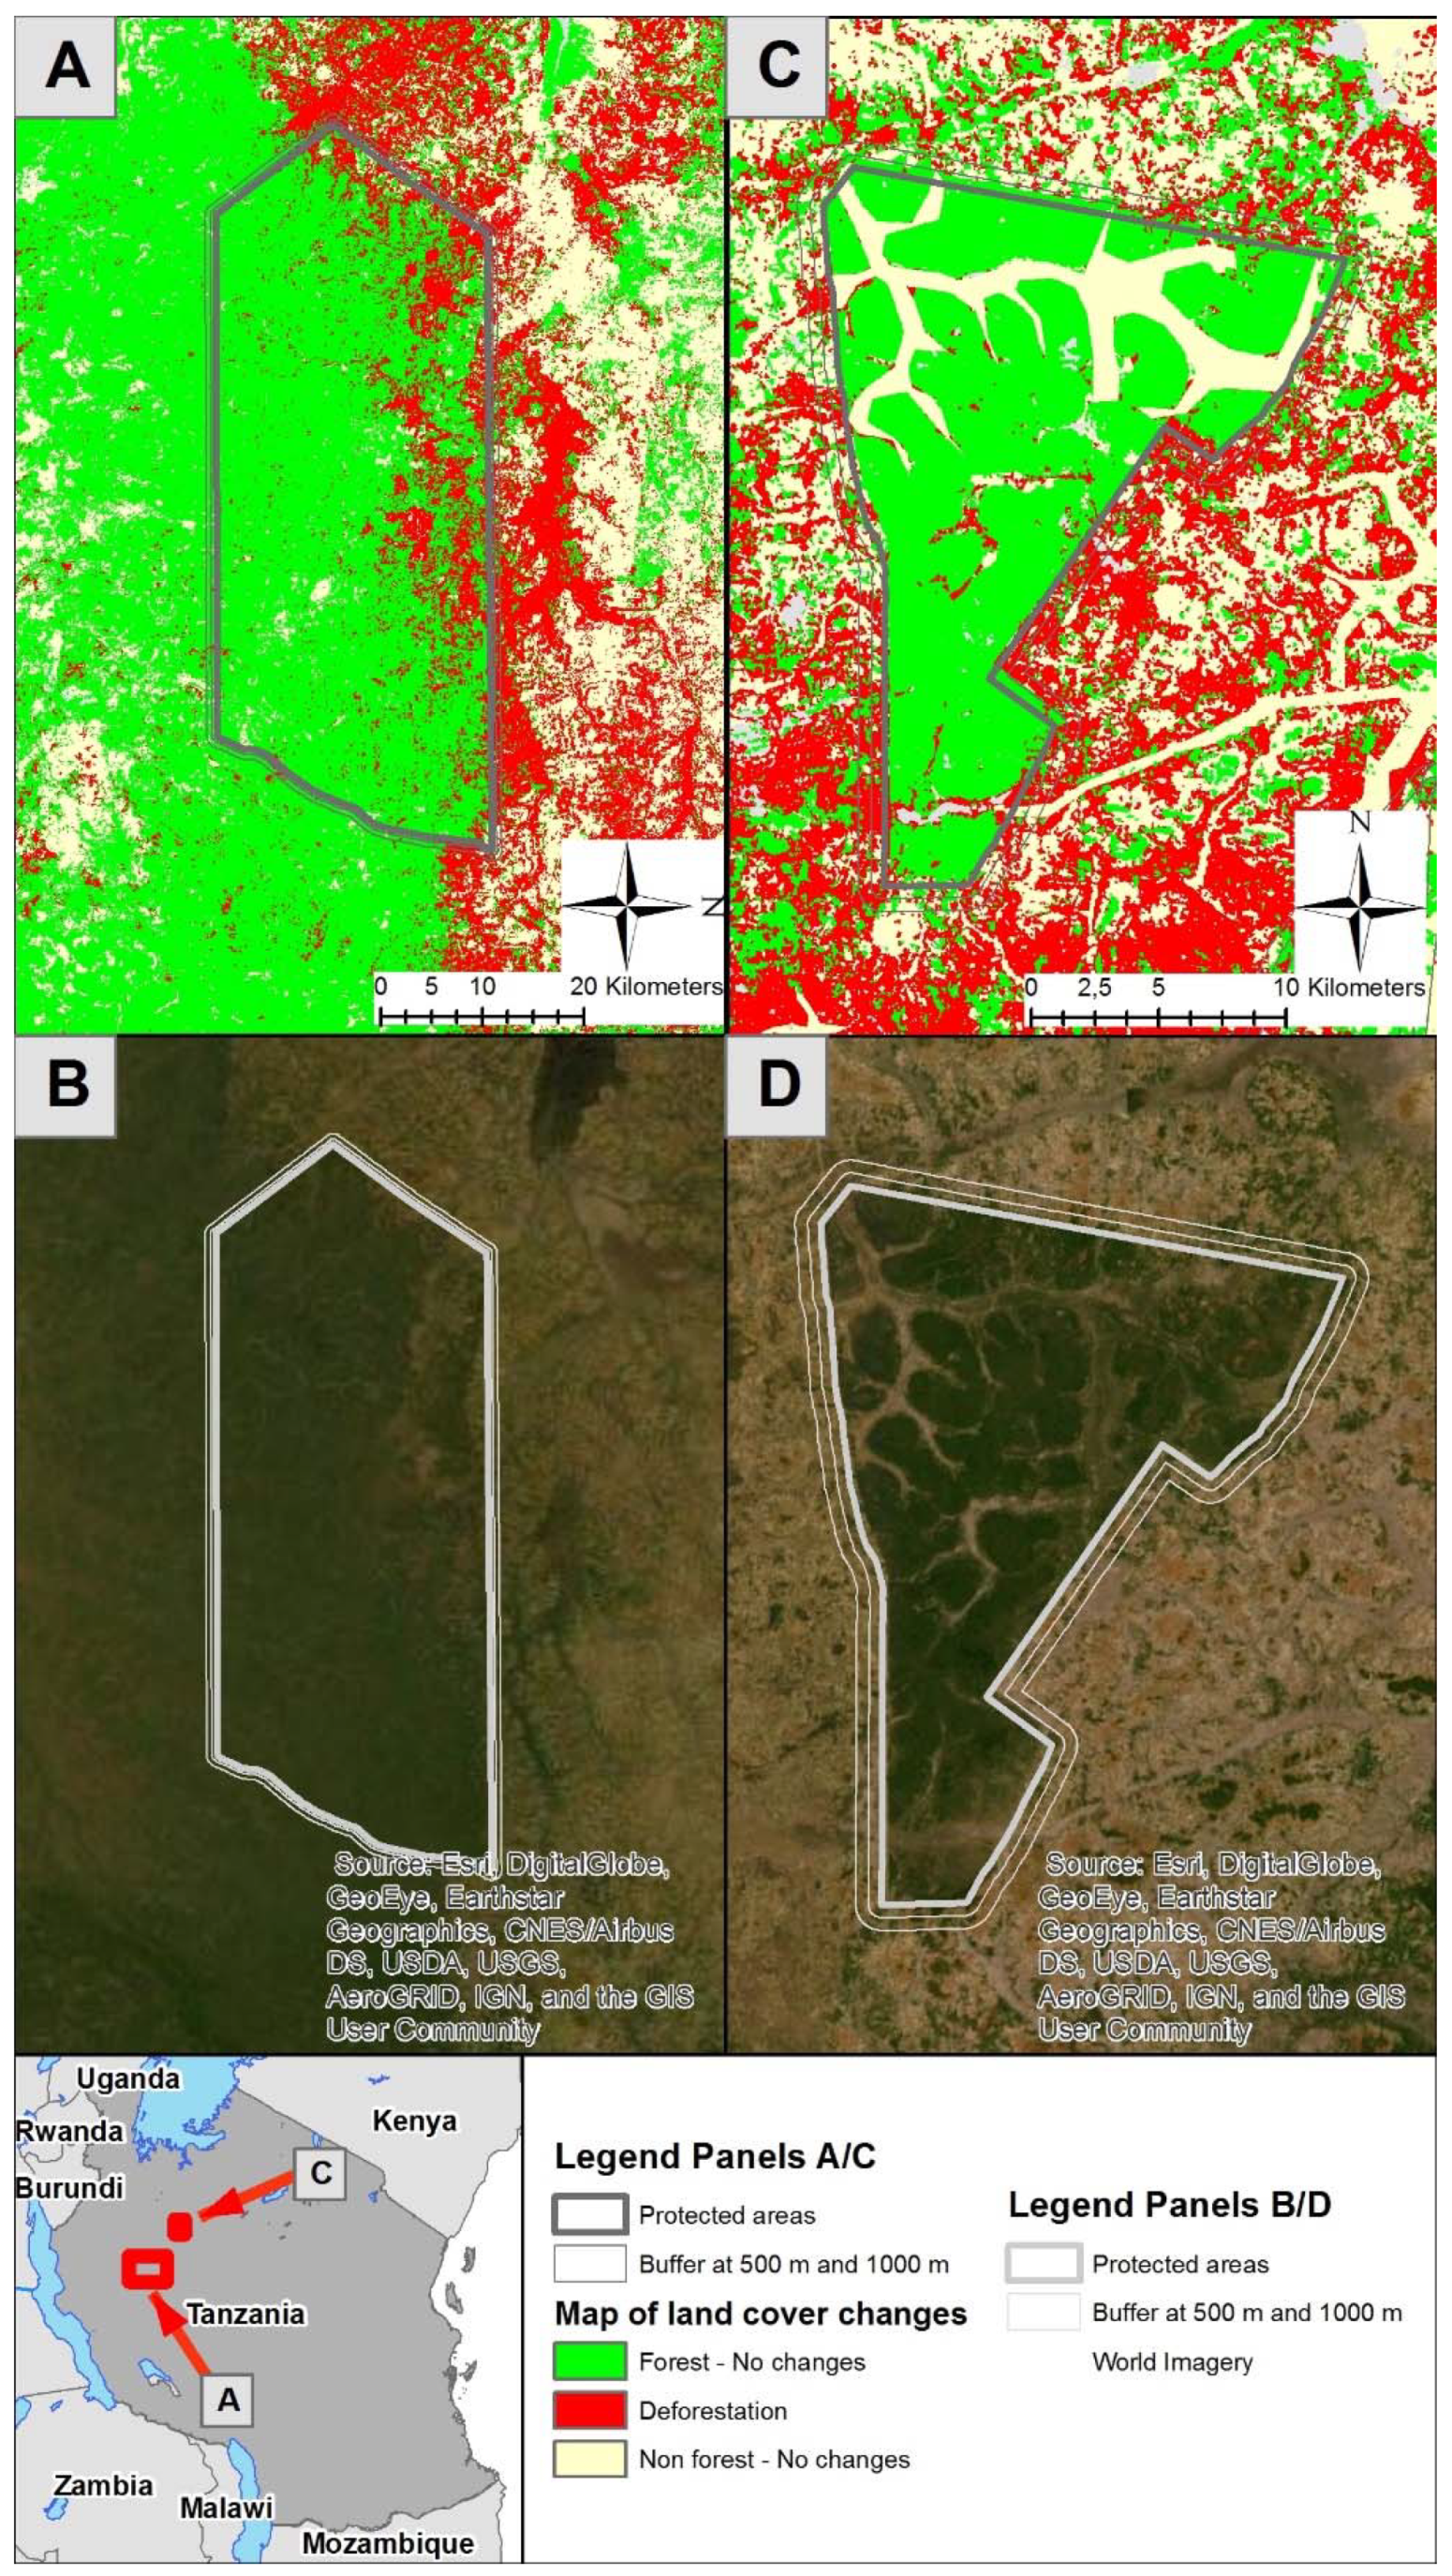
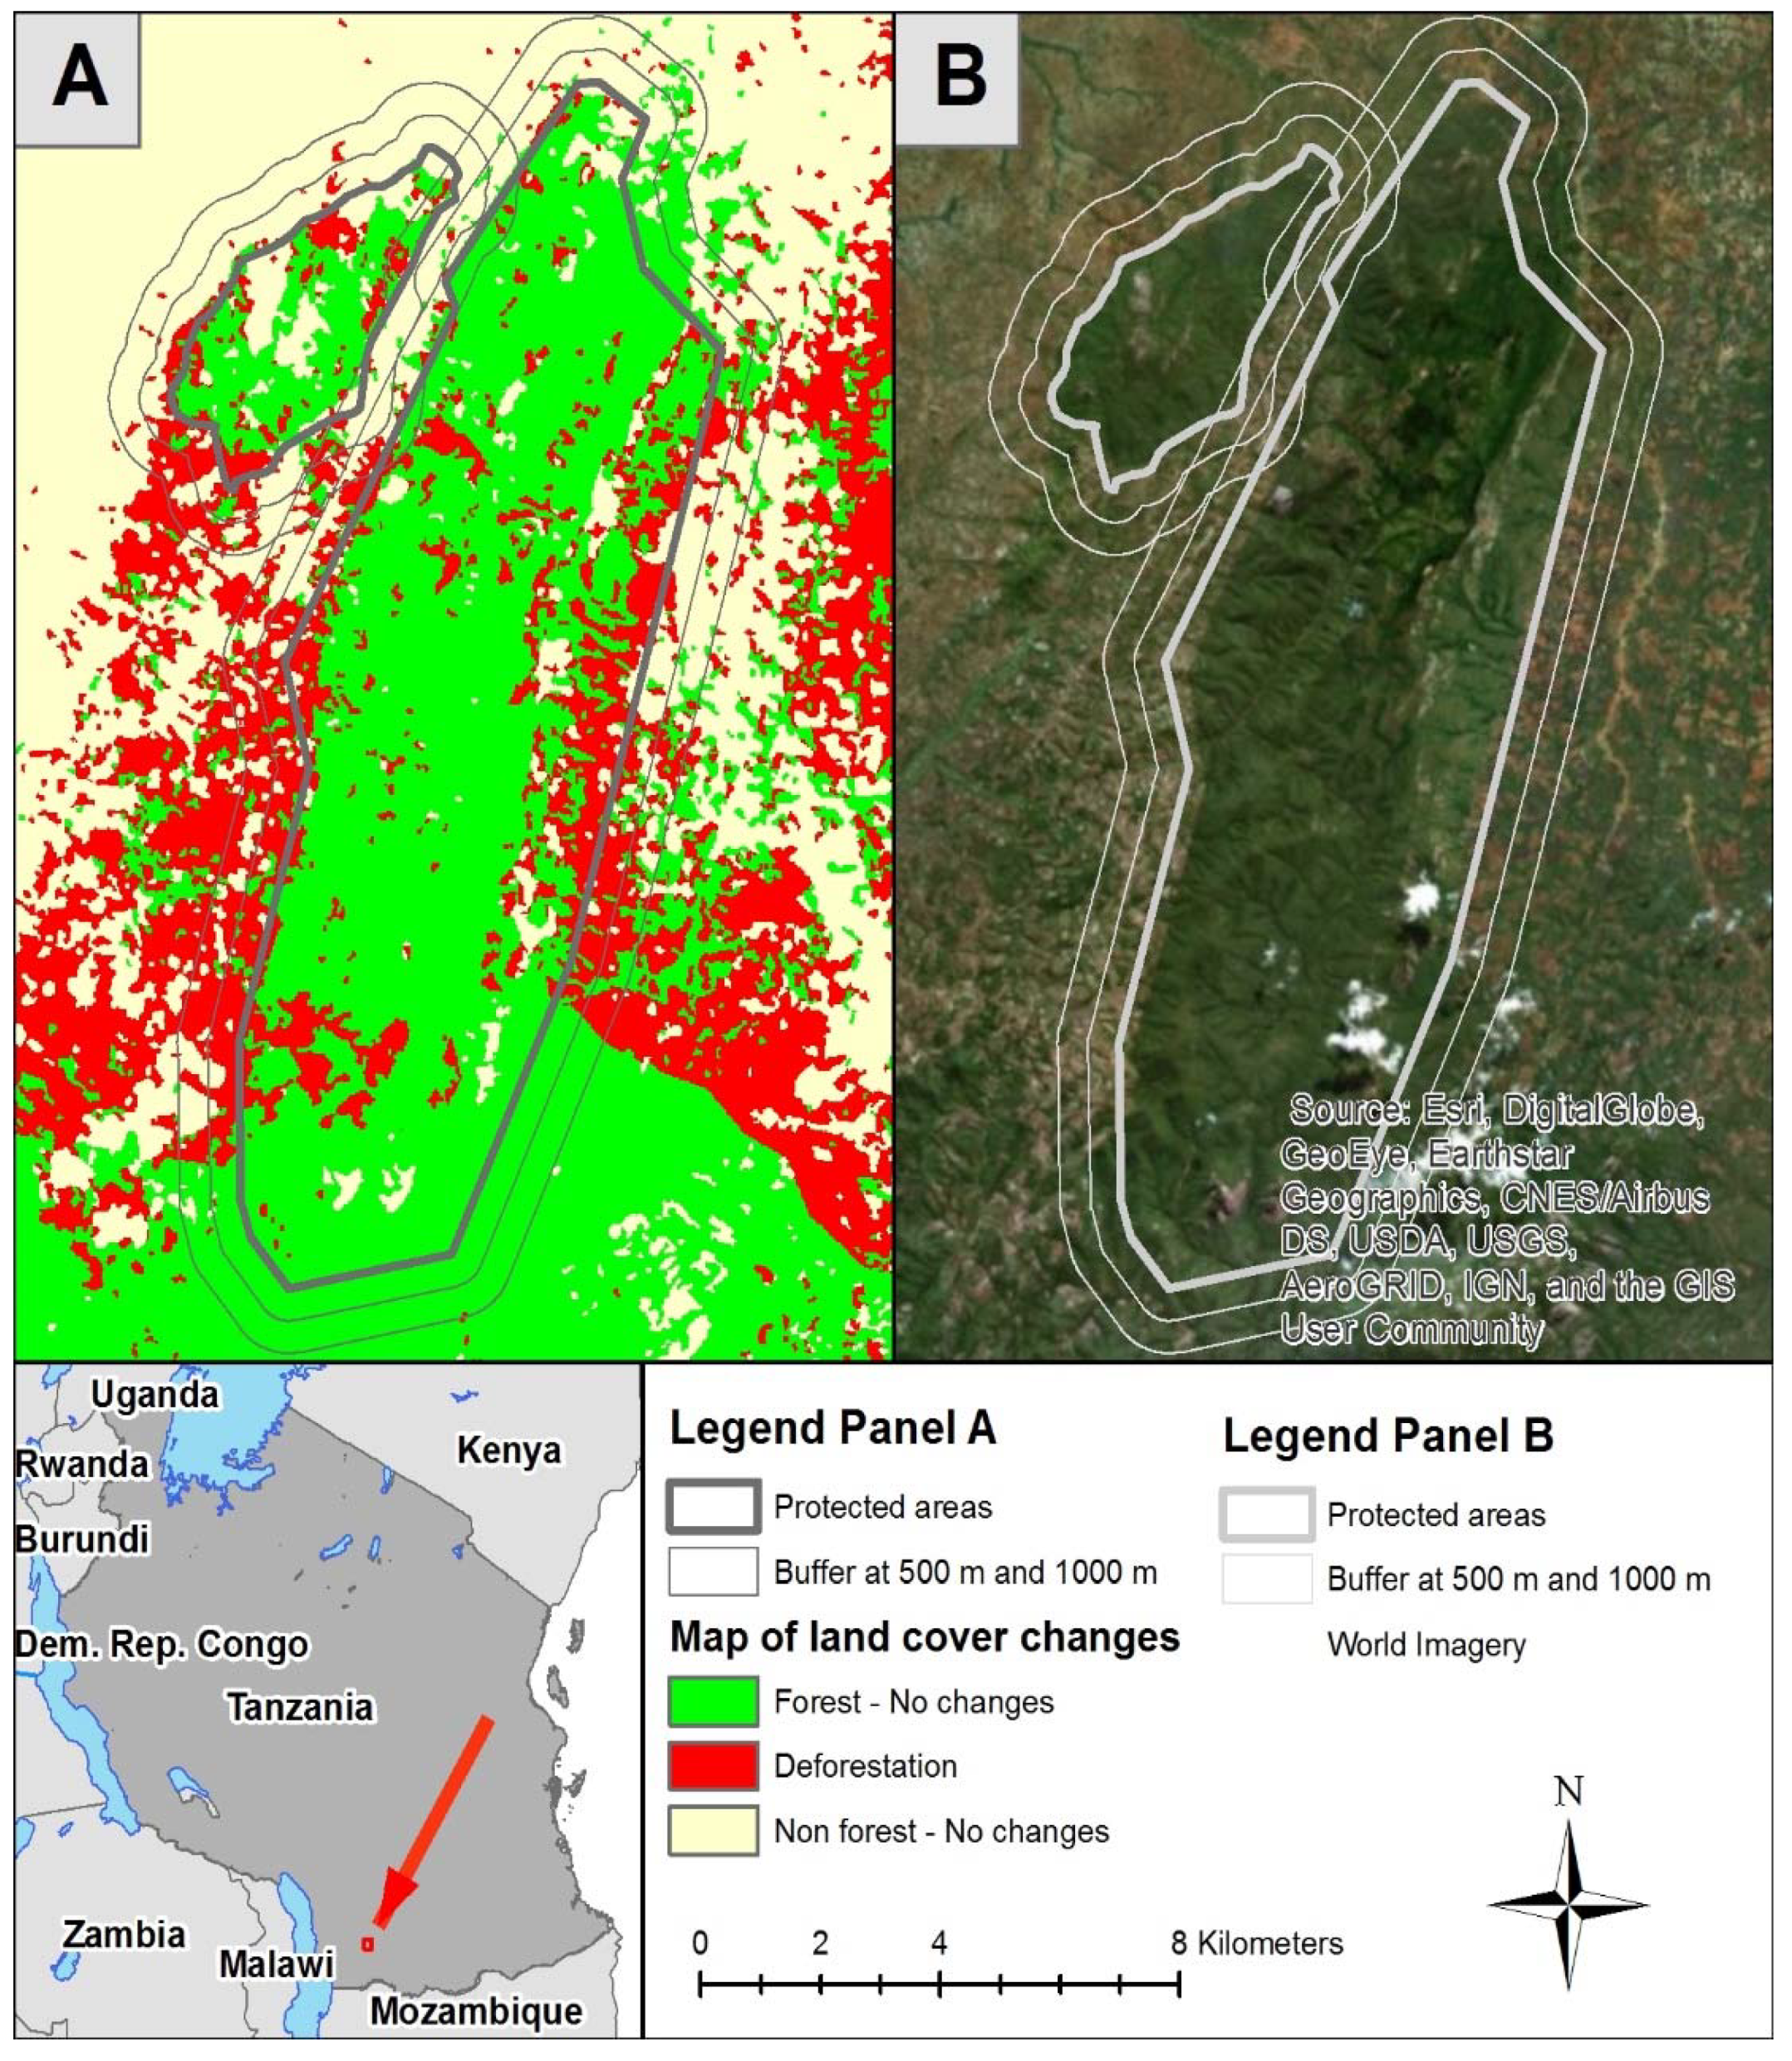
3.1. Deforestation inside Protected Areas (PAs) and the Buffer Areas
3.2. Connectivity and Isolation of PAs
3.3. PA Management Effects
4. Discussions
4.1. Deforestation and Isolation of PAs
4.2. PA Management Effects
4.3. Implications for the Climate Benefits of Protection
5. Conclusions
Author Contributions
Funding
Acknowledgments
Conflicts of Interest
References
- Spracklen, B.D.; Kalamandeen, M.; Galbraith, D.; Gloor, E.; Spracklen, D.V. A Global Analysis of Deforestation in Moist Tropical Forest Protected Areas. PLoS ONE 2015, 10, e0143886. [Google Scholar] [CrossRef] [PubMed]
- Pfaff, A.; Robalino, J.; Herrera, D.; Sandoval, C. Protected Areas’ Impacts on Brazilian Amazon Deforestation: Examining Conservation—Development Interactions to Inform Planning. PLoS ONE 2015, 10, e0129460. [Google Scholar] [CrossRef] [PubMed]
- Forrest, J.L.; Mascia, M.B.; Pailler, S.; Abidin, S.Z.; Araujo, M.D.; Krithivasan, R.; Riveros, J.C. Tropical Deforestation and Carbon Emissions from Protected Area Downgrading, Downsizing, and Degazettement (PADDD). Conserv. Lett. 2015, 8, 153–161. [Google Scholar] [CrossRef]
- Collins, M.B.; Mitchard, E.T.A. A small subset of protected areas are a highly significant source of carbon emissions. Sci. Rep. 2017, 7, 41902. [Google Scholar] [CrossRef]
- Blankespoor, B.; Dasgupta, S.; Wheeler, D. Protected areas and deforestation: new results from high-resolution panel data. Nat. Resour. Forum 2017, 41, 55–68. [Google Scholar] [CrossRef]
- UN. Convention on Biological Diveristy. 1992. Available online: https://www.cbd.int/doc/legal/cbd-en.pdf (accessed on 28 June 2017).
- UNEP. Protected Planet Report 2016: Data, Maps & Figures (April 2016). Available online: https://www.protectedplanet.net/c/protected-planet-report-2016/protected-planet-report-2016--data--maps-figures (accessed on 8 March 2019).
- UNFCCC. Adoption of the Paris Agreement. Draft decision -/CP.21. Conference of the Parties Twenty-first session Paris, 30 November to 11 December 2015. Available online: http://unfccc.int/resource/docs/2015/cop21/eng/l09.pdf (accessed on 29 December 2015).
- UNEP-WCMC, United Nations List of Protected Areas. Supplement on protected area management effectiveness; UNEP-WCMC: Cambridge, UK; Available online: https://www.sprep.org/attachments/VirLib/Global/2018-list-protected-areas.pdf (accessed on 8 August 2019).
- IUCN. IUCN Red List of Threatened Species. Version 2013.01; IUCN: Gland, Switzerland, 2013; Available online: www.iucnredlist.org/ (accessed on 12 June 2017).
- Bailey, D.; Schmidt-Entling, M.H.; Eberhart, P.; Herrmann, J.D.; Hofer, G.; Kormann, U.; Herzog, F. Effects of habitat amount and isolation on biodiversity in fragmented traditional orchards. J. Appl. Ecol. 2010, 47, 1003–1013. [Google Scholar] [CrossRef]
- Griffen, B.D.; Drake, J.M. Effects of habitat quality and size on extinction in experimental populations. Proc. R. Soc. B Boil. Sci. 2008, 275, 2251–2256. [Google Scholar] [CrossRef]
- Steve, P.; Jane, L. Millennium Ecosystem Assessment, Ecosystems and Human Well-Being: Biodiversity Synthesis; World Resources Institute: Washington, DC, USA, 2005. [Google Scholar]
- Newmark, W.D. Isolation of African protected areas. Front. Ecol. Environ. 2008, 6, 321–328. [Google Scholar] [CrossRef]
- The United Republic of Tanzania, TANZANIA’S FOREST REFERENCE EMISSION LEVEL SUBMISSION TO THE UNFCCC. 2017. Available online: https://redd.unfccc.int/files/frel__for__tanzania_december2016_27122016.pdf (accessed on 7 January 2019).
- UNEP, Convention on Biological Diversity. 2010. Available online: https://www.cbd.int/nbsap/targets/ (accessed on 27 November 2019).
- UNEP-WCMC. Protected Planet 2014–2019. 2019. Available online: https://www.protectedplanet.net/search?q=Tanzania (accessed on 1 February 2019).
- Bowker, J.N.; Vos, A.; Ament, J.M.; Cumming, G. Effectiveness of Africa’s tropical protected areas for maintaining forest cover. Conserv. Boil. 2017, 31, 559–569. [Google Scholar] [CrossRef]
- Rodriguez, N.; Armenteras, D.; Retana, J. Effectiveness of protected areas in the Colombian Andes: deforestation, fire and land-use changes. Reg. Environ. Chang. 2013, 13, 423–435. [Google Scholar] [CrossRef]
- Eklund, J.; Blanchet, F.G.; Nyman, J.; Rocha, R.; Virtanen, T.; Cabeza, M. Contrasting spatial and temporal trends of protected area effectiveness in mitigating deforestation in Madagascar. Boil. Conserv. 2016, 203, 290–297. [Google Scholar] [CrossRef]
- Cuenca, P.; Arriagada, R.; Echeverría, C. How much deforestation do protected areas avoid in tropical Andean landscapes? Environ. Sci. Policy 2016, 56, 56–66. [Google Scholar] [CrossRef]
- Gizachew, B.; Solberg, S.; Puliti, S. Forest Carbon Gain and Loss in Protected Areas of Uganda: Implications to Carbon Benefits of Conservation. Land 2018, 7, 138. [Google Scholar] [CrossRef]
- Lui, G.V.; Coomes, D.A. Tropical nature reserves are losing their buffer zones, but leakage is not to blame. Environ. Res. 2016, 147, 580–589. [Google Scholar] [CrossRef] [PubMed]
- Hall, J.; Burgess, N.D.; Lovett, J.; Mbilinyi, B.; Gereau, R.E. Conservation implications of deforestation across an elevational gradient in the Eastern Arc Mountains, Tanzania. Boil. Conserv. 2009, 142, 2510–2521. [Google Scholar] [CrossRef]
- Green, J.M.; Larrosa, C.; Burgess, N.D.; Balmford, A.; Johnston, A.; Mbilinyi, B.P.; Platts, P.J.; Coad, L. Deforestation in an African biodiversity hotspot: Extent, variation and the effectiveness of protected areas. Boil. Conserv. 2013, 164, 62–72. [Google Scholar] [CrossRef]
- Hall, J.M.; Burgess, N.D.; Rantala, S.; Vihemäki, H.; Jambiya, G.; Gereau, R.E.; Makonda, F.; Njilima, F.; Sumbi, P.; Kizaji, A. Ecological and Social Outcomes of a New Protected Area in Tanzania. Conserv. Boil. 2014, 28, 1512–1521. [Google Scholar] [CrossRef]
- Pfeifer, M.; Burgess, N.D.; Swetnam, R.D.; Platts, P.J.; Willcock, S.; Marchant, R. Protected Areas: Mixed Success in Conserving East Africa’s Evergreen Forests. PLoS ONE 2012, 7, e39337. [Google Scholar] [CrossRef]
- Giliba, R.A.; Mafuru, C.S.; Paul, M.; Kayombo, C.J.; Kashindye, A.M.; Chirenje, L.I.; Musamba, E.B. Human Activities Influencing Deforestation on Meru Catchment Forest Reserve, Tanzania. J. Hum. Ecol. 2011, 33, 17–20. [Google Scholar] [CrossRef]
- Seiferling, I.S.; Proulx, R.; Peres-Neto, P.R.; Fahrig, L.; Messier, C. Measuring Protected-Area Isolation and Correlations of Isolation with Land-Use Intensity and Protection Status. Conserv. Biol. 2012, 26, 610–618. [Google Scholar] [CrossRef]
- Behr, D.C.; Cunningham, E.M.; Kajembe, G.; Mbeyale, G.; Nsita, S.; Rosenbaum, K.L. Benefit Sharing in Practice: Insights for REDD+ Initiatives; Program on Forests (PROFOR): Washington, DC, USA, 2012. [Google Scholar]
- Climate-Smart Agriculture Guideline for the United Republic of Tanzania: A Country–Driven Response to Climate Change, Food and Nutrition Insecurity. 2017. Available online: http://www.fao.org/3/a-i7157e.pdf (accessed on 4 December 2019).
- Felix, M.; Gheewala, S.H. A Review of Biomass Energy Dependency in Tanzania. Energy Procedia 2011, 9, 338–343. [Google Scholar] [CrossRef]
- Nzunda, E.F.; Midtgaard, F. Deforestation and loss of bushland and grassland primarily due to expansion of cultivation in mainland Tanzania (1995–2010). J. Sustain. For. 2019, 38, 509–525. [Google Scholar] [CrossRef]


| PA Management Regimes | Number of PAs | Management Regime Total Area (1000 ha) | Managing Authority |
|---|---|---|---|
| Forest plantations | 23 | 73 | Tanzania Forest Services |
| Forest Reserves | 625 | 9316 | Tanzania Forest Services |
| Game Controlled Areas | 19 | 7101 | Tanzania Wildlife Management Authority |
| Game Reserves | 19 | 9426 | Tanzania Wildlife Management Authority |
| National Parks | 16 | 4851 | Tanzania National Parks Authority |
| Nature Reserves | 6 | 200 | Tanzania Forest Services |
| Total | 708 | 30,967 | Tanzania, National |
| PA Management Regime | Deforestation (ha) | Deforestation, Percent of Forested Area within PA | Deforestation, Percent of the Management Area |
|---|---|---|---|
| Forest plantations | 875 | 1.4 | 1.2 |
| Forest Reserves | 806,544 | 12.6 | 8.6 |
| Game Controlled Areas | 432,280 | 13.4 | 6.1 |
| Game Reserves | 267,060 | 5.4 | 2.8 |
| National Parks | 37,875 | 2.2 | 0.78 |
| Nature Reserves | 446 | 0.2 | 0.22 |
| Total | 1,545,080 | 9.3 | 5 |
© 2020 by the authors. Licensee MDPI, Basel, Switzerland. This article is an open access article distributed under the terms and conditions of the Creative Commons Attribution (CC BY) license (http://creativecommons.org/licenses/by/4.0/).
Share and Cite
Gizachew, B.; Rizzi, J.; Shirima, D.D.; Zahabu, E. Deforestation and Connectivity among Protected Areas of Tanzania. Forests 2020, 11, 170. https://doi.org/10.3390/f11020170
Gizachew B, Rizzi J, Shirima DD, Zahabu E. Deforestation and Connectivity among Protected Areas of Tanzania. Forests. 2020; 11(2):170. https://doi.org/10.3390/f11020170
Chicago/Turabian StyleGizachew, Belachew, Jonathan Rizzi, Deo D. Shirima, and Eliakimu Zahabu. 2020. "Deforestation and Connectivity among Protected Areas of Tanzania" Forests 11, no. 2: 170. https://doi.org/10.3390/f11020170
APA StyleGizachew, B., Rizzi, J., Shirima, D. D., & Zahabu, E. (2020). Deforestation and Connectivity among Protected Areas of Tanzania. Forests, 11(2), 170. https://doi.org/10.3390/f11020170