Article

Avian Response to Wildfire Severity in a Northern Boreal Region

1
Department of Renewable Resources, General Services Building, University of Alberta, Edmonton, AB T6G 2H1, Canada
2
Environment and Climate Change Canada, 5019 52nd Street, Yellowknife, NT X1A 2P7, Canada
3
Department of Biological Sciences, University of Alberta, Edmonton, AB T6G 2E9, Canada
*
Author to whom correspondence should be addressed.
Forests 2020, 11(12), 1330; https://doi.org/10.3390/f11121330
Submission received: 5 November 2020 / Revised: 8 December 2020 / Accepted: 10 December 2020 / Published: 14 December 2020
(This article belongs to the Special Issue Ecological Response to Wildfire)

Abstract

:
Research Highlights: The effects of fire on birds in the most northern parts of the boreal forest are understudied. We found distinct differences in bird communities with increasing fire severity in two vegetation types with naturally different burn severity. The highest severity burns tended to have communities dominated by generalist species, regardless of the original vegetation type. Background and Objectives: Wildfire is the primary natural disturbance in the boreal ecosystems of northwestern Canada. Increased wildfire frequency, extent, and severity are expected with climate change in this region. In particular, the proportion of burns that are high severity and the area of peatlands burned are increasing, and how this influences birds is poorly understood. Materials and Methods: We quantified the effects of burn severity (low, moderate, and high severity) in uplands and peatlands on occupancy, density, richness, community composition, and functional diversity using point counts (n = 1158) from the first two years post-fire for two large fires in the Northwest Territories, Canada. Results: Burn severity had a significant effect on the occupancy and density of 86% of our focal species (n = 20). Responses to burn severity depended on vegetation type for four of the 18 species using occupancy and seven of the 18 using density, but were typically in a similar direction. Species richness and functional diversity were lower in areas of high severity burns than unburned areas and low severity burns in peatlands. Richness was not related to severity in uplands, but functional diversity was. Peatlands had higher species richness than uplands in all burn severities, but as burn severity increased the upland and peatland communities became more similar. Conclusions: Our results suggest that high severity burns in both vegetation types support five generalist species and two fire specialists that may benefit from alterations in vegetation structure as a result of climate induced changes to fire regimes. However, eight species avoided burns, particularly birds preferring peatlands, and are likely to be more susceptible to fire-driven changes to their habitat caused by climate change. Understanding the long-term risks to these species from climate change requires additional efforts that link fire to bird populations.

1. Introduction

The boreal forest of North America includes the ranges of half of all bird species in North America [1] and provides breeding habitat for several billion songbirds [2,3]. While some generalist species found in the boreal have increased in abundance over the last 50 years, many forest birds are showing evidence of long-term declines [3,4]. However, there are important gaps in our understanding of the distribution, abundance, habitat associations, threats, and trends for birds in the boreal, particularly those breeding in the far north [2,5]. Given northern boreal ecosystems have different climatic, disturbance, and successional trajectories than southern boreal ecosystems where trend data are typically collected, there is considerable uncertainty about changes in northern birds to date and how they will respond to changes in disturbance dynamics linked to climate change.
Wildfire is the dominant natural disturbance in the western boreal forest [6]. In the northern boreal Taiga Plains ecozone (Figure 1), the fire regime is characterized by large, frequent, and high intensity wildfires [7]. In extreme fire years, wildfires result in high severity burns, where most trees are killed and most or all understory vegetation is consumed [8]. However, even in severe fires approximately 15% of the vegetation within fire boundaries remains unburned [9] due to the presence of water [10], topographic variation, or changes in weather conditions during the fire [11]. Patches of forest with low burn severity, where a small proportion of trees, understory vegetation, and groundcover are killed, are common within large areas of otherwise high severity burns [12]. The variation in burn severity, as well as frequency of wildfire and area burned, creates spatio-temporal heterogeneity in forest structure and composition [13,14] resulting in a broad range of habitats for birds.
In the northwest boreal of Canada, peatlands, i.e., wetlands with a thick (>40 cm) layer of organic matter [15], make up almost half of the land base [16]. Peatlands such as fens, particularly those with high water tables [17] and groundwater connectivity, are assumed to be more resistant to wildfire than other forested areas [18] and thus should burn at a lower severity in a typical year [19]. However, peatlands contain trees, shrubs, and a thick layer of organic matter that may be highly flammable under extremely dry conditions [20]. Uncertainty in how intensely peatlands burn makes understanding how fire influences birds in this vegetation type uncertain. In contrast, uplands, particularly pine stands, rely on fire for regeneration [21]. Thus, the bird species that use uplands, may be better adapted to frequent, high severity wildfire than species that use peatlands.
Species diversity of birds tends to decrease the further north one goes [22]. Higher avian diversity in the southern versus northern boreal may be partially attributed to a wider range of forest ages, caused by a longer fire return interval and greater variation in forest flammability due to greater variation in soils, hydrology, and trees species further south all of which influence fire patterns and successional trajectories [23]. In northern boreal regions, succession is relatively simple because the dominant tree and shrub species present before wildfire often regenerate post-fire to the same vegetation type without intermediate successional stages (i.e., mixed-wood forests are less common further north) [24].
Past work has investigated how boreal birds respond to wildfire in southern boreal regions, primarily in upland mixed-woods [25,26,27,28,29]. In these regions, bird communities differ significantly between unburned and burned forests. However, few studies in the boreal forest have addressed whether bird communities vary as a function of burn severity [30]. In other forested areas of North America, aerial insectivores and cavity nesters tend to respond positively to higher burn severities because of a more open canopy for foraging [31], with some species almost completely restricted to severely burned forests [32]. Species associated with early seral forest (e.g., <20 years old), including some ground nesters, tend to respond positively to high severity fires, but only for a few years after the burn [33]. Mature forest specialists generally respond negatively or completely avoid high severity fires for many years as the complex forest structure (i.e., heterogeneity in canopy, sapling, shrub, and ground vegetation cover) is lost [34]. However, species associated with mature forests can occur in lower severity fires immediately post-fire if some structural complexity is maintained. These relationships reflect the wide range of species-specific requirements in terms of habitat structure to maximize survival and reproduction, e.g., food availability, nesting substrate, concealment from nest predators, etc.—the “niche gestalt hypothesis” [35]. Whether such changes will be observed in more northern ecosystems, that historically have large, frequent, and intense wildfires and simpler forest succession are unknown (“resistance hypothesis”). Some evidence from the eastern boreal and western United States suggests that bird communities in regions with higher disturbance frequencies are more resistant (i.e., show less change) to disturbance than regions with less frequent disturbance [36,37]. Higher resistance to natural disturbances would suggest that northern boreal birds may be better equipped to deal with altered fire regimes caused by climate change and maintain their key ecological functions then their southern boreal counterparts.
Given that wildfires have been historically prominent across the northern boreal region and this disturbance regime is changing in response to climate, we aimed to quantify how wildfires shape bird communities at the northern edge of the boreal forest in the Northwest Territories (NWT), Canada (Figure 1). Specifically, we tested for effects of burn severity (unburned, low, moderate, and high), vegetation type (peatland and upland), and their interaction on the occupancy and density of 20 bird species and community metrics for 42 species (species richness, community composition, and functional diversity) using avian point count data collected during the first two years following large wildfires in the Taiga Plains ecoregion. Based on the niche gestalt hypothesis, we predicted that there would be greater changes in all metrics with increasing burn severity as stand structure became more homogeneous. We also predicted, based on the resistance hypothesis, that the bird community in peatlands would experience a larger negative effect of burn severity than uplands because wildfires have historically been more frequent, large, and severe in uplands.

2. Materials and Methods
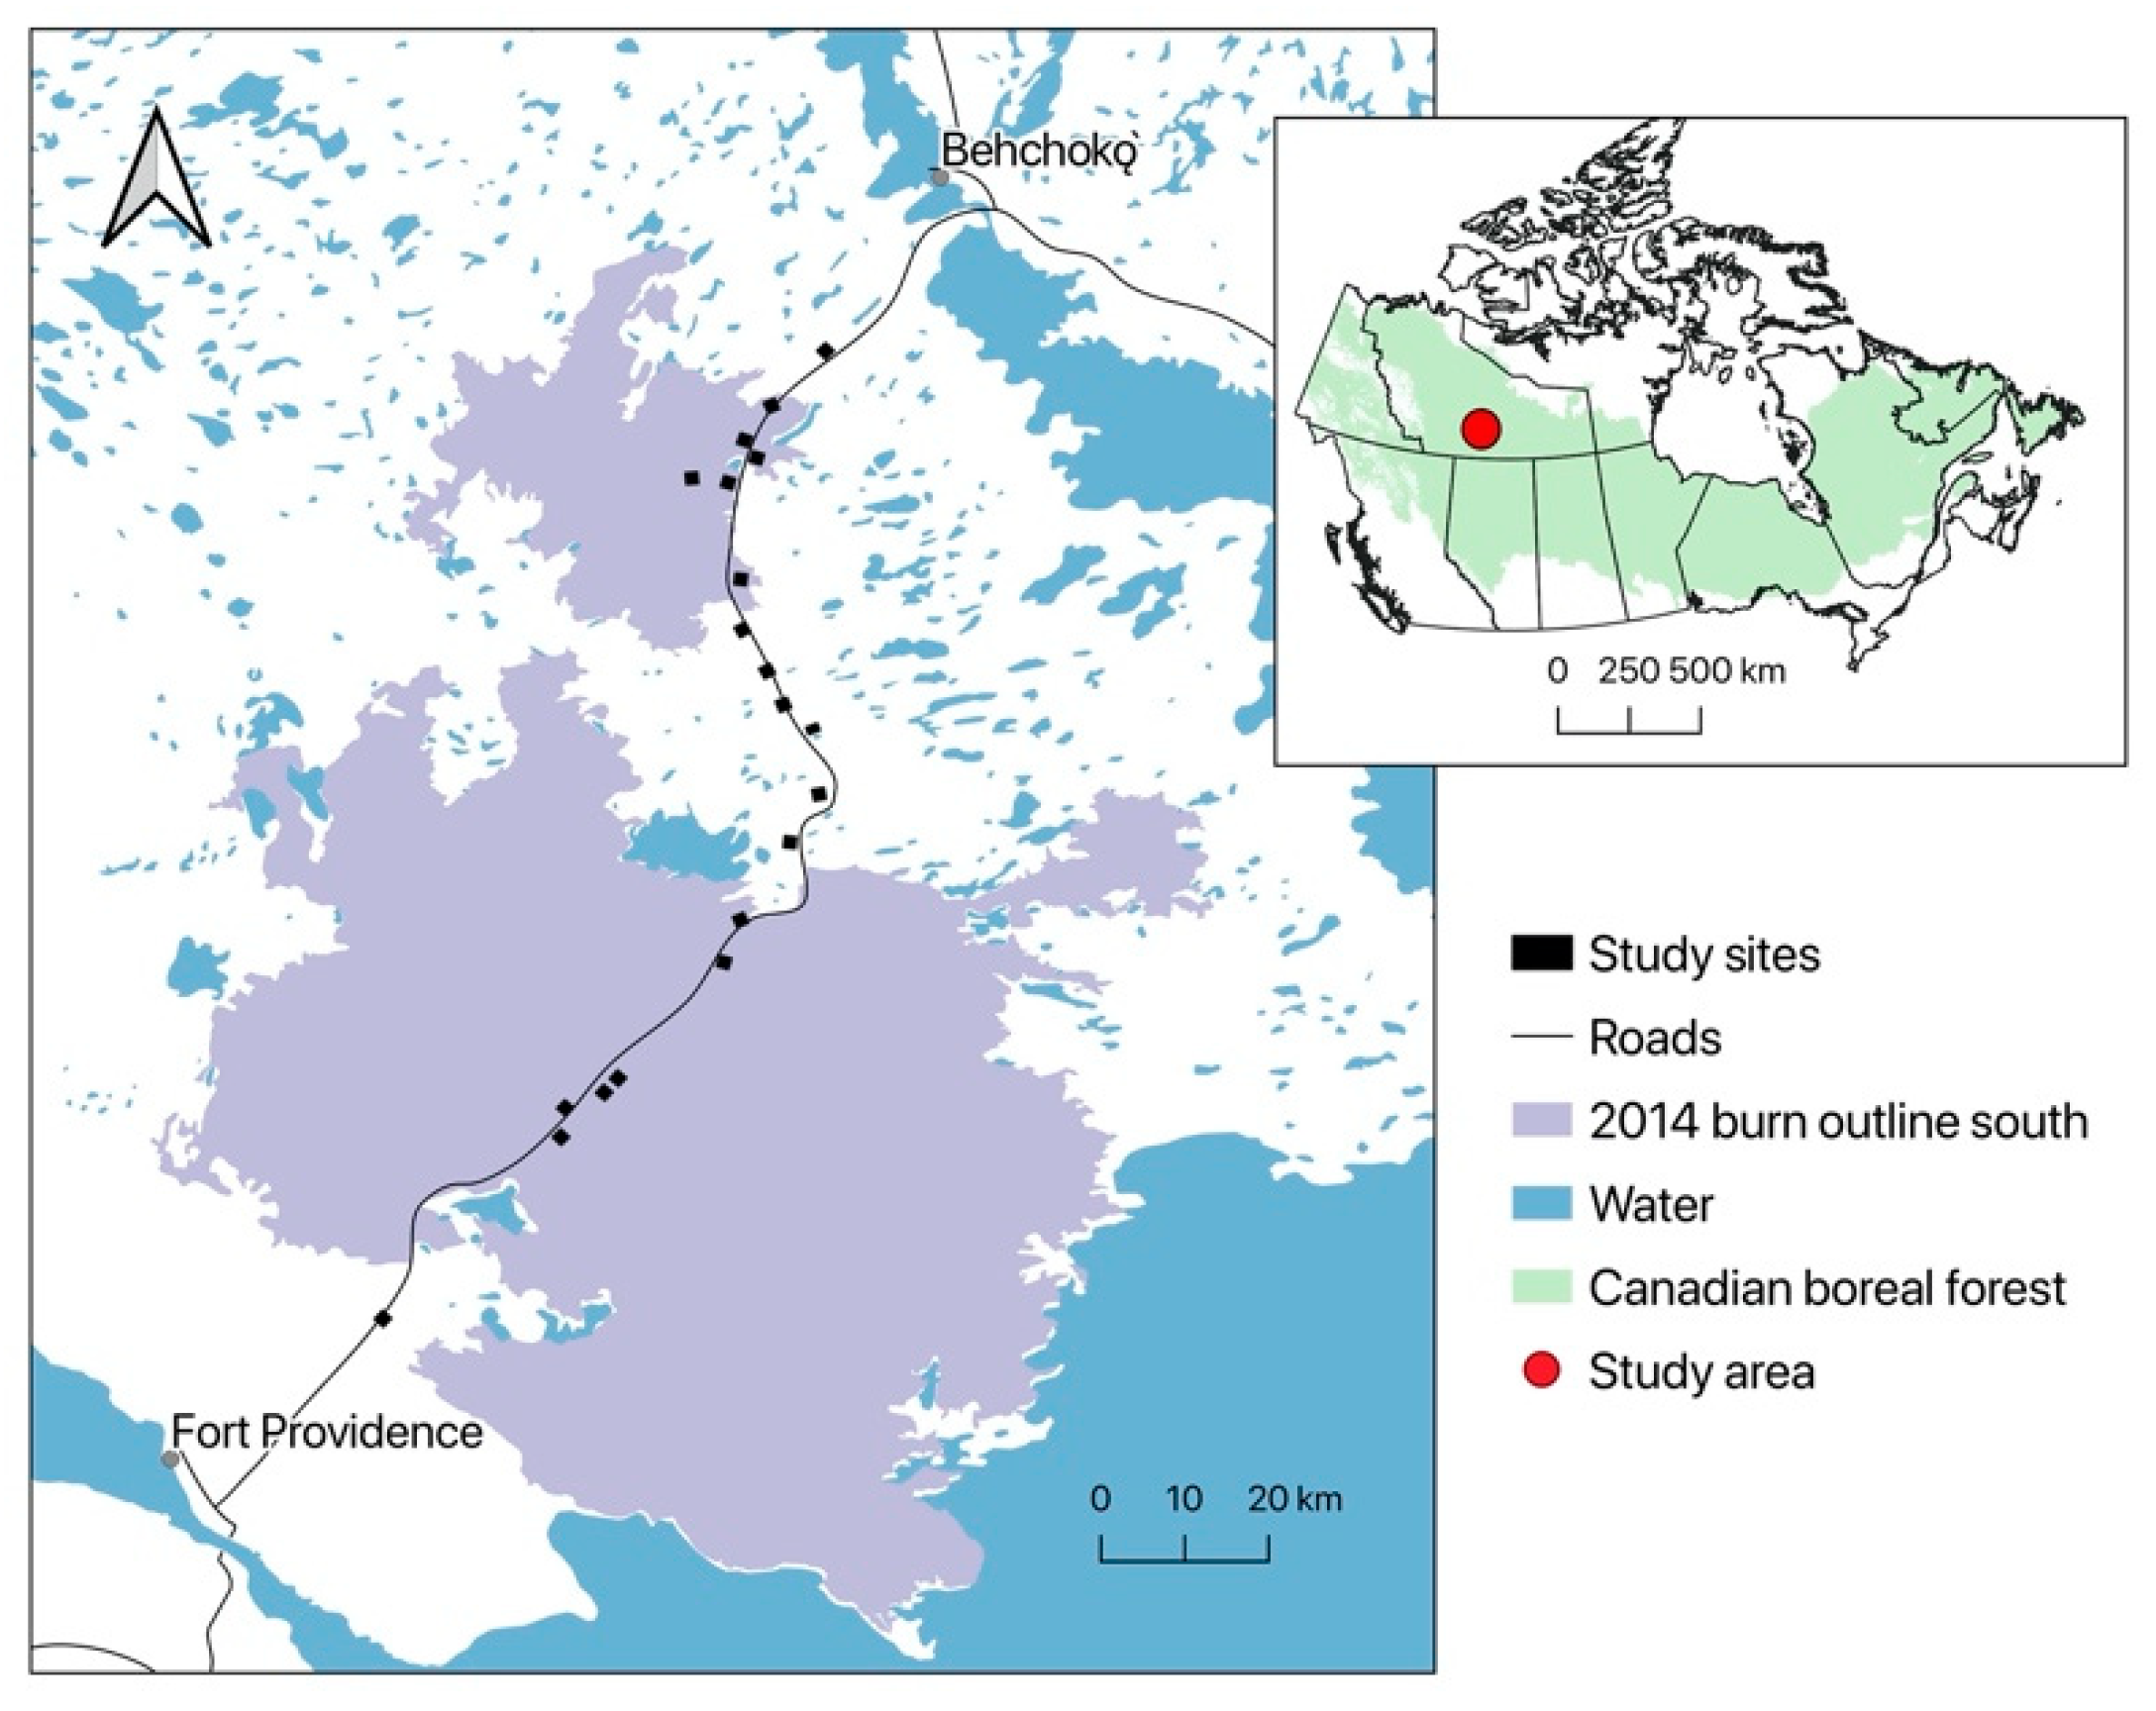
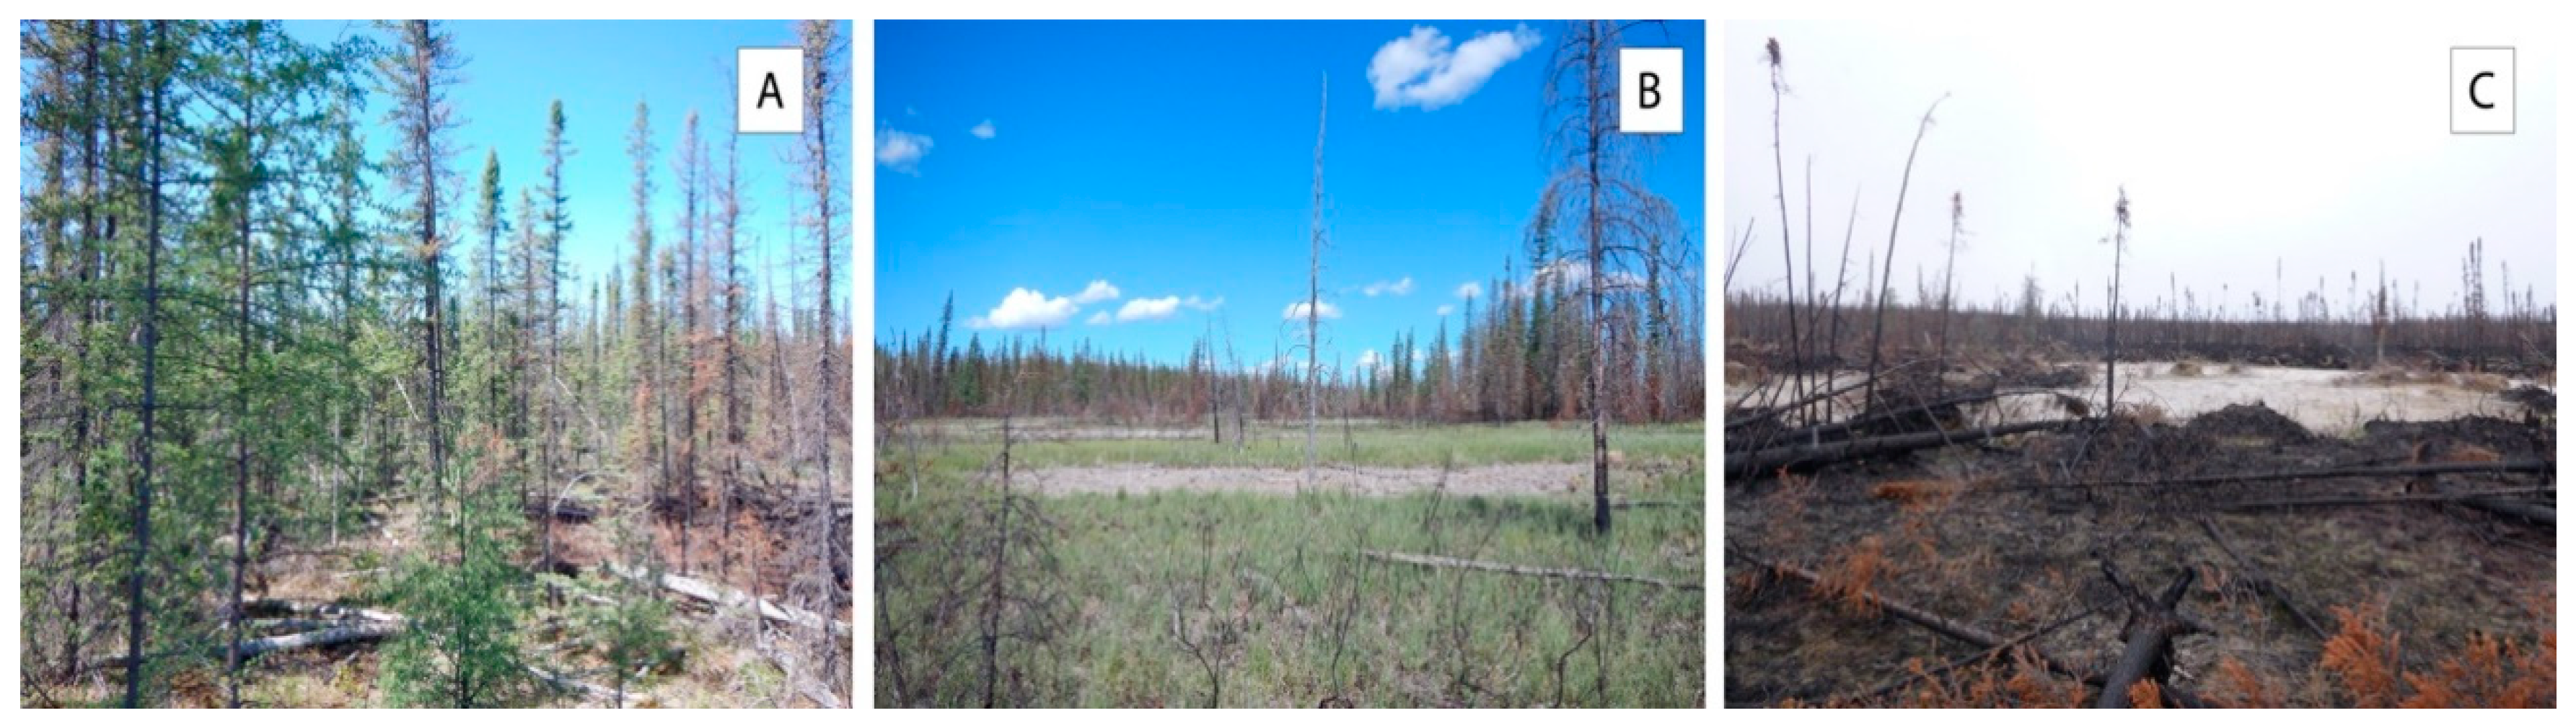
2.1. Study Area

The study took place between Fort Providence and Behchok ǫ ` , in the Taiga Plains ecozone of the Northwest Territories, Canada (Figure 1). These communities are within the unceded territory of the Dehcho First Nation and the Tłı̨chǫ Mǫwhi Gogha Dè Nı̨ı̨tèè (boundary from the Tłı̨chǫ Agreement negotiated by the Dogrib Treaty 11 Council), respectively. The study area intersected two large burns (750,000 ha and 110,000 ha). These wildfires occurred in June and July 2014 during a record fire year, where 3,400,000 ha of the Northwest Territories burned [38]. This contrasts with an annual average area burned of 600,000 ha (1975–2014; [39]). The Taiga Plains ecozone is comprised of approximately 50% upland, 40% wetland (mainly peatland), and 10% open water [39]. From 1981–2010, the region surrounding the study area averaged between 289–387 mm of yearly precipitation (mean annual precipitation) and daily temperatures of −2.5 and −4.3 °C (mean annual temperature; [40]). With the exception of some shallow, inorganic mineral ponds, wetlands were primarily peatlands consisting of treed fens and bogs dominated by black spruce (Picea mariana (Mill.) B.S.P.; [16]) and dense shrub cover (e.g., Salix spp., Alnus spp.). All wetlands will hereafter be referred to as peatlands. Upland forests were dominated by jack pine (Pinus banksiana Lamb.) and some trembling aspen (Populus trembloides), with a generally closed canopy and sparse understory [16]. The Taiga Plains ecozone in the Northwest Territories is relatively unaltered by anthropogenic activities [16]. The study area had limited human disturbance with one highway, a few secondary roads, and limited non-commercial logging in some upland stands.

2.2. Sampling Design and Avian Surveys

A total of 1158 unlimited distance point count surveys were conducted between 25 May and 1 July in 2015 and 2016 using autonomous recording units (ARUs; Wildlife Acoustic SM3 model in 2015 and SM4 model in 2016). Point count stations (n = 405) were grouped into 16 study sites with sampling stations in a 5 × 5 grid in 2015, and 20 sites with stations in 4 × 4 grids in 2016. Using a stratified random sampling design to place the grids, we surveyed 89 low severity (n = 80/56; 2015/2016), 75 moderate severity (n = 63/57), 114 high severity burn (n = 103/76), and 127 unburned (control; 91/53) stations, for a total of 579 unique stations surveyed over the two years. A total of 174 stations were surveyed in both years. A number of control stations (n = 142) either burned between sampling years or were found to have recently burned once sampling in the field occurred and were therefore not included in the analyses. For logistical reasons, stations were located within 2.5 km of roads, but at least 300 m from roads to minimize edge effects and interference of vehicle noise on recordings. Control sites were located between 1 and 15 km from burn perimeters and had not experienced wildfire in the past 43 years. These sites were randomly selected among a pool of candidate sites within this 15 km buffer and along the highway.
Burn severity was estimated using data from a continuous differenced normalized burn ratio (dNBR) layer (cell size = 30 m; [41]). The dNBR was calculated and validated as changes in reflectivity of Landsat imagery taken before and after the wildfires [41]. We used the average dNBR in a 100 m buffer around each station to categorize burn severity as low, moderate, or high [42,43]. In low severity burns, trees and some shrubs survived (dNBR < 279; [44,45]). Unburned areas within the fire perimeter were also categorized as low severity. In moderate severity burns, some trees, shrubs, downed woody material, and soil were consumed (dNBR = 279–525). High severity burns resulted in most trees being killed, most shrubs consumed, and exposure of mineral soil (dNBR > 525; Figure 2). The Northwest Territories Forest Inventory layer [46] was used to determine the dominant vegetation type in 100 m buffers around each station (n = 272/133 upland/peatland).
ARUs were deployed at each site for 3 to 4 consecutive days to increase the chances of capturing at least two mornings of good weather, while maximizing the number of sampling stations that could be surveyed given our limited number of ARUs. Two 3 min recordings, at dawn from two different days with minimal or no wind or rain, were interpreted by human observers [47]. Recordings were randomly assigned to 4 observers. A species was considered present if a male vocalization was heard at least once on a recording. Passerine, grouse, and woodpecker species that defend relatively small territories, and are not gregarious or nomadic were considered for analysis. Some earlier studies comparing ARUs to human observers found that fewer species were detected and that species’ detectable distances were lower using ARUs [47,48,49]. However, the recording quality of ARUs has improved considerably, resulting in similar species detections as traditional in-person surveys in our study area [50], and [51] demonstrated that distance detection using ARUs is possible.

2.3. Statistical Analysis
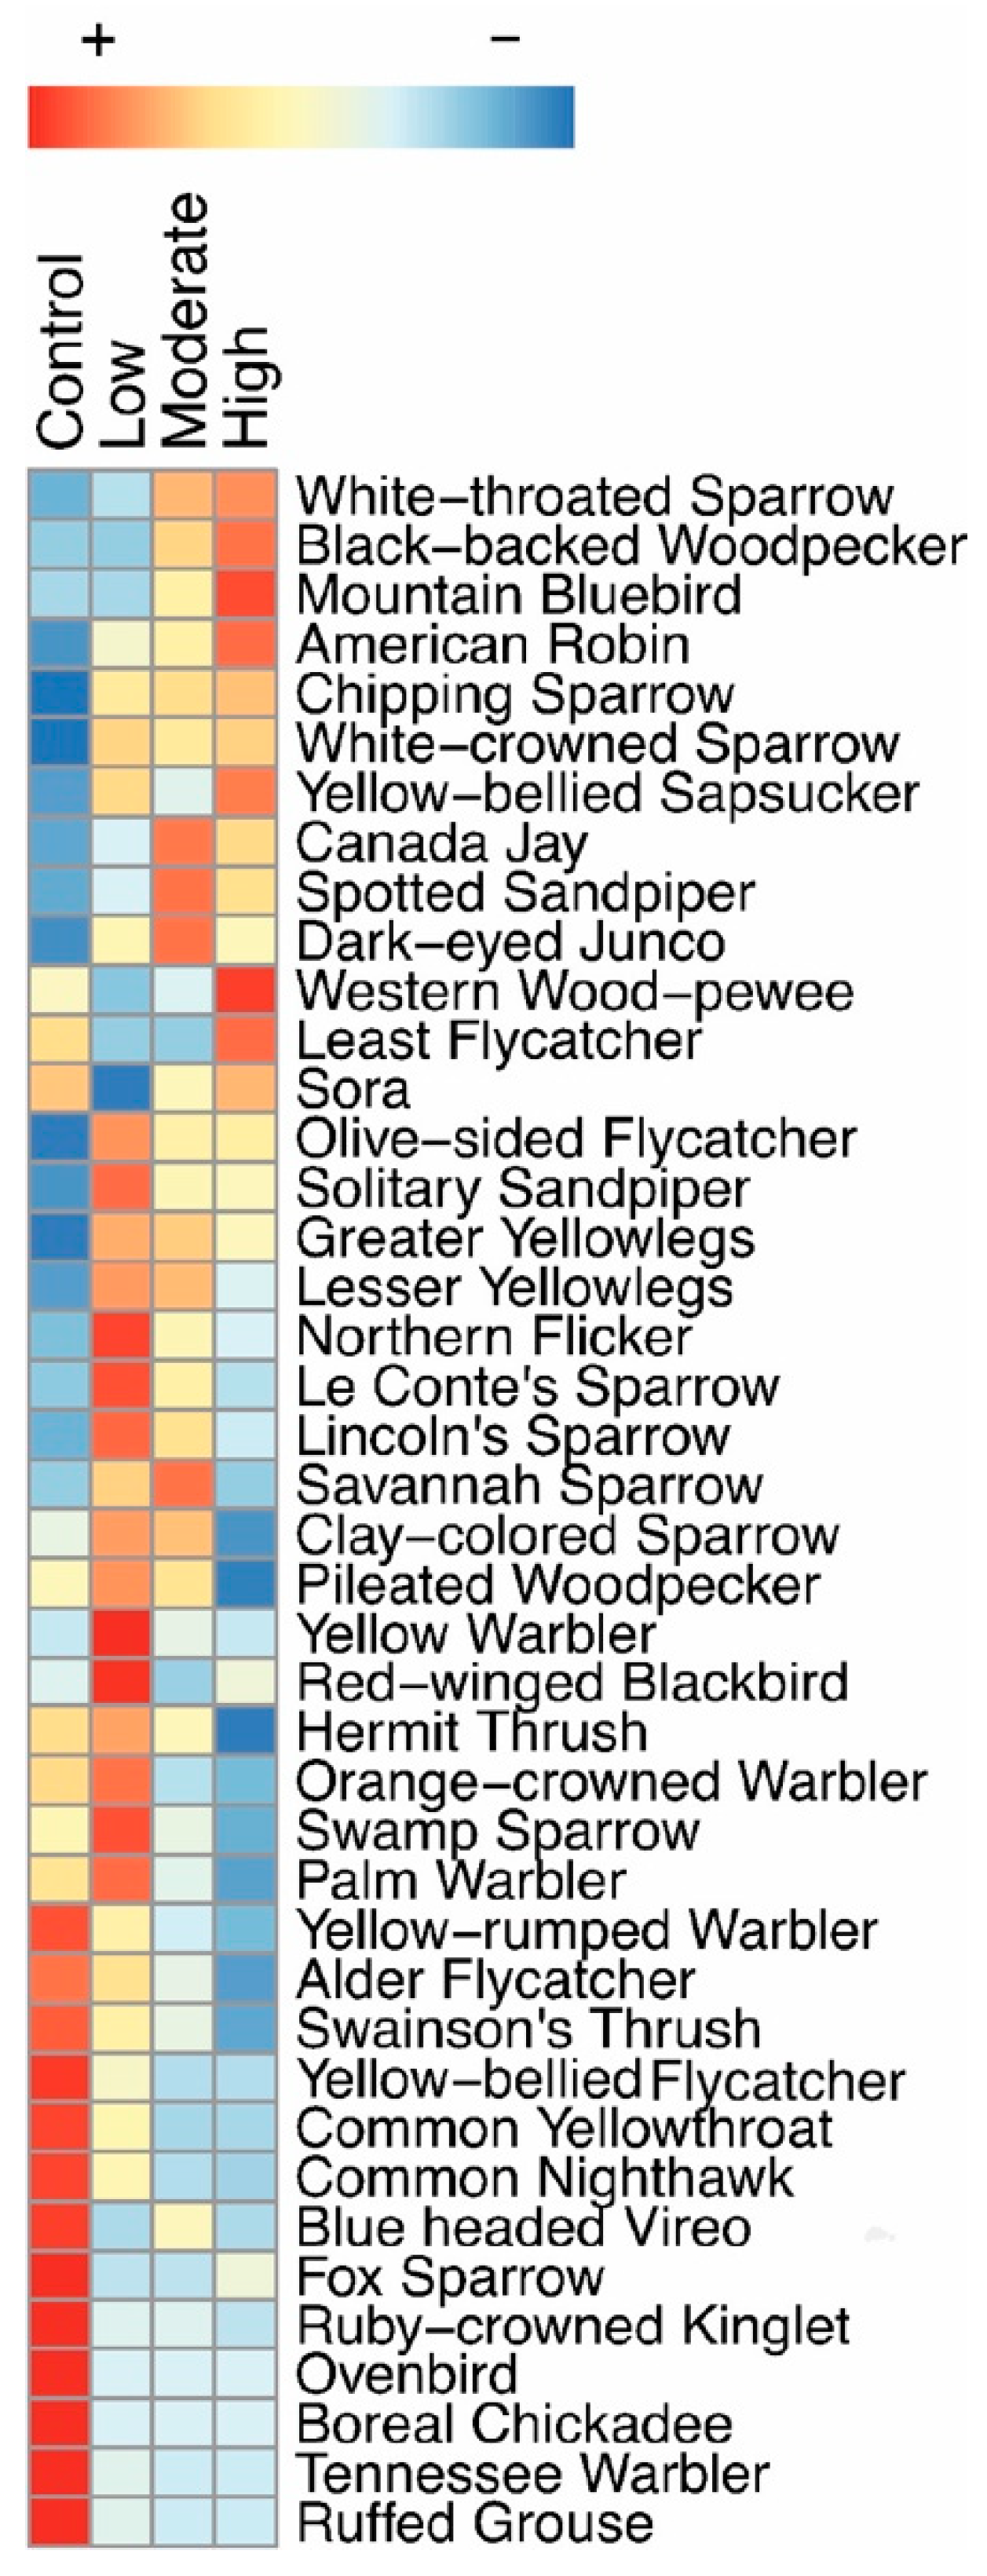
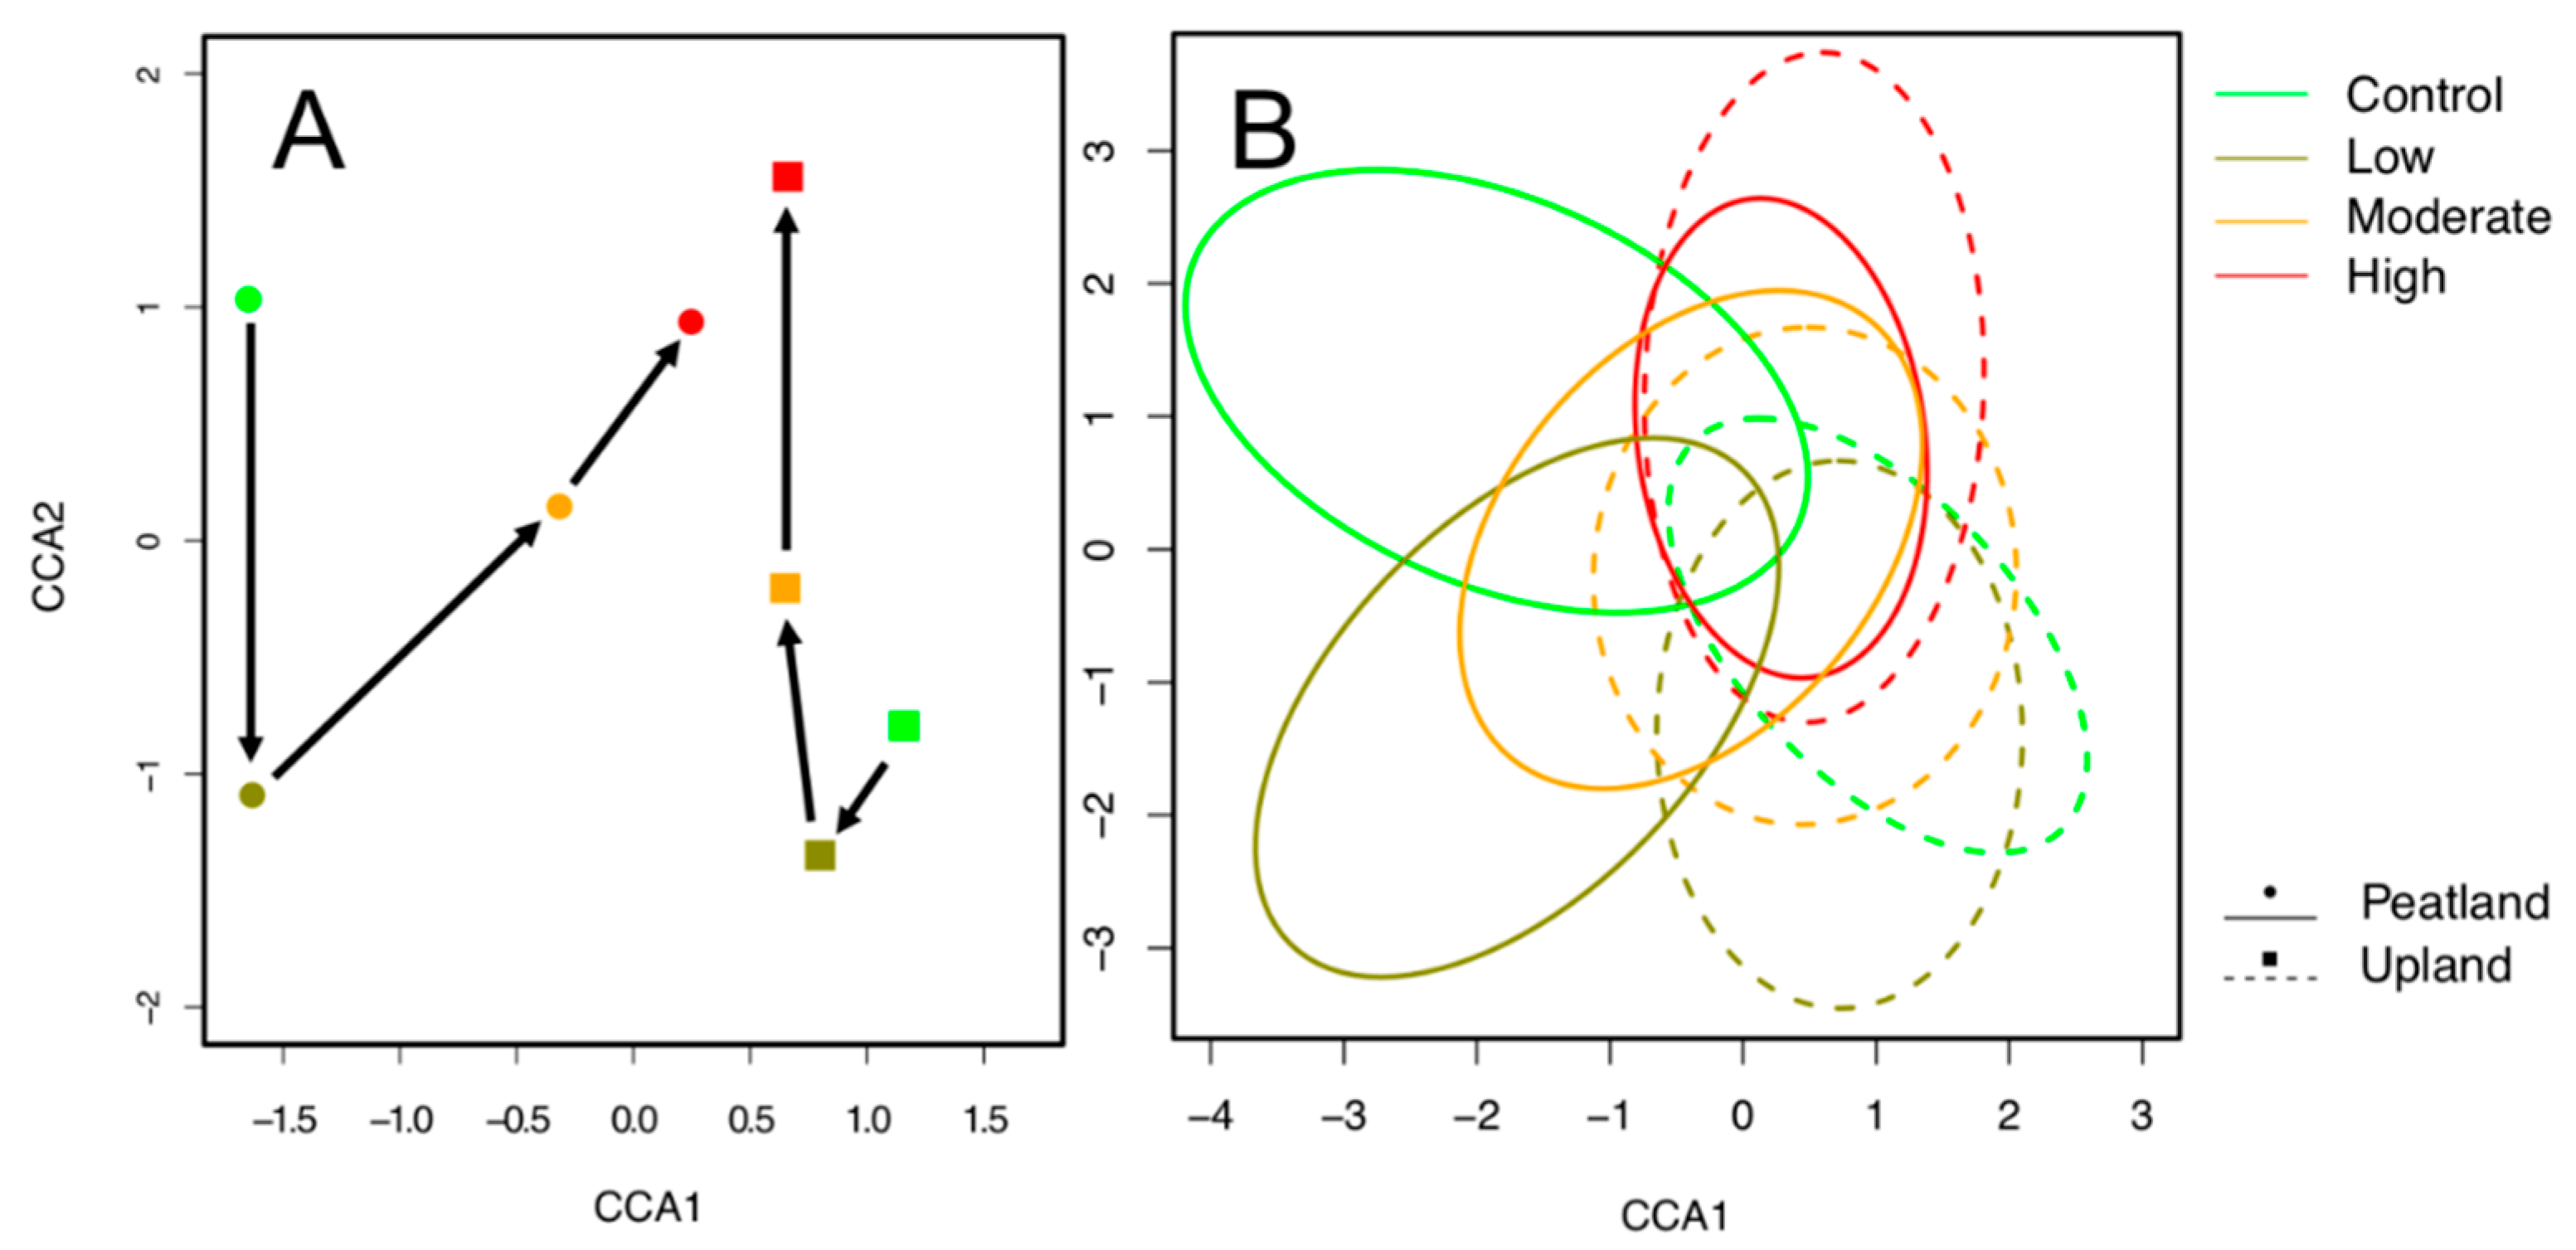
We calculated occupancy and density for species detected at more than nine stations. We predicted changes in species-specific occupancy using single-season occupancy models in the program Presence 2.12.37 [52]. Occupancy is an estimate of the probability that a species uses the area around an ARU at least once over the length of the survey season that accounts for imperfect detection (i.e., situation where a species uses a location, but was not observed when the observer collected the data).
As the number of individuals per station was higher than one for several species, we also estimated species-specific densities using generalized linear mixed models (GLMM). We evaluated Poisson and negative binomial error distributions to determine the best fit to the data using likelihood ratio-tests to compare the fit of each distribution. Each ARU station was included as a random effect to account for non-independence of our sampling units within and between years.
Our approach to computing density relied on the QPAD method [53,54]. In brief, QPAD creates statistical offsets that converts unlimited distance point counts into densities based on known effective detection radii (EDR) for individual species. Distance estimates are corrected for differences in EDR based on how sound travels in different vegetation types. The method also accounts for differences in singing rate based on day of year and time of day using a removal model that adjusts for the probability the species was present, but not observed when the ARU was recording. Density modeling was completed in Stata version 16.1.
The first step in our occupancy analysis was to identify the factors influencing detection error. Surveys were conducted at the same time of day and, by design, were conducted only during optimal survey conditions, so we only evaluated how day of the year (continuous) and year of survey (categorical) influenced detection rate. Using Akaike’s information criteria (AIC) we selected the most parsimonious model explaining detection error before modeling factors that influenced occupancy. The QPAD offsets corrected for day of year so only year was included in the density models.
Accounting for the nuisance variables that influenced detection error in occupancy and through QPAD offsets, we then generated 11 models that we compared using AIC. Our base model was a constant occupancy rate or density adjusted for factors influencing detection rate. We then evaluated how three definitions of burn influenced occupancy or density: (1) control, low, moderate, and high treated as a categorical variable we labelled burn_category; (2) control, low, moderate, and high ranked from 1 to 4 respectively and modelled as a continuous linear variable we labelled burn_rank; and (3) control vs. burned (pooled low, moderate, and high) and modelled as a categorical variable that we labelled burn_binary. Burn_category allowed for non-linear responses to burn intensity, burn_rank hypothesized birds changed as a linear function of burn intensity, and burn_binary assumed all types of burns regardless of severity influenced bird occupancy. Vegetation type was modelled as categorical variable (upland coded as one and peatland coded as zero). Models that evaluated the fit of the burn variable and the vegetation variable alone were compared to models with both burn and vegetation variables, and models with burn × vegetation interactions. We present results from the model with the lowest AIC. When two or more models had delta AIC within two, we presented the results from the model with the fewest parameters. Occupancy and density estimates for each species in the eight vegetation type/burn severity categories were then correlated to determine if similar quantitative patterns were revealed by density and occupancy.
Species richness was used to measure changes in number of species per sampling station as opposed to other diversity metrics, such as Shannon and Simpson indices, because results were similar. Three ways of measuring species richness were evaluated. We measured the number of species observed during each point count survey (alpha-visits) and at each station over all visits (alpha-station). Generalized linear models with Gaussian distribution were used to fit various diversity metrics. Finally, we computed gamma richness within the eight vegetation type/burn severity categories. As the number of surveys differed between the vegetation type/burn severity categories, we randomly selected 70 surveys from each vegetation type/burn severity category. This was completed 1000 times to compute an average gamma richness with a 95% confidence interval for each category. All richness models were computed in Stata version 16.1.
Species richness and diversity are often used to measure how birds respond to fire. However, metrics that also measure the abundance and diversity of traits (e.g., life history traits or guilds) in a community may be a more effective way to understand changes in community structure and risks to ecosystem function [55]. For example, forest bird species richness can be stable, while β-diversity, guilds, and/or functional diversity at the same location have regularly been shown to change as a function of human disturbance [56,57] and climate change [58]. Thus, using functional diversity metrics provides a more comprehensive understanding of how bird communities change in response to fire. Functional diversity was quantified using Rao’s quadratic entropy (hereafter “Rao’s Q”; R package “FD” [59]). We used life history traits that describe species’ primary foraging and migration strategies, as well as substrates used for foraging, breeding, and nesting from the Avian Life History Information Database (http://www.on.ec.gc.ca/wildlife/wildspace/project.cfm; Appendix A Table A1). All traits were categorical and transformed to continuous values by calculating the Gower distance. For all community analyses, species detected at fewer than three stations were not included (after [60]), and counts of individuals for each species were used as we could not estimate densities for all species detected. The maximum count of individuals for each species from the multiple visits to a station each year were used when calculating functional diversity.
Changes to community composition were tested using a partial canonical correspondence analysis (pCCA; R package “vegan”, [61]). A pCCA determines the amount of variation in species abundance data that is explained by environmental variables [61] and distributes stations in the most parsimonious multivariate space to visually depict similarities and shifts in community composition. A permutation test with 999 permutations was used to determine the significance of the variation explained by the burn severity × vegetation type interaction after controlling for conditional variables (year and study site). To partition the amount of variation that was explained by burn severity alone, vegetation type alone, and their interaction, we also built models with: (1) severity as the main effect and vegetation type as an additional conditional variable and (2) vegetation type as the main effect with burn severity as an additional conditional variable (as per [62]). β-diversity was measured using a test for homogeneity of multivariate dispersion, or the amount of variability in species composition among treatment types, using a permutation test [61] in the R package “vegan”. Although conditional variables could not be included, dispersion provides information about differences in β-diversity among treatment types that the other methods could not calculate. Bray–Curtis dissimilarity was used for all community composition analyses because it is suitable for analyzing count data with a high number of zeros [63]. Results from the pCCA were presented as an ordination with 67% confidence ellipses to show where the majority of the stations of each treatment type were located in two-dimensional space.

3. Results

We detected a total of 59 species. Of the 42 species included in community analyses, five were detected in burns only: black-backed woodpecker (Picoides arcticus), mountain bluebird (Sialia currucoides), savannah sparrow (Passerculus sandwichensis), white-crowned sparrow (Zonotrichia leucophrys), and yellow-bellied sapsucker (Sphyrapicus varius). Two species were detected in controls only: boreal chickadee (Poecile hudsonicus) and ovenbird (Seiurus aurocapillus). No species were found exclusively in high severity burns (Figure 3). Seven species were found in low and moderate, but not high severity burns: blue-headed vireo (Vireo solitarius), common yellowthroat (Geothlypis trichas), ruby-crowned kinglet (Regulus calendula), ruffed grouse (Bonasa umbellus), savannah sparrow (Passerculus sandwichensis), yellow-bellied flycatcher (Empidonax flaviventris), and yellow warbler (Setophaga petechia).
For the 20 species with sufficient number of detections to estimate occupancy and density, we found evidence of differences in occupancy related to burns versus controls for 18 species. We also found 18 species that showed some form of differences in density in response to fire, although they were not exactly the same species. LeConte’s sparrow (Ammodramus leconteii) and palm warbler (Dendroica palmarum) showed no strong evidence of a response to fire in occupancy models, while LeConte’s sparrow and ruffed grouse showed no strong evidence of a response to fire in density models.
Alder flycatcher (Empidonax alnorum), common yellowthroat, orange-crowned warbler (Vermivora celata), ruby-crowned kinglet, ruffed grouse, Swainson’s thrush (Catharus ustulatus), swamp sparrow (Melospiza georgiana), and yellow-rumped warbler (Setophaga coronate) all responded negatively to fire (Table 1). The common yellowthroat was not found in uplands. Occupancy rates for five of these species were best predicted by the burn_binary variable suggesting that any degree of burn negatively influenced occupancy. The orange-crowned warbler and swamp sparrow were better fit by burn_rank, suggesting a linear decrease with fire severity. Swainson’s thrush was best fit by burn_category, with a 27% drop in occupancy from control to low burn severity followed by occupancy decreasing between 5 to 10% between low, moderate, and high severity burned areas. All of these species also showed a negative effect of fire on density. However, the best fitting density model describing the response to fire often differed from occupancy models. The most common difference was occupancy models often found that burn_binary was a better fit, while in density models, burn_rank tended to be selected more (Table 1).
Species that were positively influenced by fire included American robin (Turdus migratorius), Canada jay (Perisoreus canadensis), chipping sparrow (Spizella passerine), dark-eyed junco (Junco hyemalis), Lincolns’ sparrow (Melospiza lincolnii), olive-sided flycatcher (Contopus cooperi), and western wood-peewee (Contopus sordidulus, Table 1). Three were best predicted by burn_binary, suggesting a positive effect of fire regardless of severity, with the remainder best predicted by burn_rank, indicating a linear increase. The western wood-peewee was never found in peatlands. The Canada jay was the only species that showed any distinct difference between occupancy and density models with burn_binary providing a better fit for occupancy models, while there was no strong support for any fire variable in the density models.
Three species showed more complex relationships. The hermit thrush (Catharus guttatus) was one of the most common species in our study area and showed higher occupancy in the low and moderate burned areas than in controls and high severity burned areas. In contrast, density in peatlands increased with burn_rank, while they slightly declined with burn_rank in uplands. The white-crowned sparrow in peatlands showed a similar curvilinear response, with very low occupancy in controls, higher occupancy in low and moderate burn severity, and decreases in high burn severity. In uplands, there was an increase in occupancy with burn_rank. Density models found that the white-crowned sparrow increased with burn_rank in both vegetation types. The white-throated sparrow (Zonotrichia albicollis) had a very similar occupancy and density across burn severity in peatlands, but increased linearly with burn severity in uplands.
There was reduced richness in peatlands with increasing severity for all richness metrics (Table 2). In contrast, there was no consistent change in richness across severity classes in uplands. Richness was considerably higher in peatlands than in uplands. Functional diversity decreased with increasing burn severity, but did so in the same relative way in the both vegetation types. Richness also increased between years (Table 2).
The burn severity × vegetation type interaction explained 5.4% of variation in community composition, while the conditional variables explained an additional 6.8% (df = 6, F = 5.80, p ≤ 0.001). Vegetation type, when the only constrained variable, explained 1.9% of variation (df = 1, F = 14.12, p ≤ 0.001), which was marginally more than burn severity (1.5% of variation, df = 2, F = 4.86, p ≤ 0.001). The partial canonical correspondence analysis (pCCA) ordination showed that species in upland and peatland stations became more similar with increasing burn severity (Figure 4). However, the test for homogeneity of multivariate dispersion and subsequent permutation tests showed no significant differences among burn severities and vegetation types (df = 7, F = 0.93, p = 0.472).

4. Discussion

Single-species occupancy and density models of boreal birds breeding in northwestern Canada suggest about half of the species we modeled use uplands and peatlands differently (Table 1). More species had higher occupancy rates (50% vs. 15%) or density (55% vs. 20%) in peatlands than in uplands. The remaining species showed no differences in abundance between vegetation types. Of the 10 species with higher occupancy in peatlands, 40% showed evidence of declines with fire severity during the first two years post-fire. Of the three species with higher occupancy in uplands, one declined with fire severity, one was intermediate, and one increased. Of the seven species that have similar occupancy rates between vegetation types, 57% increased with fire severity. Of the 11 species with higher density in peatlands, 45% showed declines with fire severity. Of the four species with higher density in uplands, 50% showed declines with fire severity (ruby-crowned kinglet and yellow-rumped warbler). Of the five species with no difference in density between vegetation types, 40% declined. Only three species showed strong support for an interaction between vegetation type and burn severity on occupancy. Using density, seven species showed support for an interaction between severity and vegetation type, although the qualitative direction of response to fire severity remained the same between occupancy and density for most species. The two exceptions were the hermit thrush and white-crowned sparrow which showed quite different patterns based on density versus occupancy. In general, occupancy and density models found similar qualitative responses to fire, but the magnitude of change was often quite different. Density data were more likely to support more complex models that included more interactive effects. The individual species results do not provide strong support for the hypothesis that birds breeding in uplands are more resistant to fire than birds in peatlands.
However, the richness and community composition results at all scales suggest that the community in peatlands did change more with fire severity than in uplands, providing some support for the resistance hypothesis. This result is likely caused by the larger number of specialists breeding in peatlands. The three to four species with higher occupancy and density estimates in uplands were also common in peatlands. Conversely, many of the species with higher occupancy and density in peatlands were very uncommon in uplands. This suggests that a greater number of individuals of fire sensitive species likely breed in peatlands than in upland forests.
Functional diversity decreased more than species richness with increasing burn severity because species found in the higher severity burns shared similar, generalist life history traits. We define generalists in this study as being omnivorous and able to use either ground or multiple tree types for nesting locations in forested habitat (Appendix A Table A1). It may be particularly beneficial for species to utilize a variety of food types in recent burns where foods like berries, seeds, and insects may be scarce. Additionally, species that either nest on the ground or use multiple tree types will also likely have nesting options in recent burns, even with limited live tree options. The five most common species in high severity burns (American robin, chipping sparrow, dark-eyed junco, hermit thrush, Lincolns’ sparrow, and white-throated sparrow) are from two families (Turdidae and Emberizidae) and represent short distance migrants, foraging omnivores (except the hermit thrush), and nest primarily on the ground (except the American robin, where the ground is a secondary nesting substrate [64]). Burn severity had a similar impact on functional diversity in both uplands and peatlands, supporting the niche gestalt hypothesis. Species with specialized life history traits, such as insectivores, were less abundant in our study area than more southern areas of the boreal forest, but their negative response to increasing burn severity accounts for most of the observed decrease in functional diversity. The lower change in turnover along axis one of the pCCA demonstrates that the magnitude of the change in beta diversity was smaller in uplands than in peatlands. Less turnover seemingly reflects the more generalized habitat requirements of the upland bird community, again providing some support for the resistance hypothesis.
In our study area, burn severity in peatlands was on average less than in uplands [41]. Peatlands in southern boreal forest have been predicted to remain relatively unaltered in response to climate change throughout this century, compared to uplands [65]. Thus, peatlands may act as climate change and wildfire refugia [66] and potentially be important for many boreal birds, even those that prefer uplands but are capable of using peatlands. However, some peatlands may not be as available in the future owing to greater drying and the risk of larger and more severe burns that are expected to become more prominent [20]. Some peatland specialists could already be experiencing negative effects of climate change. For example, the common yellowthroat is a peatland-associated species in western boreal regions that has experienced population declines of 0.9% annually between 1970 and 2015 in Canada [67]. In our study, this species was found in unburned, low, and moderate severity areas, but not in high severity burns. Alternatively, high severity burns, that are expected to be more prominent in boreal landscapes in response to climate change, will likely be important refugia for fire specialists (e.g., olive-sided flycatcher and western wood-pewee).
Of the 18 individual species that responded to fire, about a third showed differences in occupancy that were best fit by describing fire state as burned versus unburned (burn_binary). Using density, only three species were best fit by the burn_categorical variable (non-linear response). These results suggest that the burned/unburned categorization used by many historical studies is insufficient to understand the magnitude of changes in birds that result from fires. Most species were better predicted by some measure of burn severity. Richness and functional diversity patterns in peatlands also indicated severity was important for assessing community change in response to fire. Likewise, a gradual community composition shift with increasing severity was observed, particularly in peatlands. Clearly, measuring severity results in a more nuanced perspective on how birds react to fire and likely has significant implications in future simulation models that try to understand bird population sizes and community change in space and time.
To our knowledge, the only other study in a North American boreal forest that evaluated how burn severity influences bird abundance was in black spruce stands in Quebec, Canada [30]. There were 10 species where abundance and severity were assessed in both studies. Five species showed significant responses to fire and/or fire severity in our study area, but no significant relationship with burn severity in Quebec (alder flycatcher, American robin, olive-sided flycatcher, Swainson’s thrush, and white-throated sparrow). The ruby-throated kinglet and yellow-rumped warbler showed negative effects of increased burn severity in both study areas. The dark-eyed junco and hermit thrush were also positively related to burn severity in both studies, although we found that high severity led to a slight decrease in hermit thrush occupancy which was not observed in Quebec. Cavity nesters dominated high severity burns in this eastern boreal region, which was not the case in the Northwest Territories where woodpeckers were uncommon. However, the use of ARUs only provides species identifications based on acoustic signals and this resulted in many of our woodpecker records being classified as unknown woodpecker species because there was insufficient information to classify some drumming patterns to species. Additional work is needed to assess if the differences in response between the two areas represent distinct differences in habitat selection or simply are the result of insufficient sample size or issues of detectability in one area versus the other.
When we expanded our literature review to include burn severity in other North American forests, we found eight studies that quantified differences in fire severity on birds (Table 3). This included a meta-analysis from studies with high or low/moderate burn severities, but not necessarily all three severities in the same study [68]. The yellow-rumped warbler, ruby-crowned kinglet, and orange-crowned warbler consistently declined with fire severity across studies. The olive-sided flycatcher and western wood-peewee tended to increase. Many species had no significant effect of severity in some areas, but were consistent in their direction of change. For example, the American robin and white-throated sparrow tended to be higher in areas with more intense fire severity, while Swainson’s thrush tended to be lower. Results for Le Conte’s sparrow, palm warbler, ruffed grouse, and white-crowned sparrow were only available in our study. The Canada jay, chipping sparrow, common yellowthroat, dark-eyed junco, hermit thrush, Lincoln’s sparrow, and swamp sparrow showed inconsistent patterns of response to severity across studies. It is tantalizing to suggest that local adaptations to deal with a different fire regime in northwestern boreal ecosystems may explain the differences for these species. However, a more standardized approach to measuring fire severity and more consistent analytical framework are needed to truly test this hypothesis.
Most studies on the response of birds to fire in the western boreal have compared bird abundance at different times since fires. Typically, this has been done by comparing younger stands to older stands created by a similar disturbance type [25,26,27,28,29]. In Alberta, Canada, all such studies have been summarized into a single framework using ~60,000 point counts across five major vegetation types and split into nine 20 year age-class increments (0–20, 21–40, etc.) [25]. Several interesting discrepancies are apparent with Alberta’s bird habitat models and what we observed in our study area. The alder flycatcher and common yellowthroat are far more likely to be found in 0 to 20-year-old forests in Alberta than any other age class, regardless of vegetation type. However, in the NWT, we found they were far less abundant after fire than in 40+ year old controls. We suspect immediately post-burn the shrubs may not be sufficiently dense to support as many individuals, but will likely increase as shrubs and trees begin to regrow. The density of alder flycatchers was higher in 2016 than in 2015 supporting this observation. In contrast, the Canada jay, chipping sparrow, dark-eyed junco, hermit thrush, and olive-sided flycatcher are all predicted to occur at higher densities in mature to old forests in Alberta than in the 0 to 20-year age class. However, we found all of these species were far more abundant in burned areas than the 40-year-old controls in the NWT. These species also tended to increase with fire severity. Whether these inconsistencies are reflective of northern birds being more resilient to fire, different forest succession patterns related to latitude, time since disturbance, or the age of our controls in the NWT warrants further analysis. Regardless, we recommend that models present results with finer resolution in the first few years after disturbance, as there is clear evidence that within the first few years post-disturbance bird communities are quite different than a decade or two later [29].
Just as inconsistent results can be found among studies looking at species-specific responses to fire severity, similar variation has been seen in community responses. For example, in the deciduous dominated forests of Minnesota, alpha richness decreased dramatically with fire severity [69]. In Ponderosa pine, alpha richness increased in an Idaho study, but decreased in an Arizona study, even when identical sampling and methodological techniques were used [38]. In our jack pine-dominated uplands, we found a neutral response to fire severity, while in the peatlands we found a distinct decrease. This variation in responses in richness suggests local conditions influence how the overall community responds to fire and may depend on the number of specialists that exist in a particular vegetation type. Distance to less severely burned areas, availability of water, and ground level versus canopy level burn severity, likely all play a role in creating this variation.

5. Conclusions

Due to climate change, wildfires in the boreal forest are increasing in frequency, burn severity, and the total annual area burned [73,74]. Wildfires in northwestern boreal regions have historically been large and severe [7]. Unlike southern boreal regions, where firefighting can mitigate the spread of wildfire, northern regions are less residentially and industrially developed, and therefore experience less wildfire suppression [75]. Increased burn severity may result in important habitat loss or alteration for a range of specialist species, as well as habitat creation for fire specialists, many of which are of conservation concern. Our study took place in two very large fires that occurred during an extreme wildfire year. One of the burns in our study area was larger (750,000 ha) than the average yearly area burned in the entire Northwest Territories (570,000 ha; [39]). Therefore, our results are likely representative of the predicted fire regime with larger wildfires that we can expect more of with climate change.
To our knowledge, this is the first study to quantify changes to bird communities in response to burn severity in both uplands and peatlands in a large and unmanaged northern boreal forest region. As predicted, low and moderate severity burn patches in peatlands had higher richness and diversity of species compared to high severity burn patches, likely because of higher levels of remaining green vegetation structure. We also predicted that peatland species would be more affected by increased burn severity than uplands, which there was evidence for in the richness results, but not in the functional diversity or community composition.
Data from this study can be used to build species distribution models to predict spatio-temporal variation in abundance or density and evaluate potential effects of climate change [76,77]. Critically, these models should include fire severity and some landscape metrics related to fire dynamics. Simply put, treating all of the area in a fire polygon the same does not fully encompass the array of responses shown by birds. Future studies should simultaneously test the effects of burn severity, time since fire, and fire return interval on bird community dynamics across a wide range of boreal regions to provide much needed baseline data required to inform land management and better anticipate the wide range of species-specific effects of climate change on boreal birds.

Author Contributions

S.H., E.B. and R.F.P. conceived the project, M.K., S.H., R.F.P., and S.E.N. designed the methodology; M.K., S.H., and R.F.P. collected the data; M.K. and E.B. analyzed the data; M.K. wrote the paper in consultation with S.H., E.B., S.E.N., and R.F.P.; S.H., E.B., and S.E.N. supervised all phases of research, administrated the project, and acquired funding. All authors have read and agreed to the published version of the manuscript.

Funding

This research was funded by the Canadian Wildlife Service Northern Region landbird program of Environment and Climate Change Canada and Natural Sciences and Engineering Research Council of Canada CREATE-Environmental Innovation training and research program graduate scholarship.

Acknowledgments

We thank Emily Upham-Mills, Emony Nicholls, Miles Zurawell, and Josh Sullivan for their assistance in the field, the University of Alberta Bioacoustic Unit for in-kind support for recording analysis, as well as Ellen Whitman for providing the dNBR burn severity layer. We would also like to thank the Dehcho First Nations and the Tłı̨chǫ First Nations for allowing us to conduct this project within their traditional territories.

Conflicts of Interest

The authors declare no conflict of interest.

Appendix A

Table A1. Details of species detected in the study. Species detected at a minimum of three sampling stations in the study area, life history traits), the total number of individuals detected for both survey years (total count), and the percent of point count stations with detections for each species.
Common NameScientific NameGeneralist/SpecialistMigrationFeedingSubstrate BreedingForaging TypeNesting SubstrateNesting HabitatTotal CountStations with Detections (%)
Alder FlycatcherEmpidonax alnorumSNMInAirSalShTSS5912.6
American RobinTurdus migratoriusGSDMOmLCSFoTNsUr38069.4
Black-Backed WoodpeckerPicoides arcticusSRInBaScaSnCW82.0
Blue-Headed VireoVireo solitariusSSDMInLCSGlCTMW41.0
Boreal ChickadeePoecile hudsonicusSRInLCSGlSnCW41.0
Canada JayPerisoreus canadensisGROmUCFoCTCW7015.9
Clay-Colored SparrowSpizella pallidaGNMOmGrFoShES143.2
Chipping SparrowSpizella passerinaGSDMOmGrFoCTOW37070.6
Common NighthawkChordeiles minorSNMInAirScrGrWo368.6
Common YellowthroatGeothlypis trichasSNMInLCSGlGrMa112.5
Dark-Eyed JuncoJunco hyemalisGSDMOmGrFoGrCW38874.8
Fox SparrowPasserella iliacaGSDMOmGrFoGrWo51.2
Greater YellowlegsTringa melanoleucaSSDMPiWaAmGrBo51.2
Hermit ThrushCatharus guttatusSSDMInGrGlGrCW48686.9
Le Conte’s SparrowAmmodramus leconteiiGSDMOmGrFoGrMe306.6
Least FlycatcherEmpidonax minimusSNMInAirSalDTDW61.5
Lesser YellowlegsTringa flavipesSSDMInWaGlGrBo10123.7
Lincoln’s SparrowMelospiza lincolniiGSDMOmGrFoGrBo26380.6
Mountain BluebirdSialia currucoidesSSDMInGrGlSnOW40.7
Northern FlickerColaptes auratusSSDMInGrGlSnMW81.9
Orange-Crowned WarblerVermivora celataSSDMInLCSGlGrOW8117.0
Olive-Sided FlycatcherContopus cooperiSNMInAirSalCTBo4911.9
OvenbirdSeiurus aurocapillusSNMInGrGlGrDW61.5
Palm WarblerDendroica palmarumSSDMInGrGlGrBo10423.0
Pileated WoodpeckerDryocopus pileatusSRInBaExSnMW41.0
Red-Winged BlackbirdAgelaius phoeniceusSSDMOmGrFoGsMa81.5
Ruby-Crowned KingletRegulus calendulaSSDMInUCGlCTCW389.1
Ruffed GrouseBonasa umbellusGROmGrFoGrMW337.7
Savannah SparrowPasserculus sandwichensisGSDMOmGrFoGrAg41.0
Solitary SandpiperTringa solitariaSNMInWaGlTNSBo4510.1
SoraPorzana carolinaSSDMOmWaFoEVMa10725.4
Spotted SandpiperActitis maculariusSNMInShGlGrBe92.0
Swamp SparrowMelospiza georgianaGSDMOmGrFoGrMa5612.1
Swainson’s ThrushCatharus ustulatusGNMOmGrFoCTMW37373.6
Tennessee WarblerVermivora peregrinaSNMInUCGlGrBo5813.3
Western-Wood-PeweeContopus sordidulusSNMInAirSalCTOW102.5
White-Crowned SparrowZonotrichia leucophrysGSDMOmGrFoGrBo8719.0
White-Throated SparrowZonotrichia albicollisGSDMOmGrFoGrES29955.6
Yellow-Bellied FlycatcherEmpidonax flaviventrisSNMInAirSalGrBo51.2
Yellow-Bellied SapsuckerSphyrapicus variusGSDMOmBaExDTMW71.7
Yellow WarblerSetophaga petechiaSNMInLCSGlShES71.2
Yellow-Rumped WarblerSetophaga coronataSSDMInLCSGlCTCW19341.7
Generalist/Specialist: G = Generalist, S = Specialist; Migration: Nm = Neotropical Migrant, R = Resident, Sdm = Short-Distance Migrant; Feeding: In = Insectivore, Om = Omnivore, Pi = Piscivore; Breeding Substrate: Air = Air, Ba = Bark, Gr = Ground, LCS = Lower Canopy And Shrubs, Sh = Shoreline, UC = Upper Canopy, Wa = Water; Foraging Type: Am = Ambusher, Ex = Excavator, Fo = Forager, Gl = Gleaner, Sal = Sallier, Scr = Screener, Sca = Scavenger; Nesting Substrate: DT = Deciduous Tree, CT = Coniferous Tree, EV = Emergent Vegetation, Gr = Ground, Gs = Grass, Ma = Marsh, Sh = Shrub, Sn = Snag, TNs = Tree, Non-Specific; Nesting Habitat: Ag = Agricultural, Be = Beach, Bo = Bog, CW = Coniferous Woodlands, ES = Early Successional, MW = Mixed Woodlands, OW = Open Woodlands, TSS = Treed/Shrubby Swamp, Ur = Urban.

References

  1. Wells, J.V.; Blancher, P. Global role for sustaining bird populations. In Boreal Birds of North America: A Hemispheric View of Their Conservation Links and Significance; Wells, J.V., Ed.; University of California Press: Berkeley, CA, USA, 2011; Chapter 2; pp. 7–22. [Google Scholar]
  2. Blancher, P. The Importance of Canada’s Boreal Forest to Landbirds. Available online: www.borealbirds.org/publications/importance-canadas-boreal-forest-landbirds (accessed on 2 July 2020).
  3. Rosenberg, K.V.; Kennedy, J.A.; Dettmers, R.; Ford, R.P.; Reynolds, D.; Alexander, J.D.; Beardmore, C.J.; Blancher, P.J.; Bogart, R.E.; Butcher, G.S.; et al. Partners in Flight Landbird Conservation Plan: 2016 Revision for Canada and Continental United States. Available online: https://partnersinflight.org/resources/the-plan/ (accessed on 2 July 2020).
  4. Ballard, G.; Geupel, G.R.; Nur, N.; Gardali, T. Long-term declines and decadal patterns in population trends of songbirds in western North America, 1979–1999. Condor 2003, 105, 737–755. [Google Scholar] [CrossRef]
  5. Environment Canada. Bird Conservation Strategy for Bird Conservation Region 6: Boreal Taiga Plains. Available online: www.canada.ca/en/environment-climate-change/services/migratory-bird-conservation/regions-strategies/description-region-6/canada.html (accessed on 2 July 2020).
  6. Weber, M.G.; Flannigan, M.D. Canadian boreal forest ecosystem structure and function in a changing climate: Impact on fire regimes. Environ. Rev. 1997, 5, 145–166. [Google Scholar] [CrossRef]
  7. ESTR Secretariat. Taiga Plains Ecozone and evidence for key findings summary. In Canadian Biodiversity: Ecosystem Status and Trends 2010, Evidence for Key Findings Summary; Report No. 13; Canadian Councils of Resource Ministers: Ottawa, ON, Canada, 2013. [Google Scholar]
  8. de Groot, W.J.; Cantin, A.S.; Flannigan, M.D.; Soja, A.J.; Gowman, L.M.; Newbery, A. A comparison of Canadian and Russian boreal forest fire regimes. For. Ecol. Manag. 2013, 294, 23–34. [Google Scholar] [CrossRef]
  9. Eberhart, K.E.; Woodard, P.M. Distribution of residual vegetation associated with large fires in Alberta. Can. J. For. Res. 1987, 17, 1207–1212. [Google Scholar] [CrossRef]
  10. Nielsen, S.E.; DeLancey, E.R.; Reinhardt, K.; Parisien, M.-A. Effects of lakes on wildfire activity in the boreal forests of Saskatchewan, Canada. Forests 2016, 7, 265. [Google Scholar] [CrossRef] [Green Version]
  11. Rowe, J.S.; Scotter, G.W. Fire in the boreal. Quat. Res. 1973, 3, 444–464. [Google Scholar] [CrossRef]
  12. Madoui, A.; Leduc, A.; Gauthier, S.; Bergeron, Y. Spatial pattern analyses of post-fire residual stands in the black spruce boreal forest of western Quebec. Int. J. Wildland Fire 2010, 19, 1110–1126. [Google Scholar] [CrossRef]
  13. Weber, M.G.; Stocks, B.J. Forest fires and sustainability in the boreal forests of Canada. Ambio 1998, 27, 545–550. [Google Scholar]
  14. Bourgeau-Chavez, L.L.; Alexander, M.E.; Stocks, B.J.; Kasischke, E.S. Distribution of Forest Ecosystems and the Role of Fire in the North American Boreal Region. In Fire, Climate Change, and Carbon Cycling in the Boreal Forest; Kasischke, E.S., Stocks, B.J., Eds.; Springer: New York, NY, USA, 2000; pp. 111–131. [Google Scholar]
  15. National Wetlands Working Group. The Canadian Wetland Classification System, 2nd ed.; Warner, B.G., Rubec, C.D.A., Eds.; Wetlands Research Centre, University of Waterloo: Waterloo, ON, Canada, 1998. [Google Scholar]
  16. Ecosystem Classification Group. Ecological Regions of the Northwest Territories—Taiga Plains; Report; Department of Environment and Natural Resources, Government of the Northwest Territories: Yellowknife, NT, Canada, 2009; 173p.
  17. Kettridge, N.; Turetsky, M.R.; Sherwood, J.H.; Thompson, D.K.; Miller, C.A.; Benscoter, B.W.; Flannigan, M.D.; Wotton, B.M.; Waddington, J.M. Moderate drop in water table increases peatland vulnerability to post-fire regime. Sci. Rep. 2015, 5, 8063. [Google Scholar] [CrossRef] [Green Version]
  18. Hokanson, K.J.; Lukenbach, M.C.; Devito, K.J.; Kettridge, N.; Petrone, R.M.; Waddington, J.M. Groundwater connectivity controls peat burn severity in the boreal plains. Ecohydrology 2015, 9, 574–584. [Google Scholar] [CrossRef]
  19. Whitman, E.; Parisien, M.-A.; Thompson, D.K.; Hall, R.J.; Skakun, R.S.; Flannigan, M.D. Variability and drivers of burn severity in the northwestern Canadian boreal forest. Ecosphere 2018, 9, e02128. [Google Scholar] [CrossRef] [Green Version]
  20. Flannigan, M.; Stocks, B.J.; Turetsky, M.; Wotton, M. Impacts of climate change on fire activity and fire management in the circumboreal forest. Glob. Chang. Biol. 2009, 15, 549–560. [Google Scholar] [CrossRef]
  21. Wirth, C. Fire Regime and Tree Diversity in Boreal Forests: Implications for the Carbon Cycle. In Forest Diversity and Function: Temperate and Boreal Systems; Springer: Berlin/Heidelberg, Germany, 2005; pp. 309–344. [Google Scholar] [CrossRef]
  22. Blackburn, T.M.; Gaston, K.J. Spatial patterns in the species richness of birds in the new world. Ecography 1996, 19, 369–375. [Google Scholar] [CrossRef]
  23. Swanson, M.E.; Franklin, J.F.; Beschta, R.L.; Crisafulli, C.M.; DellaSala, D.M.; Hutto, R.L.; Lindenmayer, D.B.; Swanson, F.J. The forgotten stage of forest succession: Early-successional ecosystems on forest sites. Front. Ecol. Environ. 2011, 9, 117–125. [Google Scholar] [CrossRef] [Green Version]
  24. Hogg, E.H.; Wein, R.H. Impacts of drought on forest growth and regeneration following fire in southwestern Yukon, Canada. Can. J. For. Res. 2005, 35, 2141–2150. [Google Scholar] [CrossRef]
  25. Alberta Biodiveristy Monitoring Institute. Biodiversity Browser. Available online: https://abmi.ca/home/data-analytics/biobrowser-home (accessed on 17 October 2020).
  26. Hobson, K.; Schieck, J. Changes in bird communities in boreal mixedwood forest: Harvest and wildfire effects over 30 years. Ecol. Appl. 1999, 9, 849–863. [Google Scholar] [CrossRef]
  27. Imbeau, L.; Savard, J.L.; Gagnon, R. Comparing bird assemblages in successional black spruce stands originating from fire and logging. Can. J. Zool. 1999, 77, 1850–1860. [Google Scholar] [CrossRef]
  28. Morissette, J.L.; Cobb, T.P.; Brigham, R.M.; James, P.C. The response of boreal forest songbird communities to fire and post-fire harvesting. Can. J. For. Res. 2002, 32, 2169–2183. [Google Scholar] [CrossRef]
  29. Schieck, J.; Song, S.J. Changes in bird communities throughout succession following fire and harvest in boreal forests of western North America: Literature review and meta-analyses. Can. J. For. Res. 2006, 36, 1299–1318. [Google Scholar] [CrossRef]
  30. Azeria, E.T.; Ibarzabal, J.; Hébert, C.; Boucher, J.; Imbeau, L.; Savard, J.P. Differential response of bird functional traits to post-fire salvage logging in a boreal forest ecosystem. Acta Oecol. 2011, 37, 220–229. [Google Scholar] [CrossRef] [Green Version]
  31. Haney, A.; Apfelbaum, S.; Burris, J.M. Thirty years of post-fire succession in a southern boreal forest bird community. Am. Midl. Nat. 2008, 159, 421–433. [Google Scholar] [CrossRef]
  32. Hutto, R.L. Composition of bird communities composition following stand-replacement fires in northern Rocky Mountain (U.S.A) conifer forests. Conserv. Biol. 1995, 9, 1041–1058. [Google Scholar] [CrossRef] [Green Version]
  33. Van Wilgenburg, S.L.; Hobson, K.A. Landscape-scale disturbance and boreal forest birds: Can large single-pass harvest approximate fires? For. Ecol. Manag. 2008, 256, 136–146. [Google Scholar] [CrossRef]
  34. Nappi, A.; Drapeau, P.; Savard, J.P.L. Salvage logging after wildfire in the boreal forest: Is it becoming a hot issue for wildlife? For. Chron. 2004, 80, 67–74. [Google Scholar] [CrossRef]
  35. James, F.C. Ordinations of Habitat Relationships among Breeding Birds. Wilson Bull. 1971, 83, 215–236. [Google Scholar]
  36. Hutto, R.L.; Patterson, D.A. Positive effects of fire on birds may appear only under narrow combinations of fire severity and time-since-fire. Int. J. Wildland Fire 2016, 25, 1074–1085. [Google Scholar] [CrossRef]
  37. Latif, Q.S.; Sanderlin, J.S.; Saab, V.A.; Block, W.M.; Dudley, J.G. Avian relationships with wildfire at two dry forest locations with different historical fire regimes. Ecosphere 2016, 7, e01346. [Google Scholar] [CrossRef]
  38. Northwest Territories Department of Environment and Natural Resources. 2014 NWT Fire Season: Review Report; Government of the Northwest Territories: Yellowknife, NT, Canada, 2015.
  39. Northwest Territories Department of Environment and Natural Resources. Annual Area Burned and Number of Fires. Available online: www.enr.gov.nt.ca/en/state-environment/143-annual-area-burned-and-number-fires (accessed on 5 December 2020).
  40. Government of Canada (2018, March 1) Station Results—1981–2010 Climate Normals and Averages (Fort Simpson, Hay River, Yellowknife). Available online: https://climate.weather.gc.ca/climate_normals (accessed on 16 November 2018).
  41. Whitman, E. Extended Assessment Differenced Normalized Burn Ratio (dNBR) Maps for Large 2014 Wildfires in the Northwest Territories, Derived from Landsat 8—OLI and Landsat 5—TM Imagery [Raster Geotiff]; Natural Resources Canada; Canadian Forest Service & University of Alberta: Edmonton, AB, Canada, 2015. [Google Scholar]
  42. Key, C.H.; Benson, N.C. Landscape Assessment: Sampling and Analysis Methods: Firemon: Fire Effects Monitoring and Inventory System; General Technical Report, RMRS-GTR-164-CD; USDA Forest Service, Rocky Mountain Research Station: Fort Collins, CO, USA, 2006.
  43. Rose, E.T.; Simons, T.R.; Klein, R.; McKerrow, A.J. Normalized burn ratios link fire severity with patterns of avian occurrence. Landsc. Ecol. 2016, 31, 1537. [Google Scholar] [CrossRef]
  44. Wilkerson, R.L.; Tingley, M.W.; Ruiz-gutie, V.; Howell, C.A.; Siegel, R.B. Pyrodiversity promotes avian diversity over the decade following forest fire. Proc. R. Soc. Biol. 2016, 283, 20161703. [Google Scholar]
  45. Miquelajauregui, Y.; Cumming, S.G.; Gauthier, S. Modelling variable fire severity in boreal forests: Effects of fire intensity and stand structure. PLoS ONE 2016, 11, e0150073. [Google Scholar] [CrossRef]
  46. Northwest Territories Department of Environment and Natural Resources. Northwest Territories Forest Vegetation Inventory Standards with Softcopy Supplements; Northwest Territories Department of Environment and Natural Resources: Yellowknife, NT, Canada, 2012.
  47. Shonfield, J.; Bayne, E. Autonomous recording units in avian ecological research: Current use and future applications. Avian Conserv. Ecol. 2017, 12, 14. [Google Scholar] [CrossRef]
  48. Hutto, R.; Stutzman, R. Humans versus autonomous recording units: A comparison of point-count results. J. Field Ornithol. 2009, 80, 387–398. [Google Scholar] [CrossRef]
  49. Venier, L.A.; Holmes, S.B.; Holborn, G.W.; McIlwrick, K.A.; Brown, G. Evaluation of an automated recording device for monitoring forest birds. Wildl. Soc. Bull. 2012, 36, 30–39. [Google Scholar] [CrossRef]
  50. Pankratz, R.F.; Hache, S.; Sólymos, P.; Bayne, E.M. Potential benefits of augmenting road-based breeding bird surveys with autonomous recordings. Avian Conserv. Ecol. 2017, 12, 18. [Google Scholar] [CrossRef]
  51. Yip, D.A.; Knight, E.C.; Haave-Audet, E.; Wilson, S.J.; Charchuk, C.; Scott, C.D.; Sólymos, P.; Bayne, E.M. Sound level measurements from audio recordings provide objective distance estimates for distance sampling wildlife populations. Remote Sens. Ecol. Conserv. 2020, 6, 301–315. [Google Scholar] [CrossRef] [Green Version]
  52. Mackenzie, D.; Nichols, J.; Royle, J.; Pollock, K.; Bailey, L.; Hines, J. Occupancy Estimation and Modelling, 2nd ed.; Academic Press: Cambridge, MA, USA, 2017. [Google Scholar]
  53. Sólymos, P.; Matsuoka, S.M.; Bayne, E.M.; Lele, S.R.; Fontaine, P.; Cumming, S.G.; Stralberg, D.; Schmiegelow, F.K.; Song, S.J. Calibrating indices of avian density from non-standardized survey data: Making the most of a messy situation. Methods Ecol. Evol. 2013, 4, 1047–1058. [Google Scholar] [CrossRef]
  54. Sólymos, P. QPAD Version 3 Documentation—Technical Report; Boreal Avian Modelling Project: Edmonton, AB, Canada, 2016; Available online: https://zenodo.org/record/3251111#.X81pTOlKhTY (accessed on 5 December 2020).
  55. Gagic, V.; Bartomeus, I.; Jonsson, T.; Taylor, A.; Winqvist, C.; Fischer, C.; Slade, E.M.; Steffan-Dewenter, I.; Emmerson, M.; Potts, S.G.; et al. Functional identity and diversity of animals predict ecosystem functioning better than species-based indices. Proc. R. Soc. Biol. 2015, 282, 2014–2620. [Google Scholar] [CrossRef] [Green Version]
  56. Schmiegelow, F.K.; Machtans, C.S.; Hannnon, S.J. Are boreal birds resilient to forest fragmentation? An experimental study of short-term community responses. Ecology 1997, 78, 1914–1932. [Google Scholar] [CrossRef]
  57. Devictor, V.; Julliard, R.; Clavel, J.; Jiguet, F.; Lee, A.; Couvet, D. Functional biotic homogenization of bird communities in disturbed landscapes. Glob. Ecol. Biogeogr. 2008, 17, 252–261. [Google Scholar] [CrossRef]
  58. Virkkala, R.; Lehikoinen, A. Birds on the move in the face of climate change: High species turnover in northern Europe. Ecol. Evol. 2017, 7, 8201–8209. [Google Scholar] [CrossRef]
  59. Laliberté, E.; Legendre, P.; Shipley, B. FD: Measuring Functional Diversity from Multiple Traits, and Other Tools for Functional Ecology. R Package Version 1.0-12. 2014. Available online: https://cran.r-project.org/web/packages/FD (accessed on 5 December 2020).
  60. Schleuter, D.S.; Aufresne, M.D.; Assol, F.M. A user’s guide to functional diversity indices. Ecol. Monogr. 2010, 80, 469–484. [Google Scholar] [CrossRef] [Green Version]
  61. Oksanen, J.; Blanchet, F.G.; Friendly, M.; Kindt, R.; Legendre, P.; McGlinn, D.; Minchin, P.R.; O’Hara, R.B.; Simpson, G.L.; Solymos, P.; et al. Vegan: Community Ecology Package. R Package Version 2.4-1. 2016. Available online: https://cran.r-project.org/web/packages/vegan (accessed on 5 December 2020).
  62. Borcard, D.; Legendre, P.; Drapeau, P. Partialling out the spatial component of ecological variation. Ecology 1992, 73, 1045–1055. [Google Scholar] [CrossRef] [Green Version]
  63. Anderson, M.J. Multivariate dispersion as a measure of beta diversity. Ecol. Lett. 2006, 9, 683–693. [Google Scholar] [CrossRef]
  64. Vanderhoff, N.; Pyle, P.; Pattern, M.A.; Sallabanks, R.; James, F.C. American Robin (Turdus migratorius), version 2.0. In Birds of North America; Rodewald, P.G., Ed.; Cornell Lab of Ornithology: Ithaca, NY, USA, 2016. [Google Scholar]
  65. Schneider, R.R.; Devito, K.; Kettridge, N.; Bayne, E. Moving beyond bioclimatic envelope models: Integrating upland forest and peatland processes to predict ecosystem transitions under climate change in the western Canadian boreal plain. Ecohydrology 2016, 9, 899–908. [Google Scholar] [CrossRef]
  66. Stralberg, D.; Arseneault, D.; Baltzer, J.L.; Barber, Q.E.; Bayne, E.M.; Boulanger, Y.; Brown, C.D.; Cooke, H.A.; Devito, K.; Edwards, J.; et al. Climate-change refugia in boreal North America: What, where, and for how long? Front. Ecol. Environ. 2020, 18, 261–270. [Google Scholar] [CrossRef]
  67. Environment and Climate Change Canada. North American Breeding Bird Survey—Canadian Trends Website, Data-Version 2015; Environment and Climate Change Canada: Gatineau, QC, Canada, 2017. Available online: https://wildlife-species.canada.ca/breeding-bird-survey-results (accessed on 5 December 2020).
  68. Fontaine, J.B.; Kennedy, P.L. Meta-analysis of avian and small-mammal response to fire severity and fire surrogate treatments in U.S. fire-prone forests. Ecol. Appl. 2012, 22, 1547–1561. [Google Scholar] [CrossRef] [PubMed]
  69. Zlonis, E.J.; Walton, N.G.; Sturtevant, B.R.; Wolter, P.T.; Niemi, G.J. Burn severity and heterogeneity mediate avian response to wildfire in a hemiboreal forest. For. Ecol. Manag. 2019, 439, 70–80. [Google Scholar] [CrossRef]
  70. Taillie, P.J.; Burnett, R.D.; Robert, L.J.; Campos, B.R.; Peterson, M.N.; Moorman, C.E. Interacting and non-linear avian responses to mixed-severity wildfire and time since fire. Ecosphere 2018, 9, e02291. [Google Scholar] [CrossRef]
  71. Kirkpatrick, C.; Conway, C.J.; Jones, P.B. Distribution and Relative Abundance of Forest Birds in Relation to Burn Severity in Southeastern Arizona. J. Wildl. Manag. 2006, 70, 1005–1012. [Google Scholar] [CrossRef]
  72. Stephens, J.L.; Ausprey, I.J.; Seavy, N.E.; Alexander, J.D. Fire severity affects mixed broadleaf–conifer forest bird communities: Results for 9 years following fire. 2015. Condor Ornithol. Appl. 2015, 13, 430–446. [Google Scholar]
  73. Kochtubajda, B.; Flannigan, M.D.; Gyakum, J.R.; Stewart, R.E.; Logan, K.A.; Nguyen, T.V. Lightning and fires in the Northwest Territories and responses to future climate change. Arctic 2006, 59, 211–221. [Google Scholar] [CrossRef] [Green Version]
  74. Héon, J.; Arseneault, D.; Parisien, M. Resistance of the boreal forest to high burn rates. Proc. Natl. Acad. Sci. USA 2014, 111, 13888–13893. [Google Scholar] [CrossRef] [PubMed] [Green Version]
  75. Campos-Ruiz, R.; Parisien, M.; Flannigan, M.D. Temporal patterns of wildfire activity in areas of contrasting human influence in the Canadian boreal forest. Forests 2018, 9, 159. [Google Scholar] [CrossRef] [Green Version]
  76. Stralberg, D.; Carroll, C.; Pedlar, J.H.; Wilsey, C.B.; McKenney, D.W.; Nielsen, S.E. Macrorefugia for North American trees and songbirds: Climatic limiting factors and multi-scale topographic influences. Glob. Ecol. Biogeogr. 2018, 27, 690–703. [Google Scholar] [CrossRef]
  77. Tremblay, J.A.; Boulanger, Y.; Cyr, D.; Taylor, A.R.; Price, D.T.; St-Laurent, M.-H. Harvesting interacts with climate change to affect future habitat quality of a focal species in eastern Canada’s boreal forest. PLoS ONE 2019, 13, e0191645. [Google Scholar] [CrossRef] [Green Version]
Figure 1. Location of the 20 study sites (black squares) in the study area between Fort Providence and Behchok ǫ ` , Northwest Territories, Canada.
Forests 11 01330 g001
Figure 2. Examples of low (A), moderate (B) and high (C) burn severity one year post-fire in the Northwest Territories, Canada.
Forests 11 01330 g002
Figure 3. Heatmap of standardized species’ counts in each burn severity category. Colors from blue (never present) to red (most frequently present) represent the relative frequency each species was detected in each severity category.
Forests 11 01330 g003
Figure 4. Partial canonical correspondence analysis (pCCA) ordination of bird communities in uplands and peatlands of increasing burn severity. Presented are (A) centroids of each treatment type (burn severity and vegetation types) joined by arrows indicating the direction of increasing burn severity for uplands (squares) and peatlands (circles); (B) 67% confidence ellipses around centroids (not shown) of each burn severity category.
Forests 11 01330 g004
Table 1. Mean (±95% C.I.) occupancy probability (psi) and density (dens; males per hectare) estimates for 20 species in peatland and upland forest with different burn severities (Control, Low, Moderate, and High). Results are derived from the best fitting model, i.e., lowest Akaike’s information criteria (AIC). Additionally, presented here are the: (1) correlation (r) between occupancy and density across the 8 categories for each species and (2) number of stations where the species was detected at least once. Species are grouped based on their response to fire severity from the occupancy models. Species in bold italics show different qualitative patterns in their response to fire between occupancy and density. p is the detection terms in the occupancy model. P or NB indicates whether a Poisson or negative binomial model provided a better fit to generate density estimates. Veg. = vegetation.
Species# StationsBest ModelVegetation TypeControlLowModerateHigh
Species with lower occupancy rates in burned areas
Alder Flycatcher51psi(vegtype + burn_binary) p(.)Peatland0.33
0.22–0.47
0.17
0.12–0.24
0.17
0.12–0.24
0.17
0.12–0.24
(r = 0.90) Upland0.11
0.07–0.18
0.05
0.03–0.08
0.05
0.03–0.08
0.05
0.03–0.08
dens(vegtype × burn_rank + year) − NBPeatland0.73
0.11–1.35
0.31
0.11–0.52
0.13
0.03–0.23
0.06
0–0.11
Upland0.03
0.01–0.05
0.03
0.02–0.04
0.03
0.02–0.04
0.03
0.01–0.04
Common Yellowthroat10psi(vegtype + burn binary) p(doy)Peatland0.18
0.0–0.41
0.02
0.0–0.05
00
(r = 0.98) Upland0000
dens(vegtype + burn_rank) − NBPeatland0.12
0.02–0.21
0.02
0–0.04
00
Upland0000
Orange-Crowned Warbler69psi(vegtype + burn_rank) p(doy)Peatland0.62
0.42–0.78
0.42
0.28–0.58
0.25
0.16–0.38
0.14
0.07–0.24
(r = 0.98) Upland0.34
0.22–0.48
0.19
0.13–0.28
0.10
0.06–0.16
0.05
0.02–0.09
dens(vegtype + burn_rank + year) − NBPeatland1.55
0.63–2.57
0.71
0.37–1.04
0.32
0.16–0.59
0.15
0.05–0.25
Upland0.51
0.25–0.76
0.23
0.14–0.33
0.11
0.05–0.16
0.05
0.02–0.08
Ruby-Crowned Kinglet37psi(burn_binary) p(doy + year)Both veg. types0.42
0.30–0.68
0.03
0.01–0.06
0.03
0.01–0.06
0.03
0.01–0.06
(r = 0.86) dens(vegtype + burn_cat.) − NB Peatland0.13
0.03–0.23
0.01
0–0.02
0.01
0–0.02
0
Upland0.42
0.15–0.70
0.01
0–0.03
0.02
0–0.04
0
Ruffed Grouse31psi(burn_binary) p(year)Both veg. types0.48
0.31–0.65
0.01
0–0.04
0.01
0–0.04
0.01
0–0.04
(r = 1) dens(burn_rank) − PBoth veg. types0.10
0.0–0.21
0.01
0–0.02
00
Swainson’s Thrush299psi(burn_cat.)
p(doy + year)
Both veg. types10.73
0.64–0.81
0.66
0.55–0.76
0.52
0.43–0.60
(r = 0.99) dens(burn_rank + year + sdoy) − PBoth veg. types0.88
0.78–0.98
0.60
0.54–0.64
0.39
0.35–0.43
0.26
0.22–0.30
Swamp Sparrow49psi(vegtype + burn_rank) p(year)Peatland0.44
0.27–0.63
0.37
0.23–0.53
0.30
0.19–0.45
0.24
0.13–0.41
Upland0.17
0.09–0.30
0.14
0.08–0.22
0.10
0.06–0.17
0.08
0.04–0.15
dens(vegtype × burn_rank + year) − NBPeatland0.63
0.05–1.20
0.23
0.07–0.38
0.08
0.02–0.15
0.03
0–0.06
Upland0.02
0–0.04
0.02
0–0.04
0.03
0.01–0.04
0.03
0.01–0.06
Yellow-Rumped Warbler170psi(vegtype + burn_rank) p(.)Peatland0.58
0.46–0.70
0.41
0.31–0.51
0.25
0.18–0.33
0.14
0.09–0.20
(r = 0.81) Upland0.72
0.62–0.80
0.55
0.47–0.63
0.37
0.30–0.45
0.22
0.16–0.30
dens(vegtype × burn_rank + year) − PPeatland0.26
0.13–0.39
0.19
0.13–0.26
0.14
0.09–0.20
0.10
0.04–0.17
Upland1.31
1.07–1.55
0.67
0.58–0.77
0.34
0.28–0.41
0.18
0.12–0.23
Species with higher occupancy rates in burned areas
American Robin282psi(burn_rank) p(doy + year)Both veg. types0.45
0.36–0.54
0.73
0.65–0.80
0.90
0.81–0.95
0.97
0.91–0.99
(r = 0.98) dens(burn_rank + year)-PBoth veg. types0.19
0.15–0.23
0.41
0.35–0.46
0.54
0.48–0.60
0.72
0.66–0.78
Canada Jay65psi (burn_binary) p(doy)Both veg. types0.44
0.14–0.79
0.76
0.12–0.99
0.76
0.12–0.99
0.76
0.12–0.99
(r = n/a) dens(.) − PBoth veg. types0.15
0.11–0.18
0.15
0.11–0.18
0.15
0.11–0.18
0.15
0.11–0.18
Chipping Sparrow287psi (vegtype + burn_binary) p(doy + year)Peatland0.69
0.56–0.80
0.79
0.68–0.87
0.86
0.76–092
0.91
0.81–0.96
(r = 0.78) Upland0.58
0.48–0.68
0.69
0.62–0.76
0.79
0.71–0.85
0.86
0.77–0.92
dens(vegtype + burn_binary + year) − PPeatland0.66
0.52–0.80
1.03
0.91–1.16
1.03
0.91–1.16
1.03
0.91–1.16
Upland0.45
0.36–0.54
0.69
0.62–0.77
0.69
0.62–0.77
0.69
0.62–0.77
Dark-Eyed Junco304psi(burn_binary) p(doy + year)Both veg. types0.68
0.57–0.77
0.87
0.79–0.92
0.87
0.79–0.92
0.87
0.79–0.92
(r = 1) dens(burn_binary + year)-PBoth veg. types0.75
0.61–0.88
1.23
1.12–1.35
1.23
1.12–1.35
1.23
1.12–1.35
Lincoln’s Sparrow207psi(vegtype + burn_rank) p(.)Peatland0.58
0.48–0.68
0.65
0.57–0.73
0.72
0.64–0.79
0.78
0.69–0.85
(r = 0.71) Upland0.29
0.23–0.37
0.36
0.31–0.42
0.44
0.38–0.50
0.52
0.44–0.60
dens(vegtype × burn_cat. + year) − NBPeatland1.15
0.79–1.51
2.30
1.70–289
1.09
0.76–1.43
1.07
0.73–1.41
Upland0.09
0.04–0.14
0.27
0.17–0.37
0.27
0.16–0.37
0.39
0.29–0.49
Olive-Sided Flycatcher48psi(burn_binary) p(doy)Both veg. types0.01
0–0.07
0.15
0.11–0.21
0.15
0.11–0.21
0.15
0.11–0.21
(r = 0.78) dens(vegtype + burn_binary) − PPeatland00.07
0.04–0.09
0.07
0.04–0.09
0.07
0.04–0.09
Upland00.03
0.02–0.04
0.03
0.02–0.04
0.03
0.02–0.04
Western
Wood-Pewee
10psi(vegtype + burn_rank) p(doy)Peatland0000
(r = 0.82) Upland0.02
0.01–0.08
0.03
0.01–0.09
0.07
0.03–0.12
0.12
0.05–0.26
dens(vegtype + burn_rank + year) − PPeatland0000
Upland00.01
0–0.02
0.01
0–0.02
0.01
0–0.02
Species with occupancy rates similar between burned and unburned areas
LeConte’s Sparrow27psi(vegtype) p(.)Peatland0.10
0.06–0.15
0.10
0.06–0.15
0.10
0.06–0.15
0.10
0.06–0.15
(r = 1) Upland0.03
0.02–0.06
0.03
0.02–0.06
0.03
0.02–0.06
0.03
0.02–0.06
dens(vegtype + year) − NBPeatland0.26
0.10–0.41
0.26
0.10–0.41
0.26
0.10–0.41
0.26
0.10–0.41
Upland0.02
0–0.04
0.02
0–0.04
0.02
0–0.04
0.02
0–0.04
Palm Warbler93psi(vegtype) p(.)Peatland0.35
0.26–0.46
0.35
0.26–0.46
0.35
0.26–0.46
0.35
0.26–0.46
(r = 0.72) Upland0.20
0.15–0.26
0.20
0.15–0.26
0.20
0.15–0.26
0.20
0.15–0.26
dens(vegtype + burn_rank + year)Peatland0.68
0.40–0.95
0.43
0.29–0.58
0.28
0.18–0.38
0.18
0.09–0.27
Upland0.18
0.11–0.25
0.11
0.08–0.15
0.07
0.05–0.10
0.05
0.02–0.07
Species with occupancy rates that show non-linear response to burn severity and/or whose response depends on vegetation type
Hermit Thrush353psi(burn_category) p(doy + year)Both veg. types0.87
0.79–0.92
0.97
0.85–1
0.91
0.81–0.96
0.86
0.78–0.92
(r = −0.32) dens(vegtype × burn_rank + year)PPeatland0.37
0.30–0.44
0.42
0.37–0.47
0.48
0.43–0.53
0.55
0.47–0.63
Upland0.63
0.56–0.69
0.61
0.56–0.65
0.58
0.55–0.62
0.56
0.51–0.61
White-Crowned Sparrow77psi(vegtype × burn_cat.) p(doy + year)Peatland0.04
0.01–0.24
0.56
0.33–0.77
0.54
0.32–0.75
0.30
0.14–0.51
(r = 0.72) Upland00.06
0.02–0.17
0.25
0.14–0.42
0.34
0.23–0.48
dens(vegtype + burn_cat. + year)NBPeatland0.02
0–0.05
0.30
0.16–0.44
0.29
0.13–0.43
0.43
0.26–0.60
Upland00.06
0.03–0.09
0.06
0.03–0.09
0.09
0.05–0.13
White-Throated Sparrow225psi(vegtype × burn_rank) p(year)Peatland0.74
0.59–0.85
0.73
0.64–0.81
0.73
0.64–0.81
0.73
0.59–0.84
(r = 0.98) Upland0.27
0.20–0.35
0.40
0.32–0.47
0.55
0.49–0.62
0.69
0.61–0.77
dens(vegtype × burn_rank + year)PPeatland0.47
0.35–0.59
0.50
0.41–0.58
0.53
0.44–0.62
0.56
0.42–0.70
Upland0.08
0.05–0.11
0.15
0.11–0.18
0.26
0.22–0.31
0.47
0.37–0.57
Table 2. Mean species richness (±95% C.I.) across vegetation types and burn severity in each year (Alpha visits 2015 and 2016), with years combined (Alpha (station)), Gamma diversity, and functional diversity. Results are shown as means and 95% confidence intervals. Mod. = moderate.
PeatlandUpland
Community MetricBest ModelControlLowMod.HighControlLowMod.High
Alpha (visit)
2015
vegtype × burn_rank + year5.6
5.3–6.0
5.1
4.9–5.4
4.6
4.4–4.9
4.2
3.8–4.5
3.4
3.1–3.6
3.3
3.1–3.5
3.2
3.1–3.4
3.2
2.9–3.4
2016 7.5
7.1–7.8
7.0
6.7–7.2
6.5
6.2–6.8
6.0
5.6–6.4
5.2
4.9–5.5
5.1
5.0–5.3
5.1
4.9–5.3
5.0
4.8–5.3
Alpha (station)vegtype × burn_cat.11.5
10.7–12.2
10.9
10.2–11.6
9.5
8.7–10.2
9.1
8.3–9.9
8.5
7.9–9.1
7.8
7.2–8.4
8.0
7.4–8.7
7.9
7.4–8.4
Gamman/a30.3
27–32
27.8
25–30.5
23.4
21–26
23.4
21–25
22.6
19–26
20.7
17–24
22.5
19–25
22.1
19–25
Functional diversityburn_cat.0.61
0.58–0.64
0.53
0.50–0.56
0.47
0.44–0.50
0.44
0.42–0.47
0.61
0.58–0.64
0.53
0.50–0.56
0.47
0.44–0.50
0.44
0.42–0.47
Table 3. Effects of burn severity on species included in our study and reported by other studies in North America. A “+” symbol indicates an increase in bird abundance with fire severity, a “−” indicates a decrease with severity/indicates no response to severity, “int” indicates an intermediate response (i.e., quadratic) to severity. Blank cells indicate the species was not observed in that study. The results from Alberta [25] are not response to severity, but indicate whether the species is more likely to be found in younger forests post-fire in 5 major vegetation types in boreal Alberta. Two symbols indicate that two or more vegetation types or spatial locations were compared within a study and showed different responses. “.” indicates the vegetation type was not used by a species. Location abbreviations are: NWT = Northwest Territories, Canada; MN = Minnesota, USA; CA = California, USA; QB = Quebec, Canada; AZ = Arizona, USA; OR = Oregon, USA, ID = Idaho, USA; MT = Montana, USA; AB = Alberta, Canada.
Reference NumberThis Study[68][69][70][30][71][72][37][36][25]
Year2020201220192018201120062015201620162020
LocationNWTUSAMNCAQBAZORID, AZMTAB
Alder Flycatcher + / +++++
American Robin+/+ // //+//+
Canada Jay+ −−/−−
Chipping Sparrow+int+ /−/++−−/−−
Common Yellowthroat/+ +++++
Dark-Eyed Junco+//int+ −/−−/−−
Hermit Thrushint/+ int−−−−−
LeConte’s Sparrow/ +++++
Lincoln’s Sparrow+ + +++++
Orange-Crowned Warbler −−−−−
Olive-Sided Flycatcher++/int/ + −−/+−
Palm Warbler/ −−−−−
Ruby-Crowned Kinglet −−−−−
Ruffed Grouse −−−−−
Swamp Sparrow + …//
Swainson’s Thrush / −−−−−
White-Crowned Sparrowint/ …//
Western Wood-Peewee+ + +++/++
White-Throated Sparrow/+++ / +++++
Yellow-Rumped Warblerint−/int−−−−−
Publisher’s Note: MDPI stays neutral with regard to jurisdictional claims in published maps and institutional affiliations.

