Article

Studies into Fungal Decay of Wood In Ground Contact—Part 1: The Influence of Water-Holding Capacity, Moisture Content, and Temperature of Soil Substrates on Fungal Decay of Selected Timbers

by
Brendan Nicholas Marais
*,
Christian Brischke
,
Holger Militz
,
Johann Hinrich Peters
and
Lena Reinhardt
Wood Biology and Wood Products, University of Goettingen, 37077 Goettingen, Germany
*
Author to whom correspondence should be addressed.
Forests 2020, 11(12), 1284; https://doi.org/10.3390/f11121284
Submission received: 30 October 2020 / Revised: 23 November 2020 / Accepted: 27 November 2020 / Published: 29 November 2020
(This article belongs to the Special Issue Modeling the Performance of Wood and Wood Products)

Abstract

:
This article presents the results from two separate studies investigating the decay of wood in ground contact using adapted versions of laboratory-based terrestrial microcosm (TMC) tests according to CEN/TS 15083-2:2005. The first study (A) sought to isolate the effect of soil water-holding capacity (WHCsoil [%]) and soil moisture content (MCsoil [%WHCsoil]) on the decay of five commercially important wood species; European beech (Fagus sylvatica), English oak heartwood (Quercus robur), Norway spruce (Picea abies), Douglas-fir heartwood (Pseudotsuga menziesii), and Scots pine sapwood (Pinus sylvestris), while keeping soil temperature (Tsoil) constant. Combinations of soil mixtures with WHCsoil of 30%, 60%, and 90%, and MCsoil of 30%, 70%, and 95%WHCsoil were utilized. A general trend showed higher wood decay, measured in oven-dry mass loss (MLwood [%]), for specimens of all species incubated in soils with WHCsoil of 60% and 90% compared to 30%. Furthermore, drier soils (MCsoil of 30 and 70%WHCsoil) showed higher MLwood compared to wetter soils (95%WHCsoil). The second study (B) built on the first’s findings, and sought to isolate the effect of Tsoil and MCsoil on the decay of European beech wood, while keeping WHCsoil constant. The study used constant incubation temperature intervals (Tsoil), 5–40 °C, and alternating intervals of 10/20, 10/30, and 20/30 °C. A general trend showed drier MCsoil (60%WHCsoil), and Tsoil of 20–40 °C, delivered high wood decay (MLwood > 20%). Higher MCsoil (90%WHCsoil) and Tsoil of 5–10 °C, delivered low wood decay (MLwood < 5%). Alternating Tsoil generally delivered less MLwood compared to their mean constant Tsoil counterparts (15, 20, 25 °C). The results suggest that differences in wood species and inoculum potential (WHCsoil) between sites, as well as changes in MCsoil and Tsoil attributed to daily and seasonal weather patterns can influence in-ground wood decay rate.

1. Introduction

Wood is one of the oldest raw materials used worldwide. As a construction material, it is used in a variety of manners, both indoors and outdoors. Due to its renewable and biodegradable properties, wood is becoming increasingly important when considering more environmentally friendly and sustainable construction materials. However, being renewable and biodegradable also poses considerable challenges to its utilization, requiring design measures to prevent degradation and extend service-life [1].
Wooden components are subjected to in-service factors causing decay that leads to a loss in functional performance (serviceability) or structural resistance. Outdoor wooden components are subjected to a variety of biotic and abiotic degradation factors. Wood used outdoors, in-ground contact, is especially prone to factors linked to accelerated degradation, due in-part to the permanent to semipermanent exposure to moisture (abiotic) and its role in the physiological requirements of wood-decaying fungi (biotic) [2]. Spores of wood decay fungi are ubiquitous and can be encountered in use situations all over the world, even in the harsh, subfreezing conditions of Antarctica [3]. Due in-part to ubiquity, wood decaying fungi are considered the most important biotic influencer to in-ground wood decay in the absence of termites and a water body which can host marine borers [4].
Important considerations for the successful proliferation of wood-decaying fungi include a carbon substrate, moisture, temperature, and oxygen [5,6]. Brown-, white-, and soft-rot fungi, can all be found on wood utilized in-ground, but these decay types can vary significantly, not only in frequency and spatial distribution, but also in combinations from one site to the next [7,8], and with decay progress [9,10].
Wood decay strongly depends on the decay type, whereby soft-rot, is considered to develop more slowly than white- and brown-rot [11]. Decay rate is also dependent on the respective physiological requirements of the decay types present. Soft-rot seems to be able to cope with high soil moisture content (MCsoil) better than brown- and white-rot fungi, and continues to remain active over a broader temperature range (Tsoil) compared to brown- and white-rot fungi [7,12,13]. These varying requirements for optimum decay activity provided the basis for testing the effect of varying abiotic, soil-level variables, and their effect on wood decay (MLwood).
Semifield, terrestrial microcosm (TMC) experiments were designed to mimic conditions found outdoors and were first used in the 1970s to investigate wood durability. During this time, such experiments were carried out without much standardization and were proven difficult to reproduce [14,15]. The advent of a soil water-holding capacity (WHCsoil) and MCsoil parameter within these experiments made for a noticeable leap forward in the standardization and reliability of inferred results [16,17]. Brischke and Wegener [18] investigated soil-wood moisture diffusivity over a 3-week trial period using soil substrates of various WHCsoil and MCsoil in TMC experiments. The study found that the lower the WHCsoil, the higher the MCwood for the same MCsoil. This means soils with high WHCsoil, but low MCsoil, deliver less plant-available water (for decay organisms) than soil with WHCsoil at the same MCsoil [13]. However, the effect on wood decay is also dependent on the soil’s inoculum potential, i.e., the activity level of the soil’s microorganism community under specific moisture conditions. The standard CEN/TS 15083-2:2005 [19] requires WHCsoil of 20–60%, so as to standardize soil decay activity and to bring about consensus in wood durability ratings delivered by different studies. Soils with excessive decay activity (i.e., WHCsoil > 60%) will create bias in wood decay and durability ratings. To reduce WHCsoil, silica sand can be added to ‘dilute’ the inoculum potential to within WHCsoil of 20–60%. CEN/TS 15083-2:2005 [19] also requires MCsoil to be fixed at 95% of the WHCsoil (i.e., %WHCsoil), while Tsoil be fixed at 27 °C to isolate soft-rot fungal activity. The purpose of isolating soft-rot in unsterile soil tests is to complement pure fungal culture tests CEN/TS 15083-1:2005 [20] and also serve to recreate and rapidly test wood under conditions found outdoors in ground contact. These tests also complement field tests such as EN 252:2015 [21] and AWPA E7-15 [22]. However, conditions required for CEN/TS 15083-2:2005 [19] are not always representative and realistically comparable to outdoor in-ground conditions. Soil can be drier than 95%WHCsoil and cooler than 27 °C for many months of the year, giving way to the proliferation of other soil-inhabiting microorganisms which could be more aggressive than soft-rot fungi.
Wood used in ground contact is subject to temperature fluctuations both above and below the soil surface. Wells and Boddy [23] tested the effect of temperature on wood decay and found that decay was higher at 25 °C compared to 10 °C. The tests used unsterile soil in petri dishes with wood specimens placed on top of the soil (on-ground decay). Other studies such as Risch et al. [24] and Finér et al. [25], found soil temperature, and to a lesser extent, soil phosphorous concentration and available nitrogen, to be the best explanatory variables for the differences in wood decay between sites.
To investigate the effect of the abiotic, soil-level variables on the durability of wood used in ground contact, TMC experiments according to CEN/TS 15083-2:2005 [19] were undertaken in two separate studies: Study (A) examined the effect of (1) WHCsoil and (2) MCsoil on decay progress while keeping (3) Tsoil constant. Study (B) kept examined the effect of (2) MCsoil and (3) Tsoil while keeping (1) WHCsoil constant.
Software packages such as TimberLife [26] have developed a means towards modeling in-ground wood decay progression, and by extension durability and service-life. Durability and service-life show a clear link through the overlapping of data requirements used in these study fields [27]. The service-life of a product or component incorporates the concept of durability, but with additional information relating to usable lifespan. Part 2 of this research article series seeks to use a ‘dosimeter’ approach in modeling of in-ground wood decay [28]. Originally developed for aboveground wood, a dose–response approach will be applied to the obtained data sets.

2. Materials and Methods

2.1. Standard Test Requirements

Due to the similarity in methodology of study (A) and study (B), the following section regarding experimental methods is presented as relevant to both. Where necessary, differences in experimental methods are distinguished using capital lettering, study (A), or study (B). If relevance to (A) or (B) is not stipulated, the methodology applies to both.
Terrestrial microcosms (TMCs) in accordance with CEN/TS 15083-2:2005 [19] were utilized in semifield experiments. The standard stipulates that a natural topsoil or a fertile loam-based horticultural soil substrate is used, with pH 6–8 and no additives. The soil should have a WHCsoil of 20–60%, MCsoil equal to 95%WHCsoil, and the test should be conducted in a dark, climate-controlled room set to a temperature of 27 °C and relative humidity of 65%.

2.2. Preparation of Terrestrial Microcosms (TMC)

2.2.1. Soil Substrates

The basis of the substrate was a horticultural compost produced at the forest botanical garden at the University of Göttingen’s North Campus. The compost comprised fallen leaves and cuttings from grass and trees. Soil was passed through a sieve with nominal aperture size of 8.5 mm. WHCsoil was then determined according to the ‘cylinder sand bath method’ according to ISO 11268-2 [29]. To lower the WHCsoil of the base compost substrate, silica sand (0–0.2 mm grain size) was added. Study A used substrates with WHCsoil of 30%, 60%, and 90%, while study B only used substrates with WHCsoil of 60%.

2.2.2. Determination of the Soil Moisture Content (MCsoil)

Soil samples of 50–90 g (depending on the soil density) were taken for determining the soil moisture content (MCsoil). Three replicate samples were taken, weighed to the nearest 0.01 g, oven-dried at 103 °C for 24 h, and weighed again. MCsoil was calculated according to Equation (1) below.
M C s o i l = ( m w   m 0 m 0 )   ×   100
where M C s o i l is the soil moisture content [%]; m w is the wet soil mass [g]; m 0 is the oven-dry soil mass [g].

2.2.3. Determination of the Soil Water-Holding Capacity (WHCsoil)

Soil was inserted into polyethylene cylinders 10 cm long with 4 cm diameter. The bottoms of the cylinders were covered with a fine polymer grid and filter paper (MN 640 W 70 mm). All cylinders were filled with soil to a height of 5–7 cm and saturated in an 8 cm high water bath for 3 h. After the saturation period, the cylinders were placed on a water saturated sand bath for 2 h to allow unbound water within the soil-filled cylinders to drain to reach the equivalent of field capacity. The soil samples were then weighed wet, as well as after oven-drying at 103 ± 2 °C for 24 h. WHCsoil [%] was calculated according to Equation (2) below.
W H C s o i l =   ( m s m 0 m 0 )   ×   100
where W H C s o i l is the soil water-holding capacity [%]; m s is the saturated soil mass [g]; m 0 is the oven-dry soil mass [g].

2.2.4. Preparation of Mixed Soil Substrates

To mix the different soil substrates of compost and sand to the predetermined WHCsoil of 30%, 60%, and 90%, the WHCsoil of soils mixed in incremental ratios based on oven-dry mass was first determined. where WHCsoil is the target water-holding capacity of the soil mixture [%]; x is the fraction of sand substrate in the total soil mixture based on oven-dry mass [%]; R 2 is the coefficient of determination between actual and predicted values.
Table 1 below shows the incremental soil mixtures used to establish a WHCsoil regression equation for the substrates sand and compost. To prepare mixed soil substrates for testing WHCsoil, Equation (3) below was used.
m x ,   w e t =   m t o t a l ,   d r y   ×   ( x 100 )   ×   ( 1 +   M C x 100 )
where m x ,   w e t is the mass of the wet substrate x [g]; m t o t a l ,   d r y is the oven-dry mass of the total soil mixture [g]; x is the fraction of the substrate (sand or compost) in the total soil mixture m t o t a l ,   d r y based on oven-dry mass [%]; M C x is the moisture content of the soil substrate x [%].
A regression between the incremental mixing ratios of the two substrates sand and compost and their resulting WHCsoil was determined. Equation (4) below shows the regression relationship for WHCsoil of the two substrates used to define the mixture percentages to attain mixed soil substrates with WHCsoil of 30%, 60%, and 90% for study (A), while Equation (5) below shows the regression relationship for WHCsoil for study (B) to attain mixed soil substrates with WHCsoil of 60%. where WHCsoil is the target water-holding capacity of the soil mixture [%]; x is the fraction of sand substrate in the total soil mixture based on oven-dry mass [%]; R 2 is the coefficient of determination between actual and predicted values.
Table 1 below shows the output from computations using Equations (4) and (5).
W H C s o i l = 0.0029 x 2 0.4501 x + 104.35           R 2 = 0.9961
W H C s o i l = 0.0004 x 2 0.6796 x + 102.19           R 2 = 0.9914
where W H C s o i l is the target water-holding capacity of the soil mixture [%]; x is the fraction of sand substrate in the total soil mixture based on oven-dry mass [%]; R 2 is the coefficient of determination between actual and predicted values.

2.2.5. Preparation of Mixed Soil Substrates to Reach Target Soil Moisture Content (MCsoil,target)

Once the soil mixtures with target WHCsoil of 30%, 60%, and 90% were attained, three MCsoil were decided on for study (A); equal to 30, 70 and 95%WHCsoil. Two MCsoil were decided on for study (B); equal to 60 and 90%WHCsoil. Distilled water was added to the soil mixtures to reach MCsoil equal to 30, 70 and 90%WHCsoil, shown here as MCsoil,target [%]. Therefore, distilled water was added to reach MCsoil,target as shown below in Table 2. Equation (6) below was used to calculate the mass [g] in distilled water required to add to the soil mixture to reach MCsoil,target. If the soil was too moist to start with, the soils were placed in drying ovens set to 30 °C to dry out until the MCsoil,target was reached. To account for losses in MCsoil resulting from fungal activity and evaporation, rewetting to MCsoil,target occurred once per week throughout the 16-week incubation period.
m w a t e r = ( M C s o i l , t a r g e t M C s o i l , c u r r e n t 100 )   × m t o t a l ,   d r y
where m w a t e r is the mass of distilled water to add to the soil mixture [g]; M C s o i l , t a r g e t is the target soil moisture content [%]; M C s o i l , c u r r e n t is the current moisture content of the soil mixture before adding any additional water [%]; m t o t a l ,   d r y is the oven-dry mass of the total soil mixture [g].

2.2.6. Soil Temperature (Tsoil) Control

For study (A), TMC boxes were stored in a temperature-controlled room set to a temperature of 20 ± 2 °C, while for study (B), climate chambers were used to incubate the TMCs and simulate differences in Tsoil. In total, eight constant Tsoil and three alternating Tsoil were investigated. Constant Tsoil rose in 5 °C intervals from 5 to 40 °C, while alternating Tsoil cycled to 10/20, 10/30, and 20/30 °C. Temperature was changed once every 7 days for TMCs of alternating Tsoil, meaning that a full cycle of alternation lasted 14 days, or 2 weeks. Two TMCs per Tsoil were prepared. In total, 22 TMCs were prepared; one TMC per Tsoil (eight fixed, three alternating), per MCsoil (60 and 90%WHCsoil). Relative humidity of 65% was maintained in all climate chambers.

2.2.7. Preparation and Exposure of Wood Specimens

In study (A) European beech (Fagus sylvatica L.), Norway spruce (Picea abies Karst.), Scots pine sapwood (Pinus sylvestris L.), English oak heartwood (Quercus robur L.), and Douglas-fir heartwood (Pseudotsuga mensziesii Franco.) were used. Specimens of 5 × 10 × 100 (ax.) mm3 were prepared, in accordance with CEN/TS 15083-2:2005 [19]. Kiln-dried boards (>60 °C) were conditioned to wood moisture content (MCwood) of 12 ± 2%. Specimens were then prepared from planed strips of the boards, with a cross-section of 10 ± 0.1 mm × 5 ± 0.1 mm. Annual rings were orientated 90 ± 15° to the broad face of the specimen (i.e., 10 mm face). Transverse cuts of the cross-section delivered sharp edges and a fine-sawn finish to the end-grain surface, with a final specimen length of 100 ± 1 mm. All specimens were free from defects such as cracks, decay, and discolouration.
After specimen preparation, all specimens were oven-dried at 103 °C for 24 h and weighed for oven-dry mass to the nearest 0.001 g. Prior to soil exposure, all specimens were again conditioned to MCwood of 12 ± 2% (confirmed by Equation (7) below) and buried 4/5 of their length into the soil substrate with 120 specimens per TMC box. In total, 1080 test specimens were used; eight replicate specimens for each of the five wood species, three specimen removal intervals (8, 12, 16 weeks), and nine different soil conditions. After soil exposure, specimens were removed, cleaned of remaining soil, and again oven-dried at 103 °C for 24 h. Specimens were then weighed again to the nearest 0.001 g with oven-dry wood mass loss (MLwood) calculated according to Equation (8) below. Mean MLwood and standard deviation of mean MLwood was calculated according to Equations (9) and (10) below.
M C w o o d = ( m 3   m 2 m 2 )   ×   100
where M C w o o d is the wood moisture content [%]; m 3 is the wood specimen’s mass after TMC exposure [g]; m 2 is the wood specimen’s oven-dry mass after TMC exposure [g].
Oven-dry mass loss (MLwood) and wood was calculated according to Equation (8) below.
M L w o o d = ( m 1   m 2 m 1 )   ×   100
where M L w o o d is the wood specimen’s oven-dry mass loss [%]; m 1 is the wood specimen’s oven-dry mass before TMC exposure [g]; m 2 is the wood specimen’s oven-dry mass after TMC exposure [g].
Mean MLwood was calculated according to Equation (9) below.
m e a n   M L w o o d = 1 n i = 1 n x i
where m e a n   M L w o o d is the arithmetic mean of the oven-dry mass loss of the sample population [%]; x i is the oven-dry mass loss (MLwood) of each individual wood specimen in the sample population [%]; n is the total number of wood specimens in the sample population.
Standard deviation of mean MLwood was calculated according to Equation (10) below.
s = i = 1 n ( x i x ¯ ) n 1
where s is the standard deviation of the sample population; x i is the oven-dry mass loss (MLwood) of each individual wood specimen in the sample population [%]; x ¯ the mean oven-dry wood mass loss (mean MLwood) of the sample population [%]; n is the total number of wood specimens in the sample population.
In study (B), European beech wood specimens of 5 × 10 × 100 (ax.) mm3 were prepared in the same manner as study (A), i.e., in accordance with CEN/TS 15083-2:2005 [19]. Specimens were also buried 4/5 of their length into the soil substrate, but rather with 80 specimens per TMC. A subset of 10 replicate specimens was removed every 2 weeks. In total, eight exposure intervals, 11 Tsoil (eight fixed, three alternating), and two MCsoil (60 and 90%WHCsoil), delivered a total of 1760 beech wood specimens used in the study.

3. Results and Discussion

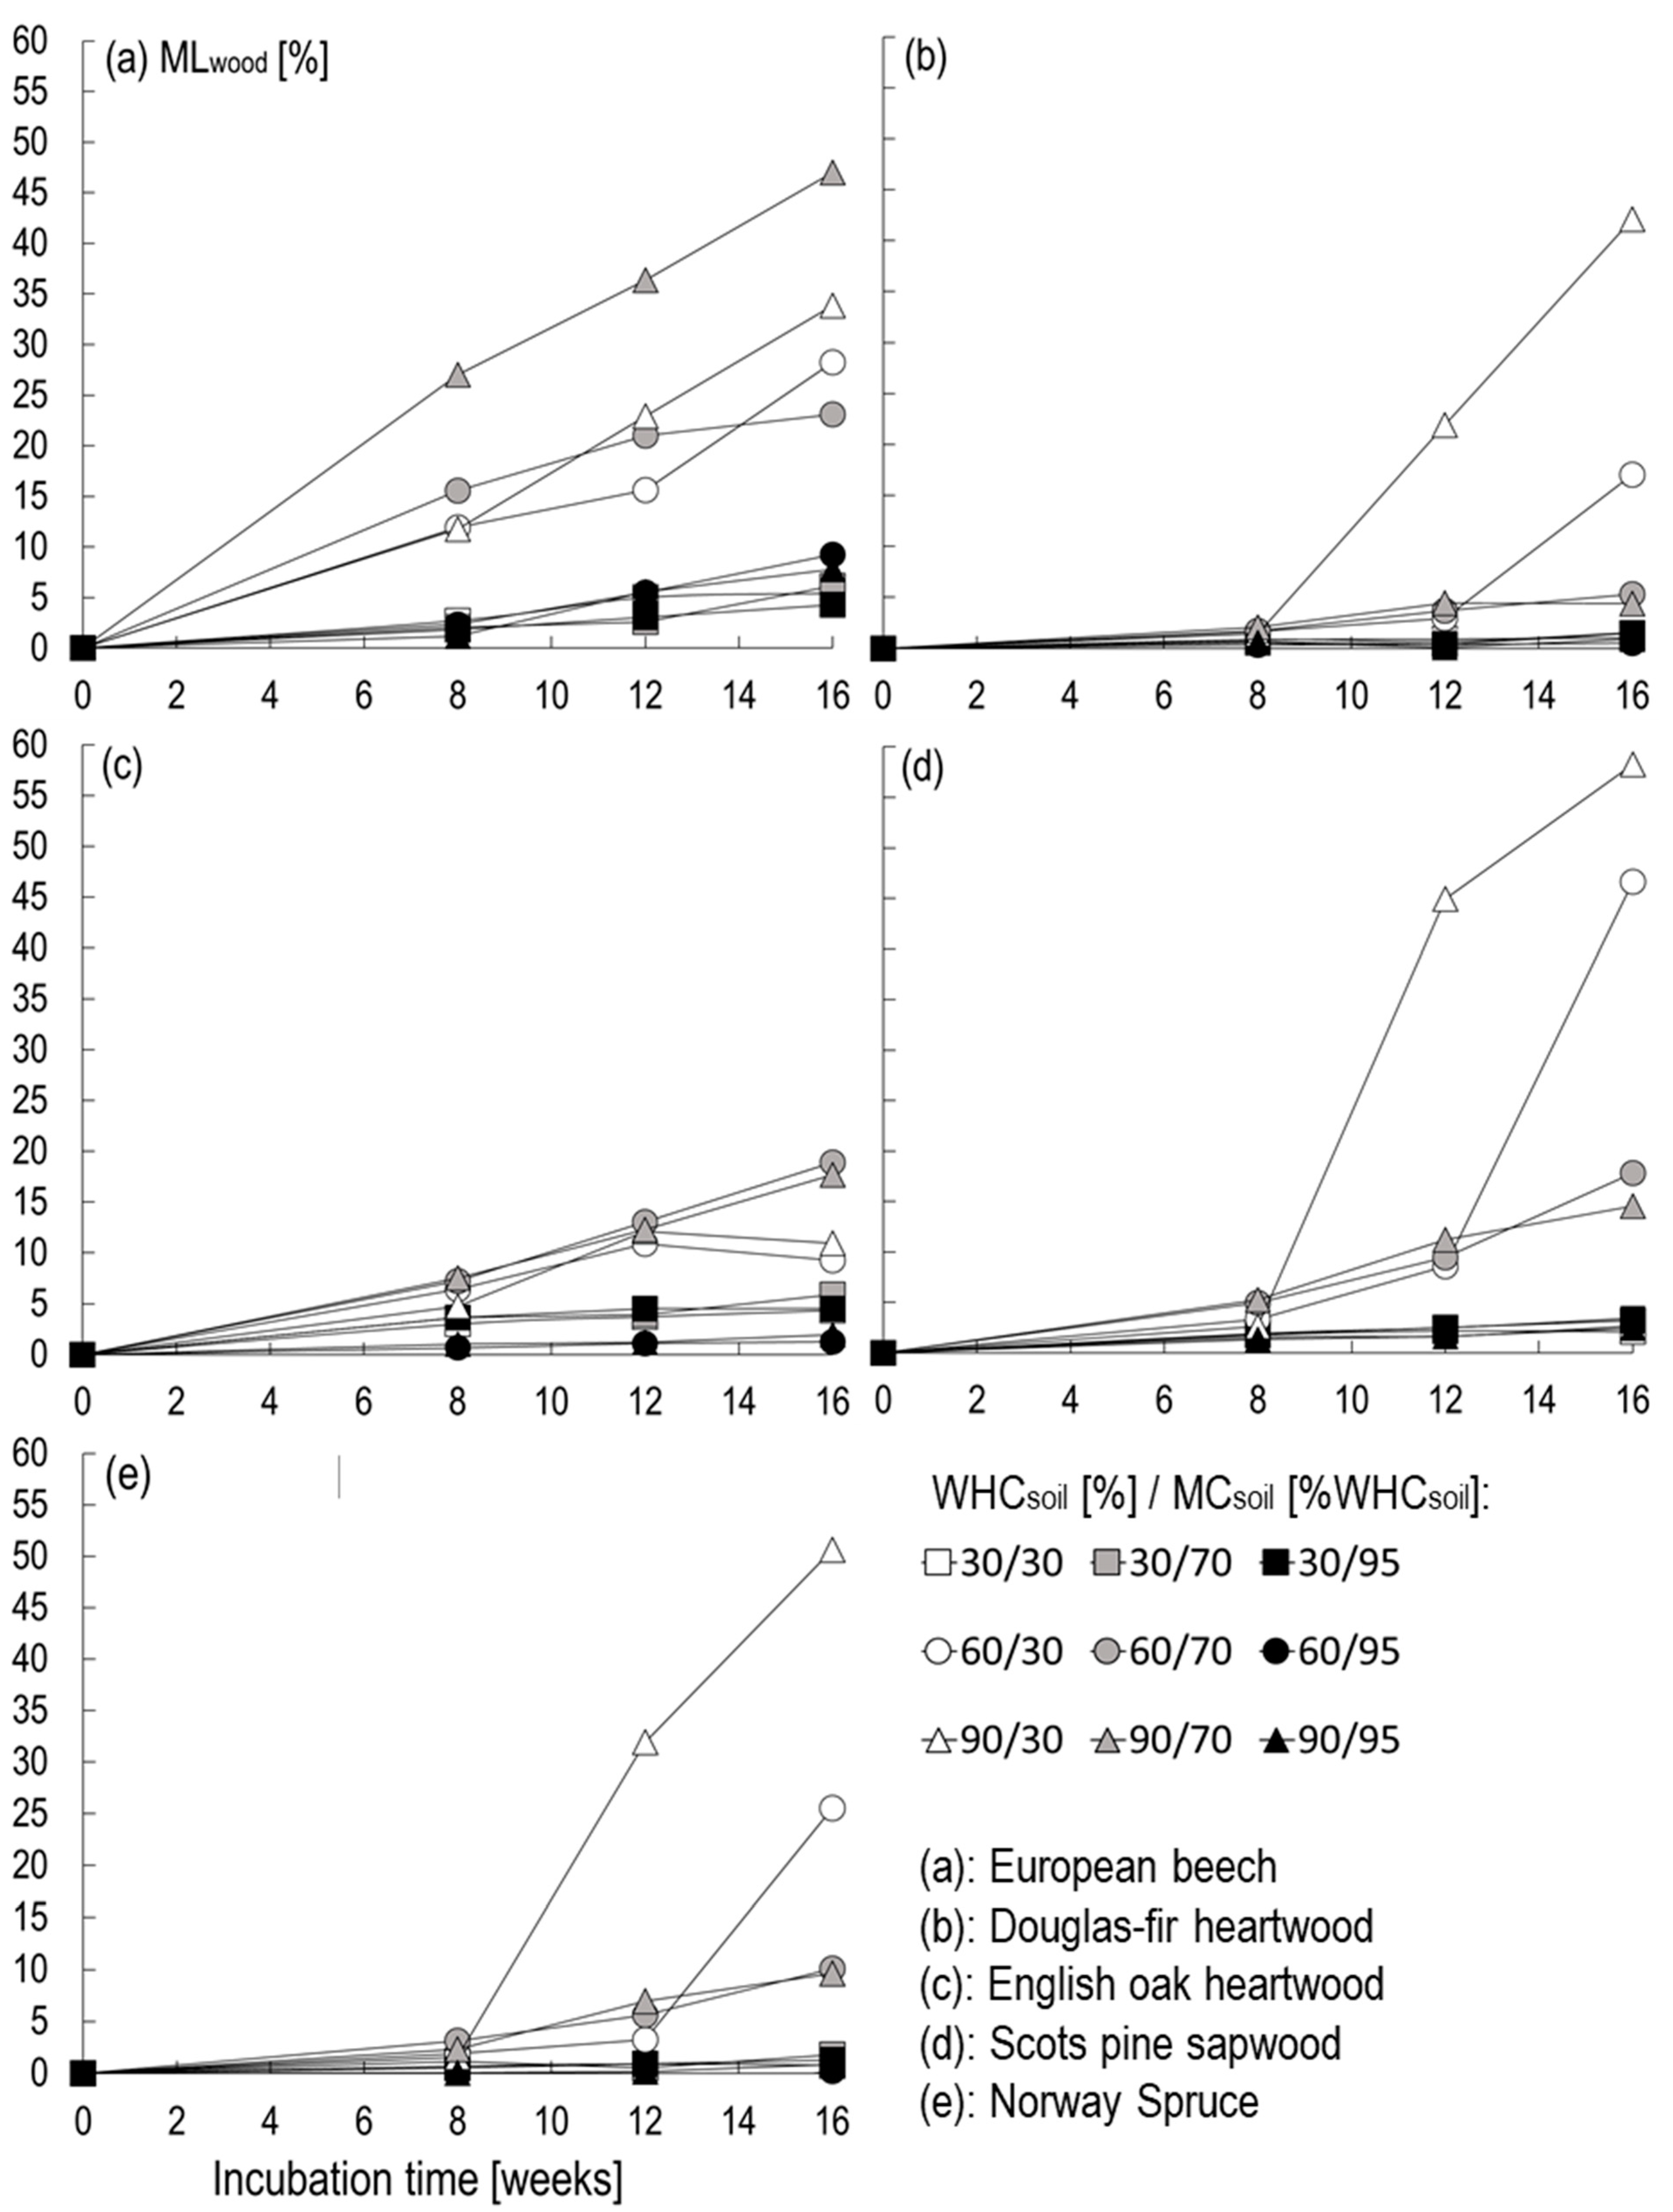
3.1. Impact of WHCsoil and MCsoil on Fungal Decay (Study A)

The mean MLwood of all five wood species used in study (A) during 16 weeks of incubation is shown in Figure 1. Oak seemed the most resilient to high MLwood of all tested wood species with the maximum mean MLwood not exceeding 20%. When considering mean MLwood across all soil conditions measured at the 16 week incubation interval, wood species with low durability (in ground contact) such as beech and Scots pine sapwood [30] showed the highest mean MLwood, i.e., 18% and 17%, respectively (Table 3). All species generally showed higher mean MLwood in the soil mixtures with WHCsoil of 60% and 90% compared to 30%. This was attributable to the high percentage of silica sand constituting almost 100% of the soil mixtures with WHCsoil of 30%, which showed a lower presence of microorganisms compared to the soil mixtures with WHCsoil of 60 and 90%. Although only limited MLwood occurred in soils with WHCsoil of 30%, the result remains important nonetheless, to gain an understanding of wood decay across a broad range of WHCsoil. Soil particle size distribution is an underlying determinant of WHCsoil [31]. However, other sandy soil types with comparable particle size distribution and WHCsoil can possess a different (and potentially higher) wood decay potential than the sandy soils used in this study. The sand used in this study was purchased from a supplier and packaged in 25 kg bags. This means the sand was subject to industrial processes such as sieving for consistent particle size distribution (0–0.2 mm grain size) and drying to ensure consistent packaging quantities. This would naturally result in a lower inoculum potential compared to undisturbed sandy soils.
Soils with MCsoil of 95%WHCsoil showed consistently lower MLwood than drier soils with MCsoil of 30 and 70%WHCsoil. Increased moisture also stimulates microbial activity; however, decay was impaired once an optimal level of MCsoil and MCwood was exceeded. Full mean MLwood data with accompanying standard deviation can be found in Appendix A. Table A1, Table A2, Table A3, Table A4 and Table A5 in Appendix A are presented in order of wood species.
Besides a source of fungal inoculum itself (mycelium or spores), Zabel and Morrell [32], list four critical requirements for fungal growth in wood, namely, a source of free or unbound water, favorable temperatures (approximately 0–42 °C), atmospheric oxygen, and a digestible carbon substrate. In addition to these requirements comes the added complexity of understanding which specific fungi types are active throughout various ranges of these critical requirements, and if any of these requirements (reagents) were only available in limited quantity. Extensive research has already been conducted to illustrate that different soils in different locations can deliver different dominating decay rates and types [8,33,34,35,36,37,38].
While this study used one soil characteristic, WHCsoil, as a metric to describe the soil’s capillarity or moisture retention ability, the broader concept of pedogenesis (soil formation or development) begins to show relevancy for outdoor, in-field wood decay testing. Soil genesis describes how a soil, in all of its layers, came to be in its present state. Environmental factors in parent material (underlying geology), climate, biota (organisms), topography, and time, operate through soil processes of additions, losses, translocations, and transformations to form soils [39]. This means that soils from different locations, and soil layers (horizons) within a single soil profile can show varying characteristics in their physical, biological, and chemical composition. All of these can influence microorganism decay activity. However, within this study’s controlled environment, WHCsoil, MCsoil, and wood species still showed promise as prediction variables to MLwood, due simply to the role of moisture in fungal wood decay, that is without moisture, wood decay ceases.
Oxygen availability in soil should also be kept in mind when considering moisture availability. Under conditions of high MCsoil, oxygen availability decreases, since the soil pore spaces become filled with liquid, which in-turn slows wood decay. Examinations of wooden foundation piles have confirmed a protective effect of high soil moisture levels. In waterlogged, anaerobic soils, wood decay is found to progress slowly through wood-decaying bacteria while aggressive wood-decaying fungi are suppressed [40,41].

3.2. Impact of Tsoil and MCsoil on Fungal Decay (Study B)

3.2.1. Constant Tsoil

The mean MLwood of 10 beech wood specimens for every Tsoil and every 2-week specimen removal interval over the 16-week incubation period is shown in Figure 2. At constant Tsoil, TMCs with lower MCsoil (60%WHCsoil, Figure 2a,c below) delivered higher MLwood than those with higher MCsoil (90%WHCsoil, Figure 2b,d below). Lower MCsoil in combination with Tsoil of 15–40 °C were favorable decay conditions (MLwood > 20%), with optimum MLwood occurring at 35 °C. However, 35 °C also showed the highest standard deviation of 13.9% (Appendix A: Table A6).
Higher MCsoil in combination with low Tsoil of 5–10 °C showed unfavorable decay conditions (MLwood < 5%), where temperature alone could not be held accountable for the inhibited decay, with increased MCsoil also contributing [42]. For higher MCsoil, the optimum Tsoil was 25 °C with MLwood at 16.0% after 16 weeks of incubation. This value corresponded to MLwood at 10 °C for specimens exposed to lower MCsoil. Interestingly, 40 °C seemed to show consistently higher MLwood compared to 25 °C throughout the early and middle incubation periods, however 25 °C ultimately showed higher MLwood after 16 weeks.
For both MCsoil conditions, MLwood also increased with incubation time. Generally, for both MCsoil conditions tested, MLwood increased with Tsoil. However, some Tsoil intervals showed exceptions to this trend, such as 15 and 35 °C for MCsoil of 90%WHCsoil. It was assumed that problems related to ventilation within the climate chamber led to inconsistent results here.
Previous studies investigating in-ground wood decay have confirmed an interactive relationship between MCsoil and Tsoil on wood decay [42,43]. Soil moisture has the potential to alter the response of fungal growth to warming, meaning that wood decay can be inhibited if soil is too wet or too dry [44]. Elevated temperature (3 °C above ambient of 15 °C) did not significantly increase wood decomposition rate alone or in combination with increases in MCwood and MCsoil [42]. However, drying (of both soil and wood), results in a decreased wood decay rate [42], coincidently illustrated for 15 °C with MCsoil of 90%WHCsoil, where excessive ventilation (drying) could be to blame.
Figure 2c,d plotted MLwood against Tsoil as a function of incubation period (2-16 weeks), for both lower and higher MCsoil. From this, the effect that changes in Tsoil had on MLwood could be deduced. Decay rate can increase more drastically with an increase in Tsoil later in the incubation period compared to earlier in the incubation period. This can be seen from the steeper gradient of MLwood with increasing incubation period, and is illustrated clearly in Figure 2c, where clear differences in MLwood are discernible.
For MCsoil of 60%WHC (Figure 2c above), the effect that an increase in the Tsoil from 5 to 35 °C had on MLwood could be seen by comparing MLwood at the exposure intervals of 4 and 16 weeks. After 4 weeks, increasing Tsoil by 1 °C, MLwood increased by 0.6%; towards the end of the study period, after 16 weeks, MLwood changed by 1.0%. It can be assumed that the increased rate of decay is related to the development of wood-decaying microorganisms. This assumption is consistent with the observation of Eaton and Hale [45], that at the beginning of exposure there was a comparatively low mass of microorganisms in the test soil as well as in the wooden test specimens. After an initial phase of fungal colonization, decay of the wooden substrate began. Changes in temperature therefore have a greater effect the further decay progresses [46].
For a given fungi species (and isolate), above the lower Tsoil decay activity limit, the “reaction speed-temperature (RST) rule” begins to take effect, which states that in a certain temperature range, increasing the temperature by about 10 °C, enzyme activity (and therefore decay rate) runs faster by a factor of 2–4. Frequently, the optimum lies, depending on the species (and isolate) between 20 and 40 °C [4,47].
For lower MCsoil (Figure 2c above), increasing Tsoil from 5 to 15 °C increased MLwood by a factor of 1.97 (10 weeks incubation) to 5.42 (2 weeks incubation) and thus a factor of 2.0 for almost all incubation intervals of this Tsoil range was exceeded. When Tsoil was increased from 10 to 20 °C, the factor increases only exceeded 2.0 for the first three incubation intervals (2, 4, and 6 weeks). The RST rule was thus only confirmed for lower Tsoil and especially at the beginning of the incubation period.
A review of the RST rule for MCsoil of 90%WHCsoil showed an overall more heterogeneous picture due to the peaks at 25 and 40 °C and low MLwood values at 15 °C (Figure 2d above). Consequently, Tsoil increase from 15 to 25 °C, resulted in MLwood increasing by a range of factors, starting at 3.55 (4 weeks incubation) to 7.92 (6 weeks incubation). With Tsoil increased from 30 to 40 °C, the factor only exceeded 2.0 for the incubation intervals of 4–8 weeks. The low MLwood of Tsoil at 15 °C, did indeed confirm the RST rule for Tsoil interval from 15 to 25 ° C, but was only of limited significance due to low MLwood at 15 °C causing an overrated MLwood at higher Tsoil. Overall, it was found that the RST rule could only be confirmed for individual Tsoil intervals and therefore could not be confirmed generally for both MCsoil ranges. It should also be mentioned that MLwood was used to test the validity of the RST rule because it was assumed that MLwood was proportional to fungal enzyme activity and therefore wood decay rate. However, fungal enzyme activity and wood decay rate should not be used synonymously since many factors determine wood decay rate as measured by oven-dry mass loss, such as wood species, fungal community composition, fungal community succession, and MCsoil, to mention but a few. More information regarding various factors influencing wood decay and service-life can be found in Marais et al. [48]. Full mean MLwood data with accompanying standard deviation for constant Tsoil can be found in Appendix A: Table A6 and Table A8.

3.2.2. Alternating Tsoil

The test specimens in TMC with alternating Tsoil showed a similar trend to those with constant Tsoil conditions. MLwood of test specimens exposed to MCsoil of 60%WHCsoil showed an influence from Tsoil at the start of the test period, which became clearer throughout the course of the test (Figure 3a,c,e below). Here too, MLwood after 16 weeks was greater than 20%, except for Tsoil at 10/20 ° C with MLwood of 19.4%. As with constant Tsoil, MLwood for MCsoil of 90%WHCsoil was considerably lower than for MCsoil of 60%WHCsoil. However, contrary to constant Tsoil, no increase in MLwood with increasing Tsoil was detected. The alternating Tsoil pair of 10/20 °C showed the highest MLwood, but this was still low after 16 weeks (MLwood < 10%). Problems related to the maintenance of temperature, humidity, and air movement within the climate chamber may be to blame for this (i.e., high evaporation between rewetting intervals). Full mean MLwood data with accompanying standard deviation for alternating Tsoil can be found in Appendix A; Table A7 and Table A9.

3.2.3. Comparison: Constant vs. Alternating Tsoil

Alternating Tsoil (10/20, 10/30, 20/30 °C), delivered lower MLwood compared to their mean constant Tsoil counterparts (15, 20, 25 °C) regardless of MCsoil (Figure 3), but with the exception of 10/20 °C at higher MCsoil (Figure 3b below), which delivered higher MLwood than its mean constant Tsoil counterpart of 15 °C. These results correspond with previous findings concerning pure fungal cultures where alternating incubation temperatures rarely led to a higher fungal growth rate than a mean constant temperature counterpart [49]. Furthermore, indiscriminate temperature fluctuation across a defined temperature range was more indicative of a natural environment than alternating temperature aligned to the minimum and maximum of the defined range [50].
Fungal dormancy may also explain the decreased MLwood when compared to its mean constant Tsoil counterparts. Dormancy refers to a physiological state of fungal activity defined by strongly reduced respiration reflective of a form of resting, which does not contribute to turnover processes (i.e., wood decay and the organic matter in the soil). Once dormant, the requirements for reactivation are limited to rewetting and/or the addition of new organic material to the substrate [51]. However, since soil moisture was maintained at constant levels throughout all the TMC setups and organic material was in abundance, the decreased MLwood was most likely the result of fungal respiration reacting to altered Tsoil, which includes a lag period. Furthermore, the removal of specimens every 2 weeks made it difficult to understand the influence of a single Tsoil interval in the alternating cycle, since Tsoil was altered every week. Since a fungal characterization study also did not form part of this article, knowing the exact temperature and moisture boundaries (or curve) and subsequently stating which fungi groups were active, partially active, dormant, or dead, remains speculative.

4. Conclusions

The studies presented in this article show a clear influence of WHCsoil, MCsoil, and Tsoil on the decay of wood in soil contact. Fungal activity was either inhibited or promoted depending on the combination of these abiotic soil-level conditions. For all five wood species tested in study A, European beech, Douglas-fir heartwood, English oak heartwood, Scots pine sapwood, and Norway spruce, decreased MLwood occurred under conditions of high MCsoil (i.e., MCsoil = 95%WHCsoil).
In study B, both Tsoil and MCsoil showed an influence on the decay activity of soil-inhabiting microorganisms. Both abiotic factors MCsoil and Tsoil influenced each other in such a way that wood decay increased or came to a standstill. Already at the beginning of the test period a reciprocal effect was noticed, where higher Tsoil in combination with lower MCsoil resulted in an increased decay rate, while at low Tsoil, especially in the wetter soil environment (90%WHCsoil), only slight decay took place. This trend continued over the entire trial period of 16 weeks.
Alternating Tsoil conditions decreased wood decay activity of soil microorganisms compared to their corresponding constant Tsoil counterparts. It was assumed that weekly Tsoil changes required soil microorganisms to adapt to the altered environmental conditions, which impaired wood decay rate.
A graphical comparison of MLwood after different exposure intervals showed that when using MLwood as indicator, the reaction-speed temperature (RST) rule, which establishes a connection between Tsoil and wood decay rate, could not be generally confirmed. When considering MCsoil of 60%WHCsoil, which was responsible for more favorable decay conditions, an increase in Tsoil at the end of the trial period showed a stronger influence on increases of MLwood compared to an earlier stage of the trial period. This indicates that an initial fungal settlement phase was required before Tsoil increases could be linked to increases in wood decay rate. It would be of interest here to obtain a differentiated picture of the antagonistic and synergetic interactions between the microorganisms by demonstrating the organisms involved in wood decay. Inferences regarding decay severity can be made once the conditions surrounding microbial invasion of the wood substrate are understood (i.e., Tsoil, WHCsoil, and MCsoil). Irrespective of the RST rule, this data is valuable nonetheless due to the frequent specimen removal interval throughout the 16-week incubation period and the range in Tsoil, which can allow for further use in modeling the service-life of wood in ground contact. Responses of MLwood to changes in Tsoil at different stages of decay progress were therefore quantifiable in percentage of oven-dry mass loss (MLwood [%]).
Advancements in wood service-life prediction have incorporated a distinction between biological factors causing degradation and structural effects on timber, and the structural response of timber to both loads and loss of resistance to loads due to decay [27,28,52]. Software packages such as TimberLife [26] have modeled decay progression of wood in ground contact by using indirect macroclimate data, such as that from the Scheffer Climate Index [53], coupled to 35 years of field trial data to develop regional wood decay rates, presented as a risk map for the entire continent of Australia. These are species-specific, which include mostly Australasian, and some prominent European and North American wood species. Other methodologies of modeling decay progression, such as dose–response, rather use wood microclimate data in MCwood and Twood (dose) to calculate the number of ideal expose days required for decay onset until ultimate failure of the wooden component to occur (response). The method uses a ‘0-4 limit-state’ evaluation system to describe stages of decay progress as a function of decay depth and spatial distribution. In this case, the wood-and-soil microclimate is sought to be defined through the addition of soil-level variables as investigated in this article. Further differentiation between these two methodologies and the advantages and disadvantages of each can be expected in Part 2 of the article series.
The complexity of the relationship that the parameters Tsoil, MCsoil, and WHCsoil have to one another and the wood decaying microorganisms that are active at various dose loads (i.e., combinations of WHCsoil, MCsoil, and Tsoil) was evident. Additionally, Part 2 will present deeper statistical analyses into significant differences in MLwood between these various dose loads.

Author Contributions

Conceptualization, B.N.M. and C.B.; Data curation, B.N.M., L.R. and J.H.P.; Formal analysis, B.N.M.; Funding acquisition, C.B. and H.M.; Investigation, B.N.M.; Methodology, B.N.M. and C.B.; Resources, H.M.; Software, B.N.M.; Supervision, B.N.M. and C.B.; Validation, B.N.M.; Visualization, B.N.M.; Writing—original draft, B.N.M.; Writing—review and editing, B.N.M., C.B. and H.M. All authors have read and agreed to the published version of the manuscript.

Funding

This article was made possible through funding from the ongoing research projects CEMWOGEO (22007617), supported by the German Ministry of Food and Agriculture (BMEL), CEMSLEEPER (873191), supported by the Austrian Research Promotion Agency (FFG). The authors also received funding in the frame of the research project CLICKdesign, which is supported under the umbrella of ERA-NET Cofund ForestValue by the Ministry of Education, Science and Sport (MIZS)—Slovenia; The Ministry of the Environment (YM)—Finland; The Forestry Commissioners (FC)—UK; Research Council of Norway (RCN)—Norway; The French Environment and Energy Management Agency (ADEME) and The French National Research Agency (ANR)—France; The Swedish Research Council for Environment, Agricultural Sciences and Spatial Planning (FORMAS), Swedish Energy Agency (SWEA), Swedish Governmental Agency for Innovation Systems (Vinnova)—Sweden; Federal Ministry of Food and Agriculture (BMEL) and Agency for Renewable Resources (FNR)—Germany. ForestValue has received funding from the European Union’s Horizon 2020 research and innovation programme under grant agreement No. 773324. The authors acknowledge support by the Open Access Publication Funds of the University of Göttingen.

Conflicts of Interest

The authors declare no conflict of interest.

Appendix A

Table A1. Mean oven-dry mass loss (MLwood) and (standard deviation) of eight European beech (Fagus sylvatica L.) wood specimens removed at incubation intervals of 8, 12, and 16 weeks under soil conditions with water-holding capacity (WHCsoil) of 30%, 60%, and 90%, and soil moisture content (MCsoil) of 30, 70, and 95%WHCsoil, at constant soil temperature (Tempsoil) of 20 ± 2 °C.
Soil Condition WHCsoil[%]/MCsoil[%WHCsoil]Exposure Interval [Weeks]
81216
30/302.73 (1.61)5.02 (5.28)5.45 (5.43)
30/702.06 (0.35)2.59 (2.84)6.15 (1.76)
30/951.83 (0.63)3.08 (0.92)4.28 (0.83)
60/3011.97 (1.08)15.61 (2.76)28.26 (10.23)
60/7015.59 (2.73)21.01 (3.03)23.09 (6.95)
60/952.35 (0.90)5.54 (2.76)9.27 (6.76)
90/3011.75 (2.05)22.92 (3.21)33.85 (7.84)
90/7027.03 (6.00)36.38 (7.11)46.98 (9.92)
90/951.18 (9.51)5.56 (1.58)7.82 (2.18)
Table A2. Mean oven-dry mass loss (MLwood) and (standard deviation) of eight Douglas-fir (Pseudotsuga mensziesii Franco.) wood specimens removed at incubation intervals of 8, 12, and 16 weeks under soil conditions with water-holding capacity (WHCsoil) of 30%, 60%, and 90%, and soil moisture content (MCsoil) of 30, 70, and 95%WHCsoil, at constant soil temperature (Tempsoil) of 20 ± 2 °C.
Soil Condition WHCsoil[%]/MCsoil[%WHCsoil]Exposure Interval [Weeks]
81216
30/300.80 (0.12)0.92 (0.22)1.03 (0.27)
30/700.85 (0.14)0.66 (1.56)1.53 (0.65)
30/950.62 (0.25)0.40 (0.85)1.50 (0.86)
60/301.68 (0.53)2.91 (1.13)17.04 (12.57)
60/701.69 (0.54)3.67 (0.66)5.32 (5.06)
60/950.32 (0.31)0.36 (0.66)0.51 (0.37)
90/301.42 (0.64)21.91 (8.70)42.09 (9.63)
90/702.04 (0.51)4.43 (1.73)4.41 (1.85)
90/950.53 (0.34)1.10 (0.57)0.92 (0.36)
Table A3. Mean oven-dry mass loss (MLwood) and (standard deviation) of eight English oak (Quercus robur L.) wood specimens removed at incubation intervals of 8, 12, and 16 weeks under soil conditions with water-holding capacity (WHCsoil) of 30%, 60%, and 90%, and soil moisture content (MCsoil) of 30, 70, and 95%WHCsoil, at constant soil temperature (Tempsoil) of 20 ± 2 °C.
Soil Conditions WHCsoil[%]/MCsoil[%WHCsoil]Exposure Interval [Weeks]
81216
30/302.98 (0.14)3.71(0.80)4.32 (0.67)
30/703.66 (0.43)3.94 (0.73)5.88 (0.71)
30/953.65 (0.75)4.52 (0.63)4.50 (0.68)
60/306.42 (1.45)10.87 (2.04)9.29 (3.13)
60/707.25 (1.31)13.07 (1.55)18.95 (2.99)
60/950.65 (0.22)1.07 (1.05)1.23 (0.40)
90/304.75 (0.76)12.14 (2.14)10.97 (1.37)
90/707.53 (0.79)12.31 (1.41)17.69 (1.47)
90/951.00 (2.15)1.21 (0.60)1.93 (0.35)
Table A4. Mean oven-dry mass loss (MLwood) and (standard deviation) of eight Scots pine (Pinus sylvestris L.) wood specimens removed at incubation intervals of 8, 12, and 16 weeks under soil conditions with water-holding capacity (WHCsoil) of 30%, 60%, and 90%, and soil moisture content (MCsoil) of 30, 70, and 95%WHCsoil, at constant soil temperature (Tempsoil) of 20 ± 2 °C.
Soil Condition WHCsoil[%]/MCsoil[%WHCsoil]Exposure Interval [Weeks]
81216
30/301.76 (0.19)2.16 (0.49)2.10 (0.18)
30/701.92 (0.29)2.50 (1.16)3.46 (0.56)
30/951.86 (0.47)2.51 (0.42)3.18 (1.69)
60/303.29 (0.41)8.56 (4.64)46.66 (7.76)
60/704.96 (0.58)9.47 (0.90)17.81 (5.57)
60/951.51 (0.61)1.64 (3.45)2.66 (0.56)
90/302.60 (0.36)44.96 (15.16)58.24 (4.26)
90/705.28 (1.08)11.21 (1.72)14.54 (1.33)
90/951.36 (0.37)1.62 (0.37)2.44 (0.27)
Table A5. Mean oven-dry mass loss (MLwood) and (standard deviation) of eight Norway spruce (Picea abies Karst.) wood specimens removed at incubation intervals of 8, 12, and 16 weeks under soil conditions with water-holding capacity (WHCsoil) of 30%, 60%, and 90%, and soil moisture content (MCsoil) of 30, 70, and 95%WHCsoil, at constant soil temperature (Tempsoil) of 20 ± 2 °C.
Soil Condition WHCsoil[%]/MCsoil[%WHCsoil]Exposure Interval [Weeks]
81216
30/300.66 (0.32)0.87 (0.67)0.76 (0.16)
30/701.17 (1.77)0.50 (0.18)1.78 (0.60)
30/950.50 (0.24)0.91 (0.41)1.24 (0.48)
60/301.88 (0.30)3.21 (1.24)25.54 (12.09)
60/703.11 (1.50)5.62 (1.68)10.07 (5.62)
60/950.03 (1.18)−0.182 (0.443)0.20 (0.80)
90/301.53 (0.98)31.92 (22.97)50.61 (14.67)
90/702.33 (1.09)6.96 (2.33)9.65 (2.81)
90/950.05 (0.43)0.18 (0.36)0.84 (0.54)
Table A6. Mean oven-dry wood mass loss (MLwood) and (standard deviation) of 10 European beech (Fagus sylvatica L.) wood specimens removed in 2-week intervals over 16 weeks of incubation under soil conditions with water-holding capacity (WHCsoil) of 60%, soil moisture content (MCsoil) of 60%WHCsoil, and constant soil temperature (Tempsoil).
Temp. [°C]Exposure Interval [Weeks]
246810121416
50.41 (0.13)1.49 (0.34)3.59 (0.55)5.38 (0.93)7.79 (1.08)8.37 (1.06)8.93 (0.71)11.25 (1.72)
100.91 (0.34)3.19 (0.49)5.79 (0.65)8.05 (0.89)9.97 (0.81)11.13 (0.96)12.62 (1.92)15.41 (3.25)
152.20 (0.54)5.15 (0.49)9.10 (1.17)12.04 (1.29)15.37 (1.64)19.93 (3.31)20.45 (2.66)22.94 (2.25)
203.18 (0.52)7.19 (1.35)13.20 (3.67)14.36 (3.07)16.84 (1.73)18.26 (2.70)21.23 (4.67)26.38 (4.73)
253.28 (0.48)9.46 (0.94)15.32 (3.08)16.90 (2.16)20.07 (2.20)24.06 (3.54)28.17 (3.97)30.89 (5.89)
304.67 (0.62)12.77 (2.64)16.76 (2.24)18.38 (2.26)23.83 (4.57)26.19 (5.02)25.85 (5.04)27.53 (6.49)
356.52 (1.11)19.60 (8.40)21.25 (4.64)23.77 (5.35)30.82 (11.25)30.84 (8.17)34.81 (8.68)41.38 (13.90)
408.17 (0.95)14.00 (1.34)20.22 (1.83)23.23 (2.80)25.59 (4.28)26.39 (1.61)26.95 (1.68)28.54 (5.37)
Table A7. Mean oven-dry wood mass loss (MLwood) and (standard deviation) of 10 European beech (Fagus sylvatica L.) wood specimens removed in 2-week intervals over 16 weeks of incubation under soil conditions with water-holding capacity (WHCsoil) of 60%, soil moisture content (MCsoil) of 60%WHCsoil, and alternating soil temperature (Tempsoil).
Temp. [°C]Exposure Interval [Weeks]
246810121416
10/201.92 (0.35)4.61 (0.39)8.02 (1.2)9.97 (0.6)12.24 (1.31)13.37 (1.52)14.86 (2.13)19.15 (6.64)
10/302.5 (0.51)5.91 (0.53)9.48 (1.65)11.7 (2.29)14.68 (4.5)18.8 (4.14)18.74 (2.67)21.56 (4.72)
20/304.16 (0.51)7.52 (0.99)12.24 (2.62)14.43 (2.23)16.78 (2.58)18.03 (1.57)24.43 (4.46)27.48 (7.78)
Table A8. Mean oven-dry wood mass loss (MLwood) and (standard deviation) of 10 European beech (Fagus sylvatica L.) wood specimens removed in 2-week intervals over 16 weeks of incubation under soil conditions with water-holding capacity (WHCsoil) of 60%, soil moisture content (MCsoil) of 90%WHCsoil, and constant soil temperature (Tempsoil).
Temp. [°C]Exposure Interval [Weeks]
246810121416
50.32 (0.37)0.62 (0.32)0.81 (0.41)1.13 (0.55)1.46 (0.53)1.93 (0.60)1.66 (0.77)1.81 (0.27)
100.89 (0.44)2.24 (0.29)3.16 (0.61)4.53 (0.49)5.79 (0.73)6.43 (0.68)7.07 (1.80)7.42 (0.95)
150.87 (0.57)1.90 (0.42)1.02 (0.54)1.14 (0.25)1.73 (0.36)2.09 (0.43)2.87 (0.78)3.04 (1.33)
201.56 (0.36)2.52 (0.43)3.75 (0.60)4.60 (0.85)5.70 (1.13)7.03 (1.69)8.73 (1.48)8.70 (1.02)
253.60 (0.78)6.75 (2.13)8.09 (1.59)7.80 (1.80)10.85 (2.08)11.72 (3.09)13.73 (3.19)15.97 (1.76)
303.05 (0.45)4.13 (0.59)5.06 (0.76)6.08 (0.70)7.03 (1.33)8.47 (1.69)9.95 (1.61)12.03 (2.14)
352.08 (0.41)2.91 (1.10)3.34 (0.55)5.09 (1.19)5.87 (1.05)6.40 (1.12)6.97 (1.86)8.29 (2.37)
406.04 (0.63)10.76 (1.92)12.53 (1.86)12.98 (3.00)13.74 (2.42)13.47 (1.74)13.09 (2.68)14.94 (3.61)
Table A9. Mean oven-dry wood mass loss (MLwood) and (standard deviation) of 10 European beech (Fagus sylvatica L.) wood specimens removed in 2-week intervals over 16 weeks of incubation under soil conditions with water-holding capacity (WHCsoil) of 60%, soil moisture content (MCsoil) of 90%WHCsoil, and alternating soil temperature (Tempsoil).
Temp. [°C]Exposure Interval [Weeks]
246810121416
10/201.27 (0.3)2.64 (0.54)3.72 (0.69)4.67 (1.09)6.42 (1.45)7.67 (1.18)9.61 (2.11)8.9 (1.78)
10/301.23 (0.45)1.81 (0.67)2.27 (0.36)3.12 (0.49)3.8 (0.56)4.8 (0.91)4.39 (1.27)5.14 (1.37)
20/301.00 (0.49)1.46 (0.57)1.93 (0.65)3.04 (3.43)3.06 (0.7)4.63 (1.96)4.54 (1.69)5.06 (1.68)

References

  1. Ramage, M.H.; Burridge, H.; Busse-Wicher, M.; Fereday, G.; Reynolds, T.; Shah, D.U.; Wu, G.; Yu, L.; Fleming, P.; Densley-Tingley, D.; et al. The wood from the trees: The use of timber in construction. Renew. Sustain. Energy Rev. 2017, 68, 333–359. [Google Scholar] [CrossRef]
  2. Van Acker, J.; Palanti, S. 5.3 Durability. Europäische Zusammenarbeit auf dem Gebiet der Wissenschaftlichen und Technischen Forschung. In Performance of Bio-Based Building Materials; Brischke, C., Jones, D., Eds.; Woodhead publishing series in civil and structural engineering; WP—Woodhead Publishing, An Imprint of Elsevier: Duxford Cambridge, UK, 2017; pp. 257–277. ISBN 978-0-08-100992-5. [Google Scholar]
  3. Blanchette, R.A.; Held, B.W.; Jurgens, J.A.; McNew, D.L.; Harrington, T.C.; Duncan, S.M.; Farrell, R.L. Wood-Destroying Soft Rot Fungi in the Historic Expedition Huts of Antarctica. Appl. Environ. Microbiol. 2004, 70, 1328–1335. [Google Scholar] [CrossRef] [PubMed] [Green Version]
  4. Zabel, R.A.; Morrell, J.J. 4 Factors Affecting the Growth and Survival of Fungi in Wood. In Wood Microbiology: Decay and Its Prevention; Elsevier Science: Saint Louis, MO, USA, 2014; pp. 90–115. ISBN 978-0-323-13946-5. [Google Scholar]
  5. Ritschkoff, A.-C. Decay Mechanisms of Brown-Rot Fungi; VTT Technical Research Centre of Finland: Espoo, Finland, 1996; ISBN 978-951-38-4926-9. [Google Scholar]
  6. Teles, C.D.M.; Do Valle, Â. Wood structures: Acting before deterioration. In Historical constructions 2001: Possibilities of Numerical and Experimental Techniques, Proceedings of the 3rd International Seminar: Gimaraes, Portugal, University of Minho, 7–9 November, 2001; International Seminar Historical Construction; Lourenço, P.B., Roca Fabregat, P., Eds.; University of Minho, Department of Civil Engineering: Gimaraes, Portugal, 2001; pp. 857–866. ISBN 978-972-8692-01-8. [Google Scholar]
  7. Edlund, M.-L.; Nilsson, T. Testing the durability of wood. Mat. Struct. 1998, 31, 641–647. [Google Scholar] [CrossRef]
  8. Brischke, C.; Olberding, S.; Meyer, L.; Bornemann, T.; Welzbacher, C.R. Intrasite variability of fungal decay on wood exposed in ground contact. Int. Wood Prod. J. 2013, 4, 37–45. [Google Scholar] [CrossRef]
  9. van der Wal, A.; de Boer, W.; Smant, W.; van Veen, J.A. Initial decay of woody fragments in soil is influenced by size, vertical position, nitrogen availability and soil origin. Plant Soil 2007, 301, 189–201. [Google Scholar] [CrossRef] [Green Version]
  10. Torres-Andrade, P.; Morrell, J.J.; Cappellazzi, J.; Stone, J.K. Culture-based identification to examine spatiotemporal patterns of fungal communities colonizing wood in ground contact. Mycologia 2019, 111, 703–718. [Google Scholar] [CrossRef]
  11. Savory, J.G.; Carey, J.K. Decay in external framed joinery in the United Kingdom. J. Inst. Wood Sci. 1979, 8, 176–180. [Google Scholar]
  12. Nilsson, T.; Daniel, G. Decay Types Observed in Small Stakes of Pine and Alstonia Scholaris Inserted in Different Types of Unsterile Soil; IRG/WP/1443; IRG Secretariat: Stockholm, Sweden, 1990; p. 10. [Google Scholar]
  13. Mieß, S. Einfluß des Wasserhaushaltes auf Abbau und Fäuletypen von Holz in Terrestrichen Mikrokosmen (Diplomarbeit). Bachelor’s Thesis, Universität Hamburg ordinariat für Holzbiologie, Hamburg, Germany, 1997. [Google Scholar]
  14. Baines, E.F.; Dickinson, D.J.; Levy, J.F. Testing Wood in Ground Contact: An Artificial Soil; IRG/WP/280; IRG Secretariat: Stockholm, Sweden, 1977; p. 10. [Google Scholar]
  15. Gersonde, M.; Kerner, W. Soft Rot Tests with Soils of Different Origins; IRG/WP/2226; IRG Secretariat: Stockholm, Sweden, 1984; p. 8. [Google Scholar]
  16. Carey, J.K.; Grant, C. Moisture control in laboratory tests wood-rotting fungi. Int. Biodeterior. Bull. 1975, 11, 101–105. [Google Scholar]
  17. Gray, S.M. Effect of Soil Type and Moisture Content on Soft Rot Testing; IRG/WP/2270; IRG Secretariat: Stockholm, Sweden, 1986; p. 26. [Google Scholar]
  18. Brischke, C.; Wegener, F.L. Impact of Water Holding Capacity and Moisture Content of Soil Substrates on the Moisture Content of Wood in Terrestrial Microcosms. Forests 2019, 10, 485. [Google Scholar] [CrossRef] [Green Version]
  19. CEN/TS 15083-2:2005. Durability of Wood and Wood-Based Products—Determination of the Natural Durability of Solid Wood Against Wood-Destroying Fungi, Test Methods—Part 2: Soft Rotting Micro-Fungi; European Committee for Standardization (CEN): Brussels, Belgium, 2005. [Google Scholar]
  20. CEN/TS 15083-1:2005. Durability of Wood and Wood-Based Products—Determination of the Natural Durability of Solid Wood against Wood-Destroying Fungi, Test Methods—Part 1: Basidiomycetes; European Committee for Standardization (CEN): Brussels, Belgium, 2005. [Google Scholar]
  21. EN 252:2015. Field Test Methods for Determining the Relative Protective Effectiveness of Wood Preservatives in Ground Contact; European Committee for Standardization (CEN): Brussels, Belgium, 2014. [Google Scholar]
  22. AWPA E7-15. Standard Field Test for Evaluation of Wood Preservatives to be Used in Ground Contact (UC4A, UC4B, UC4C); Stake Test; American Wood Protection Association (AWPA/WOOD): Hoover, AL, USA, 2015. [Google Scholar]
  23. Wells, J.M.; Boddy, L. Effect of temperature on wood decay and translocation of soil-derived phosphorus in mycelial cord systems. New Phytol 1995, 129, 289–297. [Google Scholar] [CrossRef]
  24. Risch, A.C.; Jurgensen, M.F.; Page-Dumroese, D.S.; Schütz, M. Initial turnover rates of two standard wood substrates following land-use change in subalpine ecosystems in the Swiss Alps. Can. J. For. Res. 2013, 43, 901–910. [Google Scholar] [CrossRef]
  25. Finér, L.; Jurgensen, M.; Palviainen, M.; Piirainen, S.; Page-Dumroese, D. Does clear-cut harvesting accelerate initial wood decomposition? A five-year study with standard wood material. For. Ecol. Manag. 2016, 372, 10–18. [Google Scholar] [CrossRef] [Green Version]
  26. Wang, C.; Leicester, R.H.; Nguyen, M.N. Manual 3—Decay in Ground Contact; Timber Service Life Design Guide; CSIRO: Victoria, Australia, 2008.
  27. Lacasse, M.A. Advances in service life prediction—An overview of durability and methods of service life prediction for non-structural building components. In Proceedings of the Annual Australasian Corrosion Association Conference, Wellington Convention Centre, Wellington, New Zealand, 16–19 November 2008; pp. 1–13. [Google Scholar]
  28. Brischke, C.; Rapp, A.O. Dose–response relationships between wood moisture content, wood temperature and fungal decay determined for 23 European field test sites. Wood Sci. Technol. 2008, 42, 507–518. [Google Scholar] [CrossRef]
  29. ISO 11268-2. Soil Quality—Effects of Pollutants on Earthworms—Part 2: Determination of Effects on Reproduction of Eisenia Fetida/Eisenia Andrei; International Organisation for Standardization (ISO): Geneva, Switzerland, 2012. [Google Scholar]
  30. EN 350:2016. Durability of Wood and Wood-Based Products–Testing and Classification of the Durability to Biological Agents of Wood and Wood-Based Materials; European Committee for Standardization (CEN): Brussels, Belgium, 2016. [Google Scholar]
  31. Weil, R.R.; Brady, N.C. 5 Soil Water: Characteristics and Behaviour. In The Nature and Properties of Soils; Pearson: Columbus, OH, USA, 2016; pp. 188–232. ISBN 978-0-13-325448-8. [Google Scholar]
  32. Zabel, R.A.; Morrell, J.J. 3 Characteristics and classification of Fungi and Bacteria. In Wood Microbiology: Decay and Its Prevention.; Elsevier Science: Saint Louis, MO, USA, 2014; pp. 52–89. ISBN 978-0-323-13946-5. [Google Scholar]
  33. Jurgensen, M.; Laks, P.; Reed, D.; Collins, A. Chemical, Physical and Biological Factors Affecting Wood Decomposition in Forest Soils; IRG/WP 03-20281; IRG Secretariat: Stockholm, Sweden, 2003; p. 15. [Google Scholar]
  34. Edlund, M.-L. Durability of Some Alternatives to Preservative Treated Wood; IRG/WP 04-30353; IRG Secretariat: Stockholm, Sweden, 2004; p. 13. [Google Scholar]
  35. Wakeling, R. Is Field Test Data from 20 x 20mm Stakes Reliable? Effects of Decay Hazard, Decay Type and Preservative Depletion Hazard; IRG/WP 06-20327; IRG Secretariat: Stockholm, Sweden, 2006. [Google Scholar]
  36. Schultz, T.P.; Nicholas, D.D. Technical note: Effect of soil on the pH of treated wood in ground contact. Wood Fiber Sci. 2010, 42, 412–416. [Google Scholar]
  37. Larsson-Brelid, P.; Brischke, C.; Rapp, A.O.; Hansson, M.; Westin, M.; Jermer, J.; Pilgård, A. Methods of Field Data Evaluation—Time Versus Reliability; IRG/WP 11-20466; IRG Secretariat: Stockholm, Sweden, 2011; p. 18. [Google Scholar]
  38. Stirling, R.; Alfredsen, G.; Brischke, C.; De Windt, I.; Francis, L.P.; Frühwald Hansson, E.; Humar, M.; Jermer, J.; Klamer, M.; Laks, P.E.; et al. Global Survey on Durability Variation–on the Effect of the Reference Species; IRG Secretariat: Stockholm, Sweden, 2016; p. 26. [Google Scholar]
  39. Krzic, M.; Sanborn, P.; Watson, K.; Bomke, A.A.; Crowley, C.; Doree, A.; Dyanatkar, S. Soil Formation and Soil Processes; The University of British Columbia, Vancouver, University of Northern British Columbia, and Thompson Rivers University: Kamloops, BC, Canada, 2008; Available online: https://processes.soilweb.ca/ (accessed on 9 October 2020).
  40. Blanchette, R.A.; Nilsson, T.; Daniel, G.; Abad, A. 6 Biological Degradation of Wood. In Archaeological Wood; Rowell, R.M., Barbour, R.J., Eds.; Advances in Chemistry; American Chemical Society: Washington, DC, USA, 1989; Volume 225, pp. 141–174. ISBN 978-0-8412-1623-5. [Google Scholar]
  41. Elam, J.; Björdal, C. A review and case studies of factors affecting the stability of wooden foundation piles in urban environments exposed to construction work. Int. Biodeterior. Biodegrad. 2020, 148, 104913. [Google Scholar] [CrossRef]
  42. A’Bear, A.D.; Jones, T.H.; Kandeler, E.; Boddy, L. Interactive effects of temperature and soil moisture on fungal-mediated wood decomposition and extracellular enzyme activity. Soil Biol. Biochem. 2014, 70, 151–158. [Google Scholar] [CrossRef]
  43. Donnelly, P.K.; Entry, J.A.; Crawford, D.L.; Cromack, K. Cellulose and lignin degradation in forest soils: Response to moisture, temperature, and acidity. Microb Ecol 1990, 20, 289–295. [Google Scholar] [CrossRef]
  44. Donnelly, D.P.; Boddy, L. Development of mycelial systems of Stropharia caerulea and Phanerochaete velutina on soil: Effect of temperature and water potential. Mycol. Res. 1997, 101, 705–713. [Google Scholar] [CrossRef]
  45. Eaton, R.A.; Hale, M.D.C. Wood: Decay, Pests, and Protection, 1st ed.; Chapman & Hall: London, UK, 1993; ISBN 978-0-412-53120-0. [Google Scholar]
  46. Hiscox, J.; Clarkson, G.; Savoury, M.; Powell, G.; Savva, I.; Lloyd, M.; Shipcott, J.; Choimes, A.; Amargant Cumbriu, X.; Boddy, L. Effects of pre-colonisation and temperature on interspecific fungal interactions in wood. Fungal Ecol. 2016, 21, 32–42. [Google Scholar] [CrossRef] [Green Version]
  47. Schmidt, O. 3 Physiology. In Wood and Tree Fungi: Biology, Damage, Protection, and Use; Czeschlik, D., Ed.; Springer: Berlin, Germany, 2006; pp. 53–85. ISBN 978-3-540-32138-5. [Google Scholar]
  48. Marais, B.N.; Brischke, C.; Militz, H. Wood durability in terrestrial and aquatic environments–A review of biotic and abiotic influence factors. Wood Mater. Sci. Eng. 2020, 1–24. [Google Scholar] [CrossRef]
  49. Morton, L.H.G.; Eggins, H.O.W. The effect of constant, alternating & fluctuating temperatures on the growth on some wood inhabiting fungi. Int. Biodeterior. Bull. 1977, 13, 116–122. [Google Scholar]
  50. Morton, L.H.G. Ecological studies of fungi growing on insolated wood. Ph.D. Thesis, University of Aston, Birmingham, UK, 1975. [Google Scholar]
  51. Blagodatskaya, E.; Kuzyakov, Y. Active microorganisms in soil: Critical review of estimation criteria and approaches. Soil Biol. Biochem. 2013, 67, 192–211. [Google Scholar] [CrossRef]
  52. Brischke, C.; Bayerbach, R.; Rapp, A.O. Decay-influencing factors: A basis for service life prediction of wood and wood-based products. Wood Mater. Sci. Eng. 2006, 1, 91–107. [Google Scholar] [CrossRef]
  53. Scheffer, T.C. A Climate Index for Estimating Potential for Decay in Wood Structures Above Ground. For. Prod. J. 1971, 21, 25–31. [Google Scholar]
Figure 1. Mean oven-dry mass loss (MLwood) of (a) European beech, (b) Douglas-fir heartwood, (c) English oak heartwood, (d) Scots pine sapwood, and (e) Norway spruce wood specimens incubated for 16 weeks in soil conditions with water-holding capacity (WHCsoil) of 30, 60, and 90 [%], and soil moisture content (MCsoil) of 30, 70, and 95 [%WHCsoil].
Forests 11 01284 g001
Figure 2. Mean oven-dry mass loss (MLwood) of European beech wood specimens incubated for 16 weeks at constant soil temperature (Tsoil) with soil water-holding capacity (WHCsoil) of 60% and soil moisture content (MCsoil) of 60%WHCsoil (a), and 90%WHCsoil (b). Mean oven-dry mass loss (MLwood) of beech wood specimens plotting against increasing soil temperature (Tsoil) for a specified incubation period (# wks), incubated in soil with water-holding capacity (WHCsoil) of 60% and soil moisture content (MCsoil) of 60%WHCsoil (c), and MCsoil of 90%WHCsoil (d).
Forests 11 01284 g002
Figure 3. Comparisons of mean oven-dry mass loss (MLwood) of beech wood specimens incubated at constant and alternating soil temperature (Tsoil) with soil water-holding capacity (WHCsoil) of 60% and soil moisture content (MCsoil) of 60%WHCsoil (left panel: (a,c,e)), and 90%WHCsoil (right panel: (b,d,f)).
Forests 11 01284 g003
Table 1. Mixing ratios of soil substrates for WHCsoil of mixed soil substrates. Percentage is based on the oven-dry soil mass [g].
Resultant WHCsoil [%]
(A): Equation (4)10495888174676053453730
(B): Equation (5)10299948881746658494030
Percentage compost [%]1009080706050403020100
Percentage sand [%]0102030405060708090100
Table 2. Combinations of soil mixtures prepared for use in studies (A) and (B).
StudyWHCsoil [%]MCsoil [%WHCsoil]MCsoil,target [%]
(A)30309
(A)307021
(A)309529
(A)603018
(A)607042
(A)609557
(A)903027
(A)907063
(A)909586
(B)606036
(B)609054
Table 3. Mean oven-dry mass loss (MLwood [%]; n = 8) and total mean oven-dry mass loss (MLwood* [%]; n = 72) of European beech (beech), English oak heartwood (oak), Norway spruce (spruce), Douglas-fir heartwood (d-fir), and Scots pine sapwood (pine) wood specimens after 16 weeks incubation under soil conditions with water-holding capacity (WHCsoil) of 30%, 60%, and 90%, and soil moisture content (MCsoil) of 30, 70, and 95%WHCsoil, at constant soil temperature (Tsoil) of 20 ± 2 °C.
MLwood [%] per Soil Condition WHCsoil[%]/MCsoil[%WHCsoil]
Species30/3030/7030/9560/3060/7060/9590/3090/7090/95MLwood* [%]
Beech5.456.154.2828.2623.099.2733.8546.987.8218.35
D-fir1.031.531.5017.045.320.5142.094.410.928.26
Oak4.325.884.509.2918.951.2310.9717.691.938.31
Spruce0.761.781.2425.5410.070.2050.619.650.8411.29
Pine2.103.463.1846.6617.812.6658.2414.542.4416.79
Publisher’s Note: MDPI stays neutral with regard to jurisdictional claims in published maps and institutional affiliations.

