Abstract
The service life of wood in outdoor use under humid conditions is mainly determined by its material resistance and the exposure situation. Different standards such as EN 350 (2016) point on the relevance of wood’s resistance against moisture for its expected service life. Recently, different standardized but also numerous nonstandardized methods were suggested to test the water permeability of wooden materials. In the context of this study, different European-grown soft- and hardwoods, tropical hardwoods, modified wood and wood treated with water- and oil-borne preservatives were subjected to floating and submersion tests according to CEN/TS 16818 (2018) and different short-term water uptake and release tests. Moisture performance data from field tests with the same materials were analyzed and used to assess the predictive power of different laboratory moisture indicators. The moisture characteristics suggested by CEN/TS 16818 (2018)—rm168 (residual moisture content after water uptake and release processes) and res312 (residue as a percentage of the absorbed moisture)—showed the little potential to predict the outdoor moisture performance of the tested materials. In contrast, the mean moisture content during absorption and desorption (MCmean) predicted well the outdoor moisture performance of the materials under test. Short-term water uptake and release of small specimens also showed high predictive power.
1. Introduction
The service life of wood in outdoor use or elsewhere under humid conditions is determined by its material resistance and the exposure situation. The latter is represented by macro-, meso- and microlevel climatic parameters and can finally be expressed as the material climate in terms of wood moisture content and temperature [1]. The material resistance of wood is opposed to exposure. In general, toxic and inhibiting wood ingredients and a more or less pronounced ability to withstand moistening increase the material resistance.
During recent years, both exposure and resistance have been intensively studied with the aim of service life prediction based on dose-response relationships [2]. Dosimeter models can serve to quantify the effect of exposure-related parameters and the material-intrinsic resistance against different wood-destroying organisms (e.g., [3]). Furthermore, different standards such as the European norm EN 350 in its revised version from 2016 point on the relevance of wood’s resistance against moisture for its expected service life. Synonymously, “moisture resistance” can be called “permeability to water” and is defined as the “ease with which water penetrates a wood-based matrix […] and is released by evaporation” [4]. Due to the lack of standardized methods aiming to assess and classify this parameter, preliminary guidance is given in its informative Annex D for the classification of the “permeability to water”. Different standardized methods for determining the “permeability to water” are referenced in Annex D [4] such as absorption and desorption tests according to prEN 16818, now [5], floating tests according to [6] and the Cobb method according to [7]. In addition, numerous nonstandardized methods had been applied in previous studies, for instance, absorption and desorption tests to determine the moisture-induced risk index (MRI) [8,9], short-term water uptake and release tests (W24-tests) [3,10], capillary water uptake tests [11], contact angle measurements [12,13] and automated recordings of wood moisture content (MC) data from outdoor exposure experiments [14,15,16,17,18,19,20].
The overall aim of any laboratory moisture resistance indicator is to predict the outdoor moisture performance of the tested material. Still, only very few studies are available where laboratory indicators were directly compared with the MC of wood samples in the field or in service, respectively [8,20]. As expected, the obtained quality of correlation between laboratory and field performance of wood varied a lot. It was apparently dependent on the specimen format [8,9], the type of water uptake and release (liquid capillary vs. vapor, end-grain vs. side-grain, absorption vs. desorption, etc., [2,15,20]), and the type of wood-based material itself [17,20,21,22].
Furthermore, different authors pointed on the effect that natural weathering has on the permeability of wood to water [13,23]. Finally, different methods can be used to determine and record wood MC continuously in field tests and surely influence the data obtained as previously reported [24]. Solely, differences between determining local or global wood MC will affect correlations with laboratory indicators. Therefore, the type and position of MC sensors need to be accounted for when evaluating the interrelationships of moisture data between laboratory and field tests.
This study aimed at comparing different methods to determine the permeability to water of different wood-based materials and at evaluating their power to predict the outdoor moisture performance of the respective materials under test. For this purpose, a wide range of wood-based materials was examined, including European-grown soft- and hardwoods, tropical hardwoods, modified wood and wood treated with water- and oil-borne preservatives.
2. Materials and Methods
2.1. Wood Specimens
Different test specimens (Figure 1) were produced from European soft- and hardwoods, tropical hardwoods, chemically modified wood and wood treated with water- and oil-borne preservatives (Table 1). Acetylated wood (Acc), means wood after treatment with acetic anhydride and was provided by Accsys Technologies (Accoya®, Arnhem, The Netherlands) with an acetyl content >19%, which was communicated by the producer. Treatment with 1,3-dimethylol-4,5-dihydroxyethyleneurea (DMDHEU) was performed at the University of Goettingen. Scots pine sapwood (Pinus sylvestris L.) and poplar (Populus spp. L.) from German forests, and Radiata pine sapwood (Pinus radiata D.Don) from New Zealand plantations were impregnated with water-soluble DMDHEU and magnesium nitrate hexahydrate (Mg(NO3)2 × 6 H2O) added as a catalyst in a vacuum-pressure impregnation process (vacuum: 0.005 MPa, 1 h; pressure: 1.2 MPa, 2 h). Impregnated specimens were dried and the modification chemicals cured at 120 °C under a superheated steam atmosphere with resulting weight percent gains (WPG) of 19.0% (Scots pine sapwood (SW)), 28.6% (Radiata pine SW) and 24.6% (poplar). European beech (Fagus sylvatica L.) was impregnated with different preservatives, e.g., (1) a water-borne copper-based preservative (Co), (2) an oil-borne preservative (Oil) and (3) a double treatment with water-borne copper followed by an oil-borne preservative treatment (Co + Oil). Water-borne preservatives were impregnated in a vacuum-pressure impregnation process (vacuum: 180 mbar, 1 h; pressure: 8 bar, 2 h) and oil-borne preservatives in a “Rüping-process” (prepressure: 3 bar, 20 min; pressure: 8 bar, 2 h; vacuum: 230 mbar, 12 h).
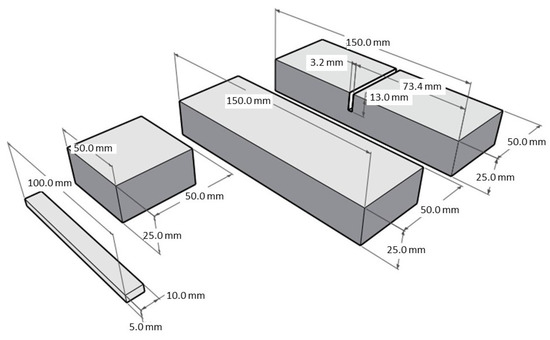
Figure 1.
Test specimens subjected to 24 h water uptake and release tests (100 (ax.) × 10 × 5 mm3), floating test (50 (ax.) × 50 × 25 mm3) and submersion test (150 (ax.) × 50 × 25 mm3) without and with a notch (depth: 13.0 mm, width: 3.2 mm); sides of floating and submersion test specimens were sealed (dark gray) with polyurethane (Sikaflex® 221i, Sika Austria GmbH, Austria).

Table 1.
Moisture content of 100 (ax.) × 10 × 5 mm3 specimens after exposure to different moistening and drying regimes during 24 h intervals.
From each material, three boards were selected. Nine specimens were prepared per material and specimen dimension (Figure 1), with three specimens coming from one individual board. Specimens of 100 (ax.) × 10 × 5 mm3 were subjected to 24 h water uptake and release tests [3]. The sides of floating (50 (ax.) × 50 × 25 mm3) and submersion (150 (ax.) × 50 × 25 mm3) specimens were sealed with polyurethane (Sikaflex® 221i, Sika Austria GmbH, Austria, Figure 1, dark gray) prior testing the moisture performance according to [1]. Laboratory testing was followed by a horizontal outdoor exposure with five replicates per test specimen type and material (test field in Goettingen, Germany, 51°33′34.9″ N, 9°57′18.5″ E, elevation: 199 m, oceanic continental climate), to record the moisture performance under field conditions. The remaining (n = 4) submersion test specimens were cut with a notch of 3.2 (ax.) × 50 × 13 mm3 to detect the impact of end-grain surfaces on the moisture performance of the materials (Figure 1).
2.2. Laboratory Testing
2.2.1. W24-Tests (24 h Water Uptake and Release Tests (Meyer-Veltrup et al. 2017))
Liquid Water Uptake by Submersion
Specimens of 100 (ax.) × 10 × 5 mm3 were oven-dried at 103 °C until constant mass. The oven-dry mass was determined to the nearest 0.001 g. Oven-dry specimens were submerged in a sealed plastic container with demineralized water and placed in a climate chamber with 20 °C, 65% relative humidity (RH; “normal climate”). Specimens were separated from each other by square-shaped stainless-steel meshes. The specimens were weighed again after 24 h submersion. The liquid water uptake of the specimens (W24sub.) was determined, and the resulting moisture content (MC) calculated (Equation (1)).
- W24sub. = Liquid water uptake during 24 h submersion (%);
- m0 = Oven-dry mass before submersion (g);
- msub. = Mass after 24 h of submersion (g).
Water Vapor Uptake in Water-Saturated Atmosphere
Specimens of 100 (ax.) × 10 × 5 mm3 from liquid water uptake testing (W24sub.) were again oven-dried at 103 °C until constant mass. The oven-dry mass was determined to the nearest 0.001 g. The bottom of a miniature climate chamber (sealed plastic container with stainless-steel perforated plates) was filled with 5 L demineralized water. Specimens were exposed with approx. 5 mm distance to each other on the stainless-steel plates above water. The containers were stored in a climate chamber with “normal climate” and specimens weighed again after 24 h. The water vapor uptake of the specimens (W24100%RH) was determined and the resulting MC calculated (Equation (2)).
- W24100%RH = Water vapor uptake during 24 h exposure above water (%);
- m0 = Oven-dry mass before exposure (g);
- m100%RH = Mass after 24 h exposure above water (g).
Desorption
After water vapor uptake testing, specimens of 100 (ax.) × 10 × 5 mm3 were stored in sealed containers above water at 20 °C (approximately 100% RH) until constant mass. The mass at approx. cell wall saturation (CWS) was determined to the nearest 0.001 g. Specimens were exposed directly on freshly activated silica gel in sealed boxes (0% RH) and weighed again after 24 h. The water vapor release (desorption) of the specimens during 24 h was determined and expressed as a relative value of the mass at CWS (Equation (3)).
- W240%RH = Water vapor release during 24 h exposure at 0% RH (%);
- mCWS = Mass at CWS (g);
- m0%RH = Mass after 24 h exposure to 0% RH (g).
2.2.2. Capillary Water Uptake Tests (CWU)
Short-term water absorption was measured using a Krüss Processor Tensiometer K100MK2 (Krüss GmbH, Hamburg, Germany). Specimens of 60 (ax.) × 10 × 5 mm3 were stored at “normal climate” until constant mass. The axial specimen surfaces (10 × 5 mm2) were fixed in the tensiometer and positioned to be in contact with water. The specimen’s mass was recorded to the nearest 0.0001 g in intervals of 2 s for a period of 200 s. The capillary water uptake (CWU) was determined over time and related to the cross-sectional area of the specimens (Equation (4)).
- CWU = Capillary water uptake during 200 s (g/cm2);
- m200s = Mass after 200 s in contact with water (g);
- m65%RH = Mass at 20 °C, 65% RH (g).
2.2.3. Floating and Submersion Test (CEN/TS 16818 (2018))
Floating Test—Absorption and Desorption Cycle
Specimens of 50 (ax.) × 50 × 25 mm3 were dried at 103 °C until constant mass. The oven-dry weight (m0) was measured to the nearest 0.01 g. Prior testing, specimens were conditioned at “normal climate”. After conditioning, four sides (including end-grain surfaces) were sealed with a polyurethane sealant (Figure 1), the weight of the sealant and the initial specimen mass (mi) recorded. The moisture performance was tested during a water uptake (absorption) and release (desorption) cycle according to [5] with nine specimens of each material. Plastic containers were filled with demineralized water and stored at “normal climate”. For the water uptake cycle, test specimens were placed approx. 10 mm under the water level to ensure that one specimen surface (50 × 50 mm2) was completely submerged. Test specimens were removed in intervals after 1, 4, 8, 24, 48, 72 and 144 h, liquid water on the surface dabbed and the weight determined to the nearest 0.01 g.
After 144 h absorption, all test specimens were put on a stainless-steel grid on their sealed side and stored at “normal climate”. The minimum distance between specimens was 10 mm to guarantee adequate air circulation during the desorption cycle (drying). Test specimens were weighed to the nearest 0.01 g after 1, 4, 8, 24, 48, 72, 96 and 168 h.
Submersion Test—Absorption and Desorption Cycle
Specimens of 150 (ax.) × 50 × 25 mm3 were dried at 103 °C until constant mass. The oven-dry weight (m0) was determined to the nearest 0.01 g. Prior testing, specimens were conditioned at “normal climate”, sealed as described above (Figure 1) and the initial specimen mass (mi) determined. The moisture performance was tested during liquid water uptake and desorption cycles according to [5] with nine specimens of each material. Plastic containers were filled with demineralized water and stored at “normal climate”. For the water uptake cycle, test specimens were placed in the water so that they were fully submerged over the entire absorption cycle. Test specimens were removed in intervals after 1, 4, 8, 24, 48, 72 and 144 h, liquid water on the surface dabbed and the weight recorded to the nearest 0.01 g.
After 144 h absorption, a desorption cycle (drying) was performed as described for the floating test procedure (Figure 2).
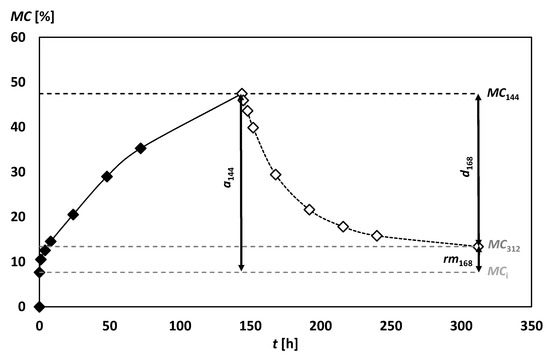
Figure 2.
Moisture content (MC) development over 144 h water uptake and 168 h desorption cycle determined in a submersion test, the initial MC (MCi), the MC after 144 h of water uptake (MC144) and the MC after 168 h of desorption (MC312) of Norway spruce (150 (ax.) × 50 × 25 mm3).
Indicators and Calculations from Floating and Submersion Tests
For each interval during the absorption and desorption period (Figure 2), the specimens’ weight (m) was recorded and the moisture content (MC, Equation (5)) calculated based on the oven-dry mass of the tested specimen without sealant (m0).
- MC = Moisture content of the specimen (%);
- m0 = Oven-dry mass without sealant (g);
- m = Mass after absorption/desorption without sealant (g).
To consider the extra mass (weight percent gain (WPG)) due to the presence of chemicals inside modified specimens, a corrected moisture content (MCcorr) was calculated for modified specimens and presented per cell wall mass (Equation (6)).
- MCcorr = Material moisture content of the modified specimen related to the oven-dry; cell wall mass (%);
- MC = Material moisture content of the modified specimen related to the oven-dry; material mass (cell wall + chemical) (%).
The amount of absorbed moisture after 144 h (a144) was calculated following Equation (7).
- a144 = Amount of absorbed moisture after 144 h (g);
- MCi = Initial moisture content of the specimen (g);
- MC144 = Moisture content of the specimen after 144 h of water uptake (g).
The amount of desorbed moisture after 168 h (d168) was calculated following Equation (8).
d168 = MC144 − MC312 (%)
- d168 = Amount of desorbed moisture after 168 h (g);
- MC144 = Moisture content of the specimen after 144 h of water uptake (g);
- MC312 = Moisture content of the specimen after 168 h of desorption (g).
The residual moisture content (rm168), which represents the increase in moisture content after 144 h of absorption followed by 168 h of desorption, compared to the initial moisture content, was calculated according to Equation (9).
- rm168 = Residual moisture content of the specimen after 312 h of testing (g);
- a144 = Amount of absorbed moisture after 144 h (g);
- d168 = Amount of desorbed moisture after 168 h (g).
The residue (res312) was calculated (Equation (10)), representing the moisture content left in the test specimen after 168 h desorption (rm168) as a percentage of the absorbed moisture after 144 h (a144).
- res312 = Residue in the specimen after 312 h of testing expressed as a percentage (%);
- rm168 = Residual moisture content of the specimen after 312 h of testing (g);
- a144 = Amount of absorbed moisture after 144 h (g).
2.3. Field Exposure
After testing the moisture performance under laboratory conditions (Section 2.2.1 and Section 2.2.2), all materials with the different specimen designs were exposed on a test field at the University of Goettingen (51°33′34.9″ N, 9°57′18.5″ E, elevation: 199 m, oceanic continental climate). Prior exposure, all specimens were conditioned at “normal climate”. Specimens were horizontally exposed with the nonsealed surfaces on wire meshes (mesh size: 13 mm) with a distance of at least 10 mm between the specimens and a distance from the ground of 0.85 m, ensuring free air circulation. Five specimens of each format (Figure 1) were chosen from originally nine. A notch of 3.2 (ax.) × 50 × 13 mm3 was cut in the remaining specimens (150 (ax.) × 50 × 25 mm3) from submersion tests (n = 4) and horizontally exposed, to detect the impact of end-grain surfaces on the moisture performance of the materials. Specimens were exposed between 15 April 2019 and 20 June 2019 for a period of 10 weeks. The specimens were weighed to the nearest 0.01 g twice a week with a minimum time between each measurement of two days but not more than four days. MC was calculated for each measurement (MCi) and the mean MC (MCmean) calculated over the entire exposure period (Equation (11)).
- MCmean = Mean moisture content over 10 weeks of outside exposure (%);
- MCj = Mean moisture content per material and specimen design at each day of measurement (j) (%);
- n = Number of moisture content measurements (-).
Local climate parameters like ambient temperature (°C), RH (%) and daily precipitation (mm) were recorded over the entire exposure by a meteorological station which was located approx. 500 m away from the test field and at an elevation of 240 m.
3. Results and Discussion
3.1. Laboratory Trials
3.1.1. W24-Tests (24 h Water Uptake and Release Tests (Meyer-Veltrup et al. 2017))
To predict the moisture behavior of wood in service, four different test procedures—liquid water uptake (W24sub.), water vapor uptake (W24100%RH), water vapor release (W240%RH) and capillary water uptake (CWU)—were applied to test specimens of 100 (ax.) × 10 × 5 mm3. Results and factors describing the wetting ability (kwa) are shown in Table 1. The kwa factors were calculated for each procedure separately. Additionally, all procedures were summarized in one kwa, all factor according to Equation (12) with Norway spruce as the reference material.
- W24sub. = Liquid water uptake during 24 h submersion (%);
- W24100%RH = Water vapor uptake during 24 h exposure above water (%);
- W240%RH = Water vapor release during 24 h exposure at 0% RH (%);
- CWU = Capillary water uptake during 200 s (g/cm2);
- NS = Norway spruce as reference material;
- test. = Tested material.
The results from short-term W24-tests differed between both, test procedure and wood species. Regarding the kwa factors, they showed the narrowest range of data between the different materials during water vapor release (desorption) tests while the widest range was observed in the water vapor uptake tests. Differences in water uptake and release behavior became evident between wood species, between different chemical modification technologies, and between treatments with water- and/or oil-borne preservatives (Table 1).
3.1.2. Floating Test (CEN/TS 16818 (2018))
In addition to nonstandardized short-term water uptake and release tests (W24-tests [2]), liquid water uptake and water vapor release were investigated in floating tests according to CEN/TS 16818 [1]. The residual moisture content after an absorption period of 144 h followed by a desorption step of 168 h (rm168) and the residue (res312) as the percentage of the rm168 related to the amount of absorbed water (a144), had been calculated as laboratory moisture resistance indicators. Results are summarized in Table 2, strictly following the terminology of [5] and showing corresponding kwa factors. Hence, all indicators were calculated based on the absolute amount of absorbed water in grams. On the same data basis, the mean moisture content (MCmean) was calculated over the entire moisture uptake and release procedure as an additional moisture resistance indicator. The moisture performance of the materials during the floating tests differed between both, different moisture resistance indicators and between untreated and treated wood (Table 2).

Table 2.
Moisture content at the end of absorption (MC144 in g) and desorption cycle (MC312 in g), amount of absorbed moisture after 144 h (a144 in g), amount of desorbed moisture after 168 h (d312 in g), residual moisture content (rm168 in g), residue (res312 in g) and mean MC (MCmean) in floating tests (50 (ax.) × 50 × 25 mm3) according to [5].
The same indicators had been calculated considering the absorbed and released amounts of water as percentage values, related to the oven-dry wood mass. The latter were summarized in Table 3 for all tested materials.

Table 3.
Moisture content at the end of absorption (MC144 in %) and desorption cycle (MC312 in %), amount of absorbed moisture after 144 h (a144 in %), amount of desorbed moisture after 168 h (d312 in %), residual moisture content (rm168 in %), residue (res312 in %) and mean MC (MCmean) in floating tests (50 (ax.) × 50 × 25 mm3) according to [5].
Among the softwoods, Radiata pine SW showed the most rapid and highest change in MC during the absorption step of the floating test (a144 = 62.33%); among the hardwoods, it was European beech (a144 = 45.66%). Among all materials, the tropical hardwoods and Black locust showed the lowest changes in MC. The other wood species and the treated materials were listed in between (Table 3).
3.1.3. Submersion Test (CEN/TS 16818 (2018))
Liquid water uptake and water vapor release were also investigated in submersion tests according to [5]. Laboratory moisture resistance indicators were calculated as described under Section 3.1.2. Results were summarized in Table 4 plus corresponding kwa factors. All indicators were calculated based on the absolute amount of absorbed water in grams. The moisture performance of the materials during submersion tests differed between both, different moisture resistance indicators and between untreated and treated wood (Table 4).

Table 4.
Moisture content at the end of absorption (MC144 in g) and desorption cycle (MC312 in g), amount of absorbed moisture after 144 h (a144 in g), amount of desorbed moisture after 168 h (d312 in g), residual moisture content (rm168 in g), residue (res312 in g) and mean MC (MCmean) in submersion tests (150 (ax.) × 50 × 25 mm3) according to [5].
The same indicators had been calculated for submersion test specimens, considering the absorbed and released amounts of water as percentage values, related to the oven-dry specimens’ mass. The latter were summarized in Table 5 for all tested materials.

Table 5.
Moisture content at the end of absorption (MC144 in %) and desorption cycle (MC312 in %), amount of absorbed moisture after 144 h (a144 in %), amount of desorbed moisture after 168 h (d312 in %), residual moisture content (rm168 in %), residue (res312 in %) and mean MC (MCmean) in submersion tests (150 (ax.) × 50 × 25 mm3) according to [5]).
Among the softwoods, Radiata pine SW showed the most rapid and highest change in MC during the absorption step of the submersion test (a144 = 63.00%), among the hardwoods it was Paulownia (a144 = 75.42%). Among all materials, the tropical hardwoods and Black locust showed the lowest changes in MC. The other wood species and the treated materials were listed in between (Table 5).
In principle, it became evident that the submersion test resulted in significantly higher water uptakes of the different untreated, modified and preservative-treated materials, compared to the floating test which was in line with the observations made previously by others [20].
The kwa factors based on rm168 (a), res312 (b) and MCmean (c) from submersion tests (Figure 3, x-axis) had been compared to those resulting from floating tests (Figure 3, y-axis). The latter showed good correlations between results from floating (50 (ax.) × 50 × 25 mm3) and submersion tests (150 (ax.) × 50 × 25 mm3) with R2 ranging from 0.7016 (kwa (res312)) to 0.8546 (kwa (rm168)). Hence, both test set-ups led to similar assessments of the moisture resistance of the individually tested materials like untreated wood, modified wood or preservative-treated wood.
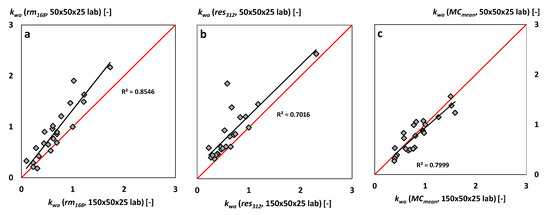
Figure 3.
kwa factors based on rm168 (a), res312 (b) and MCmean (c) determined during floating tests versus respective kwa factors measured during submersion tests according to [5].
3.2. Outdoor Moisture Performance
After laboratory testing, all tested materials were exposed outside over a period of 10 weeks to determine the moisture resistance of each material under real outdoor conditions. Figure 4 shows exemplarily the MC development in Norway spruce specimens of 50 (ax.) × 50 × 25 mm3 with increasing MC in response to increasing RH and rainfall.
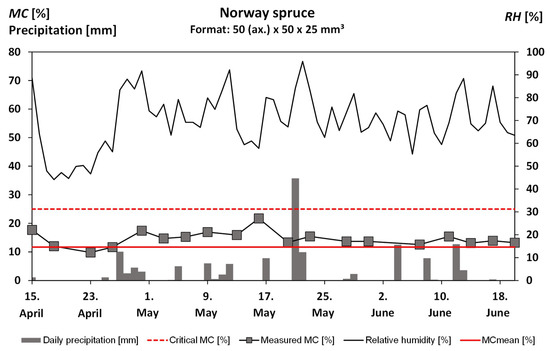
Figure 4.
Wood moisture content (MC) development in Norway spruce specimens (50 (ax.) × 50 × 25 mm3) exposed horizontally in open field and corresponding relative humidity (RH) (%), precipitation (mm), mean MC (MCmean) (%) and critical moisture conditions for the growth and infestation by wood-destroying fungi (critical MC %).
The mean MC (MCmean) was calculated over the entire exposure period (Equation (10)) and summarized in Table 6 including corresponding kwa factors. Results differed between both, different specimen designs and wood species. Most of the tested materials showed significantly higher MCmean in specimens with free end-grain surfaces (specimens: 150 (ax.) × 50 × 25notched mm3). Considering kwa factors, the narrowest range of data between the different materials was found for small-sized specimens with free end-grain surfaces (100 (ax.) × 10 × 5 mm3) while the widest range was observed for specimens of 50 (ax.) × 50 × 25 mm3 with sealed sides.

Table 6.
Mean moisture content (MCmean) of different softwoods, hardwoods, modified wood and preservative-treated wood detected during free-ventilated horizontal outside exposure (test field in Goettingen, Germany, 51°33′34.9″ N, 9°57′18.5″ E, elevation: 199 m, oceanic continental climate) between 15 April 2019 and 20 June 2019, depending on the specimen design.
3.3. Predicting Moisture Performance Based on Laboratory Indicators
3.3.1. Residual Moisture Content (rm168) and Residue (res312) According to CEN/TS 16818 (2018)—Calculation Basis: Absorbed Moisture (g)
In the following, laboratory indicators from floating and submersion tests according to [1] were considered to predict the outdoor moisture performance of the respective materials. For this, rm168 and res312 were calculated from water uptake and release behavior during laboratory testing (lab) and compared to the mean MC (MCmean) of the same specimen design, which was measured during outside exposure (field). MCmean values of specimens from submersion tests, which were exposed outside with a notch (150 (ax.) × 50 × 25notched mm3), were compared to respective laboratory indicators (rm168, res312) of the submersion test specimens without a notch (Figure 5b,e).
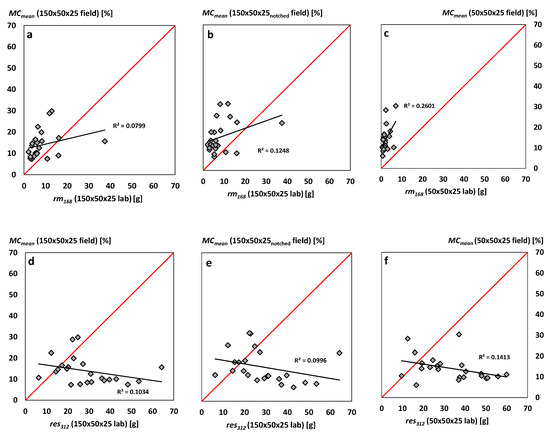
Figure 5.
Interrelationship between MCmean (%) measured during outside exposure and rm168 (a–c) and res312 (d–f) in grams determined in submersion (a,b,d,e) and floating tests (c,f) according to [5].
Strictly following the terminology of [1], rm168 and res312 were calculated based on the absolute amounts of absorbed water in grams. With R2 ≤ 0.26, rm168 and res312 showed less potential to predict the moisture performance of the same material during outside exposure. The latter became evident independent of the specimen design (Figure 5).
The comparison of kwa factors based on MCmean from field exposure with those based on rm168 and res312 from laboratory testing (R2 ≤ 0.34) confirmed that the latter show only very little power to predict the moisture performance during outside exposure (Figure 6 and Figure 7).
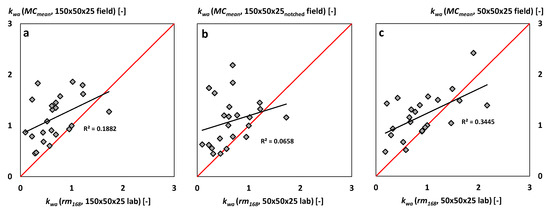
Figure 6.
kwa factors based on MCmean (%) measured during outdoor exposure versus kwa factors of rm168 (a–c) in grams determined in submersion (a,b) and floating tests (c) according to [5].
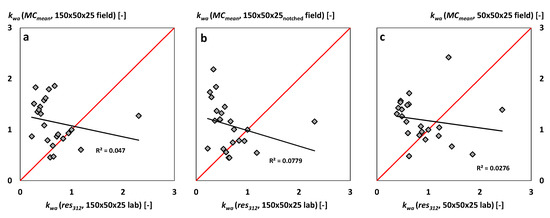
Figure 7.
kwa factors based on MCmean (%) measured during outdoor exposure versus kwa factors of res312 (a–c) in grams determined in submersion (a,b) and floating tests (c) according to [5].
3.3.2. Residual Moisture Content (rm168) and Residue (res312) According to CEN/TS 16818 (2018)—Calculation Basis: Moisture Content (%)
Notwithstanding the standard [1], but in line with a study by [19], laboratory indicators rm168 and res312 were calculated considering the absorbed water by the MC as a percentage value related to the oven-dry specimen mass. Compared with MCmean values from field exposure, the correlations between the laboratory indicator rm168 and the moisture performance in field became better, especially for specimens of 50 (ax.) × 50 × 25 mm3 with an R2 = 0.57. The residue res312 still showed minor power to predict the moisture performance in the field with R2 ≤ 0.14 (Figure 8).
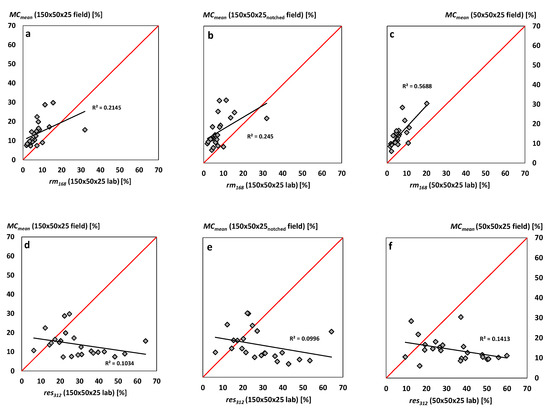
Figure 8.
Interrelationship between MCmean (%) measured during outside exposure and rm168 (a–c) and res312 (d–f) calculated as moisture content (%) in submersion (a,b,d,e) and floating tests (c,f) according to [5].
The comparison of kwa factors based on rm168 and res312 from laboratory testing were well correlated with kwa factors based on MCmean from field exposure. The latter was shown for both specimen designs of 150 (ax.) × 50 × 25 mm3 and 50 (ax.) × 50 × 25 mm3, while the residue res312 still showed minor power to predict the moisture performance in the field with R2 ≤ 0.08 (Figure 9).
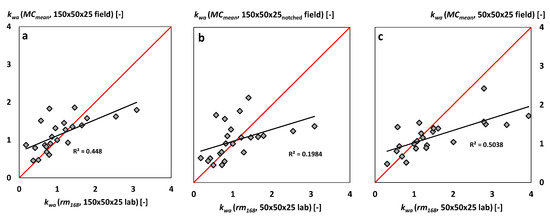
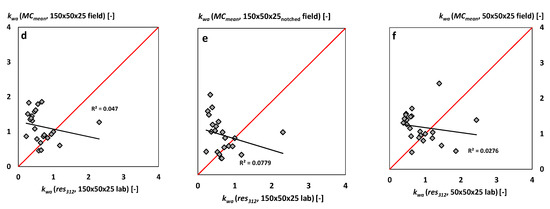
Figure 9.
kwa factors based on MCmean (%) measured during outside exposure versus kwa factors of rm168 (a–c) and res312 (d–f) calculated as moisture content (%) in submersion (a,b,d,e) and floating tests (c,f) according to [5].
3.3.3. Mean Moisture Content (MCmean) (%) Calculated during Absorption and Desorption Cycles According to CEN/TS 16818 (2018)
Rather poor (Section 3.3.1) to moderate (Section 3.3.2) correlations were found between the laboratory indicators rm168 and res312 and the moisture performance in the field. Hence, the MCmean was calculated as an alternative moisture laboratory indicator according to Equation (13) based on results from floating and submersion tests. The MCmean considered the MC developments over the entire absorption and desorption process, excluding the MC value detected after 96 h moisture release (Figure 10). Further on, test specimens from short-term water uptake and release tests (W24-tests) with free end-grain surfaces (100 (ax.) × 100 × 5 mm3) were regarded to predict the moisture performance of respectively tested materials in service.
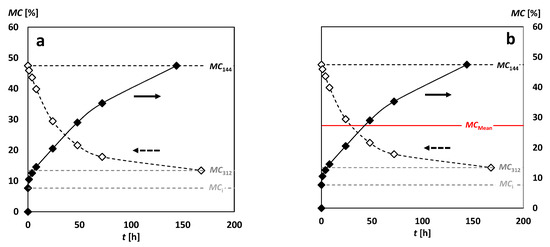
Figure 10.
Moisture content (MC) development during 144 h water uptake and 168 h desorption determined in a submersion test, the initial MC (MCi), the MC after 144 h of water uptake (MC144), the MC after 168 h of desorption (MC312) of Norway spruce (150 (ax.) × 50 × 25 mm3, (a) and the resulting mean MC (MCmean) calculated according to Equation (12) (b).
- MCmean = Mean moisture content over absorption and desorption cycles (%)
- MCj = Moisture content after j hours of absorption/desorption (%)
Laboratory moisture indicators showed better correlations with MCmean values (Equation (10)) resulting from outside exposure, when instead of laboratory indicators rm168 and res312, MCmean values (Equation (12)) from laboratory testing were used (Figure 11).
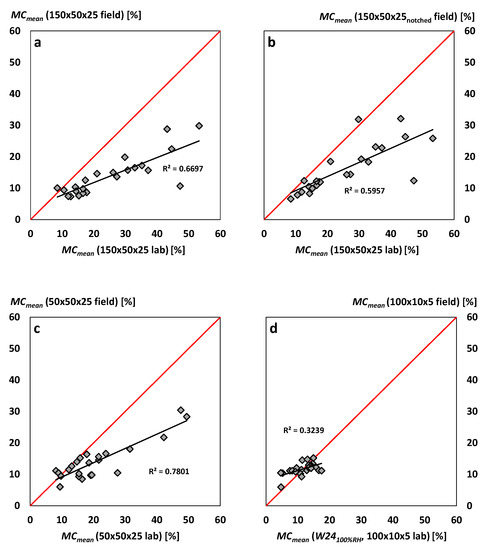
Figure 11.
Interrelationship between MCmean (%) measured during outside exposure and MCmean (%) measured in laboratory submersion (a,b), floating (c) and 24 h water uptake and release tests (d).
The kwa factors based on MCmean values tested under laboratory conditions in submersion tests (150 (ax.) × 50 × 25 mm3) showed the best correlation with kwa factors based on MCmean values from field exposure. Hence, the submersion test set-up and the corresponding specimen design showed the best potential to predict the moisture performance of respective materials outside. Surprisingly, the correlation even increased when comparing kwa factors based on MCmean from submersion tests with the moisture performance of the same specimen design having a notch (free end-grain surfaces; Figure 12).
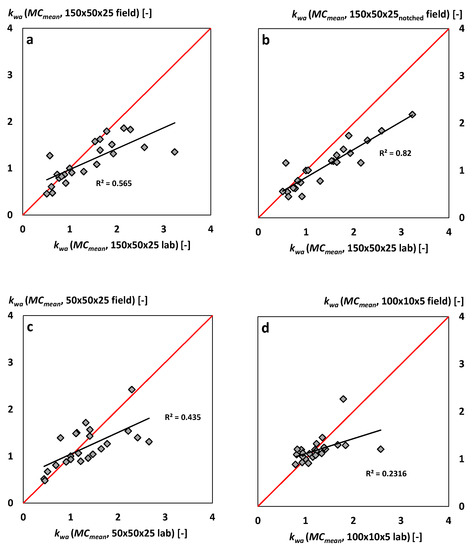
Figure 12.
kwa factors based on MCmean (%) measured during outside exposure versus kwa factors of MCmean (%) measured in laboratory submersion (a,b), floating (c) and 24 h water uptake and release tests (d) according to [3].
3.3.4. Mean Moisture Content (MCmean) (%) Calculated during Absorption and Desorption Cycles According to Meyer-Veltrup et al. (2017) and CEN/TS 16818 (2018)
Test specimens from short-term water uptake and release tests [3] were used to predict the moisture performance of different materials in the field. Hence, kwa, all factors of 100 (ax.) × 10 × 5 mm3 specimens had been calculated considering results from 24 h liquid water uptake (W24sub.), water vapor uptake (W24100% RH) and water vapor release (W240%RH) tests according to [3]. The latter showed good correlations (R2 = 0.7163) with the kwa factors based on MCmean of submersion test specimens during outside exposure (Figure 13).
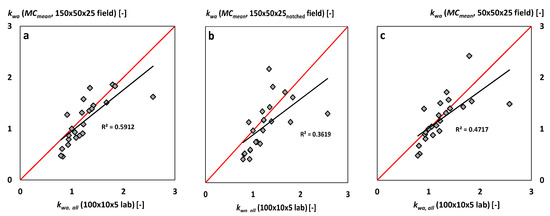
Figure 13.
kwa factors based on MCmean (%) of test specimens of 150 (ax.) × 50 × 25 mm3 without notch (a) and with a notch (b) and of 50 (ax.) × 50 × 25 mm3 (c) determined during outside exposure versus kwa, all factors of 100 (ax.) × 10 × 5 mm3 specimens determined during 24 h water uptake and release tests according to [3].
The correlation increased further (R2 = 0.76), considering kwa factors that were solely based on results from 24 h liquid water uptake (W24sub.) tests (Figure 14).
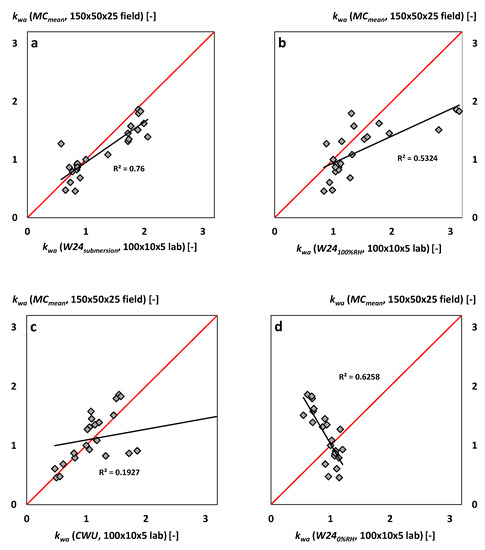
Figure 14.
kwa factors based on MCmean of different test specimens determined during outside exposure versus kwa factors of 100 (ax.) × 10 × 5 mm3 specimens determined during 24 h water uptake and release tests separated by liquid water (W24sub., (a)), water vapor (W24100%RH, (b)) and capillary water uptake (CWU, (c)) and water vapor release (W240%RH, (d)) according to [3].
Consequently, over an exposure period of 10 weeks, laboratory moisture indicators from short-term water uptake and release tests [3] showed good potential to predict the outdoor moisture performance.
4. Conclusions
Moisture resistance laboratory indicators were evaluated regarding their power to predict the outdoor moisture performance of a wide range of wood-based materials under test. From the results of this study, we conclude the following:
- Both laboratory test procedures—CEN/TS 16818 (2018) and short-term water uptake and release tests according to Meyer-Vektrup et al. (2017)—enabled to point out differences in the water permeability of the different materials under test (untreated, modified and preservative-treated wood); this was also the case for a 10-week period of outside exposure.
- Floating and submersion tests according to [5] evidenced similar water uptake and release behavior for the different materials under test. Hence, the two test set-ups appeared replaceable by each other.
- The moisture indicators rm168 and res312 [5] showed the minor potential to predict the outdoor moisture performance of the tested materials. This became evident for both parameters and was shown both, when the absolute amount of moisture was calculated and given in grams and when the respective moisture content values were calculated as a percentage related to the oven-dry specimens’ mass.
- The MCmean during submersion and floating tests, respectively, showed high potential to predict the outdoor moisture performance of the different test materials.
- Short-term water uptake and release tests with small-sized specimens (100 (ax.) × 10 × 5 mm3) and free end-grain surfaces were shown to be an adequate alternative to standardized tests (e.g., [5]) and showed fairly high predictive power of the outdoor moisture performance of wood.
Author Contributions
Conceptualization, L.E. and C.B.; methodology, L.E. and C.B.; software, L.E., C.B. and M.H.; validation L.E., C.B. and M.H.; formal analysis, L.E. and C.B.; investigation, L.E., M.S., M.S.S., A.-C.J. and A.B.; resources, L.E., C.B. and M.H.; data curation, L.E., C.B. and M.H.; writing—original draft preparation, L.E.; writing—review and editing, L.E., C.B. and M.H.; visualization, L.E.; supervision, C.B.; project administration, L.E. and C.B.; funding acquisition, C.B. All authors have read and agreed to the published version of the manuscript.
Funding
The authors received funding in the frame of the research project CLICKdesign, which is supported under the umbrella of ERA-NET Cofund ForestValue by the Ministry of Education, Science and Sport (MIZS)—Slovenia; The Ministry of the Environment (YM)—Finland; The Forestry Commissioners (FC)—UK; Research Council of Norway (RCN)—Norway; The French Environment and Energy Management Agency (ADEME) and The French National Research Agency (ANR)—France; The Swedish Research Council for Environment, Agricultural Sciences and Spatial Planning (FORMAS), Swedish Energy Agency (SWEA), Swedish Governmental Agency for Innovation Systems (Vinnova)—Sweden; Federal Ministry of Food and Agriculture (BMEL) and Agency for Renewable Resources (FNR)—Germany. ForestValue has received funding from the European Union’s Horizon 2020 research and innovation program under grant agreement N° 773324. Furthermore, parts of this research were funded from the ongoing research projects DURATEST (2219NR372), supported by the German Ministry of Food and Agriculture (BMEL) via the Agency of Renewable Resources (FNR).
Acknowledgments
The authors acknowledge and cordially thank Alexander Knohl and Dipl. Phys. Heinrich Kreilein (Department Bioclimatology, University of Goettingen), who provided the meteorological data for the period of field exposure. Special thanks go to Philipp Nelis, Ferry Bongers, Uwe Herrmann and Michael Starck, who provided parts of the test material. Technical support of Andreja Žagar during short-term water uptake measurements is acknowledged as well.
Conflicts of Interest
The authors declare no conflict of interest.
References
- Brischke, C. Durability and Outdoor Performance of Wood Products towards a Comprehensive Methodology for Service Life Prediction. Habilitation Thesis, Leibniz University Hannover, Hannover, Germany, 2016. [Google Scholar]
- Meyer-Veltrup, L.; Brischke, C.; Niklewski, J.; Frühwald Hansson, E. Design and performance prediction of timber bridges based on a factorization approach. Wood Mat. Sci. Eng. 2018, 13, 167–173. [Google Scholar] [CrossRef]
- Meyer-Veltrup, L.; Brischke, C.; Alfredsen, G.; Humar, M.; Flæte, P.O.; Isaksson, T.; Larsson Brelid, P.; Westin, M.; Jermer, J. The combined effect of wetting ability and durability on outdoor performance of wood: Development and verification of a new prediction approach. Wood Sci. Technol. 2017, 51, 615–637. [Google Scholar] [CrossRef]
- EN 350. Durability of Wood and Wood-Based Products—Testing and Classification of the Durability to Biological Agents of Wood and Wood-Based Materials; European Committee for Standardization: Brussels, Belgium, 2016. [Google Scholar]
- CEN/TS 16818. Durability of Wood and Wood-Based Products—Moisture Dynamics of Wood and Wood-Based Products; European Committee for Standardization: Brussels, Belgium, 2018. [Google Scholar]
- EN 927-5. Paints and Varnishes—Coating Materials and Coating Systems for Exterior Wood—Part. 5: Assessment of the Liquid Water Permeability; European Committee for Standardization: Brussels, Belgium, 2007. [Google Scholar]
- ISO 535. Paper and Board—Determination of Water Absorptiveness—Cobb Method; International Standardization Organization: Geneve, Switzerland, 2014. [Google Scholar]
- Rapp, A.O.; Peek, R.D.; Sailer, M. Modelling the moisture induced risk of decay for treated and untreated wood above ground. Holzforschung 2000, 54, 111–118. [Google Scholar] [CrossRef]
- Brandt, K.; Melcher, E.; Rapp, A.O.; Welzbacher, C. Entwicklung und Untersuchung von hydrophobiertem und koloriertem Holz für Anwendungen im dekorativen, bewitterten Einsatz. Available online: https://www.fisaonline.de/projekte-finden/details/?tx_fisaresearch_projects%5Bp_id%5D=198&tx_fisaresearch_projects%5Baction%5D=projectDetails&tx_fisaresearch_projects%5Bcontroller%5D=Projects&cHash=3151d39c4d638287be68bae8f2ef7a45.URL (accessed on 31 August 2020).
- Brischke, C.; Hesse, C.; Meyer-Veltrup, L.; Humar, M. Studies on the material resistance and moisture dynamics of Common juniper, English yew, Black cherry, and Rowan. Wood Mat. Sci. Eng. 2018, 13, 222–230. [Google Scholar] [CrossRef]
- Žlahtič, M.; Humar, M. Influence of artificial and natural weathering on the moisture dynamic of wood. BioResources 2017, 12, 117–142. [Google Scholar] [CrossRef]
- Humar, M.; Kržišnik, D.; Lesar, B.; Thaler, N.; Ugovšek, A.; Zupančič, K.; Žlahtič, M. Thermal modification of wax-impregnated wood to enhance its physical, mechanical, and biological properties. Holzforschung 2017, 71, 57–64. [Google Scholar] [CrossRef]
- Žlahtič-Zupanc, M.; Lesar, B.; Humar, M. Changes in moisture performance of wood after weathering. Constr. Buil. Mat. 2018, 193, 529–538. [Google Scholar] [CrossRef]
- Van den Bulcke, J.; De Windt, I.; Defoirdt, N.; De Smet, J.; Van Acker, J. Moisture dynamics and fungal susceptibility of plywood. Int. Biodeter. Biodegr. 2011, 65, 708–716. [Google Scholar] [CrossRef]
- Brischke, C.; Meyer, L.; Bornemann, T. The potential of moisture content measurements for testing the durability of timber products. Wood Sci. Technol. 2013, 47, 869–886. [Google Scholar] [CrossRef]
- Grüll, G.; Truskaller, M.; Podgorski, L.; Bollmus, S.; De Windt, I.; Suttie, E. Moisture conditions in coated wood panels during 24 months natural weathering at five sites in Europe. Wood Mat. Sci. Eng. 2013, 8, 95–110. [Google Scholar]
- Li, W.; Van den Bulcke, J.; De Windt, I.; Dhaene, J.; Van Acker, J. Moisture behavior and structural changes of plywood during outdoor exposure. Eur. J. Wood Prod. 2016, 74, 211–221. [Google Scholar] [CrossRef]
- Humar, M.; Kržišnik, D.; Lesar, B.; Brischke, C. The Performance of Wood Decking after Five Years of Exposure: Verification of the Combined Effect of Wetting Ability and Durability. Forests 2019, 10, 903. [Google Scholar] [CrossRef]
- Slávik, R.; Čekon, M.; Štefaňák, J. A Nondestructive Indirect Approach to Long-Term Wood Moisture Monitoring Based on Electrical Methods. Materials 2019, 12, 2373. [Google Scholar] [CrossRef] [PubMed]
- Kržišnik, D.; Lesar, B.; Thaler, N.; Planinšič, J.; Humar, M. A study on the moisture performance of wood determined in laboratory and field trials. Eur. J. Wood Prod. 2020, 1–17. [Google Scholar] [CrossRef]
- Li, W.; Van den Bulcke, J.; De Windt, I.; Dhaene, J.; Mannes, D.; Lehmann, E.; Van Acker, J. Investigating plywood behaviour in outdoor conditions. Int. Wood Prod. J. 2016, 7, 220–224. [Google Scholar] [CrossRef]
- Rosso, L.; Negro, F.; Castro, G.; Cremonini, C.; Zanuttini, R. Moisture dynamics of thermally treated poplar plywood. Eur. J. Wood Prod. 2017, 75, 277–279. [Google Scholar] [CrossRef]
- Niklewski, J.; Brischke, C.; Frühwald Hansson, E.; Meyer-Veltrup, L. Moisture behavior of weathered wood surfaces during cyclic wetting: Measurements and modeling. Wood Sci. Technol. 2018, 52, 1431–1450. [Google Scholar] [CrossRef]
- Meyer, L.; Brischke, C.; Kasselmann, M. Holzfeuchte-Monitoring im Rahmen von Dauerhaftigkeitsprüfungen—Praktische Erfahrungen aus Freilandversuchen. Holztechnologie 2015, 56, 11–19. [Google Scholar]
© 2020 by the authors. Licensee MDPI, Basel, Switzerland. This article is an open access article distributed under the terms and conditions of the Creative Commons Attribution (CC BY) license (http://creativecommons.org/licenses/by/4.0/).