Article

The Additions of Nitrogen and Sulfur Synergistically Decrease the Release of Carbon and Nitrogen from Litter in a Subtropical Forest

1
National Forestry and Grassland Administration Key Laboratory of Forest Resources Conservation and Ecological Safety on the Upper Reaches of the Yangtze River, College of Forestry, Sichuan Agricultural University, Chengdu 611130, China
2
Sichuan Province Key Laboratory of Ecological Forestry Engineering on the Upper Reaches of the Yangtze River, College of Forestry, Sichuan Agricultural University, Chengdu 611130, China
3
CSIC, Global Ecology Unit CREAF-CSIC-UAB, Edifici C, Universitat Autònoma de Barcelona, Bellaterra, 08193 Barcelona, Spain
4
CREAF, Cerdanyola del Vallès, 08193 Barcelona, Spain
5
Sichuan Forestry and Grassland Inventory and Planning Institute, Chengdu 611130, China
*
Author to whom correspondence should be addressed.
Forests 2020, 11(12), 1280; https://doi.org/10.3390/f11121280
Submission received: 22 September 2020 / Revised: 25 November 2020 / Accepted: 27 November 2020 / Published: 29 November 2020

Abstract

:
Atmospheric nitrogen (N) and sulfur (S) deposition in subtropical forests has increased rapidly and the current level is very high, thus seriously affecting nutrient (e.g., N and phosphorus (P)) release from litter. However, the specific effects of S addition and its interaction with N on the release of carbon (C), N, and P from litter in subtropical evergreen broadleaved forests are unclear. Therefore, a two-year field experiment was performed using a litterbag method in a subtropical evergreen broadleaved forest in western China to examine the responses of litter decomposition and nutrient release to the control (CK), added N (+N), added S (+S), and added N and S (+NS) treatments. The results showed that the remaining litter mass, lignin, cellulose, C, N, P, and litter N/P ratio were higher, whereas the litter C/N ratio and soil pH were lower in the fertilization treatments than in CK. The annual decomposition coefficients (k-values) in the +N, +S, and +NS treatments were 0.384 ± 0.002, 0.378 ± 0.002, and 0.374 ± 0.001 year−1, respectively, which were significantly lower than the k-values in CK (0.452 ± 0.005 year−1, p < 0.05). The remaining mass, lignin, cellulose, C, and litter N/P ratio were higher, whereas the soil pH was lower in the +NS treatment than in the +N and +S. The interactive effects of N addition and S addition on the remaining litter lignin, cellulose, C, N, and P; the litter C/N, C/P, and N/P ratios; and the soil pH were significant (p < 0.05). In conclusion, the addition of N and S synergistically decreased the degradation of lignin and cellulose and the release of C and N and increased the litter N/P ratio, suggesting that external N and S inputs synergistically slowed the release of C and N from litter and exacerbated litter P limitation during decomposition in this forest.

Graphical Abstract

1. Introduction

Nitrogen (N) and sulfur (S) deposition has increased rapidly because of the burning of fossil fuels and the application of fertilizers since the Industrial Revolution [1,2] and has become an important contributor to global climate change [3,4,5]. The estimated global N and S depositions in 2010 were 123 Tg N y−1 and 84 Tg S y−1, respectively [1]. China accounts for >15% of the global atmospheric N and S deposition and has become one of the world’s highest N deposition countries [1,6]. Although N and mainly S depositions are declining in some parts of the world [1], N and S deposition is increasing rapidly in the subtropical forests in southern China and the mean level of atmospheric depositions are two- to three-fold higher than the national average [6]. The previous studies reported that N and S depositions in southern China increased approximately 300% and 50%, respectively, from the 1990s to 2010 [6,7]. Therefore, high-level and rapidly increasing atmospheric N and S deposition may seriously affect the C, N, and P cycles in these subtropical forests in southern China.
The release of nutrients from litter is key to the C, N, and P cycles of forests because >50% of plant primary net production returns to the soil through the decomposition of litter [8,9,10]. Inputs of external N can alter the structures of microbial communities [11,12], the activities of enzymes [12,13], and the nutrient balance of forest ecosystems [14,15,16], affecting the release of nutrients during litter decomposition [17,18]. Globally, different results have been reported in different studies. For example, Mo et al. [19] reported that N addition accelerated litter decomposition in a subtropical forest due to the increase in soil N availability, whereas a study by Bejarano et al. [20] showed that N addition did not significantly change litter decomposition in a tropical forest. In addition, Lv et al. [21] found that N addition inhibited litter decomposition and the release of nutrients in a subtropical forest because of the reduced microbial activity. Compared with N addition, studies focusing on how S addition affects litter nutrient release are relatively limited, but S addition has been found to increase [22], decrease [21,23], or not affect [4] litter mass loss. Moreover, N and S usually interact [22,24], increasing the uncertainty of the responses of litter decomposition and nutrient release to N and S addition. However, the specific effects of S addition and its interaction with N on the release of C, N, and P from litter in subtropical evergreen broadleaved forests are unclear.
The rainy zone of Western China has received considerable N and S depositions, and it represents one of the major regions of acid deposition in China [25]. Additionally, the levels of S input (193 kg S ha−1 y−1) from atmospheric deposition are twice as high as the levels of N input (95 kg N ha−1 y−1) in this rainy area [25,26], which most likely changes the litter decomposition and nutrient release processes in forests in this area. However, the effects of external S input or a combination of N and S input on litter decomposition and nutrient release have never been investigated in evergreen broadleaved forests in this area. In this study, we carried out a two-year field experiment in a subtropical evergreen broadleaved forest in this rainy area to examine the responses of the litter decomposition and the release of C, N, and P to the addition of N and S. The aims of this study are to improve the understanding of the effects of N and S deposition on litter nutrient release in subtropical evergreen broadleaved forests in the studied area and to provide a reference for the management of these forests under the scenario of a sustained rise in N and S depositions. Previous studies in broadleaved forests in this rainy area have shown that the addition of N decreased soil microbial biomass [27,28,29] and the activities of soil C-cycle enzymes [30], suggesting that N input may negatively affect litter decomposition and nutrient release [21,31,32]. We thus hypothesized that (1) N addition would inhibit litter decomposition and decrease the release of C, N, and P in the study forest. Most previous studies have shown that S addition negatively affects litter mass loss in tropical and subtropical forests [21,23,33]. Knowledge on the responses of litter nutrient release to S addition is nevertheless still limited. We also hypothesized that (2) S addition would suppress litter decomposition and reduce the release of C, N, and P in the study forest. Typically, N and S interactively decrease decomposition activity in terrestrial ecosystems [21,22,30] and may synergistically affect the release of nutrients from litter. Therefore, we further hypothesized that (3) N and S additions would synergistically inhibit litter decomposition and nutrient release in this forest.

2. Materials and Methods

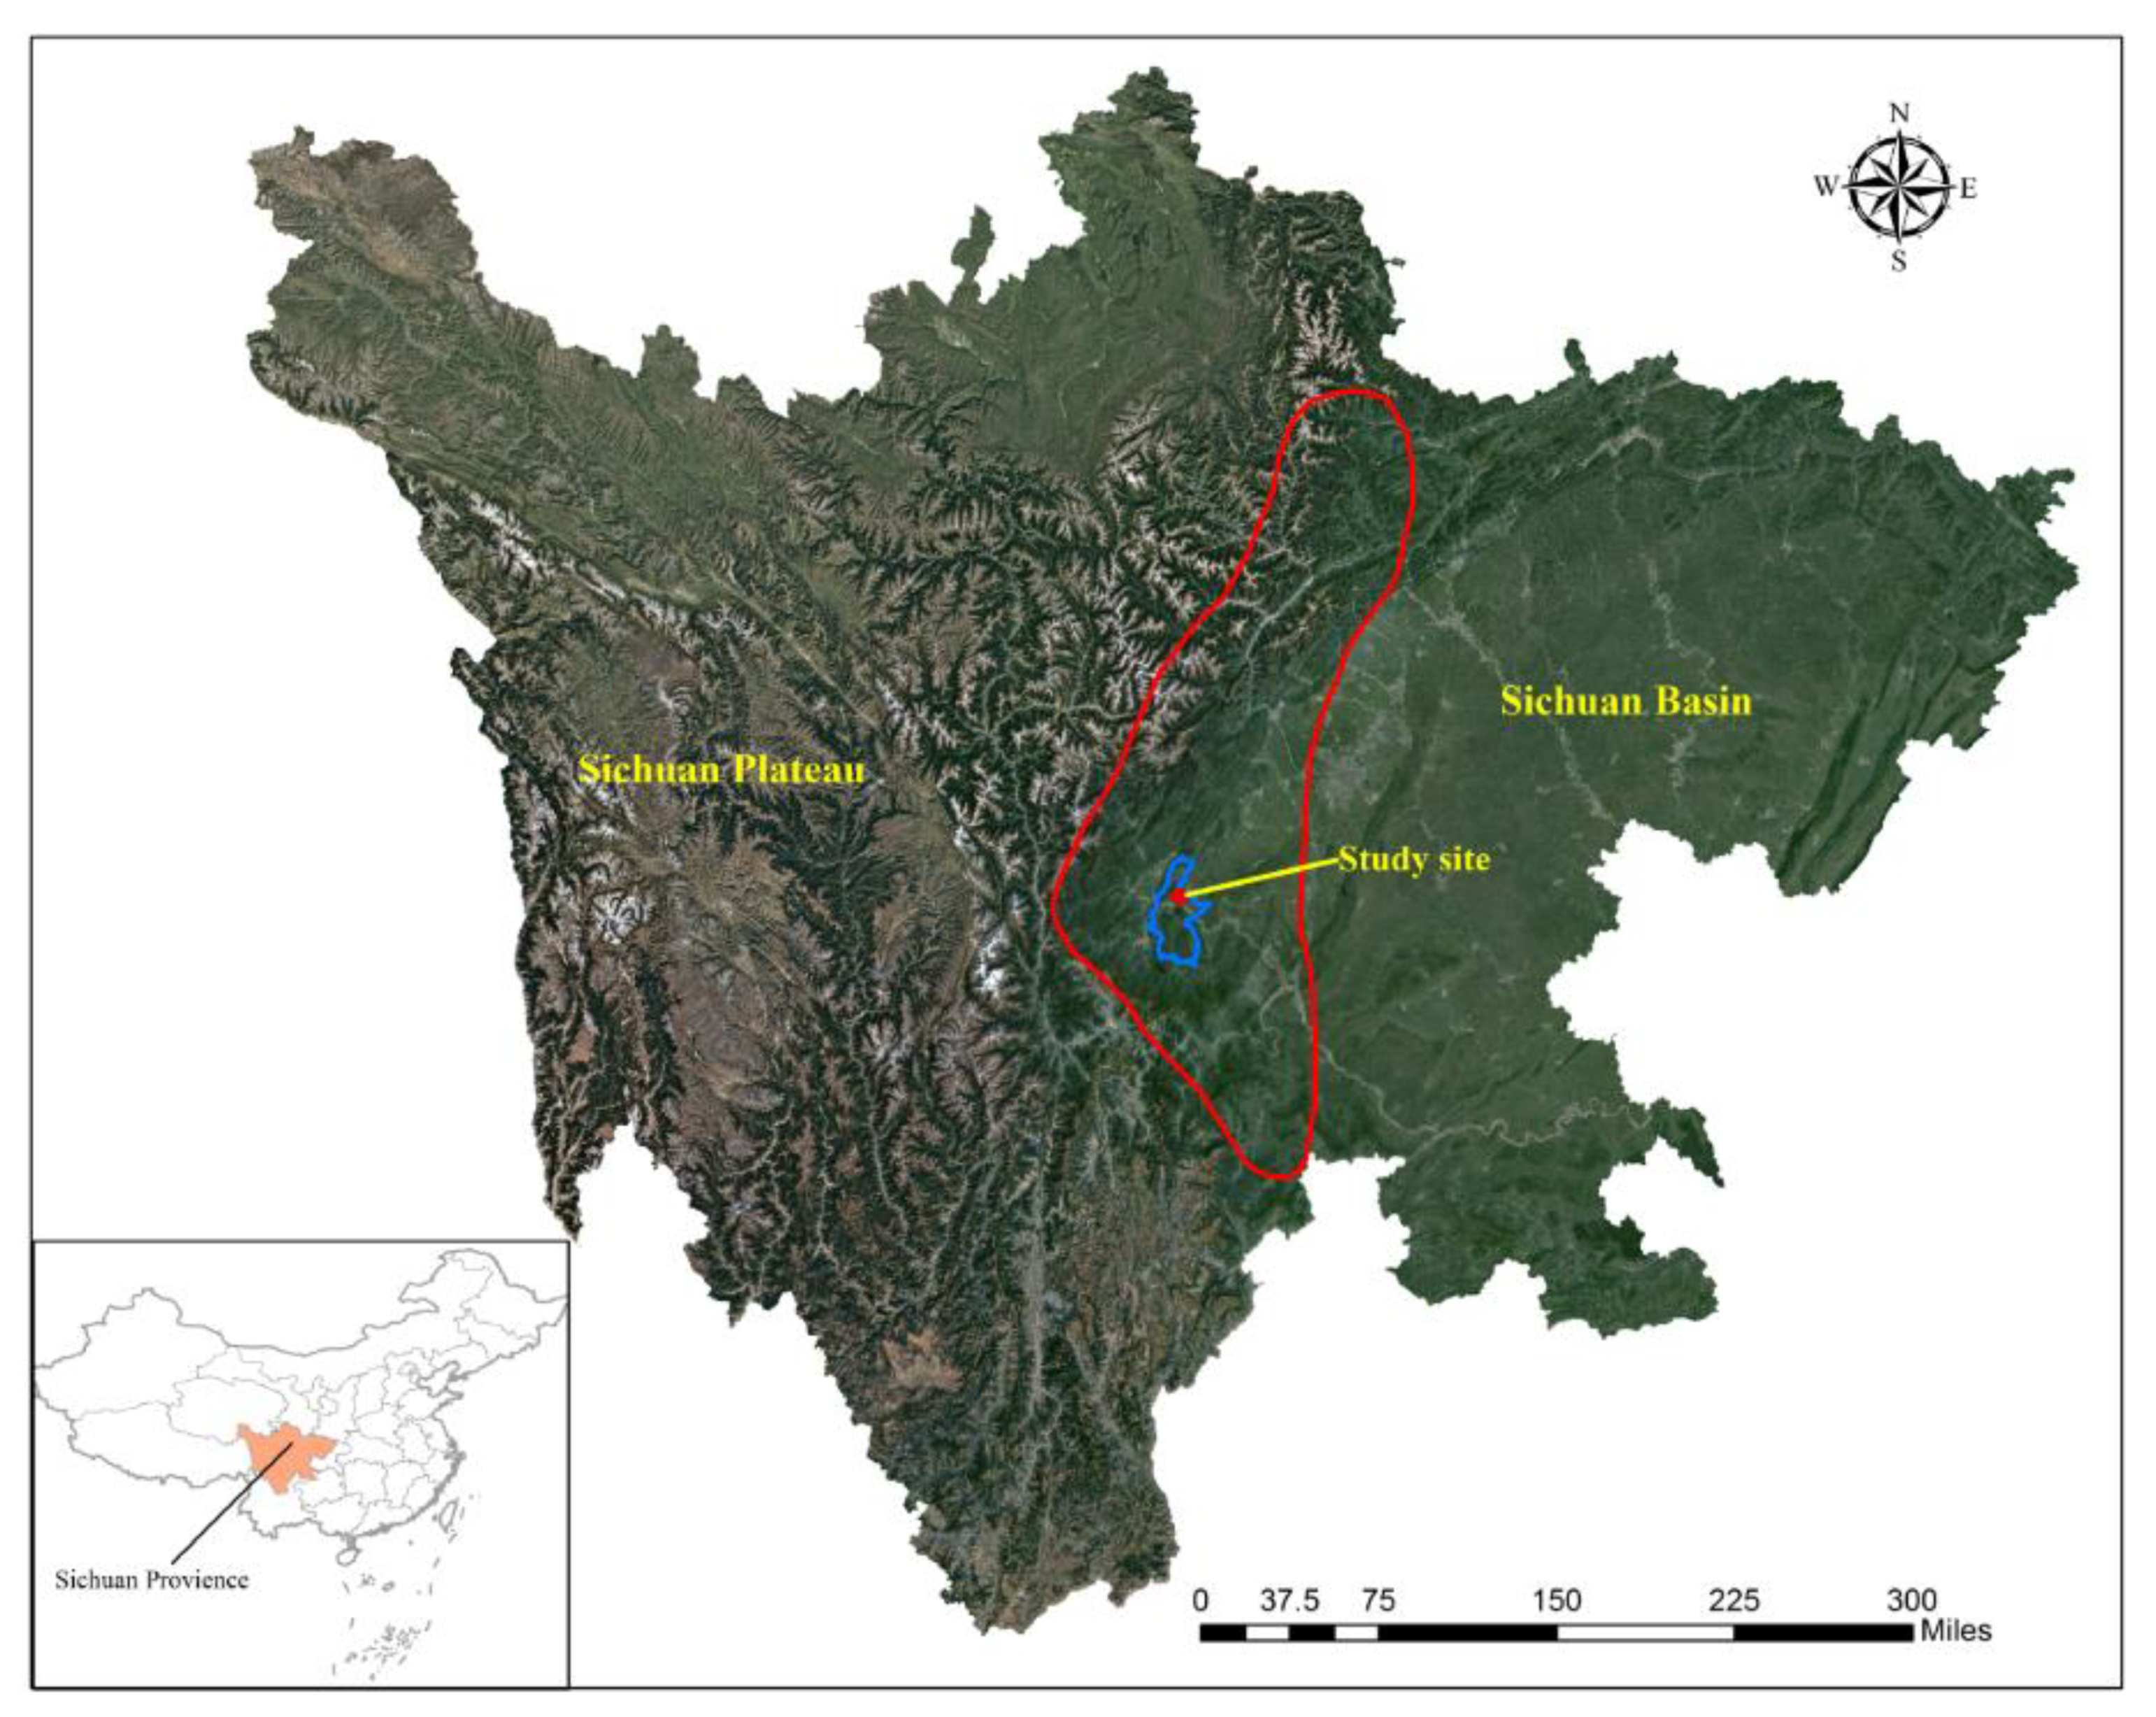
2.1. Study Site Description

The rainy zone of Western China is an ecotone between the Sichuan Plateau and the Sichuan Basin (Figure 1) [28,34]. The mean annual wet N and S depositions from 2008 to 2010 in this rainy area were 95 kg N ha−1 y−1 and 193 kg S ha−1 y−1, respectively [25,26]. An evergreen broadleaved forest on Jinfengsi Mountain (30°02′ N, 103°03′ E; 800 m a.s.l.), Yucheng County, was used as the object of study. The mean annual temperature (MAT) and mean annual precipitation (MAP) of the last 30 years were 16.1 °C and 1700 mm, respectively. The dominant tree species in the study forest are Lindera megaphylla, Quercus serrata, and Choerospondias axillaris, with standard ages of approximately 40 years. The soil is a Lithic Dystrudept (USDA Soil Taxonomy). The soil layer in our study forest was approximately 80 cm. The topsoil (0–20 cm soil horizon) pH was 4.50 ± 0.09 (H2O extraction) at the beginning of the experiment. See Tie et al. [30] for a more detailed description of the study site.

2.2. Experimental Design

2.2.1. Leaf Collecting and Bagging

Freshly fallen litter leaves were collected from the ground from October 2012 to December 2012. The collected fallen leaves were transported to the laboratory and air-dried. In this study, the mixed litter was used to simulate the decomposition process of litter in a natural scenario. The ratio of mixed air-dried litter leaves was 5:3:2 for L. megaphylla, Q. serrate, and C. axillaris. Then, we randomly weighed 15 bags of the mixed air-dried litter and placed the litter into a 65 °C oven for 96 h prior to determining the initial litter quality. Then, 10.0 g of the mixed air-dried litter were then placed into litterbags (20 × 20 cm, 0.05 mm pore size). A total of 432 litterbags were filled in February 2013. The initial concentrations of C, N, P, lignin, and cellulose were (averages ± standard deviations) 370 ± 6.91, 7.71 ± 0.75, 0.330 ± 0.06, 94.6 ± 3.12, and 185 ± 4.82 mg g−1, respectively.

2.2.2. Plot Design and Fertilization

Considering the high levels of atmospheric deposition and the observations of previous N and S addition studies in the study area [25,27,28,29,30], 150 kg N ha−1 y−1 and 300 kg S ha−1 y−1 were added in the present experiment, consisting of the control (CK, no added N or S), added N (+N, added 150 kg N ha−1 y−1), added S (+S, added 300 kg S ha−1 y−1), and added N and S (+NS, added 150 kg N ha−1 y−1 and 300 kg S ha−1 y−1) treatments. The N and S were from urea and sodium sulfate, respectively.
At the beginning of March 2013, twelve plots (5 × 5 m) were established in the study forest and then were divided into three blocks perpendicular to the maximum slope. Each plot was separated by >5 m. The four treatments were randomly distributed in plots inside each block, with three plot repeats for each treatment. In early April 2013, 36 (12 samplings × 3 bags sampling−1 plot−1) litterbags were evenly placed on the ground of each plot. Then, the fertilizers were dissolved in 2 L of water and sprayed evenly onto the ground of each plot using a hand-held sprayer (3 L of maximum capacity) once every half-month. The CK plots were sprayed with 2 L of water. We estimated that approximately 0.192 mm per year of simulated precipitation, a negligible amount, was added to the ground of each plot during the experiment period. See Tie et al. [30] for a more detailed description.

2.3. Litter and Soil Sampling and Analysis

2.3.1. Litter and Soil Sampling

Litterbags were sampled every two months, i.e., at the beginning of June, August, October, and December 2013; February, April, June, August, October, and December 2014; and February and April 2015. At each sampling time, three litterbags were randomly sampled from each plot and then immediately translated from the field to the laboratory, where the litter was dried at 65 °C for 96 h. The litter sample was sieved (<0.1 mm) prior to measuring the contents of lignin, cellulose, nutrient elements, and ash.
Soil samples were collected every six months, i.e., at the beginning of October 2013, April and October 2014, and April 2015. Moss, leaf litter, and the organic layer were removed from the soil surface. Then, five topsoil (0–20 cm soil horizon) samples were collected in each plot, and were fully mixed to form a composite sample. In the laboratory, the soil samples were air-dried for approximately one week and sieved (<2 mm) prior to measuring the pH.

2.3.2. Sample Analysis

The cellulose and lignin (acid unhydrolyzable residue, AUR) contents were determined using an acid detergent digestion method [35]. The dichromate oxidation-external heating method was used to measure the litter’s organic C content [36]. Subsamples of the litter were digested in 10 mL of mixed sulfuric acid and perchloric acid (5:1), and then the total N and total P contents of the litter were determined using the Kjeldahl digestion method and molybdenum–antimony colorimetry method, respectively [37]. The litter ash was determined using the dry-ashing method [5]. Soil pH was determined using a glass electrode in the H2O extracts (boiling to expel CO2) [37]. All determinations were repeated three times.

2.4. Calculation of the Litter’s Stoichiometry, Remaining Mass, and Remaining Nutrients

The stoichiometry ratios of the litter were mass-based. The remaining mass (Rm, % of the initial amount) was defined according to Equation (1), and the remaining (Ry, % of the initial amount) lignin, cellulose, C, N, and P were defined by Equation (2) [38]:
R m ( % ) = 100 × W t W 0
R y ( % ) = 100 × W t C t W 0 C 0
where W0 is the initial litter dry weight, Wt is the litter dry weight at tth sampling time, C0 is the initial nutrient concentration, and Ct is the nutrient concentration at tth sampling time. The litter’s dry weight was corrected according to the ash content.
A widely applied single exponential model was applied to define the decomposition coefficient, following Equation (3) [39]. Meanwhile, the time for 50% litter decomposition (T50%) was determined following Equation (4) [40]:
k = 1 t ln ( R m a )
T 50 % =   ln ( 1 0.5 ) k
where Rm is the remaining mass (% of the initial amount), a is a constant, k is the annual decomposition coefficient (year−1), and t is the time (year) for decomposition.

2.5. Statistical Analyses

The one-sample Kolmogorov–Smirnov test and Levene’s test were applied to test the normal distribution and homogeneity of each studied variable. Then, the Box-Cox method was used to transform the unequal or non-normal variances (e.g., litter N/P ratio). One-way ANOVA using Fisher’s least significant difference (LSD), adjusted using the Bonferroni correction, was applied to examine the differences among different treatments in terms of the remaining litter mass, lignin, cellulose, C, N, and P; the C/N, C/P, and N/P ratios at the end of the experiment; the k-value; and the T50%. Two-way ANOVA using Fisher’s LSD, adjusted using the Bonferroni correction, was applied to examine the differences among different treatments on soil pH at each sampling time. In order to understand the interaction of the addition of N and S, linear mixed-effects models with the restricted maximum-likelihood estimation were applied to determine the main effects of N addition, S addition, sampling time, and their interactions on the remaining litter mass, lignin, cellulose, C, N, and P, as well as on the litter’s stoichiometry ratios during the study period. We included blocks and plots as the random effects and N addition, S addition, and sampling time as the fixed effects. The pairwise relationships among the remaining nutrients and the remaining lignin and cellulose were determined by multiple regression models, including the unary linear regression model, quadratic regression model, and exponential regression model. In addition, the optimal model was confirmed based on the coefficient of determination (R2). The statistical analysis was performed in SPSS 25.0 (SPSS Inc., Chicago, IL, USA).

3. Results

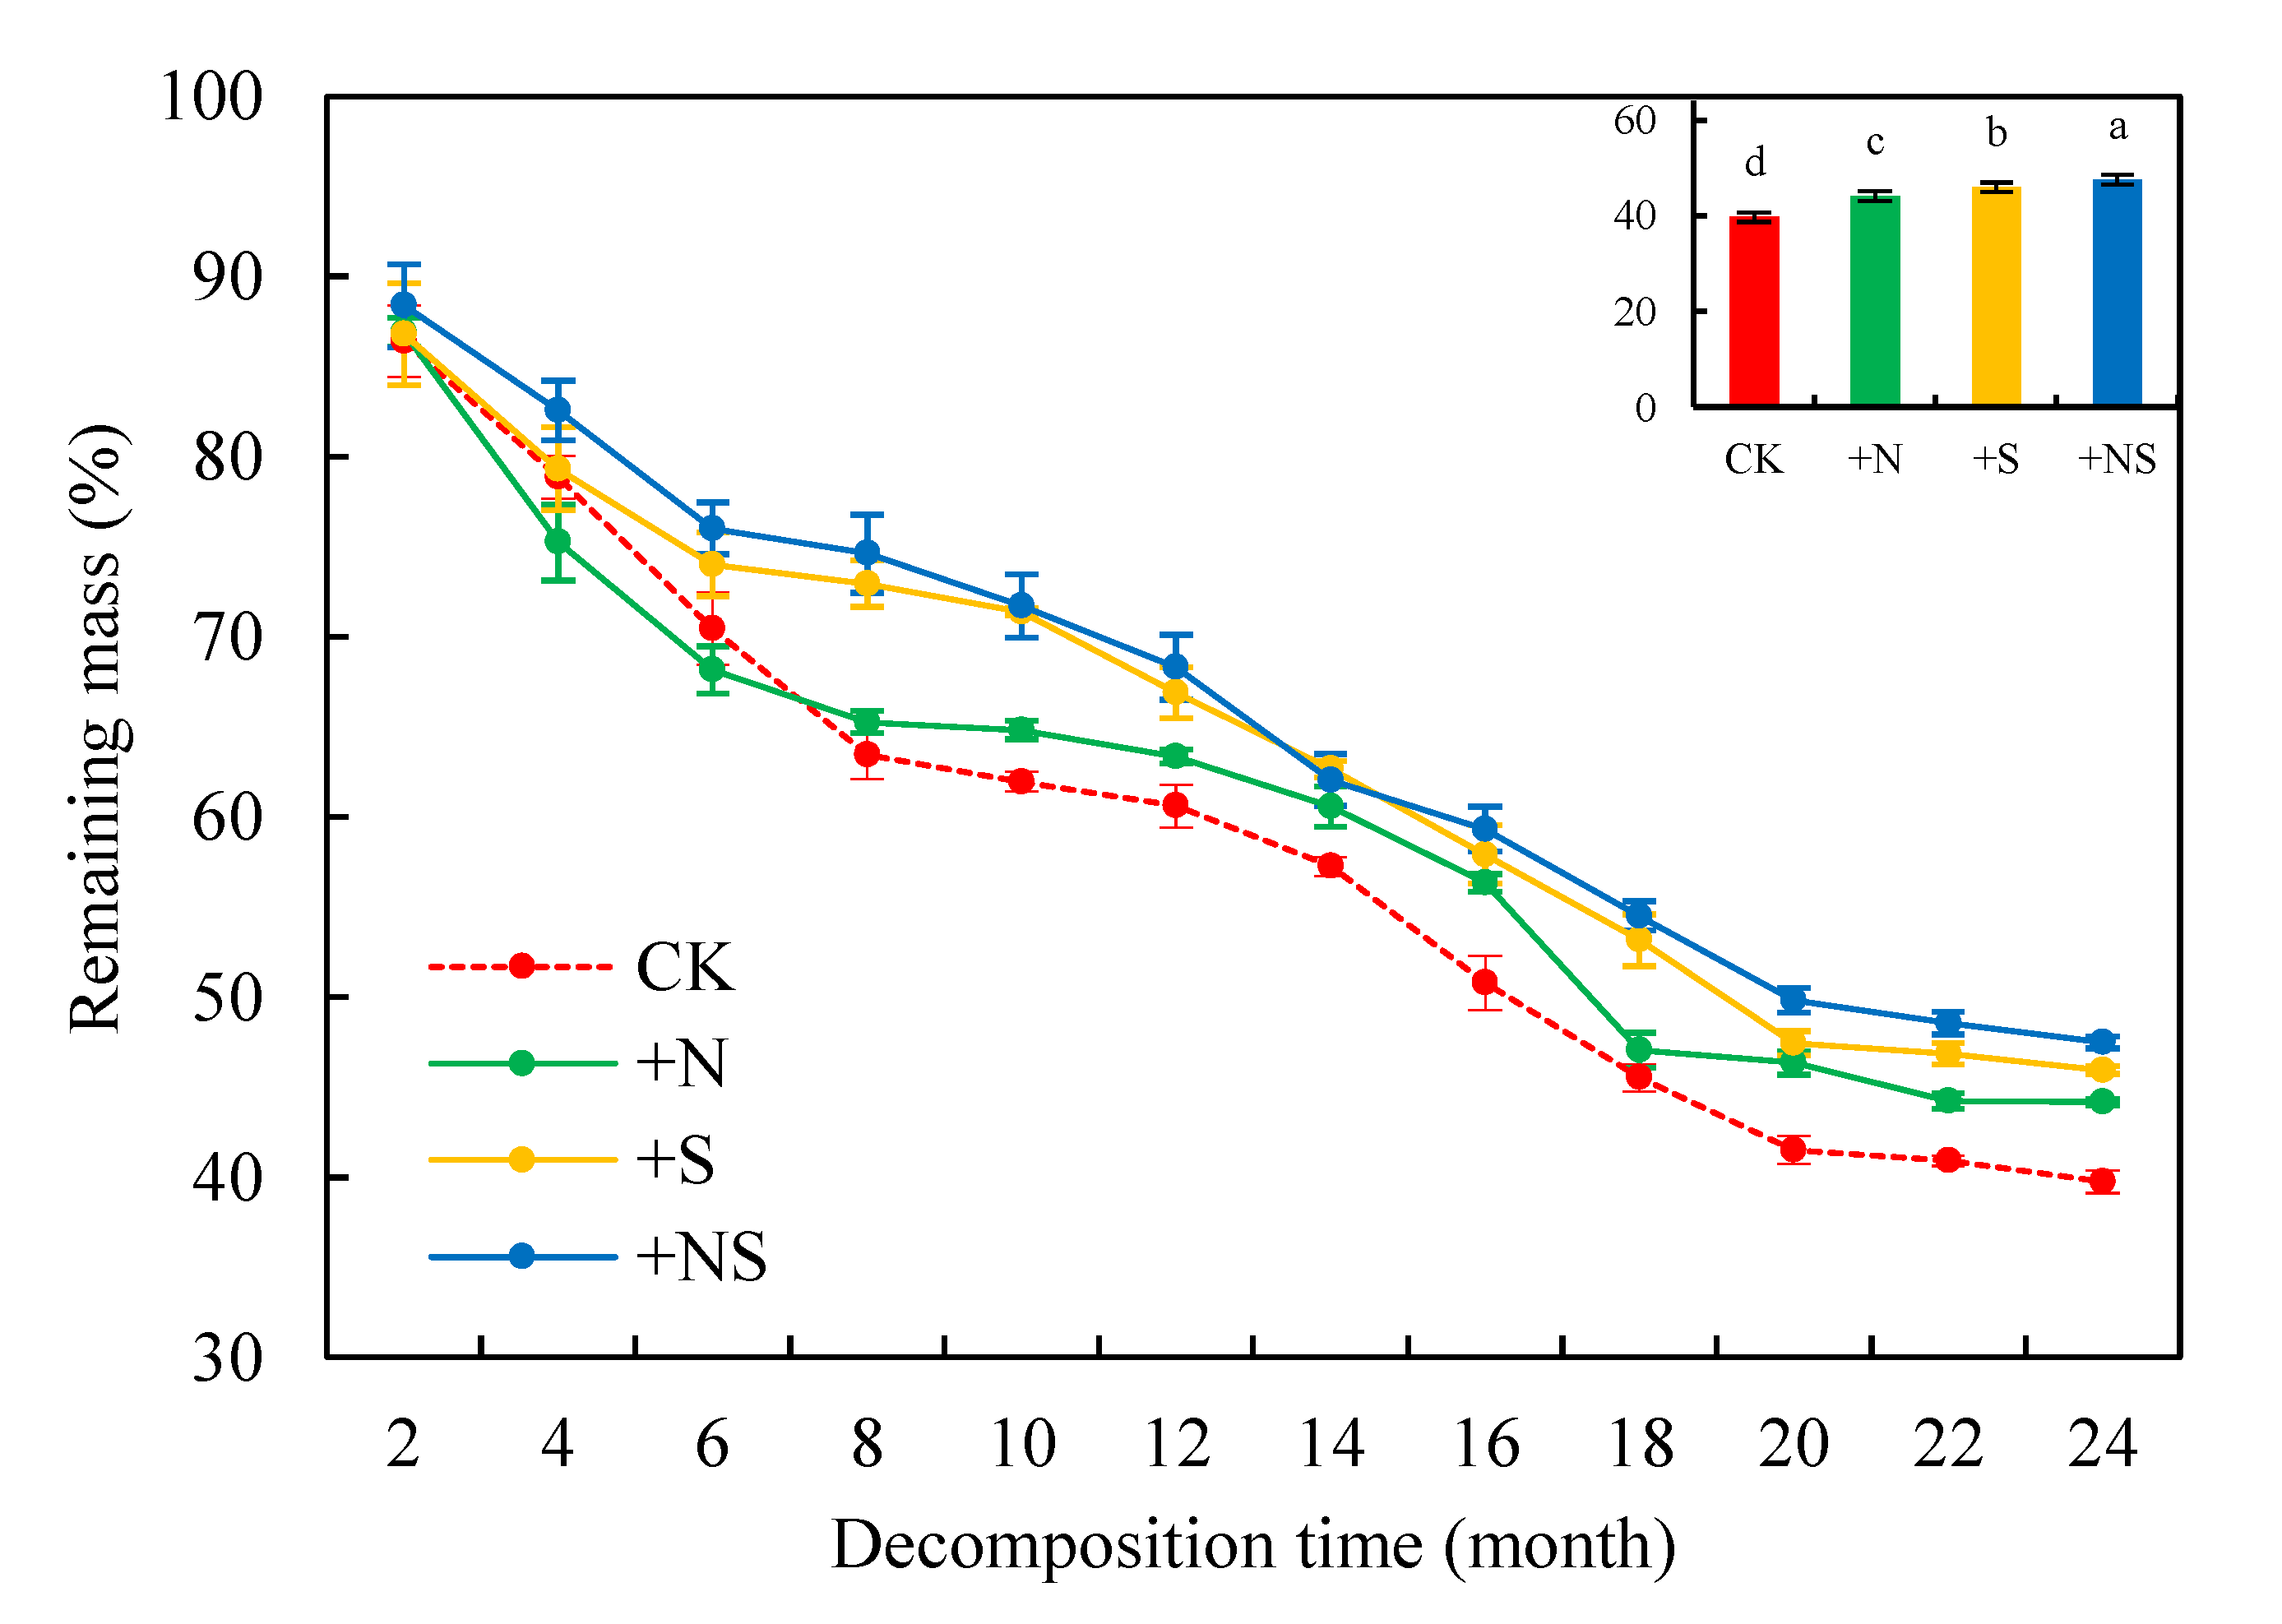
3.1. Remaining Litter Mass and Decomposition Coefficient

The litter mass loss gradually decreased with the decomposition time (Figure 2). At the end of this experiment (24th month of decomposition), the remaining mass was 11.1%, 15.6%, and 19.5% significantly higher in the +N, +S, and +NS treatments than in CK (39.8% ± 0.65% of the initial amount; p < 0.05; histogram in Figure 2), respectively. Additionally, the main effects of N addition, S addition, sampling time, and the interactive effects of N addition × sampling time, S addition × sampling time, and N addition × S addition × sampling time on the remaining litter mass during the study period were significant (Table S1). The +N, +S, and +NS treatments decreased the k-values (p < 0.05; Table 1). The T50% values in the +N (1.804 ± 0.007 year), +S (1.832 ± 0.010 year), and +NS (1.854 ± 0.006 year) treatments were higher than those in the CK (1.535 ± 0.015 year; p < 0.05) treatment. Moreover, the k-value was lower (p < 0.05) whereas the T50% was higher (p < 0.05) in the +NS treatment than in the +N and +S treatments. These results highlight that the addition of N and S decreased the rate of litter decomposition.

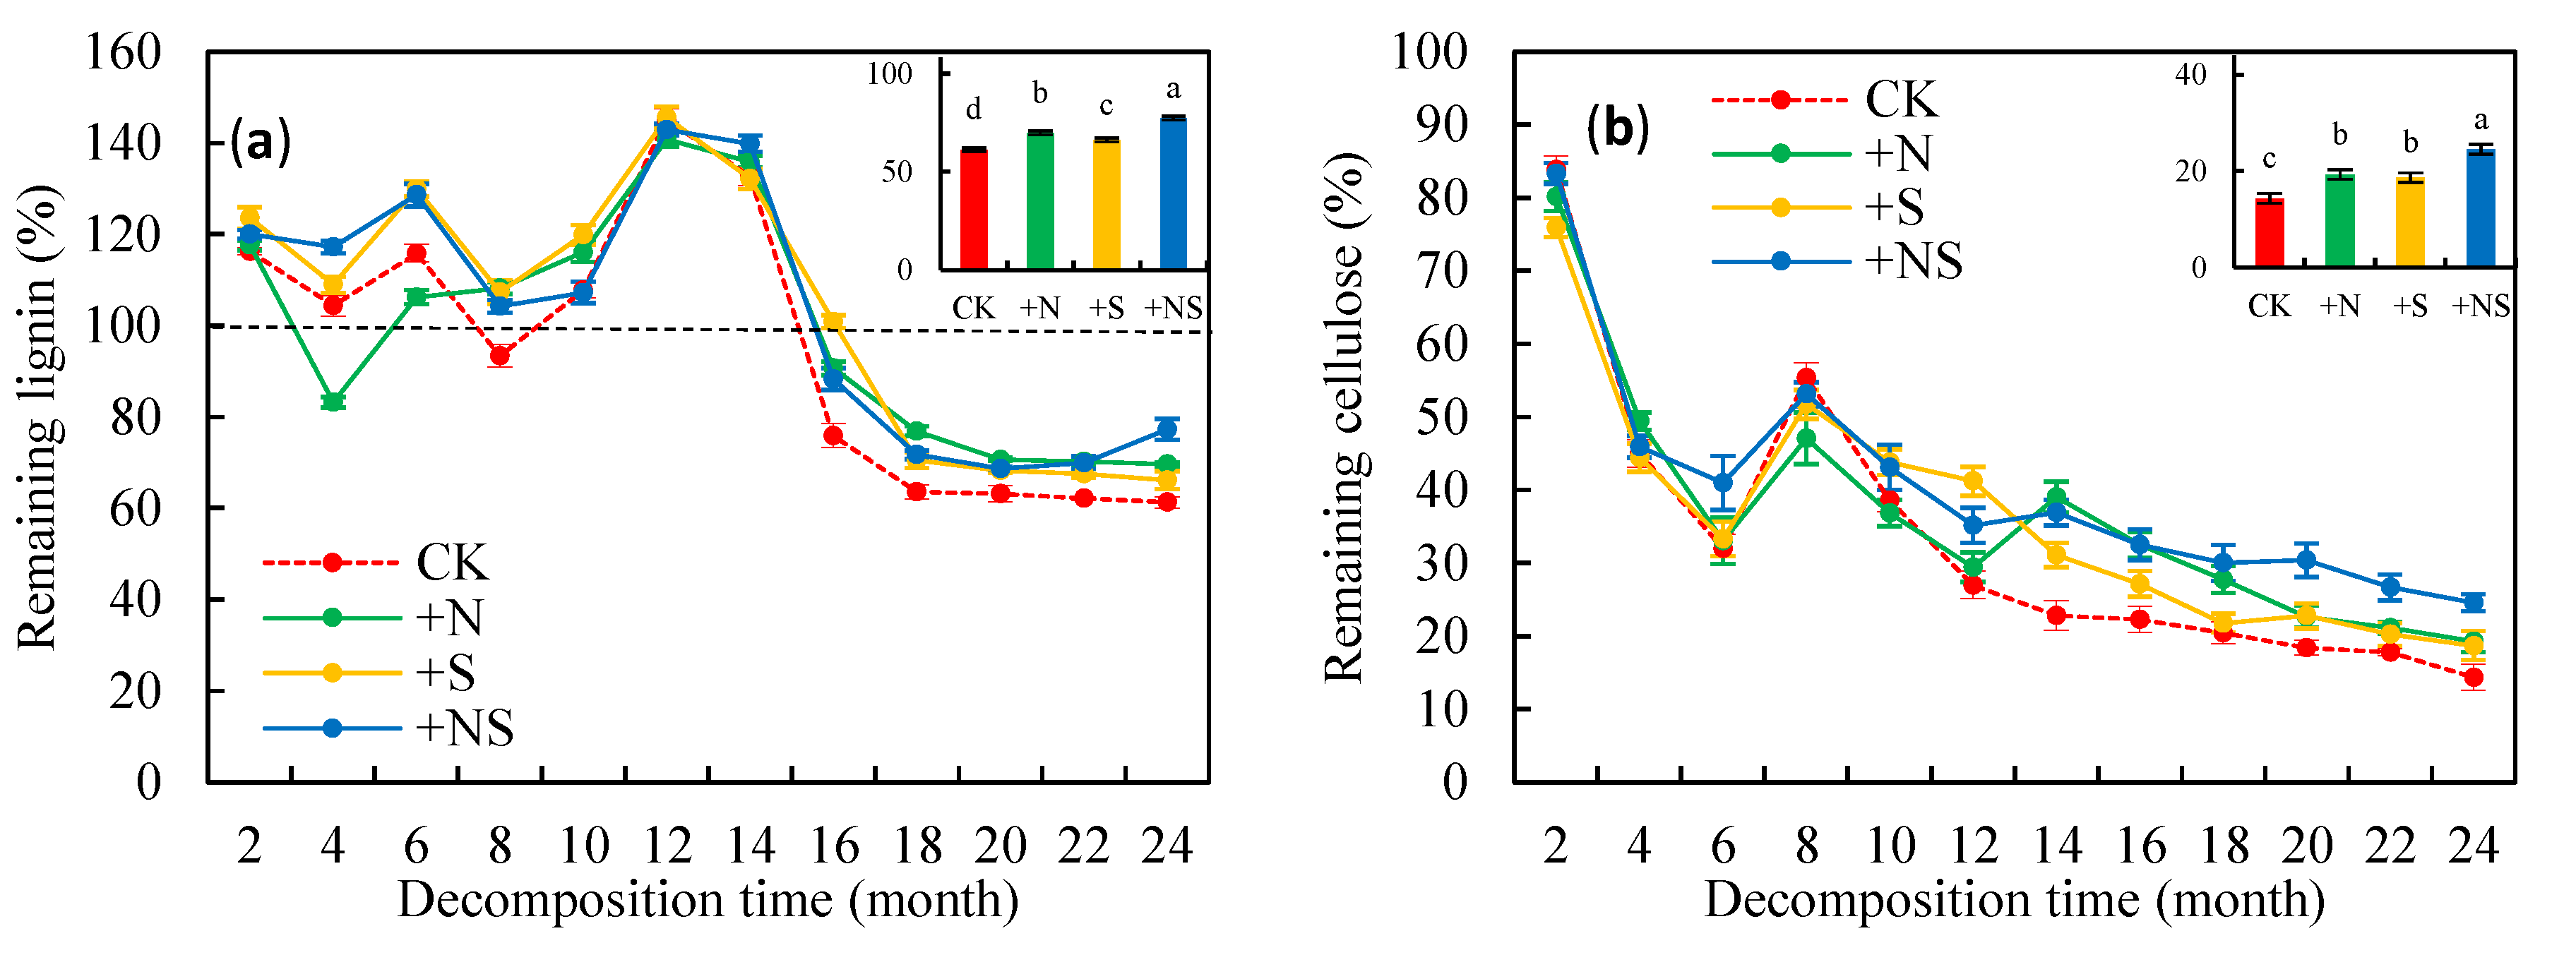
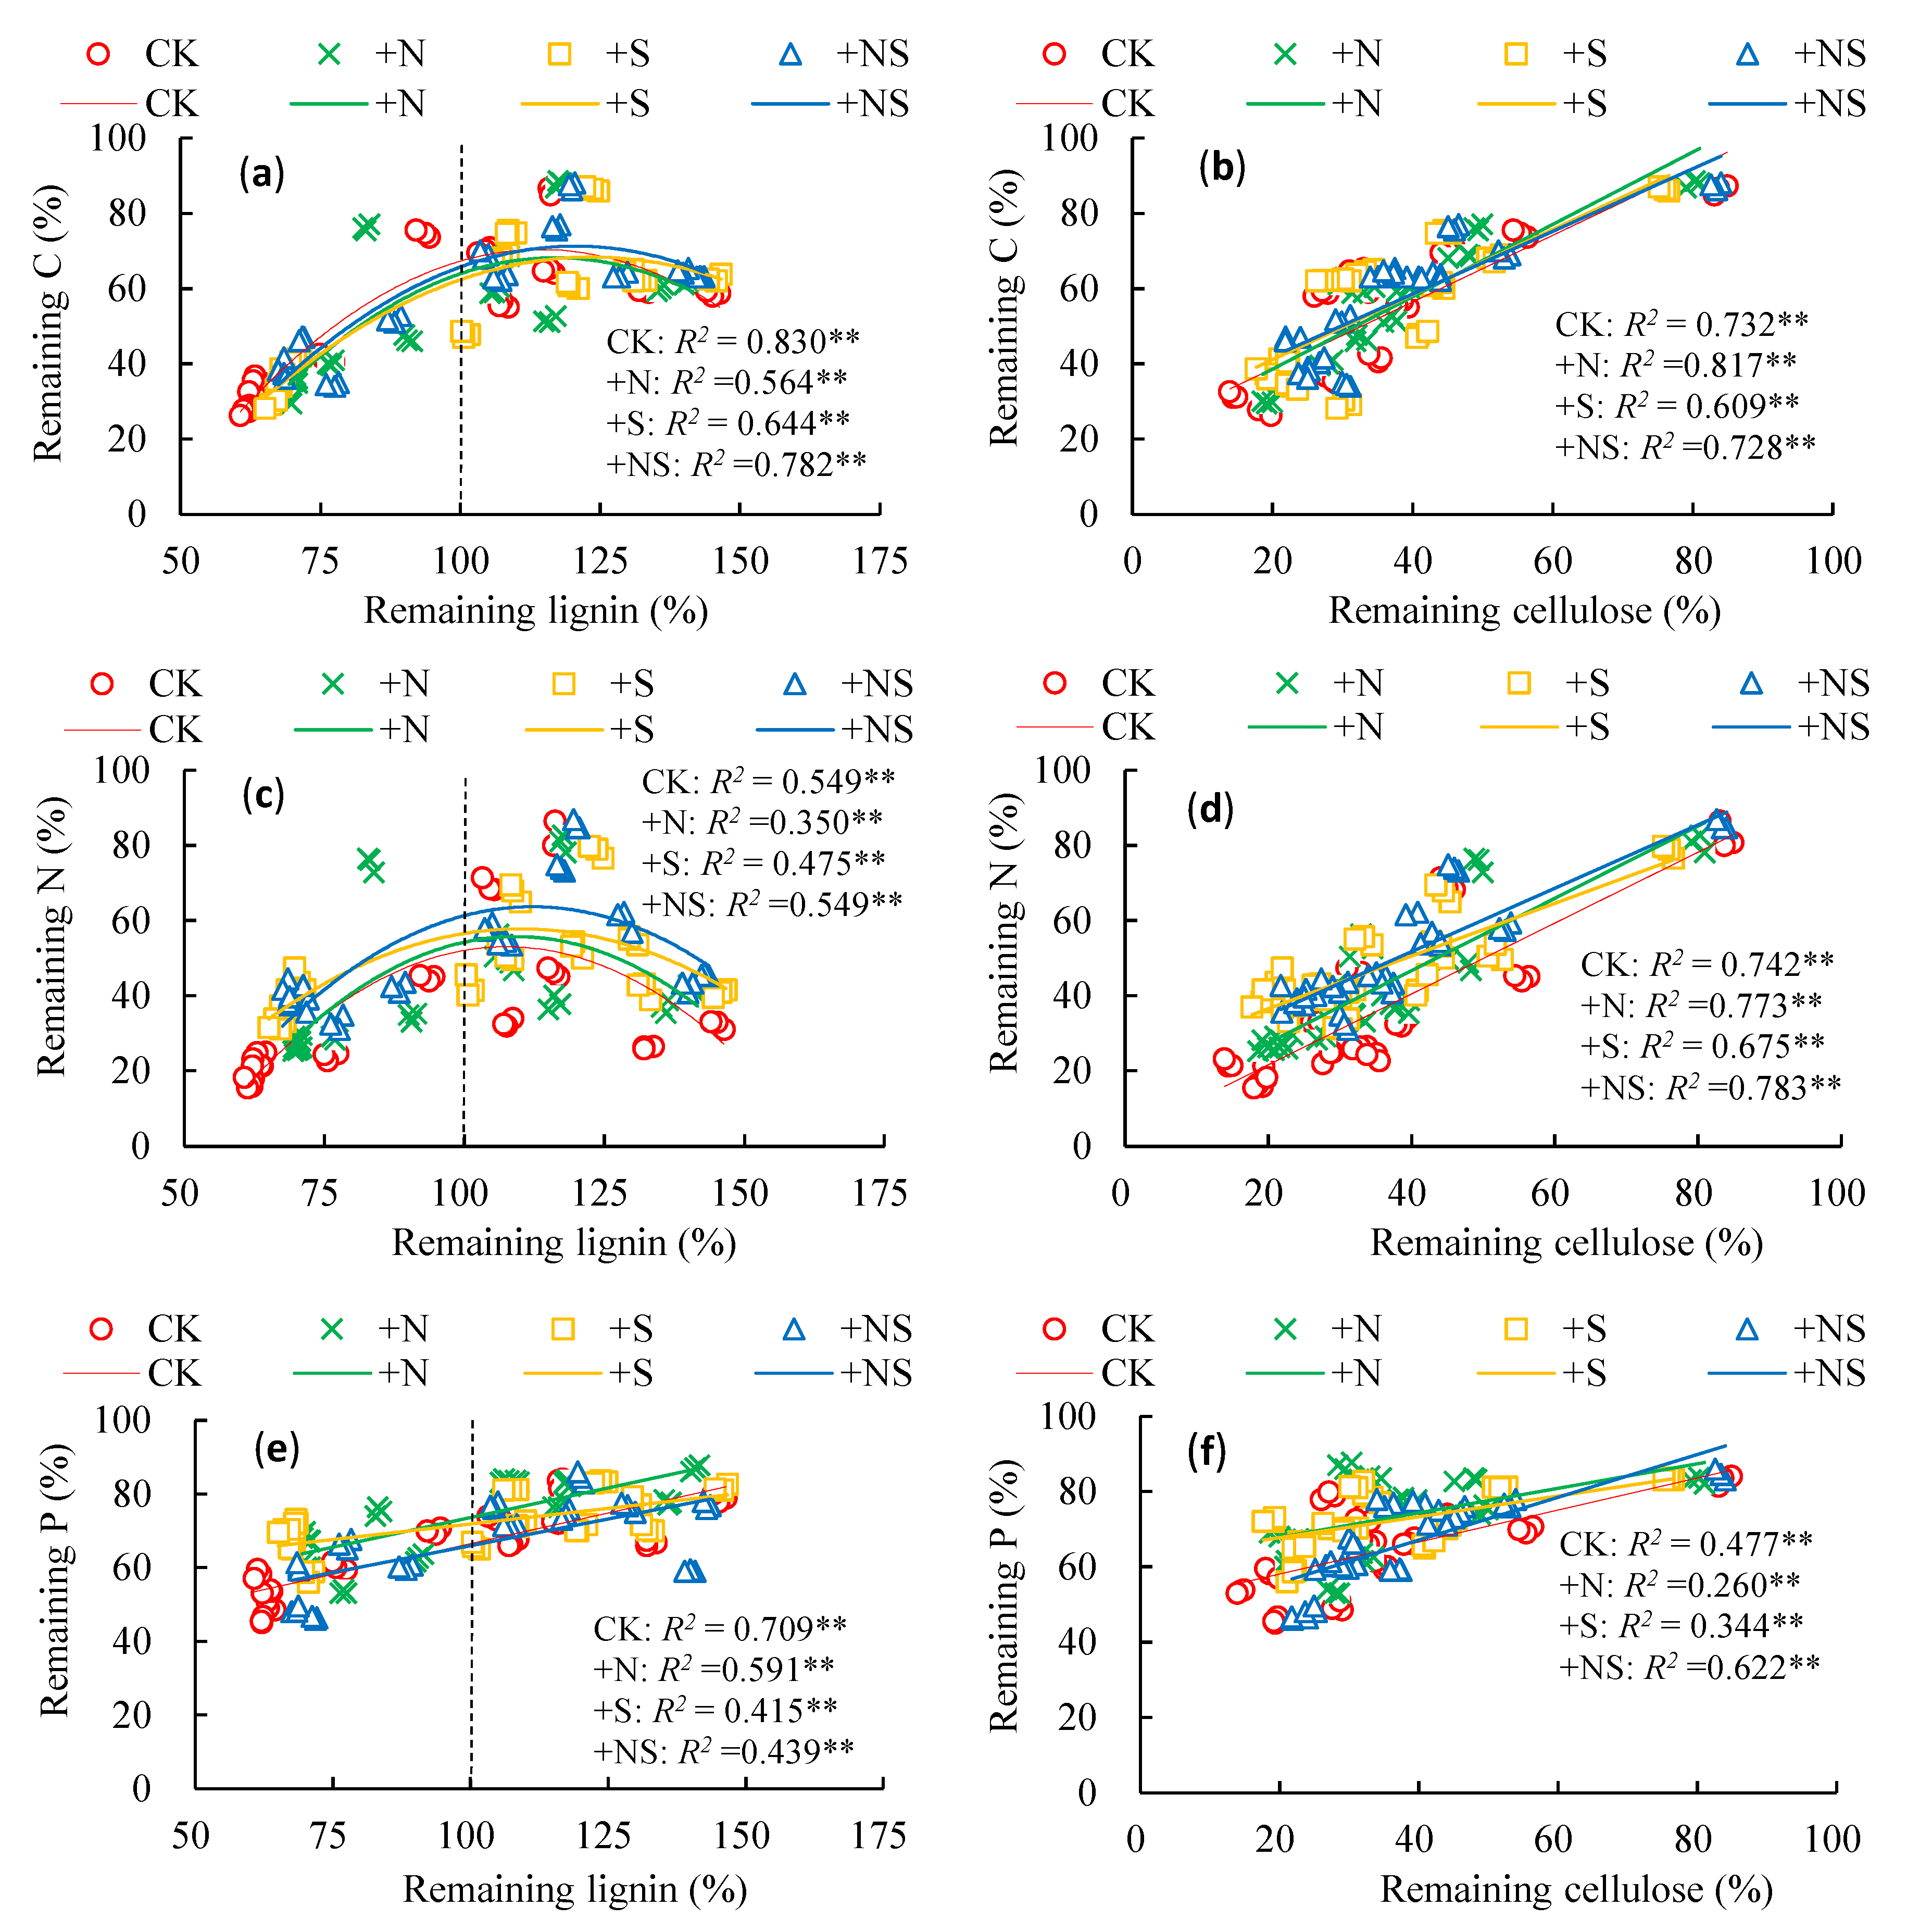
3.2. Remaining Litter Lignin and Cellulose

Across all treatments, the lignin was accumulated in the early stage (<16 months) of decomposition and then released (>16 months) (Figure 3a), and the cellulose was gradually degraded with decomposition time (Figure 3b). At the end of this experiment (24th month of decomposition), the remaining lignin was 13.5%, 7.9%, and 26.2% significantly higher and the remaining cellulose was 34.4%, 30.1%, and 70.9% significantly higher in the +N, +S, and +NS treatments than in CK (remaining lignin and cellulose were 61.3% ± 1.20% and 14.4% ± 1.82% of the initial amount, respectively; p < 0.05; histograms in Figure 3a,b), respectively. The remaining lignin and cellulose were significantly higher in the +NS treatment than in the treatments with the addition of N and S alone (p < 0.05). Furthermore, the main effects of N addition, S addition, and their interaction on the remaining lignin and cellulose during the study period were significant (p < 0.05; Table S1). These results indicate that the addition of N and S synergistically inhibited the degradation of lignin and cellulose.

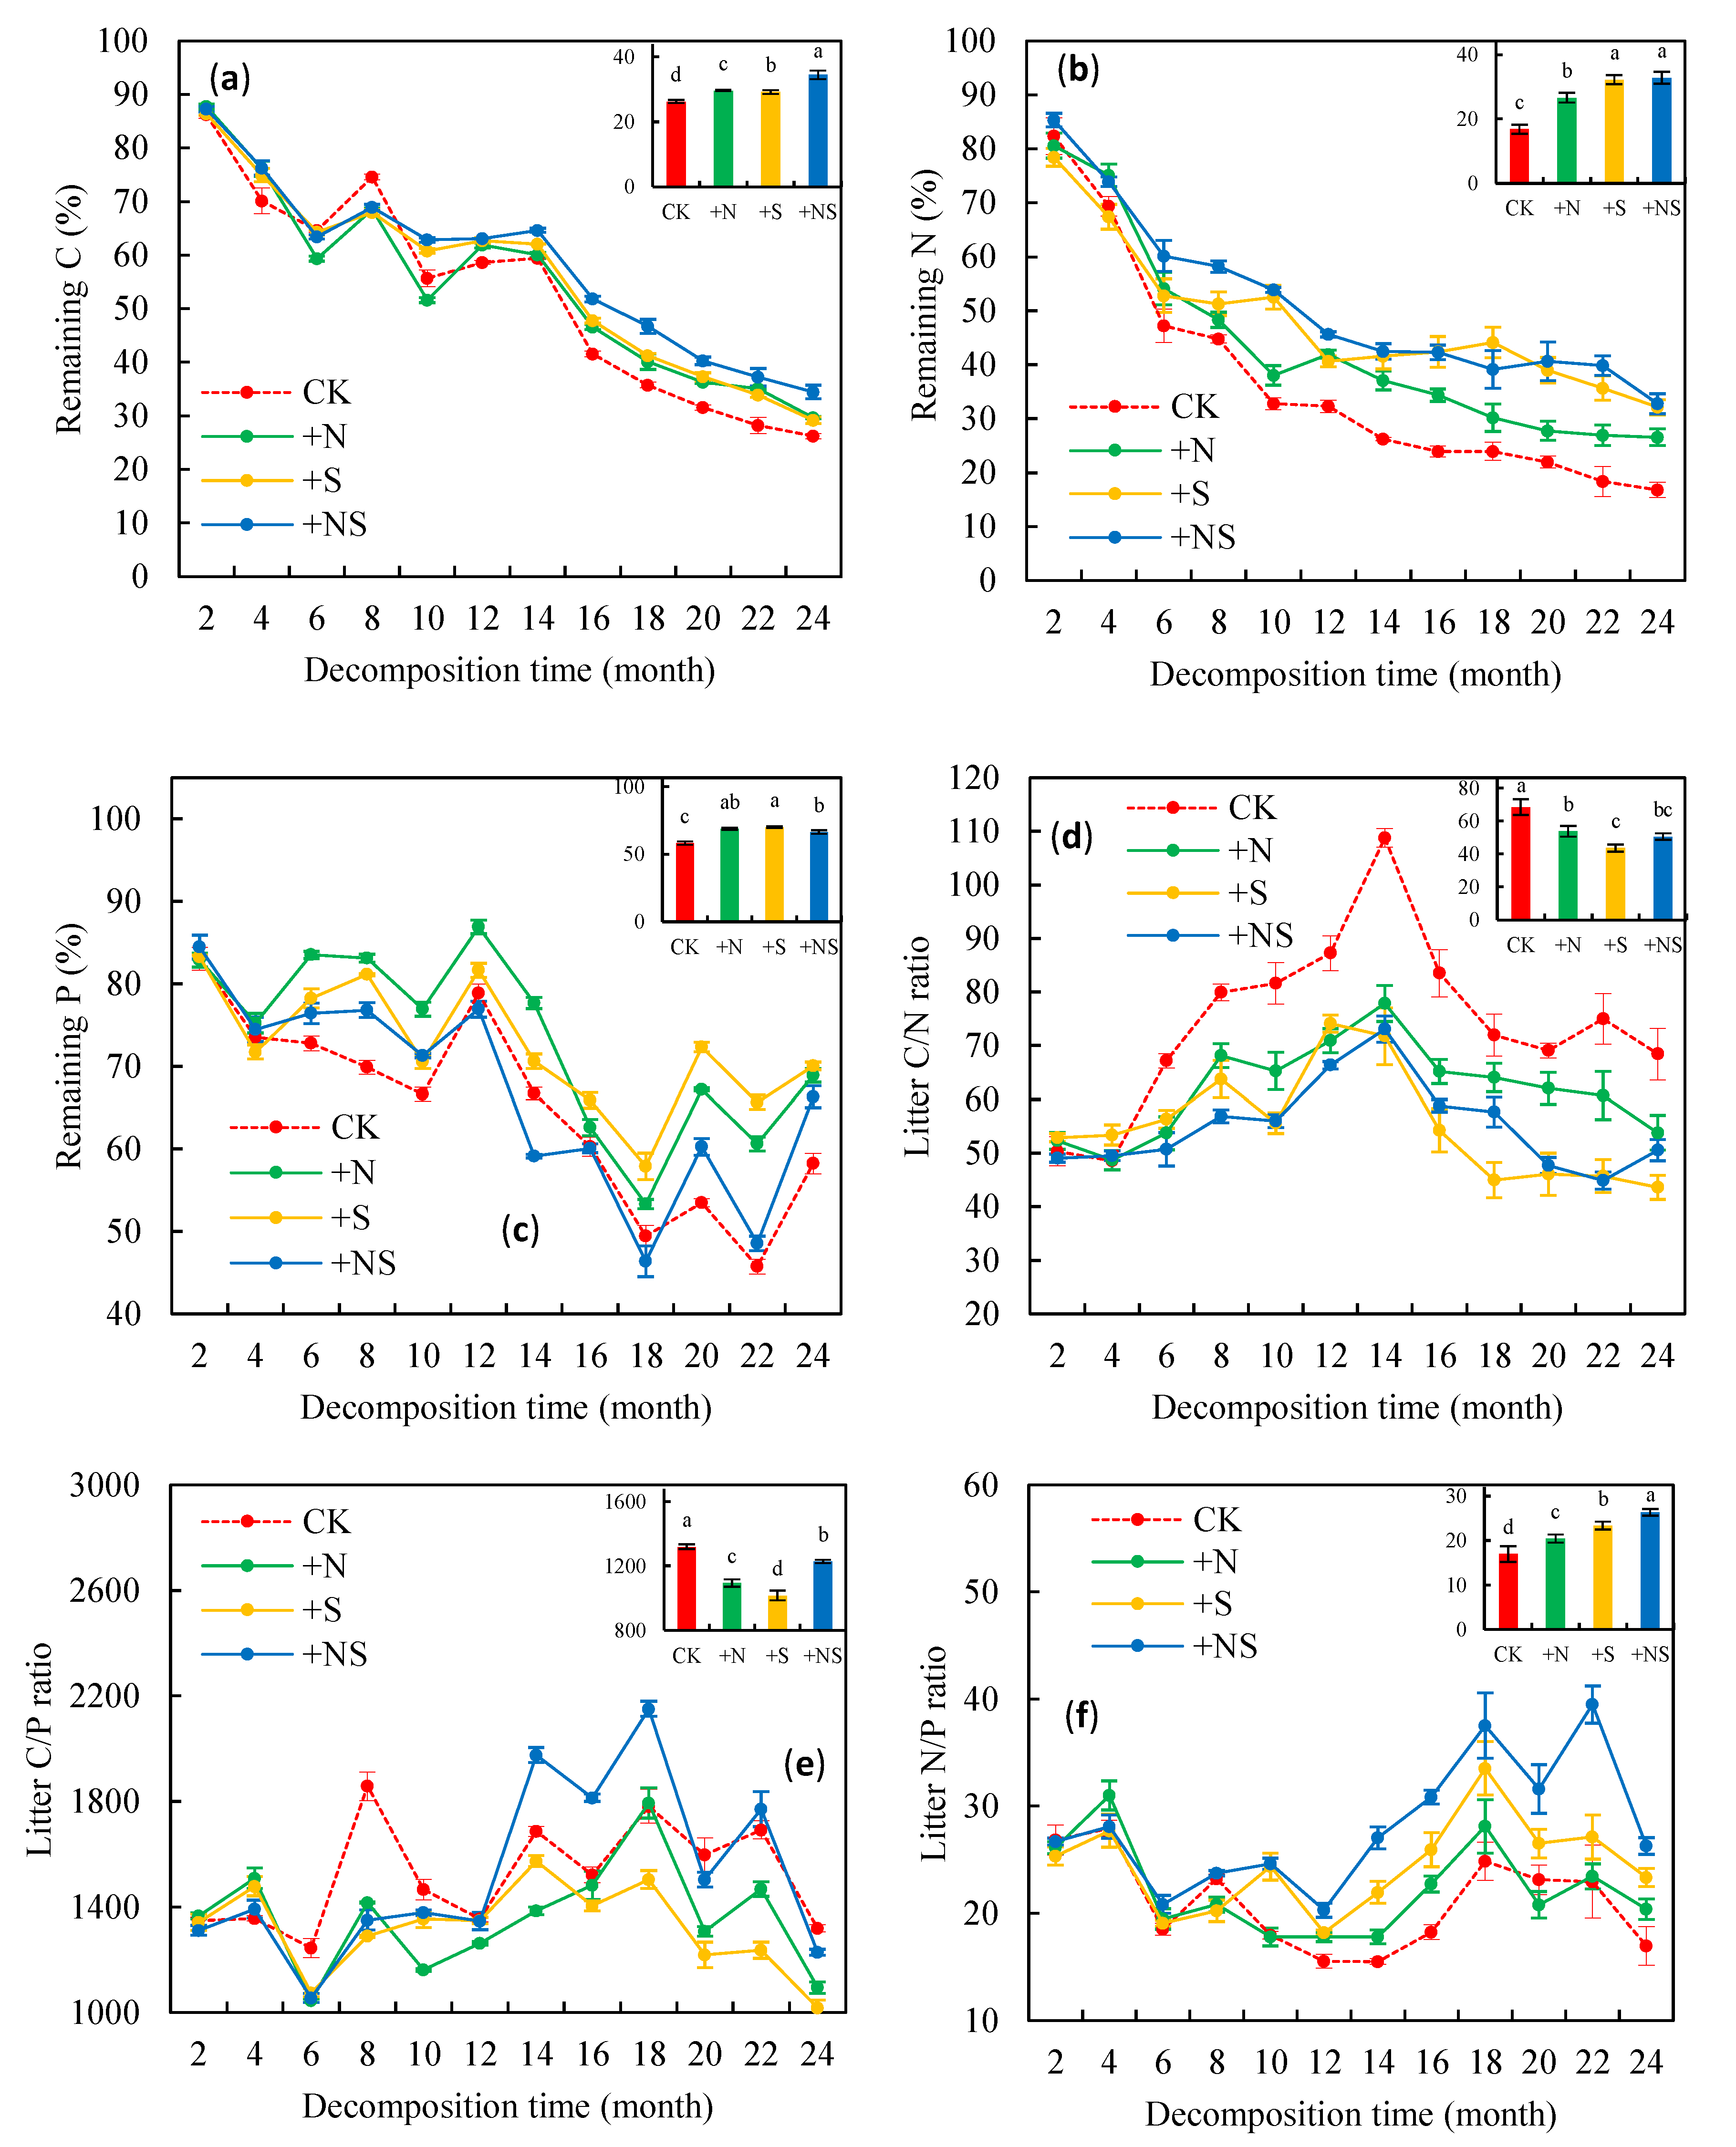
3.3. Remaining Nutrients in Litter

The C, N, and P tended to be gradually released from litter throughout the decomposition time (Figure 4a–c). The amounts of C and N remaining in the litter were significantly higher in the +N, +S, and +NS treatments than in CK at the end of this experiment (p < 0.05; histograms in Figure 4a,b). Moreover, the remaining litter C was significantly greater in the +NS treatment than in the treatments with the addition of N and S alone (p < 0.05). The remaining litter N was slightly higher in the +NS treatment than in the treatments with the addition of N and S alone (p > 0.05). The main effects of N addition, S addition, sampling time, and their interaction on the C, N, and P remaining in the litter during the study period were significant (p < 0.05; Table S1). Therefore, the addition treatments suppressed the release of C, N, and P from litter, and the addition of N and S synergistically reduced the release of C and N.

3.4. Litter Stoichiometry Ratios and Soil pH

The litter stoichiometry ratios fluctuated greatly with the decomposition time (Figure 4d–f). The litter C/N and C/P ratios were lower, whereas the litter N/P ratio was higher in the addition treatments than in CK at the end of this experiment (p < 0.05; histograms in Figure 4d–f). The litter N/P ratio was significantly greater in the +NS treatment than in the treatments with the addition of N and S alone (p < 0.05). The main effects of N addition, S addition, sampling time, and their interactive effects on the litter N/P ratio during the study period were significant (p < 0.01; Table S2). Therefore, the addition of N and S synergistically increased the litter N/P ratio.
At the end of this experiment, the main effects of N addition, S addition, and their interactive effects on the soil pH were significant (p < 0.05; Table S3). The addition of N and S treatments decreased soil pH at the end of the study (p < 0.05), and the decrease in the +NS treatment was significantly stronger than that in the treatments with the addition of N and S alone (p < 0.05). Consequently, the addition of N and S synergistically decreased the soil pH.

3.5. Release of Nutrient Elements and Degradation of Lignin and Cellulose

The remaining lignin correlated quadratically with the remaining C (R2 = 0.564–0.830; p < 0.01; Figure 5a) and N (R2 = 0.350–0.549; p < 0.01; Figure 5c), and the remaining lignin was positively and linearly related with the remaining P (R2 = 0.415–0.709; p < 0.01; Figure 5e). Furthermore, the remaining cellulose was positively and linearly correlated with the remaining C (R2 = 0.609–0.817; p < 0.01; Figure 5b), N (R2 = 0.675–0.783; p < 0.01; Figure 5d), and P (R2 = 0.260–0.622; p < 0.01; Figure 5f).

4. Discussion

4.1. Rate of Litter Decomposition

The +N treatment decreased the rate of litter decomposition in our study, supporting our first hypothesis that N addition would decrease litter decomposition in the study forest. This result was in agreement with most of the previous studies in subtropical forests [21,28]. This phenomenon can be explained by two mechanisms. First, exogenous N input can decrease the activity of decomposers, thereby slowing litter decomposition [13,41]. The previous studies in evergreen broadleaved forests in the same study area reported that N addition decreased the C and N contents of the soil microbial biomass [27,29,42]; thus, the decrease in soil microbial biomass may contribute to the lower rate of litter decomposition under the +N treatment in the current study. Second, high levels of N input usually slow the decomposition of litter due to soil N enrichment, or even aggravate soil nutrient imbalances [43]. The results of our previous study in the same study forest also showed that added N exacerbated the limitations of soil C and P [30], which may inhibit the decomposition of litter. This inference was further confirmed because our follow-up study in this study area showed that P addition alleviated the limitation of soil P caused by N addition [27]. However, a previous field experiment in the same study area reported that external N input promoted the litter decomposition in a subtropical bamboo forest dominated by Pleioblastus amarus [44], contrary to our result. The addition of N generally accelerates litter decomposition when the initial litter C/N ratio is >55; otherwise (<55), the addition of N inhibits the decomposition [45]. The initial litter C/N ratio in the bamboo ecosystem studied by Tu et al. [44] was >90, whereas in our study forest it was <50; this difference may have caused the differing results between the two studies. Bamboo ecosystems need N fertilizer for the growth of shoots and are commonly N-limited [25,44]. In contrast, N was not limiting and was even saturated in our evergreen broadleaved forest [30]. The difference in nutrient dependence in the two ecosystems may be one reason accounting for the differing results between our study forest and the forest studied by Tu et al. [25]. Taken together, the response of litter mass loss to the input of N may be related not only to the activity of decomposers but also to the nutrient dependence of ecosystems and the initial litter quality.
As expected from the second hypothesis, the +S treatment reduced the rate of litter decomposition, which was consistent with previous studies in subtropical forests [21,46]. The results of our previous study confirmed that the addition of sodium sulfate decreased the activities of soil invertase, cellulase, and polyphenol oxidase in the same study forest [30]. The reduction in the activities of soil C-cycle enzymes can explain the decrease in the mass loss [46,47,48]. However, Wang et al. [22] reported that ten years of sodium sulfate addition increased the mass loss in a temperate broadleaved forest (Populus tremuloides and Picea glauca). Moreover, Jung et al. [4] reported that seven years of sodium sulfate addition did not significantly affect the mass loss in a boreal mixedwood forest (P. tremuloides and P. glauca). First, the large differences in fertilization time may cause the different results obtained in our study (two years), the study (ten years) of Wang et al. [22] and the study (seven years) of Jung et al. [4]. Second, the forest types in the sites studied by Wang et al. [22] (a temperate broadleaved forest) and Jung et al. [4] (a boreal mixedwood forest) differed greatly from those in our study site (a subtropical evergreen broadleaved forest), which may explain the distinct responses. Thus, the effect of S addition on the litter mass loss may be correlated with the fertilization time, as well as the ecosystem type.

4.2. Degradation of Cellulose and Lignin

Litter stoichiometry generally controls litter decomposition [32,49], and the stoichiometry is constantly changing during decomposition [17,43]. Nutrient element stoichiometric ratios during decomposition can thus also control subsequent decomposition and degradation of cellulose and lignin [43,50]. In our study, the addition of N and S slowed the degradation of cellulose and lignin, which was in agreement with a previous study of a subtropical forest [33]. This response may be linked to the decreased C/N ratio, as well as the increased N/P ratio, under the addition treatments. On the one hand, the decreased C/N ratio can reduce the fungi-to-bacteria ratio due to the increased proportion of opportunistic bacteria in the microbial communities [11]. Moreover, fungi are more efficient than bacteria at degrading organic C in litter [51,52]. The decreased litter C/N ratio under the +N, +S, and +NS treatments in the present experiment strongly demonstrated that N and S fertilization treatments were likely to decrease the fungi-to-bacteria ratio, thereby inhibiting the degradation of cellulose and lignin [33]. On the other hand, P is usually a major limiting element for microbial activity in subtropical forests due to the combination of P with aluminum and iron ions to form complexes in strongly weathered soils [53,54]. Increased N/P ratios are generally considered to exacerbate P limitation in microorganisms in N-rich forests [54]. Our study showed that the +N, +S, and +NS treatments enhanced the litter N/P ratio during litter decomposition, strongly suggesting that these treatments may have exacerbated microbial P limitation, reducing the degradation of cellulose and lignin. Additionally, the reformation of aromatic polymers may be another factor accounting for the slowed lignin degradation due to the addition treatments. Laccases secreted by fungi can promote the reformation of aromatic polymers (an AUR) by the generation of phenoxyl radicals [35,55,56]. The activity of fungi is susceptible to the inputs of external nutrients [57,58]. Therefore, the additions of N and S can alter the activity and structure of fungi to regulate the content of lignin. For instance, Xu et al. [33] reported that S and N addition enhanced the amount of aromatic polymers by altering the structure of fungi. In this way, the increased content of aromatic polymers by the addition of N and S may be one of the mechanisms inhibiting the degradation of lignin under the +N, +S, and +NS treatments in our study.
Across all treatments, the lignin was accumulated in the early stage (<16 months). In fact, the results of a study by Berg and McClaugherty [59] showed that the lignin content was directly decreased in litters with >300 mg g−1 initial lignin concentration; otherwise, the content of lignin would increase before an absolute decrease. Subsequent studies have found that in litters with a low initial lignin concentration (<300 mg g−1) the lignin is usually accumulated in the early stage of decomposition because of the increased lignin-like compounds produced by microorganisms [51,60]. In our study, the remaining litter C and N decreased with reduced remaining lignin when the remaining lignin was <100% of the initial amount, but decreased with increasing remaining lignin when the lignin was accumulated (especially when the remaining lignin was >125% of the initial amount) (Figure 5a,c), suggesting that the C and N contents of lignin (or lignin-like compounds) between the non-accumulative and accumulative scenarios may be different. Thus, lignin-like compounds may be produced. Furthermore, the remaining P was positively and linearly correlated with the remaining lignin (Figure 5e), implying that the P content of lignin (or lignin-like compounds) between the non-accumulative and accumulative scenarios is probably not significantly different. Therefore, the P content of the produced lignin-like compounds is likely similar to the P content of the initial lignin. Previous studies reported that the C and N content of initial lignin and produced lignin-like compounds are different, but comparison of the P content between them has not been reported [51,56]. The P content of initial lignin and produced lignin-like compounds, however, needs further study.

4.3. Release of C, N, and P from Litter

The +N treatment reduced the release of C, N, and P. This result supports our first hypothesis that N addition would decrease the release of C, N, and P from litter in this study forest. Two potential mechanisms may explain this decrease. The addition of urea generally slows the release of these elements due to the direct increase in external C and N nutrients [17,61]. Furthermore, the microbial nutrient mining theory posits that the release of nutrients is stimulated by microorganisms to meet their demands for growth and reproduction when the nutrient contents in the environment are low, but the microorganisms do not need to decompose litter to meet their nutrient demands when nutrient levels are adequate in the background [11]. Urea addition can increase nutrient availability in the ecosystem [62], which may have reduced microbial nutrient mining, resulting in a lower release of nutrients. However, a study reported that the addition of N accelerated the C and N release in N-poor leaf litters [63]. Therefore, the addition of N may work together with the initial litter N content to affect the release of nutrient elements from litter.
The addition of S slowed the release of C, N, and P from litter in this study forest, similar to a previous study in a subtropical forest [46]. Soil acidification can negatively affect nutrient element releases by reducing decomposer activity [33,46]. The S addition treatments exacerbated soil acidification (decreased soil pH), which may have resulted in the slower release of nutrients in the present study.
In this study, the remaining nutrient elements positively and linearly correlated with the remaining cellulose, highlighting that the remaining cellulose was a predictor for the release of C, N, and P. Furthermore, the difference in the remaining nutrient elements between fertilization treatments and the control increased with time (Figure 4a–c), suggesting that the addition of N and S may have cumulative effects on nutrient release [43]. Consequently, medium- and long-term N and S addition is likely to further inhibit the C, N, and P releases of litter in this forest.

4.4. Interactive Effects of the Addition of N and S

In our study, the addition of N and S synergistically slowed the degradation of lignin and cellulose and the release of C and N, supporting our third hypothesis. This phenomenon may correspond with the lower soil pH and higher litter N/P ratio in the N and S combined-addition treatment than in the separate-addition treatments. As discussed above, soil acidification usually decreases decomposer activity [33,46]. The N and S combined-addition treatment thus can more strongly decrease the decomposer activity because the pH was lower than it was in the N and S separate-addition treatments. Moreover, the additions of N and S synergistically increased the litter N/P ratio, suggesting that the input of these two elements may have synergistically aggravated P limitation during litter decomposition, thereby lowering the degradation of cellulose and the release of C and N. A study in the same study forest also found that the addition of N and S synergistically increased the soil N/P ratio [30], further highlighting that the added N and S synergistically aggravated P limitation in this forest.
Interestingly, the decrease in the litter mass loss and the release of C and N were stronger in the +S treatment than those in the +N treatment, indicating that the addition of S may be more critical than the addition of N in influencing litter decomposition and nutrient release in this forest. Therefore, we should focus not only on the responses of litter decomposition to the input of external N but also the input of external S in subtropical evergreen broadleaved forests in southern China.

5. Conclusions

The addition of N and S suppressed litter decomposition and the release of C, N, and P from litter in this study forest, which was related to a decreased soil pH and litter C/N ratio and an increased litter N/P ratio. The addition of N and S synergistically decreased the release of C and N, suggesting that S deposition may have exacerbated the negative effect of N deposition on the release of C and N in this forest area. Moreover, the addition of N and S synergistically increased the litter N/P ratio and thus may have synergistically exacerbated litter P limitation during decomposition. These results highlight that if N and S deposition rates continue rising in southern China, the rate of litter decomposition and the release of C, N, and P in subtropical evergreen broadleaved forests in this area will decrease.

Supplementary Materials

The following are available online at https://www.mdpi.com/1999-4907/11/12/1280/s1, Table S1: F- and p-values of linear mixed-effects model analysis focusing on the effects of nitrogen (N) and sulfur (S) addition on remaining mass, remaining lignin, and remaining cellulose, Table S2: F- and p-values of linear mixed-effects model analysis focusing on the effects of nitrogen (N) and sulfur (S) addition on remaining carbon (C), remaining N, and remaining phosphorus (P), litter C/N ratio, litter C/P ratio, and litter N/P ratio, Table S3: The soil pH under different treatments. Values are the averages of three plot replicates ± standard deviations. Different lowercase letters denote significant differences between different treatments at each sampling time based on ANOVA (p < 0.05; Fisher’s LSD test adjusted using the Bonferroni correction). CK, no added N or S; +N, added N but no added S; +S, added S but no added N; and +NS, added N and S.

Author Contributions

Data curation, R.F., S.Z. (Shibin Zhang), and C.H.; formal analysis, R.F. and S.Z. (Shibin Zhang); funding acquisition, C.H.; project administration, C.H.; software, L.T.; writing—original draft, L.T., J.P., J.S., and C.H.; writing—review and editing, L.T., J.P., J.S., S.Z. (Shixing Zhou), J.H., and C.H. All authors have read and agreed to the published version of the manuscript.

Funding

This research was funded by the Crop Breeding Research Project of the ‘12th Five-year Plan’ of Sichuan Province [2011NZ0098-10], the Sci-tech Project of the ‘12th Five-year Plan’ of China [2010BACO1A11], the IMBALANCE-P Grant of European Research Council Synergy [ERC-SyG-2013-610028], and the China Scholarship Council [201906910006].

Acknowledgments

The authors thank Wenyu Bai for providing data analysis assistance.

Conflicts of Interest

The authors declare no conflict of interest.

References

  1. Tan, J.; Fu, J.S.; Dentener, F.; Jian, S.; Keating, T. Multi-model study of HTAP II on sulfur and nitrogen deposition. Atmos. Chem. Phys. 2018, 18, 6847–6866. [Google Scholar] [CrossRef] [Green Version]
  2. Duan, L.; Yu, Q.; Zhang, Q.; Wang, Z.; Pan, Y.; Larssen, T.; Tang, J.; Mulder, J. Acid deposition in Asia: Emissions, deposition, and ecosystem effects. Atmos. Environ. 2016, 146, 55–69. [Google Scholar] [CrossRef] [Green Version]
  3. Gao, Y.; Ma, M.; Yang, T.; Chen, W.; Yang, T. Global atmospheric sulfur deposition and associated impaction on nitrogen cycling in ecosystems. J. Clean. Prod. 2018, 195, 1–9. [Google Scholar] [CrossRef]
  4. Jung, K.; Kwak, J.-H.; Gilliam, F.S.; Chang, S.X. Simulated N and S deposition affected soil chemistry and understory plant communities in a boreal forest in western Canada. J. Plant Ecol. 2017, 11, 511–523. [Google Scholar] [CrossRef] [Green Version]
  5. Adrian, W.J. A comparison of a wet pressure digestion method with other commonly used wet and dry-ashing methods. Analyst 1973, 98, 213–216. [Google Scholar] [CrossRef]
  6. Du, E.; de Vries, W.; Liu, X.; Fang, J.; Galloway, J.N.; Jiang, Y. Spatial boundary of urban ‘acid islands’ in southern China. Sci. Rep. 2015, 5, 12625. [Google Scholar] [CrossRef] [Green Version]
  7. Lu, Z.; Zhang, Q.; Streets, D.G. Sulfur dioxide and primary carbonaceous aerosol emissions in China and India, 1996–2010. Atmos. Chem. Phys. 2011, 11, 9839–9864. [Google Scholar] [CrossRef] [Green Version]
  8. Frouz, J. Effects of soil macro- and mesofauna on litter decomposition and soil organic matter stabilization. Geoderma 2018, 332, 161–172. [Google Scholar] [CrossRef]
  9. Yarwood, S.A. The role of wetland microorganisms in plant-litter decomposition and soil organic matter formation: A critical review. FEMS Microbiol. Ecol. 2018, 94. [Google Scholar] [CrossRef] [Green Version]
  10. Sardans, J.; Peñuelas, J. The role of plants in the effects of global change on nutrient availability and stoichiometry in the plant-soil system. Plant Physiol. 2012, 160, 1741–1761. [Google Scholar] [CrossRef] [Green Version]
  11. Craine, J.M.; Morrow, C.; Fierer, N. Microbial nitrogen limitation increases decomposition. Ecology 2007, 88, 2105–2113. [Google Scholar] [CrossRef] [PubMed]
  12. Corrales, A.; Turner, B.L.; Tedersoo, L.; Anslan, S.; Dalling, J.W. Nitrogen addition alters ectomycorrhizal fungal communities and soil enzyme activities in a tropical montane forest. Fungal Ecol. 2017, 27, 14–23. [Google Scholar] [CrossRef]
  13. Xiao, S.; Wang, G.G.; Tang, C.; Fang, H.; Duan, J.; Yu, X. Effects of one-year simulated nitrogen and acid deposition on soil respiration in a subtropical plantation in China. Forests 2020, 11, 235. [Google Scholar] [CrossRef] [Green Version]
  14. Janssens, I.A.; Dieleman, W.; Luyssaert, S.; Subke, J.A.; Reichstein, M.; Ceulemans, R.; Ciais, P.; Dolman, A.J.; Grace, J.; Matteucci, G.; et al. Reduction of forest soil respiration in response to nitrogen deposition. Nat. Geosci. 2010, 3, 315–322. [Google Scholar] [CrossRef]
  15. Peñuelas, J.; Sardans, J.; Rivas-Ubach, A.; Janssens, I.A. The human-induced imbalance between C, N and P in earth’s life system. Global Change Biol. 2012, 18, 3–6. [Google Scholar] [CrossRef]
  16. Sardans, J.; Rivas-Ubach, A.; Peñuelas, J. The C:N:P stoichiometry of organisms and ecosystems in a changing world: A review and perspectives. Perspect. Plant Ecol. Evol. Syst. 2012, 14, 33–47. [Google Scholar] [CrossRef]
  17. Manning, P.; Saunders, M.; Bardgett, R.D.; Bonkowski, M.; Bradford, M.A.; Ellis, R.J.; Kandeler, E.; Marhan, S.; Tscherko, D. Direct and indirect effects of nitrogen deposition on litter decomposition. Soil Biol. Biochem. 2008, 40, 688–698. [Google Scholar] [CrossRef]
  18. Zhuang, L.; Liu, Q.; Liang, Z.; You, C.; Tan, B.; Zhang, L.; Yin, R.; Yang, K.; Bol, R.; Xu, Z. Nitrogen additions retard nutrient release from two contrasting foliar litters in a subtropical forest, southwest China. Forests 2020, 11, 377. [Google Scholar] [CrossRef] [Green Version]
  19. Mo, J.; Brown, S.; Xue, J.; Fang, Y.; Li, Z. Response of litter decomposition to simulated N deposition in disturbed, rehabilitated and mature forests in subtropical China. Plant Soil 2006, 282, 135–151. [Google Scholar] [CrossRef]
  20. Bejarano, M.; Crosby, M.M.; Parra, V.; Etchevers, J.D.; Campo, J. Precipitation regime and nitrogen addition effects on leaf litter decomposition in tropical dry forests. Biotropica 2014, 46, 415–424. [Google Scholar] [CrossRef]
  21. Lv, Y.; Wang, C.Y.; Jia, Y.Y.; Wang, W.W.; Ma, X.; Du, J.J.; Pu, G.Z.; Tian, X.J. Effects of sulfuric, nitric, and mixed acid rain on litter decomposition, soil microbial biomass, and enzyme activities in subtropical forests of China. Appl. Soil Ecol. 2014, 79, 1–9. [Google Scholar] [CrossRef]
  22. Wang, Q.; Kwak, J.-H.; Choi, W.-J.; Chang, S.X. Decomposition of trembling aspen leaf litter under long-term nitrogen and sulfur deposition: Effects of litter chemistry and forest floor microbial properties. For. Ecol. Manag. 2018, 412, 53–61. [Google Scholar] [CrossRef]
  23. Singh, R.K.; Dutta, R.K.; Agrawal, M. Litter decomposition and nutrient release in relation to atmospheric deposition of S and N in a dry tropical region. Pedobiologia 2004, 48, 305–311. [Google Scholar] [CrossRef]
  24. Liu, X.; Zhang, B.; Zhao, W.R.; Wang, L.; Xie, D.J.; Huo, W.T.; Wu, Y.W.; Zhang, J.C. Comparative effects of sulfuric and nitric acid rain on litter decomposition and soil microbial community in subtropical plantation of Yangtze River Delta region. Sci. Total Environ. 2017, 601, 669–678. [Google Scholar] [CrossRef]
  25. Tu, L.H.; Hu, T.X.; Zhang, J.; Li, X.W.; Hu, H.L.; Liu, L.; Xiao, Y.L. Nitrogen addition stimulates different components of soil respiration in a subtropical bamboo ecosystem. Soil Biol. Biochem. 2013, 58, 255–264. [Google Scholar] [CrossRef]
  26. Lin, H.J.; Hu, T.X. Preliminary study on the Chemistry Features of Atmospheric Precipitation of three Typical Regions in Sichuan (in Chinese with English Abstract); Sichuan Agricultural University: Ya’an, China, 2011. [Google Scholar]
  27. Wei, S.Z.; Tie, L.H.; Liao, J.; Liu, X.; Du, M.L.; Lan, S.X.; Li, X.R.; Li, C.S.; Zhan, H.C.; Huang, C.D. Nitrogen and phosphorus co-addition stimulates soil respiration in a subtropical evergreen broad-leaved forest. Plant Soil 2020, 450, 171–182. [Google Scholar] [CrossRef]
  28. Zhou, S.X.; Xiang, Y.B.; Tie, L.H.; Han, B.H.; Huang, C.D. Simulated nitrogen deposition significantly reduces soil respiration in an evergreen broadleaf forest in western China. PLoS ONE 2018, 13, e0204661. [Google Scholar] [CrossRef]
  29. Peng, Y.; Song, S.Y.; Li, Z.Y.; Li, S.; Chen, G.T.; Hu, H.L.; Xie, J.L.; Chen, G.; Xiao, Y.L.; Liu, L.; et al. Influences of of nitrogen addition and aboveground litter-input manipulations on soil respiration and biochemical properties in a subtropical forest. Soil Biol. Biochem. 2020, 142, 107694. [Google Scholar] [CrossRef]
  30. Tie, L.; Zhang, S.; Peñuelas, J.; Sardans, J.; Zhou, S.; Hu, J.; Huang, C. Responses of soil C, N, and P stoichiometric ratios to N and S additions in a subtropical evergreen broad-leaved forest. Geoderma 2020, 379. [Google Scholar] [CrossRef]
  31. Berg, B.; Davey, M.P.; De Marco, A.; Emmett, B.; Faituri, M.; Hobbie, S.E.; Johansson, M.B.; Liu, C.; McClaugherty, C.; Norell, L.; et al. Factors influencing limit values for pine needle litter decomposition: A synthesis for boreal and temperate pine forest systems. Biogeochemistry 2010, 100, 57–73. [Google Scholar] [CrossRef]
  32. Cleveland, C.C.; Reed, S.C.; Keller, A.B.; Nemergut, D.R.; O’Neill, S.P.; Ostertag, R.; Vitousek, P.M. Litter quality versus soil microbial community controls over decomposition: A quantitative analysis. Oecologia 2014, 174, 283–294. [Google Scholar] [CrossRef] [PubMed]
  33. Xu, Y.H.; Fan, J.L.; Ding, W.X.; Gunina, A.; Chen, Z.M.; Bol, R.; Luo, J.F.; Bolan, N. Characterization of organic carbon in decomposing litter exposed to nitrogen and sulfur additions: Links to microbial community composition and activity. Geoderma 2017, 286, 116–124. [Google Scholar] [CrossRef]
  34. Zhang, P.; Gao, X.M. The concept of the Rainy Zone of West China and its significance to the biodiversity conservation in China (Abstract in English). Biodiv. Sci. 2002, 10, 339–344. [Google Scholar] [CrossRef]
  35. Berg, B.; Matzner, E. Effect of N deposition on decomposition of plant litter and soil organic matter in forest systems. Environ. Rev. 1997, 5, 1–25. [Google Scholar] [CrossRef]
  36. Schinner, F.; Ohlinger, R.; Kandeler, E.; Margesin, R. Methods in Soil Biology; Springer: Berlin, Germany, 1996. [Google Scholar]
  37. Allen, S.E.; Grimshaw, H.M.; Parkinson, J.A.; Quarmby, C. Chemical Analysis of Ecological Materials; Blackwell Scientific Publications: Oxford/London, UK, 1974. [Google Scholar]
  38. Bragazza, L.; Siffi, C.; Iacumin, P.; Gerdol, R. Mass loss and nutrient release during litter decay in peatland: The role of microbial adaptability to litter chemistry. Soil Biol. Biochem. 2007, 39, 257–267. [Google Scholar] [CrossRef]
  39. Olson, J.S. Energy storage and the balance of producers and decomposers in ecological systems. Ecology 1963, 44, 322–331. [Google Scholar] [CrossRef] [Green Version]
  40. Bockheim, J.G.; Jepsen, E.A.; Heisey, D.M. Nutrient dynamics in decomposing leaf litter of four tree species on a sandy soil in northwestern Wisconsin. Can. J. For. Res. 1991, 21, 803–812. [Google Scholar] [CrossRef]
  41. Entwistle, E.M.; Zak, D.R.; Edwards, I.P. Long-term experimental nitrogen deposition alters the composition of the active fungal community in the forest floor. Soil Sci. Soc. Am. J. 2013, 77, 1648–1658. [Google Scholar] [CrossRef]
  42. Zhou, S.X.; Huang, C.D.; Han, B.H.; Xiao, Y.X.; Tang, J.D.; Xiang, Y.B.; Luo, C. Simulated nitrogen deposition significantly suppresses the decomposition of forest litter in a natural evergreen broad-leaved forest in the Rainy Area of Western China. Plant Soil 2017, 420, 135–145. [Google Scholar] [CrossRef]
  43. Zhang, T.A.; Luo, Y.Q.; Chen, H.Y.H.; Ruan, H.H. Responses of litter decomposition and nutrient release to N addition: A meta-analysis of terrestrial ecosystems. Appl. Soil Ecol. 2018, 128, 35–42. [Google Scholar] [CrossRef]
  44. Tu, L.H.; Hu, H.L.; Chen, G.; Peng, Y.; Xiao, Y.L.; Hu, T.X.; Zhang, J.; Li, X.W.; Liu, L.; Tang, Y. Nitrogen addition significantly affects forest litter decomposition under high levels of ambient nitrogen deposition. PLoS ONE 2014, 9. [Google Scholar] [CrossRef] [PubMed] [Green Version]
  45. Moore, T.R.; Trofymow, J.A.; Prescott, C.E.; Fyles, J.; Titus, B.D. Patterns of carbon, nitrogen and phosphorus dynamics in decomposing foliar litter in Canadian forests. Ecosystems 2006, 9, 46–62. [Google Scholar] [CrossRef]
  46. Wang, C.Y.; Guo, P.; Han, G.M.; Feng, X.G.; Zhang, P.; Tian, X.J. Effect of simulated acid rain on the litter decomposition of Quercus acutissima and Pinus massoniana in forest soil microcosms and the relationship with soil enzyme activities. Sci. Total Environ. 2010, 408, 2706–2713. [Google Scholar] [CrossRef] [PubMed]
  47. Jian, S.Y.; Li, J.W.; Chen, J.; Wang, G.S.; Mayes, M.A.; Dzantor, K.E.; Hui, D.F.; Luo, Y.Q. Soil extracellular enzyme activities, soil carbon and nitrogen storage under nitrogen fertilization: A meta-analysis. Soil Biol. Biochem. 2016, 101, 32–43. [Google Scholar] [CrossRef] [Green Version]
  48. Keuskamp, J.A.; Feller, I.C.; Laanbroek, H.J.; Verhoeven, J.T.A.; Hefting, M.M. Short- and long-term effects of nutrient enrichment on microbial exoenzyme activity in mangrove peat. Soil Biol. Biochem. 2015, 81, 38–47. [Google Scholar] [CrossRef] [Green Version]
  49. Aerts, R.; van Bodegom, P.M.; Cornelissen, J.H.C. Litter stoichiometric traits of plant species of high-latitude ecosystems show high responsiveness to global change without causing strong variation in litter decomposition. New Phytol. 2012, 196, 181–188. [Google Scholar] [CrossRef]
  50. Fioretto, A.; Di Nardo, C.; Papa, S.; Fuggi, A. Lignin and cellulose degradation and nitrogen dynamics during decomposition of three leaf litter species in a Mediterranean ecosystem. Soil Biol. Biochem. 2005, 37, 1083–1091. [Google Scholar] [CrossRef]
  51. Ahmad, M.; Taylor, C.R.; Pink, D.; Burton, K.; Eastwood, D.; Bending, G.D.; Bugg, T.D.H. Development of novel assays for lignin degradation: Comparative analysis of bacterial and fungal lignin degraders. Mol. Biosyst. 2010, 6, 815–821. [Google Scholar] [CrossRef]
  52. Brown, M.E.; Chang, M.C.Y. Exploring bacterial lignin degradation. Curr. Opin. Chem. Biol. 2014, 19, 1–7. [Google Scholar] [CrossRef]
  53. Du, E.; Vries, W.D.; Han, W.; Liu, X.; Yuan, J. Imbalanced phosphorus and nitrogen deposition in China’s forests. Atmos. Chem. Phys. 2016, 16, 1–17. [Google Scholar] [CrossRef] [Green Version]
  54. Mieczan, T.; Adamczuk, M.; Tarkowska-Kukuryk, M.; Wojciech, P.; Pawlik-Skowronska, B. Effects of experimental addition of nitrogen and phosphorus on microbial and metazoan communities in a peatbog. Eur. J. Protistol. 2017, 59, 50–64. [Google Scholar] [CrossRef] [PubMed]
  55. Floudas, D.; Binder, M.; Riley, R.; Barry, K.; Blanchette, R.A.; Henrissat, B.; Martinez, A.T.; Otillar, R.; Spatafora, J.W.; Yadav, J.S.; et al. The paleozoic origin of enzymatic lignin decomposition reconstructed from 31 fungal genomes. Science 2012, 336, 1715–1719. [Google Scholar] [CrossRef] [PubMed] [Green Version]
  56. Talbot, J.M.; Treseder, K.K. Interactions among lignin, cellulose, and nitrogen drive litter chemistry-decay relationships. Ecology 2012, 93, 345–354. [Google Scholar] [CrossRef] [PubMed] [Green Version]
  57. Allison, S.D.; Vitousek, P.M. Responses of extracellular enzymes to simple and complex nutrient inputs. Soil Biol. Biochem. 2005, 37, 937–944. [Google Scholar] [CrossRef]
  58. Hu, Y.L.; Jung, K.; Zeng, D.H.; Chang, S.X. Nitrogen- and sulfur-deposition-altered soil microbial community functions and enzyme activities in a boreal mixedwood forest in western Canada. Can. J. For. Res. 2013, 43, 777–784. [Google Scholar] [CrossRef]
  59. Berg, B.; McClaugherty, C. Plant litter. In Decomposition, Humus Formation, Carbon Sequestration, 2nd ed.; Springer: Heidelberg, Germany, 2008. [Google Scholar]
  60. Tan, B.; Yin, R.; Yang, W.; Zhang, J.; Xu, Z.; Liu, Y.; He, S.; Zhou, W.; Zhang, L.; Li, H.; et al. Soil fauna show different degradation patterns of lignin and cellulose along an elevational gradient. Appl. Soil Ecol. 2020, 155. [Google Scholar] [CrossRef]
  61. Zhang, X.; Liu, Z. Responses of litter decomposition and nutrient release of Bothriochloa ischaemum to soil petroleum contamination and nitrogen fertilization. Int. J. Environ. Sci. Technol. 2019, 16, 719–728. [Google Scholar] [CrossRef]
  62. Chen, H.; Li, D.J.; Zhao, J.; Xiao, K.C.; Wang, K.L. Effects of nitrogen addition on activities of soil nitrogen acquisition enzymes: A meta-analysis. Agric. Ecosyst. Environ. 2018, 252, 126–131. [Google Scholar] [CrossRef]
  63. Pei, G.; Liu, J.; Peng, B.; Wang, C.; Jiang, P.; Bai, E. Non-linear coupling of carbon and nitrogen release during litter decomposition and its responses to nitrogen addition. J. Geophys. Res. Biogeosciences 2020, 125. [Google Scholar] [CrossRef]
Figure 1. Location of the study site on the Google Satellite Map. The area within the solid red line is the rainy zone of Western China [34]. The area within the solid blue line is Yucheng County.
Forests 11 01280 g001
Figure 2. Remaining litter mass (% of the initial amount) during the decomposition process. Values are the averages of three plot replicates ± standard deviations. Different lowercase letters in the histogram denote significant differences between distinct treatments at the end of this study based on one-way ANOVA (p < 0.05; Fisher’s LSD test adjusted using the Bonferroni correction). CK, no added N or S; +N, added N but no added S; +S, added S but no added N; and +NS, added N and S.
Forests 11 01280 g002
Figure 3. Remaining litter (% of the initial amount) lignin (a) and cellulose (b) during the decomposition process. Values are the averages of three plot replicates ± standard deviations. Different lowercase letters in the histogram denote significant differences between distinct treatments at the end of this experiment based on one-way ANOVA (p < 0.05). The abbreviations for the treatments are defined in Figure 2.
Forests 11 01280 g003
Figure 4. Remaining litter (% of the initial amount) C (a), N (b), and P (c) and C/N (d), C/P (e), and N/P (f) ratios during the decomposition process. The litter stoichiometry ratios are based on mass. Different lowercase letters in the histogram denote significant differences between distinct treatments at the end of this experiment based on one-way ANOVA (p < 0.05). Values are the averages of three plot replicates ± standard deviations. The abbreviations for the treatments are defined in Figure 2.
Forests 11 01280 g004
Figure 5. Correlations between remaining litter nutrients (% of the initial amount) and remaining (% of the initial amount) lignin and cellulose. (a), correlation between remaining litter C and remaining lignin; (b), correlation between remaining litter C and remaining cellulose; (c), correlation between remaining litter N and remaining lignin; (d), correlation between remaining litter N and remaining cellulose; (e), correlation between remaining litter P and remaining lignin; (f), correlation between remaining litter P and remaining cellulose. ** denotes that the coefficient of determination is highly significant (p < 0.01). Data from each sampling time are aggregated. Treatment abbreviations are defined in Figure 2. n = 144.
Forests 11 01280 g005
Table 1. Decomposition coefficient (k-value) and times required for 50% (T50%) decomposition under different treatments based on one-way ANOVA.
TreatmentsCoefficient of Determination (R2)k-Value (Year−1)T50% (Year)
CK0.975 **0.452 ± 0.005 a1.535 ± 0.015 d
+N0.947 **0.384 ± 0.002 b1.804 ± 0.007 c
+S0.974 **0.378 ± 0.002 c1.832 ± 0.010 b
+NS0.955 **0.374 ± 0.001 d1.854 ± 0.006 a
** Denotes highly significant (p < 0.01). Different lowercase letters in the superscript denote significant differences between different treatments (p < 0.05; Fisher’s least significant difference (LSD) test adjusted using the Bonferroni correction). Values are the averages of three plot replicates ± standard deviations. Treatment abbreviations are provided in Figure 2.
Publisher’s Note: MDPI stays neutral with regard to jurisdictional claims in published maps and institutional affiliations.

