Article

Bound Water Content and Pore Size Distribution of Thermally Modified Wood Studied by NMR

1
Co-Innovation Center of Efficient Processing and Utilization of Forest Resources, Nanjing Forestry University, Nanjing 210037, China
2
College of Furnishings and Industrial Design, Nanjing Forestry University, Nanjing 210037, China
3
College of Materials Science and Engineering, Nanjing Forestry University, Nanjing 210037, China
*
Author to whom correspondence should be addressed.
Forests 2020, 11(12), 1279; https://doi.org/10.3390/f11121279
Submission received: 19 October 2020 / Revised: 21 November 2020 / Accepted: 26 November 2020 / Published: 29 November 2020
(This article belongs to the Section Wood Science and Forest Products)

Abstract

:
The physical and mechanical properties of thermally modified wood (TMW) have been comprehensively studied; however, the quantitative analysis of water states and cell wall pores of TMW is limited. In this work, Douglas fir and Norway spruce were thermally modified at 180, 200 and 220 °C, and then studied by NMR cryoporometry method. The results show that thermally modified samples had lower fiber saturation point and the bound water content than the reference samples at all the experimental temperatures, indicating the reduced hygroscopicity due to thermal modification (TM). In addition, TM decreased number of hygroscopic groups, which can be implied by the decreased proportion of bound water sites, and TM also increased the proportion of small voids for bound water clusters. An increase in TM intensity resulted in lower bound water content and a smaller number of hygroscopic groups. In summary, the NMR method detected the water states and pore size distribution and confirmed that TM decreased the fiber saturation point and hygroscopicity of wood by reducing the bound water content and proportion of bound water sites in wood cell walls.

1. Introduction

Wood is a hygroscopic and porous material. The amount of water present in wood cells plays an important role in physical and mechanical properties, as well as durability of wood products [1]. Thermal modification (TM) is known as an environmentally friendly method to decrease the hygroscopicity of wood, which subsequently improves the dimensional stability and durability of wood products by reduction of the hydrophilic hemicelluloses and increase in cellulose crystallinity [2,3].
It is known that the mechanical properties of wood depend on the microstructure and the moisture content (MC) below the fiber saturation point (FSP) [1]. Therefore, investigating the moisture content, FSP and cell wall structure is helpful to predict the performance of wood.
The International Union of Pure and Applied Chemistry (IUPAC) classifies pores into macropores (diameter > 50 nm), mesopores (2–50 nm) and micropores (<2 nm) [4]. The macropores presented in vessels, tracheids, rays, and pits, and the mesopores and micropores occurred in the cell walls have been proven to have a great influence in properties of wood [5]. In previous studies, many experimental methods have been used to analyze the porosity in cell walls, for example, mercury intrusion porosimetry, gas pycnometry, differential scanning calorimetry, atomic force microscopy, X-ray CT and Nuclear magnetic resonance (NMR) [6,7,8,9,10,11].
Among the above-mentioned methods, NMR spectroscopy has been proven to be an efficient and non-destructive tool to determine the distribution and content of water, and to quantify the pore size distribution in wood [12,13]. The NMR T2 relaxation time of water molecules confined in wood pores changes based on their mobility and local environment, and the intensity of the NMR signal is proportional to the moisture content of wood. [14,15]. Hence, the T2 distribution can be used to distinguish and quantify the bound water in the cell walls and free water in the large voids of wood [16]. In addition, NMR cryoporometry determines the pores size distribution by detecting the lowered solid–liquid phased transition temperature of a substance confined to pores [17]. The relationship between the pore size and the melting point of confined liquid is described by the Gibbs–Thomson equation (Equation (1)).
Δ T m = T 0 T m = 4 σ T 0 c o s θ d Δ H f ρ
where T0 is the melting temperature of bulk liquid, Tm is the melting temperature in a cylindrical pore with a diameter d, and σ, Hf, ρ and θ are solid–liquid interface energy, bulk enthalpy of fusion, density of frozen water, and contact angle, respectively.
Although the effect of TM on wood properties has been studied extensively [3,18], the water states distribution and number of cell wall pores of thermally modified wood (TMW) are not sufficiently studied. The aim of this work is to quantitatively investigate the effect of TM on the bound water content, FSP and cell wall pores of Douglas fir and Norway spruce.

2. Materials and Methods

2.1. Materials

Douglas fir (Pseudotsuga menziesii) and Norway spruce (Picea abies) boards containing only heartwood with dimensions of 900 mm (longitudinal) × 100 mm (tangential) × 20 mm (radial) were first kiln dried at the maximum temperature of 80 °C until the moisture content reached 10%, and then split into 4 pieces. One piece was left untreated as a reference, while the others were thermally modified with the presence of superheated steam at 180, 200, and 220 °C. The heating rate was 10 °C per hour and the target temperature was maintained constant for 2 h.

2.2. Sample Preparation

Cuboid samples with dimensions of 20 mm (longitudinal) × 6 mm (tangential) × 6 mm (radial) were prepared from both modified and reference boards. Five replicates were prepared from each TM group.
Prior to NMR analysis, all the samples were boiled in distilled water at 90 °C until constant mass to ensure the cell wall of samples were fully saturated with water. The extra water on the surface of samples were removed before weighting. Then the samples were inserted, one at a time, into a 10 mm OD NMR tube and closed with Teflon cap before NMR cryoporometry experiments.

2.3. NMR Cryoporometry

The NMR cryoporometry experiment was carried out using a Niumag MicroMR-10 spectrometer (Niumag Corporation, Shanghai, China) with the magnetic field strength of 0.3 T. To generate a stable magnetic field, the temperature of the magnetic unit was set to be 32 ± 0.01 °C.
For cryoporometry analysis, the T2 measurements were performed at eight different temperatures which were 25 °C (298 K), −3 °C (270 K), −10 °C (263 K), −20 °C (253 K), −30 °C (243 K), −40 °C (233 K), −50 °C (223 K), and −60 °C (213 K). The measurements began with room temperature (i.e., 25 °C). Then, the same samples were frozen at the lowest temperature (i.e., −60 °C) and measurements were performed from −60 to −3 °C. To ensure the samples reach the target temperature, twin samples were prepared with a temperature sensor inside. Both real samples and twin samples were pre-conditioned in a temperature-controlled fridge until they achieved the target temperature. After that, samples were inserted into NMR chamber, which had also adjusted to the same temperature, for T2 measurement. The temperature stabilization delay was approximately 30 min before each measurement.
To eliminate the temperature dependence of thermal equilibrium magnetization defined by the Curie law, the intensities of T2 signals at different temperatures were corrected by multiplying with a factor T/T0 [13,19], where T is the actual temperature and T0 is the maximum experimental temperature, which is 25 °C in this study.
The T2 spectra were measured using a CPMG (Carr–Purcell–Meiboom–Gill) pulse sequence with an echo time of 0.2 ms and 10,000 echoes. The relaxation delay were 3 s and 0.2 s for room temperature and other temperatures, respectively, and the number of accumulate scans was 16. Experimental data were processed by Delphi according to the Contin program developed by Provencher [20,21].
To calculate the effective pore diameter (D) according to Gibbs–Thomson equation, the following parameters were substituted to Equation (1): T0 = 273.15 K, σ = 12.1 mJm−2, θ = 180°, ρ = 103 kg m−3, and Hf = 333.6 Jg−1 [22]. Thus, the relationship between the pore size diameter and the melting point of liquid can be simplified as Equation (2).
D   ( n m ) 39.6 Δ T m
In addition, it is estimated the presence of non-freezing layer with a thickness is about 0.3–0.8 nm [23], hence, the average value of 0.6 nm was added to the calculated diameter in order to determine the true pore size of the wood samples. Therefore, the melting temperatures and corresponding pore diameters based on the Gibbs–Thomson equation is shown in Table 1.

2.4. Bound Water Content

After the NMR experiments, all the specimens were oven dried at 103 ± 2 °C until constant mass, and the moisture content of the individual specimens was determined based on the oven dry mass and the mass after water saturated. The bound water content when the cell wall was saturated, which is also known as FSP can be calculated by Equation (3).
Mb (%) = FSP = MC (S−3°C/S25°C)
where S−3°C is the integral of the bound water peak at −3 °C and S25°C is the total integral of the moisture peaks at 25 °C. The amount of unfrozen water at other temperature can be calculated using Equation (4).
MT (%) = MC (ST/S25°C)
where ST is the integral of the bound water peak at particular temperature T.
When the free water is frozen and the bound water within cell wall is remaining unfrozen, the relation between cell wall pores and unfrozen bound water content could be expressed as:
Dx (%) = MTx/Mb
where Dx is the proportion of cell wall pores with a diameter smaller than x, and MTx is the amount of unfrozen bound water at temperature of Tx.
Therefore, the pore size distribution (PSD) is determined by the intensity corresponding to the pore size with a certain melting temperature given by the Gibbs–Thomson equation. The PSD proportion within a certain range could be determined by Equation (6).
PSD (%) = (MT1 − MT2)/Mb
where MT1 and MT2 are the amount of unfrozen bound water at temperature of T1 and T2.

3. Results

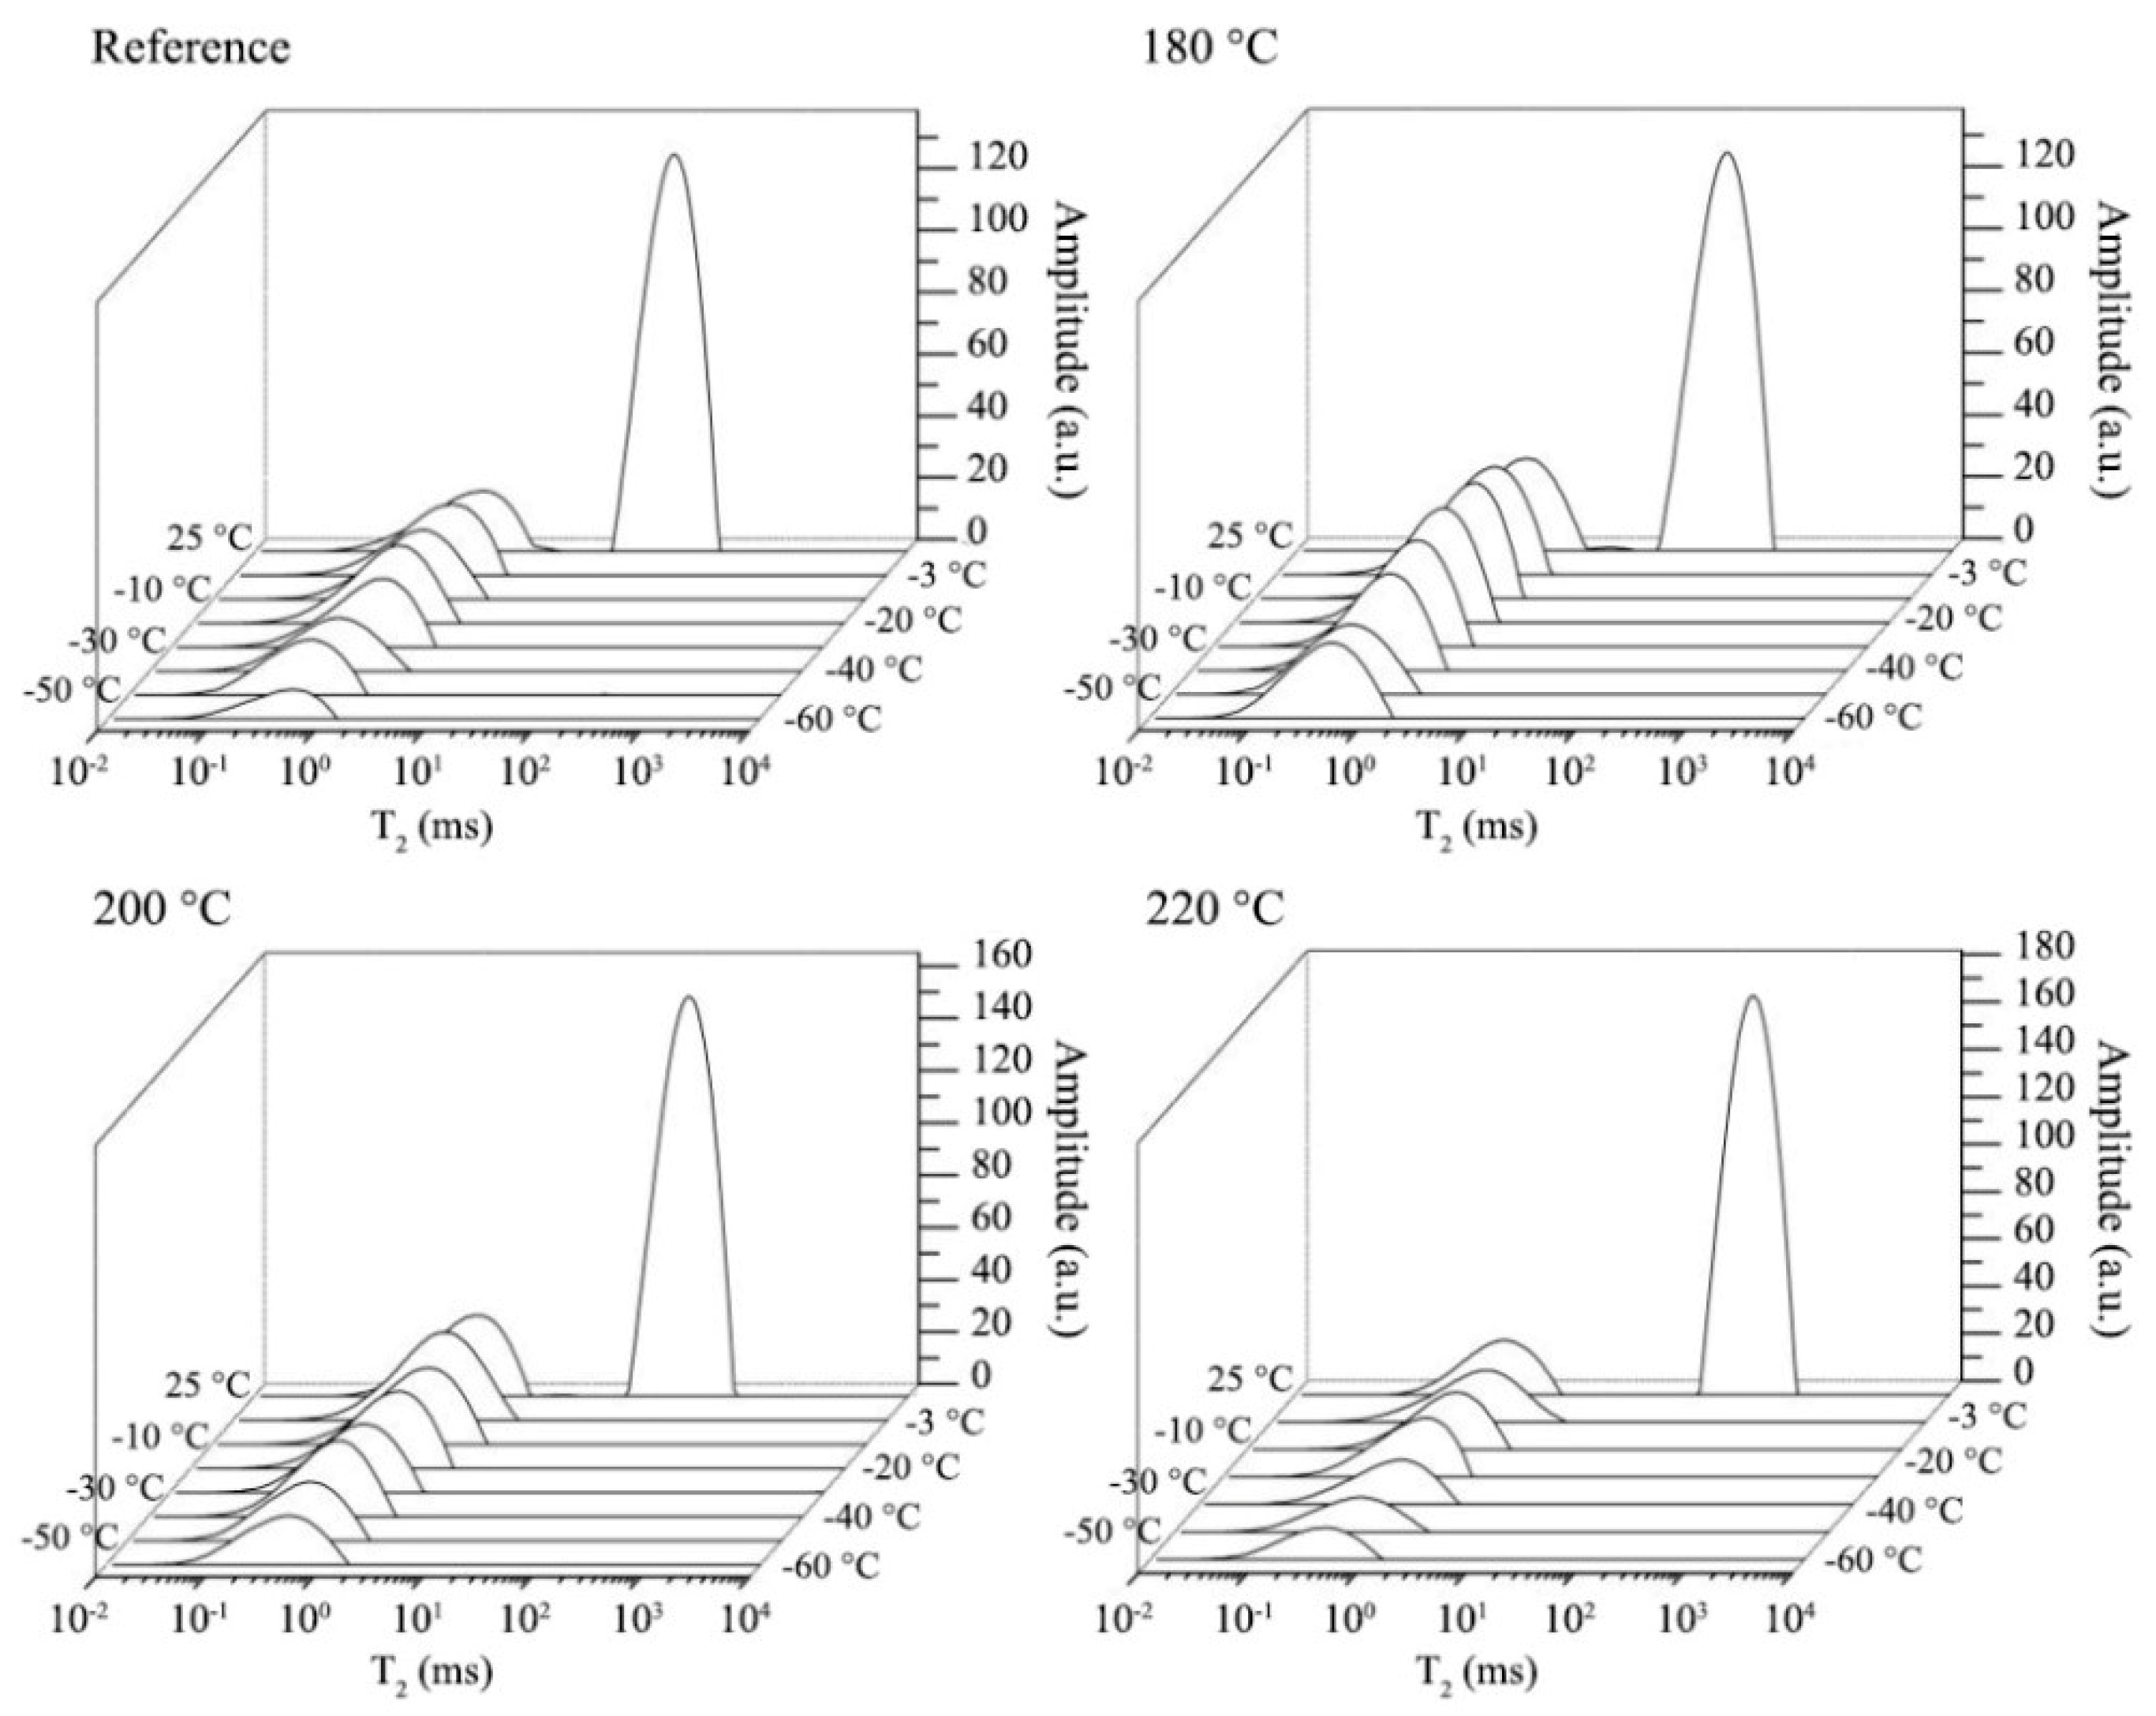
3.1. T2 Distribution at Different Experimental Temperatures

The basic density of Douglas fir and Norway spruce before and after TM were shown in Table 2. The results show that basic density slightly decreased with increasing modification temperature. The T2 relaxation time distribution of thermally modified Douglas fir and Norway spruce at various temperatures from 25 to −60 °C were shown in Figure 1 and Figure 2. The results show that two signals were observed at temperature of 25 °C, while only one peak was obtained when temperature was below 0 °C in both two species.
Table 3 presents the T2 peak time of the bound water (T2P) for Douglas fir and Norway spruce. For reference samples, the T2P were 1.29 and 1.2 ms for Douglas fir and Norway spruce, respectively. TM decreased the T2P for both species, and the T2P decreased with the increasing of TM intensity. In addition, the T2P also decreased with the decreasing experimental temperature.

3.2. The Bound Water Content of Saturated Cell Walls

The content of unfrozen water of Douglas fir and Norway spruce was determined by the peak integrals at different temperatures from Figure 1 and Figure 2 using Equation (4). Table 4 and Table 5 present the integral of moisture peaks (IP) and content of unfrozen water (MT) of two studied species at various temperatures. The results show that increasing the TM intensity significantly reduced the moisture content of both species at all the different experimental temperatures. In addition, the decreasing experimental temperature decreased the IP and MT of both species.
According to Equation (3), the fiber saturation point (FSP) of specimen refers to the MT value at −3 °C. The FSP value for Douglas fir and Norway spruce were in bold in Table 4 and Table 5, respectively. The results show that the FSP of reference Douglas fir and Norway spruce were 39.7% and 42.7%, respectively. Such value decreased with increasing TM intensity, and Norway spruce had slightly higher FSP value than Douglas fir.

3.3. The Pore Size Distribution of Saturated Cell Walls

Table 6 presents the pore size distribution of Douglas fir and Norway spruce calculated by Equation (6). The results show that the proportion of pores in cell walls larger than 4.56 nm ranged between 11.5% and 13.8% for both reference and modified specimens, and the share of pores smaller than 1.26 nm varied from 41% to 52.5% for all samples. Increasing the TM intensity increased the proportion of large pores (>4.56 nm) while decreased that of small pores (<1.26 nm).
Table 7 shows the proportion of bound water sites (≤2.58 nm) and small voids (>2.58 nm) in swollen cell walls of both reference and modified Douglas fir and Norway spruce. The results present that TM decreased the proportion of bound water sites, but increased the proportion of small voids in cell walls. Such changes increased with increasing TM intensity.

4. Discussion

4.1. T2 Distribution at Different Experimental Temperatures

The slightly decreased basic density with increased TM temperature indicated a greater cell wall degradation with increasing TM intensity.
At room temperature (i.e., 25 °C), no water freezes. Signals from both bound water and free water were observed. The T2 of water in porous media is considered approximately proportional to the pore diameter [22]. Therefore, the peak with shorter T2 resulted from the bound water confined in cell wall pores, while the other peak arose from free water in cell lumens. When the temperature is below the melting point of bulk water (−3~−60 °C), free water freezes and its signal disappears. Therefore, the remaining T2 signal is assigned to the bound water in cell walls.
The phenomenon that T2P decreased with increasing TM intensity can be explained by the decreased mobility of water molecules in the cell walls after TM [24,25]. In addition, according to the Gibbs–Thomson equation, the melting point of a confined liquid is inversely proportional to the pore size. Therefore, with the decreasing experimental temperature, the observed signal arose from water in relatively smaller pores, and peaks shifted to shorter T2.

4.2. The Bound Water Content of Saturated Cell Walls

The reduced moisture content of both modified species at all the different experimental temperatures is due to the partial elimination of the hydrophilic hydroxyl groups of hemicelluloses and subsequently decreased hygroscopicity of wood after TM [26]. The moisture content reduced with the increase in TM intensity, which is in agreement with previous studies [13,25].
FSP, which is defined as the moisture content corresponding to the amount of water contained within the saturated cell wall [27], is often assumed to be approximately 30% [28]. However, it is reported that the FSP value measured from water saturated wood is higher than from a piece of wood which is conditioned in hygroscopic region. This is because the water vapor sorption hindered by the cellulose crystalline, lignin matrix, and intermolecular hydrogen bonds between the cellulose chains are more pronounced at lower moisture content, while the swollen cell walls have higher availability of bonding sites of sorption on molecular surfaces [10,29]. Hence, it is important to notice from which state the FSP value is reached. As the result shown that the FSP value were 39.7% and 42.7% for reference Douglas fir and Norway spruce, which were close to the FSP values measured by solute exclusion [30,31], differential canning calorimetry [10] or NMR methods [19,22,25].
In accordance with previous studies [10,25], both species showed a reduction in the content of unfrozen water after TM, and such value decreased with the increasing TM intensity, indicating the reduced hygroscopicity of thermally modified wood. This is mainly caused by the irreversible degradation of hydrophilic hemicelluloses, and crosslinking reaction of lignin due to TM [32]. In addition, the content of unfrozen water decreased with the decreasing experimental temperature is due to the freezing of water in relatively larger pores.

4.3. The Pore Size Distribution of Saturated Cell Walls

The decreasing of unfrozen bound water content after TM (Table 3 and Table 4) implied the decrease in moisture in cell wall pores and decrease in the number of cell wall pores. This result is probably due to the shrinkage of cell walls, increasing cellulose crystallinity, and reduced swelling behavior of cell walls caused by TM [9,33,34]. The results shown in Table 6 that approximately 12% of pores was larger than 4.56 nm, and approximately 47% of pores was smaller than 1.26 nm in cell walls, is close to the results given by Stone and Scallan [35], who reported that the moisture in the pores >5 and <1 nm were approximately 10% and 50%, respectively, of the total quantity of bound water by the solute exclusion method.
Previous studies confirmed that pores smaller than 2.5 nm in cell walls are bound water sites, while the pores larger than 2.5 nm are the small void spaces where the clusters of bound water are condensed between cellulose chains and microfibrils [13,24]. The content of unfrozen water at −20 °C refers to the amount of bound water in pores with the size smaller than 2.58 nm, which could be used to roughly estimate the number of bound water sites. The reduced content of unfrozen water at −20 °C with the increasing modification temperature indicated the decreased number of bound water sites due to TM, indicating the decreased hygroscopic group. The result that the decreased proportion of bound water sites, but increased proportion of small voids in cell walls of samples after TM is also in agreement with previous studies [25].

5. Conclusions

In this work, the bound water content and pore size distribution in saturated cell walls of thermally modified Douglas fir and Norway spruce were studied at eight different temperatures from −60 to 25 °C by NMR cryoporometry. TM leads to shorter T2 value of bound water peak, indicating the decreased mobility of water molecules in the cell walls. An increase in TM intensity results in decreased the fiber saturation point and content of bound water at various temperatures, indicating a noticeable decrease in water accessibility. In addition, TM decreased the proportion of bound water sites while increased share of small voids between cellulose chains and microfibrils. These findings imply that the TM increases the water resistant, which consequently improves the performance of wooden products during their application.

Author Contributions

Conceptualization, J.C., C.C.; methodology, F.Z.; software, F.Z.; validation and analysis, F.Z.; resources, J.C.; data curation, F.Z., C.C.; writing—original draft preparation, C.C.; writing—review and editing, J.C., C.C.; supervision, J.C.; project administration, J.C. All authors have read and agreed to the published version of the manuscript.

Funding

This research was funded by Jiangsu Province (CN) (SZ-SQ2019023).

Acknowledgments

The authors thank Gao Xin for valuable suggestions in methodology and data analysis.

Conflicts of Interest

The authors declare no conflict of interest.

References

  1. Kollmann, F.; Côté, W.A. Principles of Wood Science and Technology. 1. Solid Wood; Springer: Berlin/Heidelberg, Germany; New York, NY, USA, 1968. [Google Scholar]
  2. Rowell, R.M. Handbook of Wood Chemistry and Wood Composites, 1st ed.; CRC Press: Boca Raton, FL, USA, 2005. [Google Scholar]
  3. Hill, C.A.S. Wood Modification–Chemical, Thermal and Other Processes; John Wiley & Sons: Chichester, UK, 2006. [Google Scholar]
  4. Everett, D.H. Manual of symbols and terminology for physicochemical quantities and units, appendix II: Definitions, terminology and symbols in colloid and surface. Chem. Pure Appl. Chem. 1972, 31, 577–638. [Google Scholar] [CrossRef]
  5. Yin, J.; Song, K.; Lu, Y.; Zhao, G.; Yin, Y. Comparison of changes in micropores and mesopores in the wood cell walls of sapwood and heartwood. Wood Sci. Technol. 2015, 49, 987–1001. [Google Scholar] [CrossRef]
  6. Roles, S.; Elsen, J.; Carmeliet, J.; Hens, H. Characterization of pore structure by combining mercury porosimetry and micrography. Mater. Struct. 2001, 34, 76–82. [Google Scholar] [CrossRef]
  7. Fahlén, J.; Salmén, L. Pore and matrix distribution in the fiber wall revealed by atomic force microscopy and image analysis. Biomacromolecules 2005, 6, 433–438. [Google Scholar] [CrossRef] [PubMed]
  8. Park, S.; Venditti, R.A.; Jameel, H.; Pawlak, J. Changes in pore size distribution during the drying of cellulose fibers as measured by differential scanning calorimetry. Carbohyd Polym. 2006, 66, 97–103. [Google Scholar] [CrossRef]
  9. Zauer, M.; Pfriem, A.; Wagenführ, A. Toward improved understanding of the cell-wall density and porosity of wood determined by gas pycnometry. Wood Sci. Technol. 2013, 47, 1197–1211. [Google Scholar] [CrossRef]
  10. Zauer, M.; Kretzschmar, J.; Grossmann, L.; Pfriem, A.; Wagenfuhr, A. Analysis of the pore-size distribution and fiber saturation point of native and thermally modified wood using differential scanning calorimetry. Wood Sci. Technol. 2014, 48, 177–193. [Google Scholar] [CrossRef]
  11. Peng, L.; Wang, D.; Fu, F.; Song, B. Analysis of wood pore characteristics with mercury intrusion porosimetry and X-ray micro-computed tomography. Wood Res. 2015, 60, 857–864. [Google Scholar]
  12. Bucur, V. Nondestructive Characterization and Imaging of Wood; Springer: Berlin/Heidelberg, Germany, 2003. [Google Scholar]
  13. Kekkonen, P.M.; Ylisassi, A.; Telkki, V.V. Absorption of water in thermally modified pine wood as studied by NMR. J. Phys. Chem. C 2014, 118, 2146–2153. [Google Scholar] [CrossRef]
  14. Sharp, A.R.; Riggin, M.T.; Kaiser, R.; Schneider, M.H. Determination of Moisture Content of Wood by Pulsed Nuclear Magnetic Resonance. Wood Fiber Sci. 1978, 10, 74–81. [Google Scholar]
  15. Brownstein, K.R.; Tarr, C.E. Importance of classical diffusion in NMR studies of water in biological cells. Phys. Rev. A 1979, 19, 2446. [Google Scholar] [CrossRef]
  16. Riggin, M.T.; Sharp, A.R.; Kaiser, R. Transverse NMR Relaxation of Water in Wood. J. Appl. Polym. Sci. 1979, 23, 3147–3154. [Google Scholar] [CrossRef]
  17. Strange, J.H.; Rahman, M.; Smith, E.G. Characterization of Porous Solids by NMR. Phys. Rev. Lett. 1993, 71, 3589–3591. [Google Scholar] [CrossRef] [PubMed]
  18. Esteves, B.; Pereira, H. Wood modification by heat treatment: A review. BioResources 2009, 4, 370–404. [Google Scholar] [CrossRef]
  19. Telkki, V.V.; Yliniemi, M.; Jokisaari, J. Moisture in softwoods: Fiber saturation point, hydroxyl site content, and the amount of micropores as determined from NMR relaxation time distributions. Holzforschung 2013, 67, 291–300. [Google Scholar] [CrossRef]
  20. Provencher, S.W. A constrained regularization method for inverting data represented by linear algebraic or integral equations. Comput. Phys. Commun. 1982, 27, 213–227. [Google Scholar] [CrossRef]
  21. Provencher, S.W. CONTIN: A general purpose constrained regularization program for inverting noisy linear algebraic and integral equations. Comput. Phys. Commun. 1982, 27, 229–242. [Google Scholar] [CrossRef]
  22. Gao, X.; Zhuang, S.; Jin, J.; Cao, P. Bound Water Content and Pore Size Distribution in Swollen Cell Walls Determined by NMR Technology. BioResources 2015, 10, 8208–8224. [Google Scholar] [CrossRef]
  23. Hansen, E.W.; Stöcker, M.; Schmidt, R. Low-Temperature Phase Transition of Water Confined in Mesopores Probed by NMR. Influence on Pore Size Distribution. J. Phys. Chem. 1996, 100, 2195–2200. [Google Scholar] [CrossRef]
  24. Gezici-Koç, Ö.; Erich, S.; Huinink, H.; Ven, L.; Adan, O. Bound and free water distribution in wood during water uptake and drying as measured by 1D magnetic resonance imaging. Cellulose 2017, 24, 535–553. [Google Scholar] [CrossRef] [Green Version]
  25. Cai, C.; Javed, M.A.; Komulainen, S.; Telkki, V.-V.; Haapala, A.; Heräjärvi, H. Effect of natural weathering on water absorption and pore size distribution in thermally modified wood determined by nuclear magnetic resonance. Cellulose 2020, 27, 4235–4247. [Google Scholar] [CrossRef] [Green Version]
  26. Altgen, M.; Hofmann, T.; Militz, H. Wood moisture content during the thermal modification process affects the improvement in hygroscopicity of Scots pine sapwood. Wood Sci. Technol. 2016, 50, 1181–1195. [Google Scholar] [CrossRef]
  27. Stone, J.E.; Scallan, A.M. Effect of component removal upon porous structure of cell wall of wood–2. Swelling in water and fiber saturation point. Tappi 1967, 50, 496–501. [Google Scholar]
  28. Siau, J. Wood: Influence of Moisture on Physical Properties; Virginia Polytechnic Institute and State University: Blacksburg, VA, USA, 1995. [Google Scholar]
  29. Chen, C.M.; Wangaard, F. Wettability and the hysteresis effect in the sorption of water vapor by wood. Wood Sci. Technol. 1968, 2, 177–187. [Google Scholar]
  30. Hill, C.A.S.; Forster, S.C.; Farahani, M.R.M.; Hale, M.D.C.; Ormondroyd, G.A.; Williams, G.R. An investigation of cell wall micropore blocking as a possible mechanism for the decay resistance of anhydride modified wood. Int. Biodeterior Biodegrad. 2005, 55, 69–76. [Google Scholar] [CrossRef]
  31. Walker, J.C.F. Chapter 3: Water in Wood, in Primary Wood Processing Principles and Practice, 2nd ed.; University of Canterbury: Christchurch, New Zealand, 2006; pp. 69–94. [Google Scholar]
  32. Tjeerdsma, B.F.; Militz, H. Chemical changes in hydrothermal treated wood: FTIR analysis of combined hydrothermal and dry heat treated wood. Holz Roh Werkst. 2005, 63, 102–111. [Google Scholar] [CrossRef]
  33. Andersson, S.; Serimaa, R.; Väänänen, T.; Paakkari, T.; Jämsä, S.; Viitaniemi, P. X-ray scattering studies of thermally modified Scots pine (Pinus sylvestris L.). Holzforschung 2005, 59, 422–427. [Google Scholar] [CrossRef]
  34. Esteves, B.; Domingos, I.; Pereira, H. Improvement of technological quality of eucalypt wood by heat treatment in air at 170–200 °C. For. Prod. J. 2007, 57, 47–52. [Google Scholar]
  35. Stone, J.E.; Scallan, A.M. Structural model for the cell wall of water-swollen wood pulp fibers based on their accessibility to macromolecules. Cellul. Chem. Technol. 1968, 2, 343–358. [Google Scholar]
Figure 1. The T2 distribution of Douglas fir at various temperatures.
Forests 11 01279 g001
Figure 2. The T2 distribution of Norway spruce at various temperatures.
Forests 11 01279 g002
Table 1. Melting temperatures and corresponding pore diameters.
Temperature (°C)Diameter (nm)
−601.26
−501.39
−401.59
−301.92
−202.58
−104.56
−313.80
Table 2. The basic density of samples (Ref. refers to reference samples).
Basic DensityDouglas FirNorway Spruce
Ref.180 °C200 °C220 °CRef.180 °C200 °C220 °C
(g/cm3)0.510.490.480.480.400.380.380.37
Table 3. The T2 mean value of bound water peak of Douglas fir and Norway spruce at different temperatures (unit: ms).
SpeciesTreatment25 °C−3 °C−10 °C−20 °C−30 °C−40 °C−50 °C−60 °C
Douglas firRef.1.291.050.980.910.740.610.560.49
180 °C1.280.980.850.850.720.600.500.48
200 °C1.120.980.850.790.640.600.490.46
220 °C0.850.910.850.740.600.560.490.40
Norway spruceRef.1.200.910.910.850.740.690.520.49
180 °C1.120.850.850.800.700.640.490.46
200 °C0.980.850.790.790.690.690.450.40
220 °C0.850.850.790.740.690.560.400.34
Table 4. The integral of the peaks (IP) and content of unfrozen water (MT) of Douglas fir at different temperatures.
Treatments25 °C−3 °C−10 °C−20 °C−30 °C−40 °C−50 °C−60 °C
IPRef.4423877774736659625511460
(a.u.)180 °C3538950835780711670521498
200 °C3960902789724668624483462
220 °C3390695607556485451349343
MTRef.200.239.735.033.329.828.323.120.8
(%)180 °C120.232.328.426.524.222.817.716.9
200 °C110.425.122.020.218.617.413.512.9
220 °C107.422.019.217.615.414.311.110.9
Table 5. The integral of the peaks (IP) and content of unfrozen water (MT) of Norway spruce at different temperatures.
Treatments25 °C−3 °C−10 °C−20 °C−30 °C−40 °C−50 °C−60 °C
IPRef.538212051066997909839596526
(a.u.)180 °C41371116975919834748551482
200 °C3910894773735661597442385
220 °C3697716617586515428328294
MTRef.190.742.737.835.432.229.821.118.7
(%)180 °C137.437.132.430.527.724.818.316.0
200 °C127.329.125.223.921.519.414.412.5
220 °C119.423.119.918.916.613.810.69.5
Table 6. The pore size distribution (PSD) of water saturated cell walls (unit: %).
Pore Size (nm)Douglas FirNorway Spruce
Ref.180 °C200 °C220 °CRef180 °C200 °C220 °C
4.56–13.811.812.012.512.711.512.713.513.8
2.58–4.564.45.87.27.35.75.04.34.2
1.92–2.588.77.36.310.37.47.68.39.9
1.59–1.923.94.44.94.85.87.77.112.2
1.39–1.5913.015.715.614.720.217.617.414.0
1.26–1.395.82.42.40.95.86.26.34.8
<1.2652.552.451.249.443.743.243.141.0
Table 7. The proportion of bound water sites and small voids in swollen cell walls of Douglas fir and Norway spruce after TM (unit: %).
Douglas FirNorway Spruce
Ref180 °C200 °C220 °CRef180 °C200 °C220 °C
>2.58 nm16.217.819.720.017.217.717.818.1
≤2.58 nm83.982.280.380.082.882.382.281.9
Publisher’s Note: MDPI stays neutral with regard to jurisdictional claims in published maps and institutional affiliations.

