Article

Association of Recent Incidence of Foliar Disease in Pine Species in the Southeastern United States with Tree and Climate Variables

1
School of Forest Resources and Conservation, University of Florida, Gainiesville, FL 32611, USA
2
Warnell School of Forestry and Natural Resources, University of Georgia, Athens, GA 30602, USA
*
Author to whom correspondence should be addressed.
Forests 2020, 11(11), 1155; https://doi.org/10.3390/f11111155
Submission received: 2 October 2020 / Revised: 26 October 2020 / Accepted: 29 October 2020 / Published: 30 October 2020
(This article belongs to the Special Issue Impacts of Insect Pests and Diseases on Forest Ecosystems)

Abstract

:
Pine forests in the southern United States are a major contributor to the global economy. Through the last three decades, however, there have been concerns about the decline of pine forests attributed mostly to pests and pathogens. A combination of biotic agents and environmental factors and their interaction often influences outbreaks and the resultant damage in the forests. Southern pines experience periodic mortality from bark beetles and root rot fungi and losses from fusiform rust and pitch canker have long been important for management. In recent years, there is also growing evidence of increasing damage from foliar disease in southern pines. Early detection of diseases following changes in foliar characteristics and assessment of potential risks will help us better utilize our resources and manage these forests sustainably. In this study, we used Forest Inventory and Analysis (FIA) data to explore the intensity of foliar disease in three common pines: loblolly (Pinus taeda L.), longleaf (Pinus palustris Mill.), and slash (Pinus elliottii Engelm.) in spatial and temporal terms using tree-level and climatic variables. Results from a tree-level model suggests that crown ratio may be an important factor in pine foliar disease (p < 0.1). We applied the MaxEnt model, a presence-only species distribution model (SDM), to explore any association of foliar disease incidences with the climatic variables at a landscape level. Results indicate that mean dew point temperature, maximum vapor pressure deficit, and precipitation during cold months had more influence over disease incidences than other climatic variables. While the sample size is limited as this is an emerging disease in the region, our study provides a basis for further exploration of disease detection methods, disease etiology studies, and hazard mapping.

1. Introduction

A deeper understanding of forest health consequences from global economic trade, changing land use, climate change, and management practices is a key area for investigation to provide accurate projections of forest carbon storage and productivity. Emerging pests and pathogens pose a large threat to the ecological and economic stability of forested ecosystems. A triangular interaction between host trees, pests/pathogens, and environmental factors is often described as a major contributor in potential disease outbreaks [1]. With predicted changes in climate, there will be potential shifts in favorable environments for both hosts and pests or pathogens; however, there are counter arguments on whether there would be significant increase in damage from these biotic factors [2]. Early detection is key to slowing or eradicating novel pests or pathogens [3,4,5]. As datasets get bigger and computing power grows, so should our ability to catch emergent problems [6,7].
Pine forests in the southern United States are well recognized as one of the major hotspots of commercial forest management in the world [8,9]. These extensively managed pine forests which span from Virginia to Texas to Florida and are dominated by loblolly (Pinus taeda), longleaf (Pinus palustris), shortleaf (Pinus echinata Mill.), and slash (Pinus elliottii) pines [10,11]. Favorable climatic conditions and available forest land in the region support highly productive forests, making it a valuable source of forest products [12,13,14]. Decades of production-oriented forest management in this area have also resulted in a transformation of major tree species and the entire ecosystems [15,16]. In the last several decades, there have been growing incidences of dieback and mortality of loblolly pine in this region [17,18,19,20,21] resulting in significant economic loss [22]. Catching and eradicating potentially epidemic diseases in these pine forests at an early stage is crucial to securing ecological and economic stability of the region.
Needle cast of southern pines is a generic term used to represent needle disease in southern pine trees from a group of fungi including Lecanosticta (L. acicola is the causal agent of brown spot needle blight of longleaf pine), Lophodermium, Lophodermella, Ploioderma, and Hypodermia among others [23,24,25]. These fungi infect the young or new needles during the late spring to early summer being highly influenced by humid weather [24,25]. While needle cast fungi can live within the plant as endophytes, hence without inducing symptoms, toward the end of the following winter or at the beginning of the spring [26,27], the infected needles usually start developing symptoms by turning yellow or red, giving a scorched look to the foliage, and eventually drop off the tree. Although the impact of needle casts in pine forests, in general, have been considered to be minimal [23,24], there are reports of large regional and perennial outbreaks raising concerns about these pathogens becoming more prevalent. Needle cast disease impacts are mostly attributed to reduction in growth (both overall biomass and radial) and increased mortality of young pine trees [24]. Younger trees or crowns closer to ground tend to be more susceptible to needle cast diseases [25]. Long-term infection can cause a significant negative relationship between disease severity and tree growth [28]. Higher precipitation and humid conditions have been associated with outbreaks of needle cast disease in pine [24,29]. However, association of individual tree traits such as diameter, height and age with this disease have been understudied. Recent reports (Pers. comm. J. Smith) from plantations in the southeastern US of unknown needle cast outbreaks prompted us to investigate the extent and severity of the problem and search for predictors of foliar diseases in southern pine species.
We hypothesize that tree characteristics and climatic variables influence the probability of foliar disease outbreaks in southern pines. In this study, we (i) explore the association of foliar disease in pines with tree-level traits, and (ii) investigate the influence of climatic variables on the probability of the disease incidences at landscape level.

2. Materials and Methods

2.1. Study Area

Our study area spanned the 13 states designated by the U.S. Forest service as the Southern region (Figure 1) [13], which is where an unknown needle cast disease was recently reported (Pers. comm. J. Smith). This region contains a wide variety of forest types, with both natural hardwood and managed pine forests. Pine forests are mostly located in the Coastal Plain and Piedmont areas of the region on soils classified as Alfisols or Ultisols [13]. Spatial analysis was further limited to the extent of the realized distribution of pine forests (loblolly, longleaf, and slash) within this region (Figure 1).

2.2. FIA Data

We initially screened Forest Inventory and Analysis (FIA) data from 1998 to 2019 [30], however we limited our analysis to data in the time period between 2013 and 2019, as there were no incidences of foliar diseases recorded prior to these years (refer Supplementary IV). We also selected only those FIA plots that had recorded at least one loblolly, longleaf or slash pine tree >12.7 cm in diameter at breast height. FIA crews are foresters who go through extensive training and quality checks to assure the validity of data. For this analysis, we considered a disease incident as any record of foliar disease which, according to FIA inventory guidelines, includes any damage to at least 20% of the foliage with at least 50% damage to the needles/leaves [31]. According to the FIA field manual, these damages are particularly caused by fungi with needle loss leading to growth reduction and potential mortality [31]. Although the exact codes that represent foliage damage in FIA data have changed, there has always been this damage available to record by crews in FIA inventory using this same definition. Therefore, since this category of damage was only recorded since 2013, we are assuming that this trend of emerging foliar disease in FIA data matches well with our recent field observations, but cannot definitely determine if the foliar disease was a needle cast. Finally, we subset the data to include only the plots that were measured during winter to late spring (between November and June) to focus on the time period when needle cast symptoms would be most probably observable [26,27].

2.3. Data Analyses

2.3.1. Spatio-Temporal Distribution

We performed an exploratory spatial analysis to understand the distribution of the disease using hot spot analysis in ArcGIS (ArcGIS Desktop: Release 10.7.1, Redlands, CA: Environmental Systems Research Institute). We used each county as the unit to investigate the spatial pattern of foliar disease. Counties within the southeastern states were limited by the overall distribution of FIA plots with at least one individual of the species of interest. First, we calculated the total number of plots affected with disease within each county using the ‘spatial join’ tool. Next, we applied hot spot analysis in ArcGIS spatial tools to explore hot and cold spots in disease distribution, based on Getis-Ord Gi * statistic [32]. We assumed that there was an equal probability of disease incidence across the selected counties. The resulting map shows significant hot or cold spots at different significance levels based on the Getis-Ord Gi * statistic.

2.3.2. Tree-Level Analysis

We wanted to explore the relation between presence or absence of foliar disease with different tree-level variables (Table 1). We wanted to understand if initial tree conditions, size and crown ratio, influenced the likelihood of foliar disease, so we subset the data to include only trees that had a previous measurement reducing disease incidences further. A total of 9567 plots and 149,936 trees were selected for this portion of the study, where 21 plots and 44 individual trees were found to have foliar disease between 2013 and 2019 in the months between November and June.
We used the following generalized linear mixed model with a binomial error distribution [33]
Pr ( y = 1 ) = l o g i t 1 ( α j [ i ] + β k [ i ] )
where, α j [ i ] is the grouping variables with random effects, and β k [ i ] are the individual covariates with fixed effects.
We used this model at tree-level data, where trees were units under consideration for fixed effects and plots were the groups considered for random effects. Each tree would have presence or absence of the disease along with independent covariates including diameter, compacted crown ratio (hereafter referred as ‘crown ratio’), and changes in those variables (Table 1). Crown ratio is defined as the percentage of tree bole supporting foliage which is visually compacted to fill in gaps in the crown [31]. The plot-level random intercept accounts for unmeasured plot level variables and reduces the weight of plots with many infected trees in the model.
We used the glmer function in the R ‘lme4’ package [34] in R version 4.0.2 [35] to model disease incidence. Predictor variables were centered on their means and scaled to one standard deviation to allow for direct comparisons of relative influence of each predictor on the odds that a tree would be infected, thus allowing direct comparison of the strength of each tree-level predictor variable in predicting disease incidence [33]. Variable inflation factor (VIF) for all the variables were calculated [36] to observe any correlation among the predictor variables and avoid over-fitting.

2.3.3. Range-Wide Climatic Analysis

To better understand the climatic correlates that might result in foliar disease, we used the machine learning method: MaxEnt. MaxEnt is a free software [37] that uses Maxentropy theory to predict species distribution probability based on climatic or environmental variables [7,38]. The MaxEnt model is a common approach used in species distribution modelling (SDM), with good prediction performance for a limited number of observations [39,40,41]. In this method, the SDM is based on presence-only data rather than presence-absence data. A major assumption in using the presence-only data is that the sampling should be well representative of the entire landscape [38,42,43], as it is more sensitive to this assumption compared to presence–absence data. Because FIA data is a representative sample of the landscape being investigated [44,45], this assumption was met.
In this analysis, we provide a list of samples with presence-only locations along with the environmental variables (predictors) in a grid format for the entire landscape under investigation. MaxEnt randomly selects background locations from within the landscape and compares them against the locations where the disease was observed. Predictors are used in a machine learning approach where the predictors are first transformed by simple mathematical transformations (e.g., linear, quadratic, and product functions) called features [42] to establish a relationship of the target variable with the environment variables before upscaling the probability to the entire study area. MaxEnt maximizes the gain function which is a penalized form of maximum likelihood function Supplementary Equation. While maximizing the gain function, the model tries to differentiate between presence and background locations. In addition, we adopted an optimum regularization coefficient to maximize AUC from the model validation.
We used annual subsets from the years 2016 and 2017 to run the MaxEnt model separately for each year because these two years had the highest number of observations, with 11 observations for 2016 and 12 observations for 2017. For the MaxEnt model, however, we did not exclude trees without previous measurements since we were only using spatial patterns at the landscape level. To derive the climatic predictor variables, which are listed in Table 2, we used climate mean data from 1981 to 2010 [46] and specific years of data from 2015 and 2016 [47]. For each of the climatic variables, we used deviation from the historical mean (data from respective year–historical mean) to better portray annual variation in the respective climate data. Coldest months from last season includes data from December of the previous year, January of the current year, and February of the current year. We masked out part of western Texas from these environmental layers because there were no representatives of the pine species of interest.

3. Results

3.1. Spatio-Temporal Distribution of Pine Foliar Disease

Based on our Getis-Ord hot spot analysis, we identified those counties that had higher incidences compared to others. Specifically, we observed three hot spots with significant disease observations (Figure 2), and of these, the most intense hot spot was observed in LA, east TX, and MS.
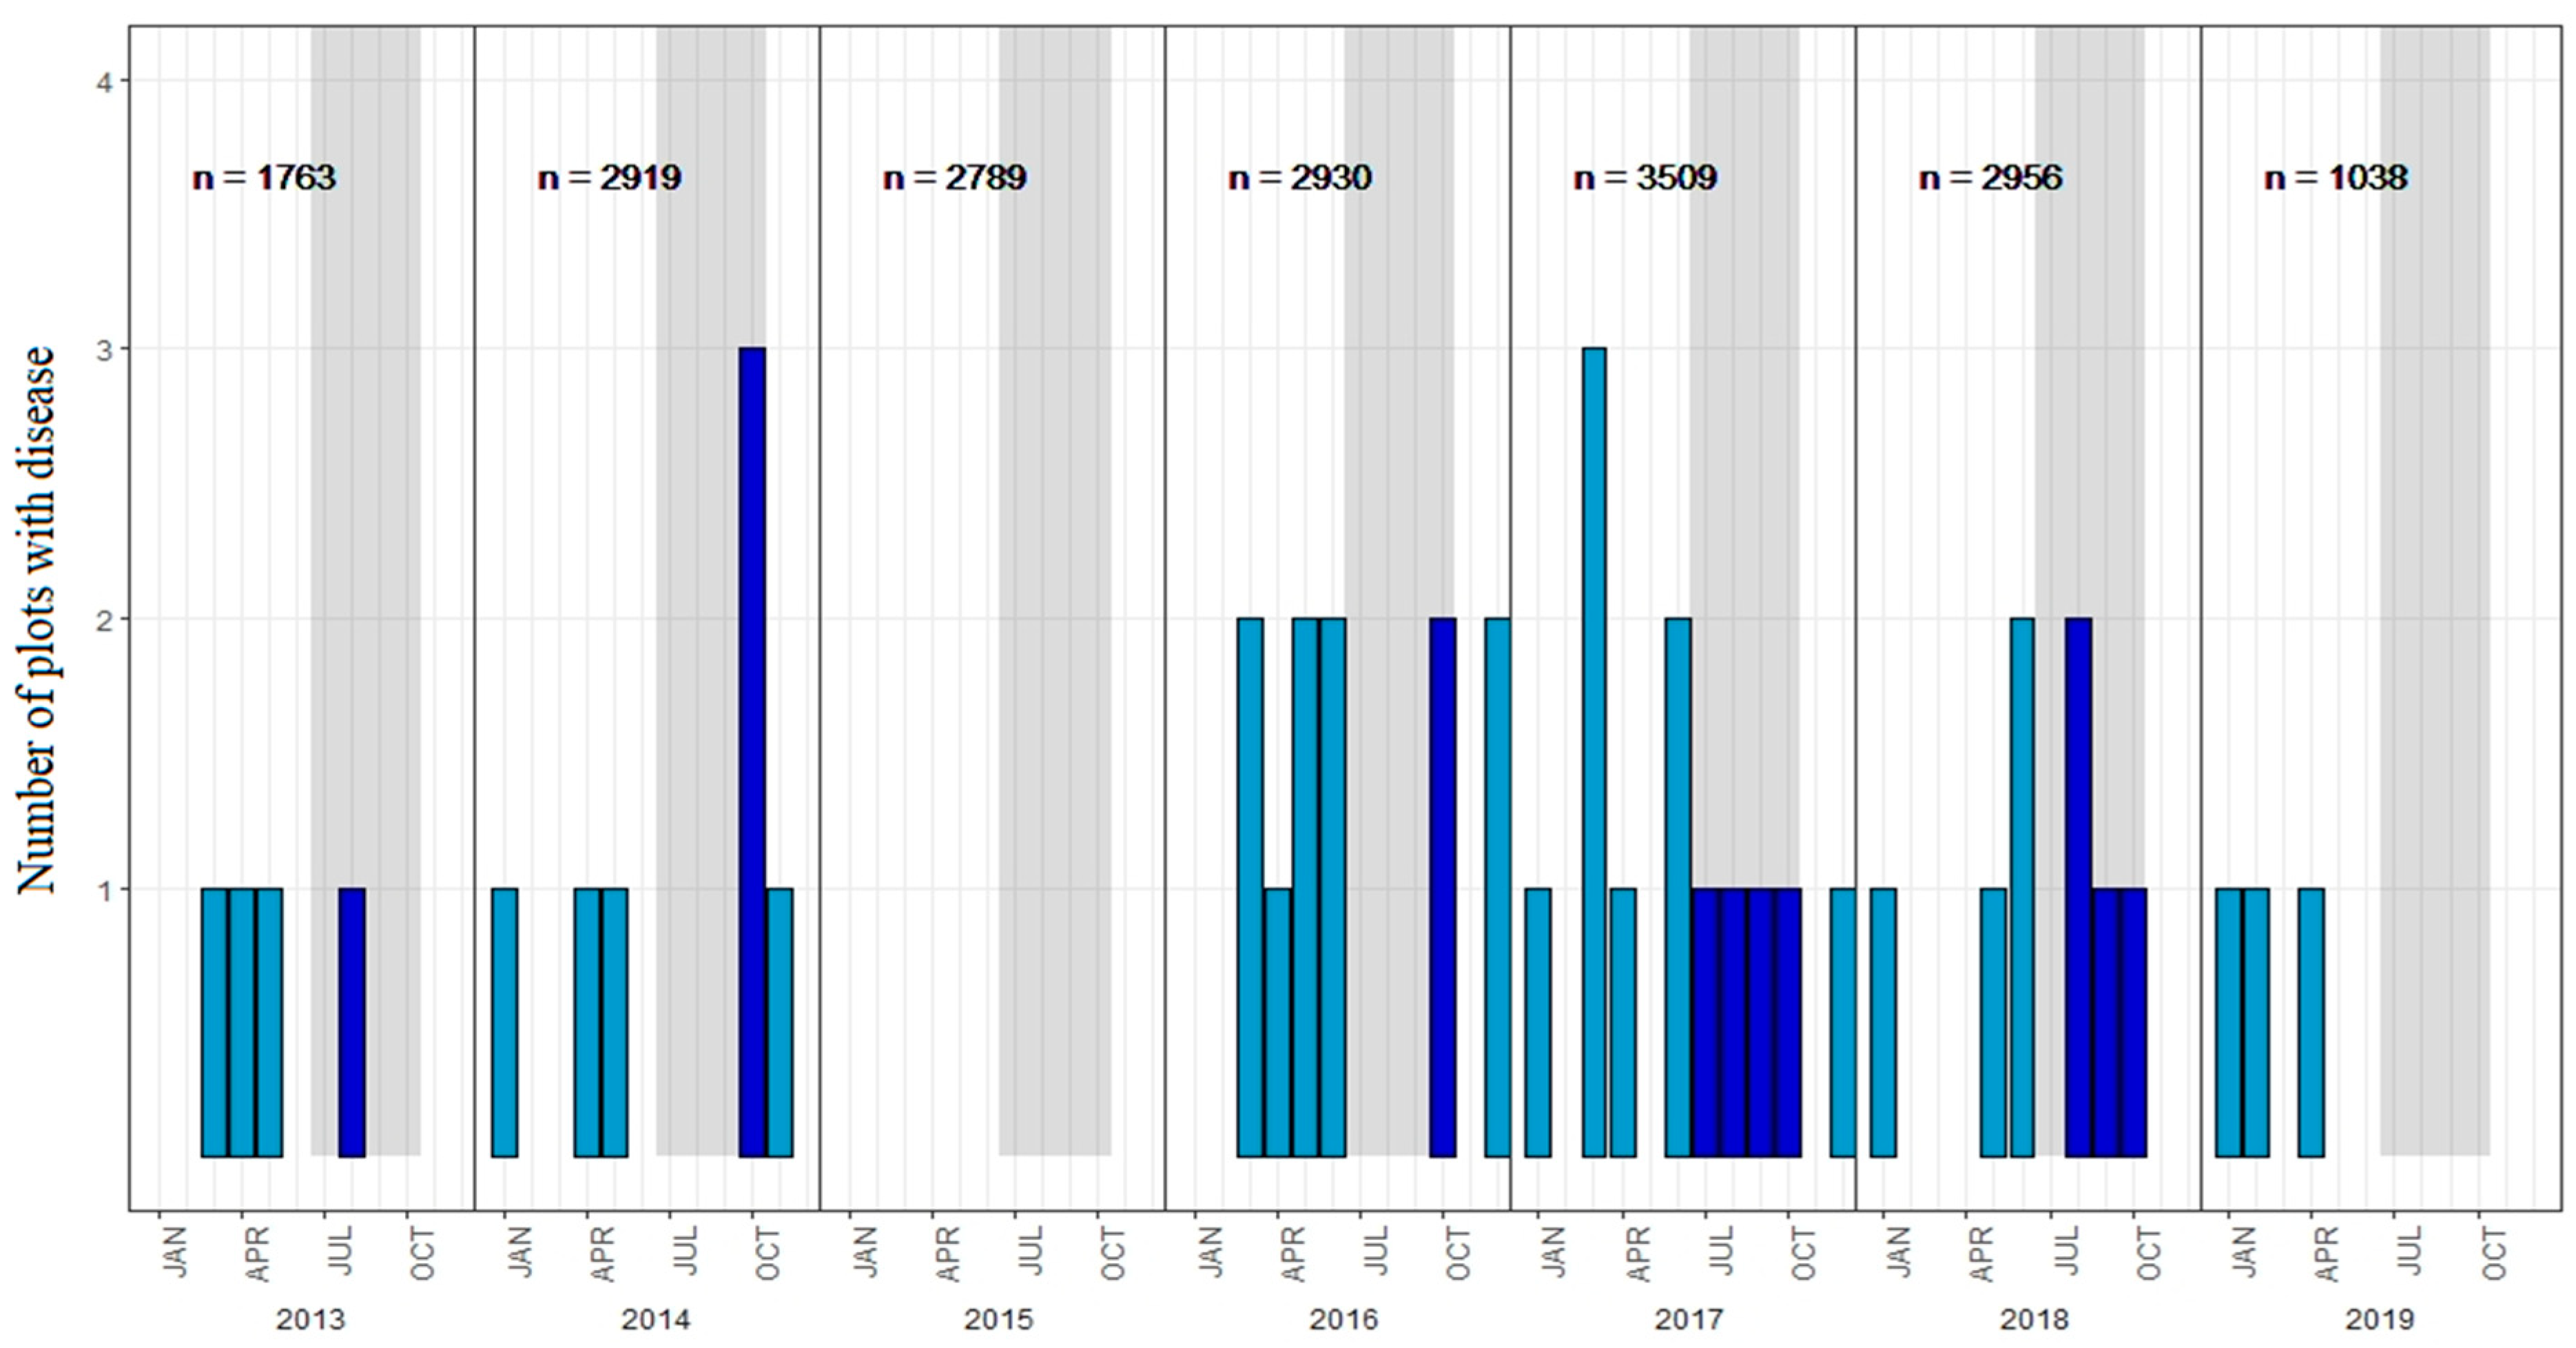
Based on our temporal analysis, some years and some months had higher observations of the disease (Figure 3). The disease was most often recorded during spring months and the highest number of observations were in 2016 and 2017. There were no recorded foliar diseases in 2015.

3.2. Tree Level Analysis

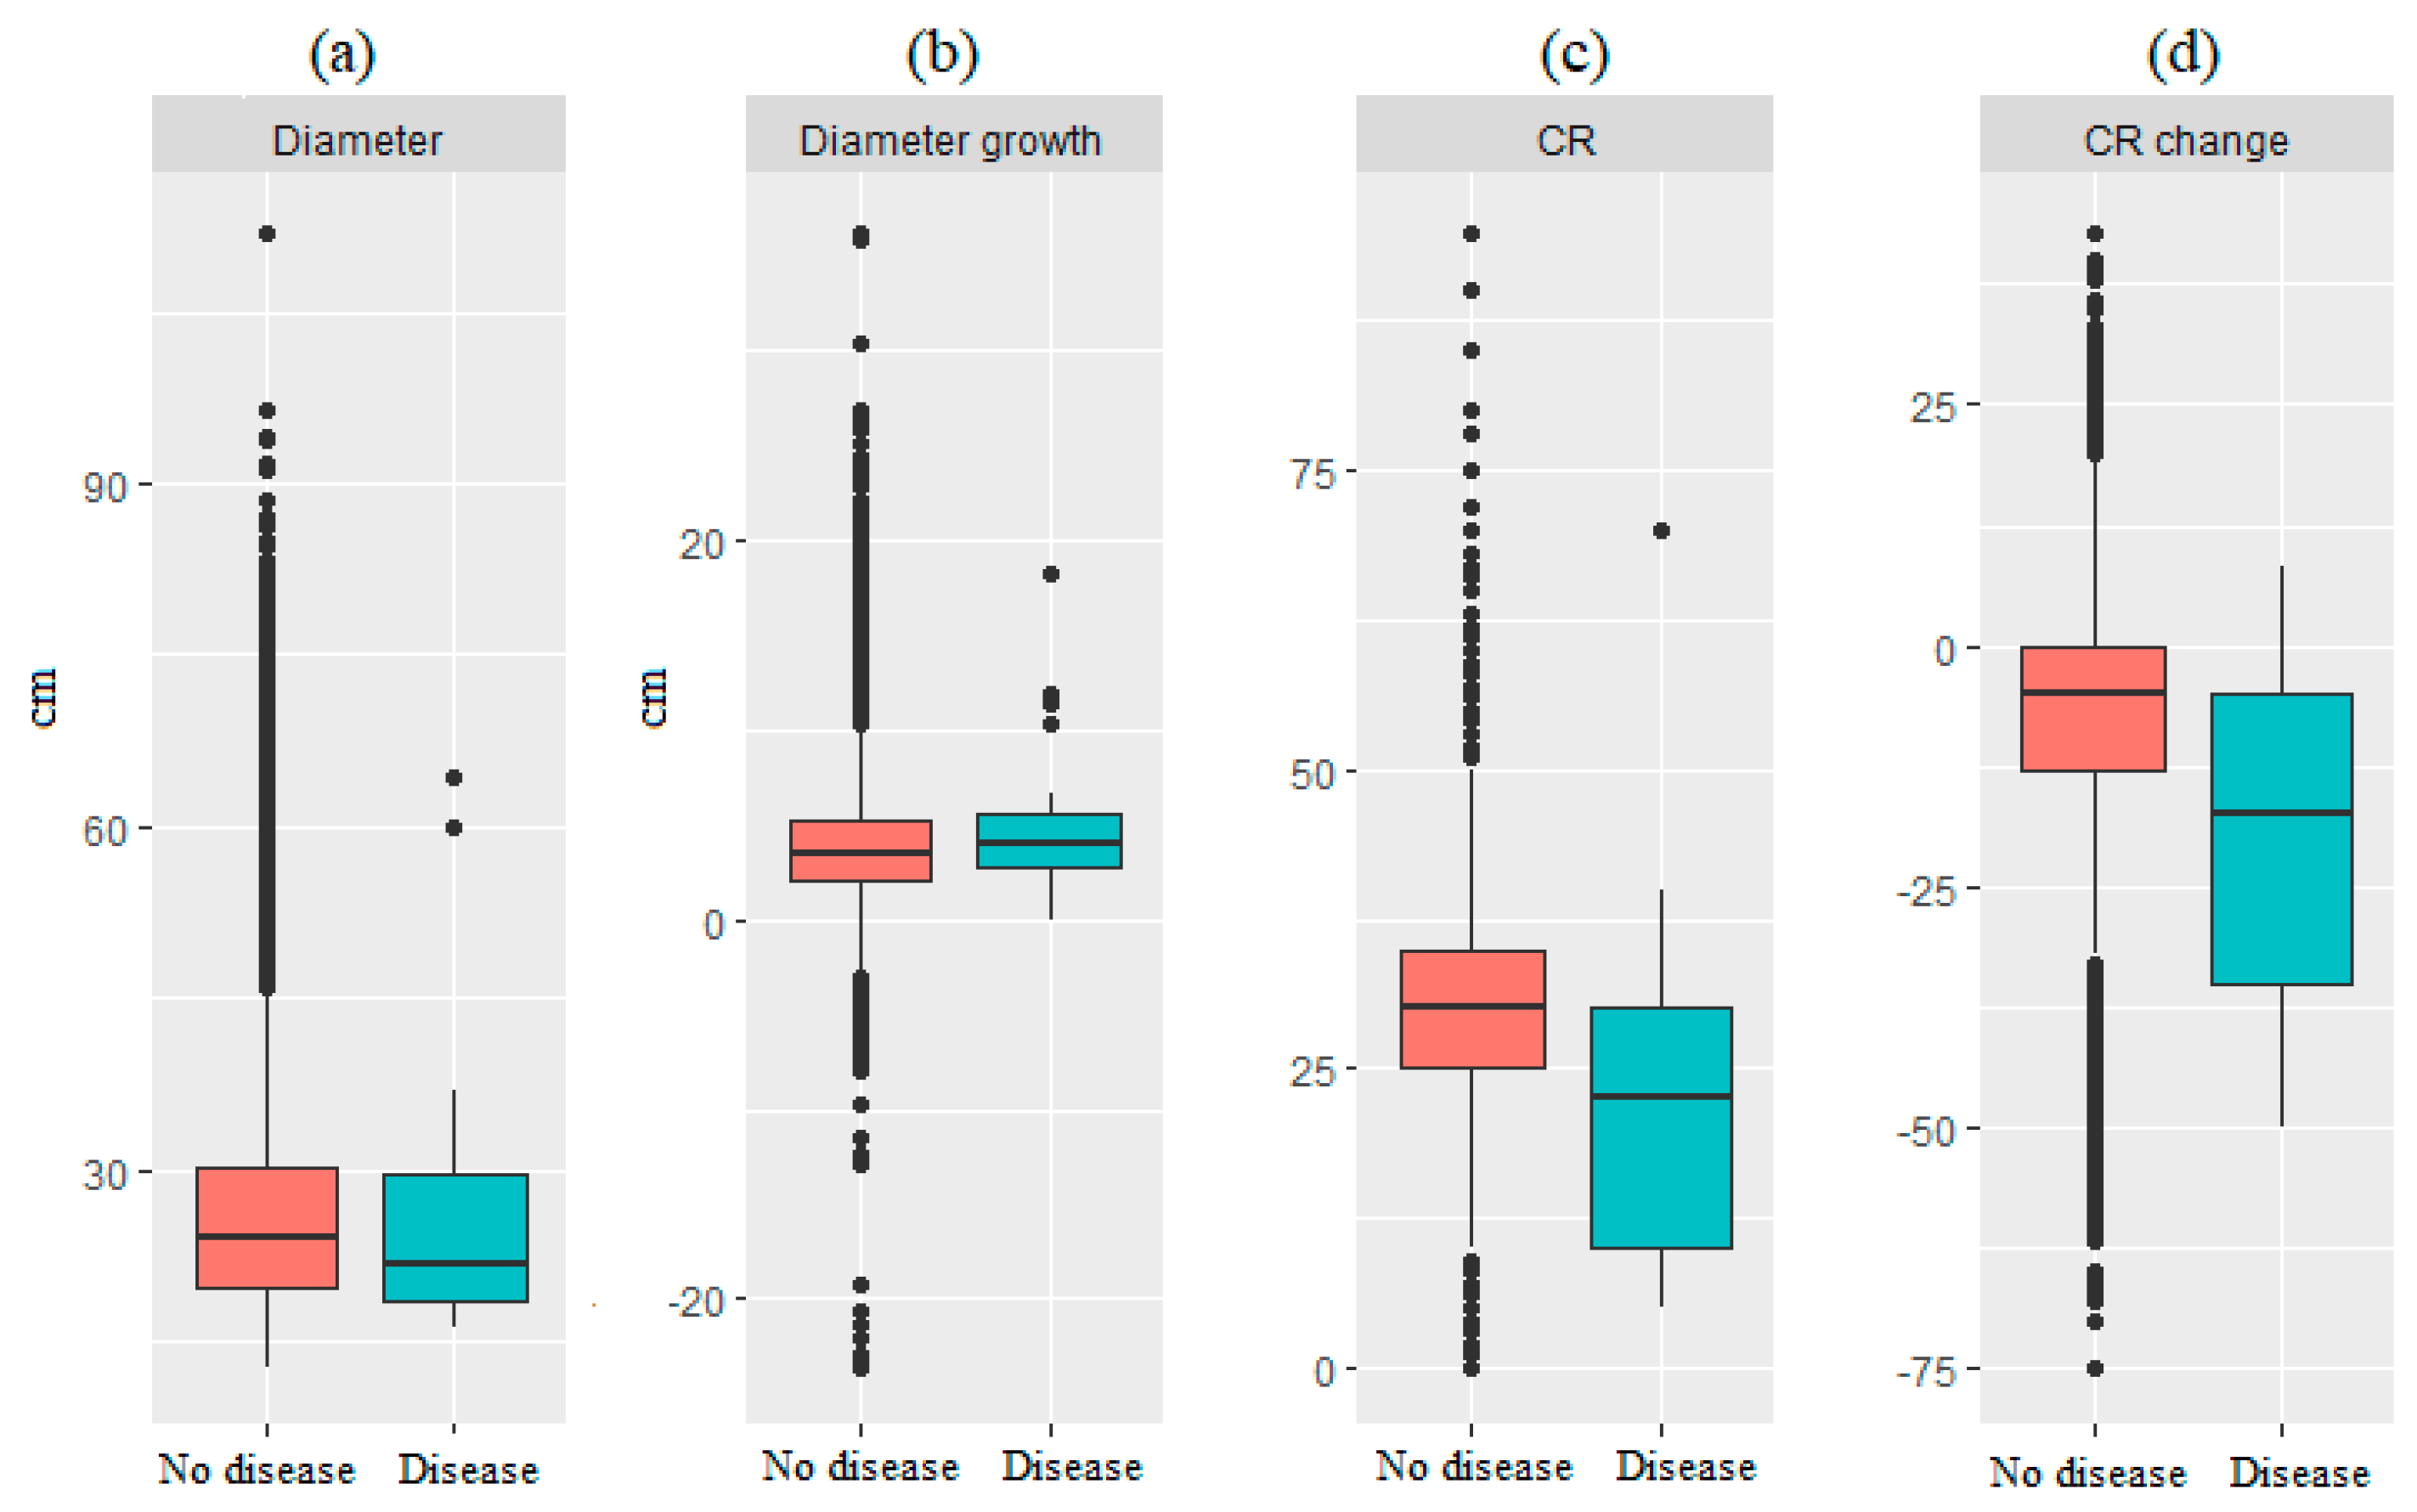
We explored the distribution of each tree level predictor variable against disease presence or absence (Figure 4). Crown ratio and crown ratio change had the greatest apparent difference between trees with and without foliar disease, while only a small difference was observed for the diameter variables (i.e., diameter and diameter growth).
We explored the relationships of the following explanatory variables with the disease, using a mixed modeling approach as given below.
Disease ~ Diameter + Diameter Growth + Crown Ratio + Crown Ratio change + (1|Plot)
The use of a mixed model was justified as a large portion of total variance was captured by the plot variable (random effect) which means there was a good deal of difference among plots in the baseline probability of having a diseased tree. We tested fixed effect components using both Z-test and chi-square test. VIF among all variables were lower than 1.41, suggesting weak multicollinearity among explanatory variables. While crown ratio showed some signal in predicting the disease (Table 3) it was not statistically significant, and the other predictors were not as strong. Trees with larger crown ratios were associated with lower disease probability.

3.3. Range-Wide Climatic Variables

We tested multiple MaxEnt models and selected models for 2016 and 2017 that had the highest AUC values by year (Table 4). For 2016, the best AUC was observed with the beta multiplier of 0.90 while for the 2017 model, best results were found at 0.10 beta multiplier. Model for 2016 had an AUC of 0.73 which would produce a prediction well above that of a random chance. The performance of the 2017 model was slightly lower compared to 2016 model, with AUC of 0.70. Most influential climatic predictors in both models were mean dew point temperature, maximum vapor pressure deficit, and precipitation during cold months in decreasing order for both models. Mean dew point temperature was found most dominant in the 2016 model, while no such strong influence of any single predictor was seen for the 2017 model. Three of the predictors in the 2016 model and two in the 2017 model were not used at all in the selected models owing either to their low influence or correlation with other predictors.
The jackknife test for the 2016 model further highlights that mean dew point temperature and maximum vapor pressure deficit are strong predictors of the disease even if used alone (Figure S1), with 0.68 AUC for the former and 0.67 AUC for the later predictor. By leaving out mean dew point temperature or maximum vapor pressure deficit from the overall model, we would only achieve a AUC of 0.64 and 0.67, respectively. On the other hand, removing either of the unused variables from the overall model did not change the model’s explanatory power. We removed annual mean temperature and annual mean precipitation from the 2017 model as these variables reduced overall AUC. Among the predictor variables used, results suggest that mean dew point temperature and maximum vapor pressure deficit have strong predictive power as well as marginal influence.
Both the 2016 and 2017 models suggest that mean dew point temperature close to normal is related to higher disease probability and major deviation from normal would reduce probability. The response curve for maximum vapor pressure deficit behaved differently for two models (Figure S2). Based on the 2016 model, higher vapor pressure deficit compared to normal would suggest higher disease presence, but in 2017 the relationship was the opposite until the point where maximum vapor pressure deficit was 3 hpa higher than the normal. After this threshold, however, it behaved similar to the 2016 model where disease probability increased with higher vapor pressure deficit compared to normal. Both SDM models suggest higher disease probability with mean precipitation during cold months being close or slightly less than normal. After specific points (corresponding to 50 mm for the 2016 model and 10 mm for the 2017 model), higher mean precipitation than normal suggested decrease in disease probability compared to lower precipitation.
MaxEnt models produced logistic output maps showing the probability of disease distribution ranging from 0 to 1 across the landscape (Figure 5). The models were based on the gain function (Supplementary I) added from a total of 12 features (linear and quadratic features) derived from each of the 6 climatic variables.

4. Discussion

Early detection of emerging pests and diseases is a critical step to halting outbreaks [4,48]. However, the lack of extensive research regarding the epidemiology of their possible causal agents, which usually characterizes emerging diseases, makes the task even more difficult. While models built with limited data have limited statistical power, in the case of emerging diseases, they are nevertheless a useful tool, as they can identify trends that can provide support for the design of detection protocols for further investigation. Needle casts of southern pines are a relatively unstudied phenomenon, especially if compared with other more aggressive needle casts and blights such as Swiss needle cast [49] or Dothistroma needle blight [50]. The MaxEnt SDM model developed in this study suggested an association of the climatic variables with the emergence of needle casts on southern pines. We restricted the type of predictors used in the model to climatic variables as this was the primary focus of our study. The 2016 model produced more areas with higher disease probability compared to the 2017 model, but this was expected because the two models had different regularization constants (beta multipliers), which produce different levels of smoothing in the output probability. We would expect better model performance with larger sample sizes, but given our limited observational data, MaxEnt is the most appropriate SDMs as it outperforms most of other modeling approaches [39,40,41]. Hernandez et al. 2006 [41] found good model performance with MaxEnt compared to other SDMs with a sample size as low as 5 when the sample is well representative (unbiased) of the landscape like the FIA sample.
While a careful consideration of environmental factors is important for MaxEnt, further studies with edaphic and topographic variables may enhance the goodness of fit of the model [51]. We found that, at the range level, incidence of foliar disease was related to mean dewpoint, vapor pressure deficit, and cold season precipitation. The climatic factors we identified as important to disease presence—precipitation and humidity—are in agreement with some previous studies of needle cast diseases [24,29,52], however the direction of the associations with disease did not match well with these previous studies. For example, Drenkhan [29] found that Swiss needle cast incidence is related to higher precipitation and humidity using summer-time precipitation and humidity, and Wyka et al. [52] found that warmer climate and wetter springs favor development of needle diseases on white pine (P. strobus L.), but we found lower probability of disease with higher winter precipitation and humidity. One of the reasons for this mismatch could be the difference in the seasons used in each analysis. It is also noteworthy that previous studies, although within the broad umbrella of needle casts, focused on different fungal species and plant hosts. Our results suggest a degree of annual variability in the prevalence of foliar diseases in southern pine species, which is potentially driven by these climatic factors. Monitoring programs and remote sensing campaigns aimed at detecting needle casts in southern pines could be targeted towards areas experiencing such conditions during the critical late winter and early spring months to assess the degree and severity of infection. Additionally, raising the awareness of this emergent disease may help lead to greater reporting of incidents, which in turn would help provide better understanding of the phenomenon.
At the tree level, the vast majority of monitored trees did not meet the threshold for recording foliar disease during the years included in this study, but those that did, tended to have smaller crown ratios. This prompted us to ask the question whether this was a possible cause or the result of the disease. The FIA field manual [31] indicates that damaged or diseased foliage is not supposed to be excluded from estimating the crown ratio of a tree, which suggests that the crew members should not have reduced the crown ratio due to the presence of disease, but we cannot rule out bias in this measurement due to loss of needles. At any rate, the change in crown ratio between censuses was not significant, which suggests that the diseased trees had a stable crown ratio between censuses, which further suggests a causal relation between crown ratio and likelihood of foliar disease. The limited number of data on the disease incidence is likely a contributing factor to the poor association between tree-level traits and disease [53]. Moreover, the detail provided by FIA data is not enough to allow the discrimination of needle cast from other foliar diseases. To focus on highly probable cases of needle cast, we limited our disease observation to the seasonal window when needle cast diseases are likely to be symptomatic, but we cannot rule out some level of human error in misidentification of foliage damage from some factors other than fungi, hence introducing some noise to the observed data. Cases falling below the damage code thresholds could also lead to underrepresentation of the disease abundance across the study area.
While the term needle cast for southern pines is generic and includes several species, we have ongoing studies to better identify the causal agents of the recently emerging disease in the southern pine forests that will complement this study, and hopefully provide forest managers with useful information for the development of a management strategy. Further work with a higher number of observations, as well as better data filtering and ground truthing, could be helpful in confirming the identified associations of the disease at individual and range level. Limited data also suggests that foliar damage was not a widespread problem during the years included in this study, but continued monitoring is crucial to detect a potential increase in prevalence in a timely manner.

5. Conclusions

In this study, we explored whether tree-level variables could be related to foliar disease in the southeastern pine species. We observed a marginal association of crown ratio with the disease occurrence while there was no significant relationship with tree diameter. We also found that there was no significant change in crown ratio or diameter for the trees affected by the foliar disease between the last two inventories. A small number of foliar disease observations limits our inference about foliar diseases in southern pine species studied. The MaxEnt model, which we used to predict disease probability based on environmental variables, produced disease probability maps across the landscape despite the low incidence and supported our hypothesis that the foliar disease was influenced by the temporal patterns in precipitation and humidity. Continued monitoring and identification of causal agents will help pinpoint the disease dynamics and their impact on southern pines.

Supplementary Materials

The supplement area available as designated. The following are available online at https://www.mdpi.com/1999-4907/11/11/1155/s1, Figure S1. Jackknife test using AUC on test data for different predictor variables for the 2016 and 2017 models. We removed annual mean temperature and annual mean precipitation from the 2017 model due to correlation with other predictor variables. Figure S2. Response curves of three most influential climatic variables for 2016 and 2017 models. These curves are based on the MaxEnt model created using only each of these variables.

Author Contributions

K.P., and D.J.J. conceived this study. K.P. and D.J.J. performed the analyses and wrote the initial drafts of the manuscript. K.P., J.S., T.Q., C.V., and D.J.J. contributed to the final version of the manuscript. All authors have read and agreed to the published version of the manuscript.

Funding

Support for this project was provided by the USDA FS FHP Emerging Pest Line Program (Challenge Cost Share Agreements with UGA no. 19-CS-11330129-036 and Challenge Cost Share Agreements with UFL P0128048).

Acknowledgments

We would like to thank our funding agencies for supporting this study. We also extend our thanks to the lab members from Global Forest Dynamics Lab at University of Florida, for their valuable input.

Conflicts of Interest

The authors declare no conflict of interest.

References

  1. Stevens, R.B. Cultural practices in disease control. Chapter 10 in J.G. In Plant Pathology, an Advanced Treatise; Horsfall, J.G., Dimond, A.E., Eds.; Academic Press: New York, NY, USA, 1960; Volume 3, pp. 357–429. [Google Scholar]
  2. Loehle, C.; Idso, C.; Wigley, T.B. Physiological and ecological factors influencing recent trends in United States forest health responses to climate change. For. Ecol. Manag. 2016, 363, 179–189. [Google Scholar] [CrossRef]
  3. Moody, M.E.; Mack, R.N. Controlling the Spread of Plant Invasions: The Importance of Nascent Foci. J. Appl. Ecol. 1988, 25, 1009. [Google Scholar] [CrossRef]
  4. Zamora, D.L.; Thill, D.C. Early detection and eradication of new weed infestations. In Biology and Management of Noxious Rangeland Weeds; Sheley, R.L., Petroff, J.K., Eds.; Oregon State University Press: Corvallis, OR, USA, 1999; pp. 73–84. [Google Scholar]
  5. Lawrence, R.; Labus, M. Early Detection of Douglas-Fir Beetle Infestation with Subcanopy Resolution Hyperspectral Imagery. West. J. Appl. For. 2003, 18, 202–206. [Google Scholar] [CrossRef] [Green Version]
  6. Venette, R.C.; Kriticos, D.J.; Magarey, R.D.; Koch, F.H.; Baker, R.H.A.; Worner, S.P.; Raboteaux, N.N.G.; McKenney, D.W.; Dobesberger, E.J.; Yemshanov, D.; et al. Pest Risk Maps for Invasive Alien Species: A Roadmap for Improvement. Bioscience 2010, 60, 349–362. [Google Scholar] [CrossRef]
  7. Ikegami, M.; Jenkins, T.A.R. Estimate global risks of a forest disease under current and future climates using species distribution model and simple thermal model—Pine Wilt disease as a model case. For. Ecol. Manag. 2018, 409, 343–352. [Google Scholar] [CrossRef]
  8. Fox, T.R.; Jakela, E.J.; Allen, H.L. The development of pine plantation silviculture in the southern United States. J. Forest. 2007, 105, 337–347. [Google Scholar] [CrossRef]
  9. McNichol, B.H.; Montes, C.R.; Barnes, B.F.; Nowak, J.T.; Villari, C.; Gandhi, K.J. Interactions between southern Ips bark beetle outbreaks, prescribed fire, and loblolly pine (Pinus taeda L.) mortality. For. Ecol. Manag. 2019, 446, 164–174. [Google Scholar] [CrossRef]
  10. Prestemon, J.P.; Abt, R.C. Chapter 13: Timber products supply and demand. In Southern Forest Resource Assessment; General Tech. Rpt. SRS-53; Wear, D.N., Greis, J.G., Eds.; U.S. Forest Service, Southern Research Station: Asheville, NC, USA, 2002; pp. 299–325. [Google Scholar]
  11. Gaby, L.I. The Southern Pines, an American Wood; U.S. Forest Service, F-256: Washington, DC, USA, 1985. [Google Scholar]
  12. Schultz, R.P. Loblolly Pine: The Ecology and Culture of Loblolly Pine (Pinus taeda L.). In Agricultural Handbook 713; U.S. Department of Agriculture, Forest Service: Washington, DC, USA, 1997; p. 493. [Google Scholar]
  13. Wear, D.N.; Greis, J.G. The Southern Forest Futures Project: Summary Report; General Technical Report, SRS-168; U.S. Department of Agriculture, Forest Service, Southern Research Station: Asheville, NC, USA, 2012. [Google Scholar]
  14. Hanson, C.; Yonavjak, L.; Clarke, C.; Minnemeyer, S.; Boisrobert, L.; Leach, A.; Schleeweis, K. Southern Forests for the Future; World Resources Institute: Washington, DC, USA, 2010; ISBN 978-1-56973-737-8. [Google Scholar]
  15. Noss, R.F.; LaRoe, E.T.; Scott, J.M. Endangered Ecosystems of the United States: A Preliminary Assessment of Loss and Degradation; U.S. Department of the Interior, National Biological Service: Washington, DC, USA, 1995. [Google Scholar]
  16. Mcintyre, R.K.; McCall, B.B.; Wear, D.N.; Kirkman, L.K.; Jack, S.B. The Social and Economic Drivers of the Southeastern Forest Landscape. In Ecological Restoration and Management of Longleaf Pine Forests; Kirkman, L.K., Jack, S.B., Eds.; CRC Press: Boca Raton, FL, USA, 2018; pp. 39–68. [Google Scholar]
  17. Brown, H.D.; McDowell, W.E. Status of Loblolly Pine Die-Off on the Oakmulgee District, Talladega National Forest, Alabama—1968; USDA Forest Service Rep. 69-2-28; Forest Insect & Disease Management: Pineville, LA, USA, 1968; p. 22. [Google Scholar]
  18. Hess, N.J.; Otrosina, W.J.; Carter, E.A.; Steinman, J.R.; Jones, J.P.; Eckhardt, L.G.; Weber, A.M.; Walkinshaw, C.H. Assessment of loblolly pine decline in central Alabama. In Eleventh Biennial Southern Silvicultural Research Conference; Outcalt, K.W., Ed.; USDA Forest Service Gen: Asheville, NC, USA, 2002; pp. 558–564. [Google Scholar]
  19. Coyle, D.R.; Klepzig, K.D.; Koch, F.H.; Morris, L.A.; Nowak, J.T.; Oak, S.W.; Otrosina, W.J.; Smith, W.D.; Gandhi, K.J. A review of southern pine decline in North America. For. Ecol. Manag. 2015, 349, 134–148. [Google Scholar] [CrossRef]
  20. Coyle, D.R.; Barnes, B.F.; Klepzig, K.D.; Koch, F.H.; Morris, L.A.; Nowak, J.T.; Otrosina, W.J.; Smith, W.D.; Gandhi, K.J.K. Abiotic and Biotic Factors Affecting Loblolly Pine Health in the Southeastern United States. For. Sci. 2019, 66, 145–156. [Google Scholar] [CrossRef]
  21. Duerr, D.A.; Mistretta, P.A. Invasive pests—Insects and diseases. In The Southern Forest Futures Project: Technical Report; Gen. Tech. Rep. SRS-GTR-178; Wear, D.N., Greis, J.G., Eds.; USDA-Forest Service, Southern Research Station: Asheville, NC, USA, 2013; pp. 457–508. [Google Scholar]
  22. Pye, J.M.; Holmes, T.P.; Prestemon, J.P.; Wear, D.N. Economic impacts of the southern pine beetle. In Southern Pine Beetle II; Coulson, R.N., Klepzig, K.D., Eds.; US Department of Agriculture Forest Service: Asheville, NC, USA, 2011; pp. 213–222. [Google Scholar]
  23. Barry, J.E.; Rowe, K.D.; Ford, V.L.; Kirkpartick, T.L. Pine Needle Diseases in Arkansas. Fact Sheet FSA5022. University of Arkansas Research and Extension. 2008. Available online: https://www.uaex.edu/publications/PDF/FSA-5022.pdf (accessed on 16 June 2020).
  24. Boyce, J.S., Jr. Needle cast of southern pines. In Forest Pest Leaflet 28; USDA Forest Service: Washington, DC, USA, 1969; p. 4. [Google Scholar]
  25. Barnard, E.L.; Ash, E.C. Needle Cast of Pines in Florida; Plant Pathology Circular No. 368; Florida Department of Agriculture and Consumer Services: Tallahassee, FL, USA, 1998; pp. 1–4. [Google Scholar]
  26. Boyce, J.S., Jr. Hypoderma needle blight of southern pines. J. For. 1954, 52, 496–498. [Google Scholar]
  27. Sinclair, W.A.; Lyon, H.H.; Johnson, W.T. Diseases of Trees and Shrubs; Comstock Publishers; Cornell University Press: Ithaca, NY, USA, 1987; p. 574. [Google Scholar]
  28. Jansons, Ā.; Zeltiņš, P.; Donis, J.; Neimane, U. Long-Term Effect of Lophodermium Needle Cast on The Growth of Scots Pine and Implications for Financial Outcomes. Forests 2020, 11, 718. [Google Scholar] [CrossRef]
  29. Drenkhan, R. Epidemiological Investigation of Pine Foliage Diseases by the Use of the Needle Trace Method. Ph.D. Thesis, Estonian University of Life Sciences, Tartu, Estonia, 2011. [Google Scholar]
  30. Bechtold, W.A.; Patterson, P.L. The Enhanced Forest Inventory and Analysis Program-National Sampling Design and Estimation Procedures; Gen. Tech. Rep. SRS-80; US Department of Agriculture, Forest Service, Southern Research Station: Asheville, NC, USA, 2005; p. 85. [Google Scholar]
  31. USFS. Forest Inventory and Analysis, National Core Field Guide, Volume I: Field Data Collection Procedures for Phase 2 Plots; U.S. Department of Agriculture, Forest Service: Washington, DC, USA, 2019. [Google Scholar]
  32. Getis, A.; Ord, J.K. The Analysis of Spatial Association by Use of Distance Statistics. Geogr. Anal. 2010, 24, 189–206. [Google Scholar] [CrossRef]
  33. Gelman, A.; Hill, J. Data Analysis Using Regression and Multilevel/Hierarchical Models; Cambridge University Press (CUP): Cambridge, UK, 2006; p. 625. [Google Scholar]
  34. Bates, D.; Mächler, M.; Bolker, B.; Walker, S. Fitting Linear Mixed-Effects Models Usinglme4. J. Stat. Softw. 2015, 67, 1–48. [Google Scholar] [CrossRef]
  35. R Core Team. R: A Language and Environment for Statistical Computing; Foundation for Statistical Computing: Vienna, Austria, 2020. [Google Scholar]
  36. Fox, J.; Weisberg, S. An R Companion to Applied Regression, 3rd ed.; Sage: Thousand Oaks, CA, USA, 2019; Available online: https://socialsciences.mcmaster.ca/jfox/Books/Companion/ (accessed on 9 July 2020).
  37. Phillips, S.J.; Dudík, M.; Schapire, R.E. [Internet] Maxent Software for Modeling Species Niches and Distributions (Version 3.4.1). 2020. Available online: http://biodiversityinformatics.amnh.org/open_source/maxent/ (accessed on 20 July 2020).
  38. Phillips, S.J.; Anderson, R.P.; Schapire, R.E. Maximum entropy modeling of species geographic distributions. Ecol. Model. 2006, 190, 231–259. [Google Scholar] [CrossRef] [Green Version]
  39. Anderson, R.P.; Gonzalez, I. Species-specific tuning increases robustness to sampling bias in models of species distributions: An implementation with Maxent. Ecol. Model. 2011, 222, 2796–2811. [Google Scholar] [CrossRef]
  40. Wisz, M.S.; Hijmans, R.J.; Elith, J.; Peterson, A.T.; Graham, C.H.; Guisan, A.; NCEAS Predicting Species Distributions Working Group†. Effects of sample size on the performance of species distribution models. Divers. Distrib. 2008, 14, 763–773. [Google Scholar] [CrossRef]
  41. Hernandez, P.A.; Graham, C.H.; Master, L.L.; Albert, D.L. The effect of sample size and species characteristics on performance of different species distribution modeling methods. Ecography 2006, 29, 773–785. [Google Scholar] [CrossRef]
  42. Merow, C.; Smith, M.J.; Silander, J.A. A practical guide to MaxEnt for modeling species’ distributions: What it does, and why inputs and settings matter. Ecography 2013, 36, 1058–1069. [Google Scholar] [CrossRef]
  43. Radosavljevic, A.; Anderson, R.P. Making better Maxentmodels of species distributions: Complexity, overfitting and evaluation. J. Biogeogr. 2013, 41, 629–643. [Google Scholar] [CrossRef]
  44. Derose, R.J.; Wang, S.-Y.; Shaw, J.D. Feasibility of High-Density Climate Reconstruction Based on Forest Inventory and Analysis (FIA) Collected Tree-Ring Data. J. Hydrometeorol. 2013, 14, 375–381. [Google Scholar] [CrossRef] [Green Version]
  45. Tinkham, W.T.; Mahoney, P.R.; Hudak, A.T.; Domke, G.M.; Falkowski, M.J.; Woodall, C.; Smith, A.M.S. Applications of the United States Forest Inventory and Analysis dataset: A review and future directions. Can. J. For. Res. 2018, 48, 1251–1268. [Google Scholar] [CrossRef]
  46. PRISM Climate Group. Annual Dataset Covering the Conterminous U.S. Oregon State University, 2019. Available online: http://prism.oregonstate.edu (accessed on 28 April 2020).
  47. PRISM Climate Group. Monthly 30-Year “Normal” Dataset Covering the Conterminous U.S, (1981–2010). Oregon State University, 2012. Available online: http://prism.oregonstate.edu (accessed on 28 April 2020).
  48. Meentemeyer, R.K.; Anacker, B.L.; Mark, W.; Rizzo, D.M. Early detection of emerging forest disease using dispersal estimation and ecological niche modeling. Ecol. Appl. 2008, 18, 377–390. [Google Scholar] [CrossRef] [PubMed]
  49. Hansen, E.M.; Stone, J.K.; Capitano, B.R.; Rosso, P.; Sutton, W.; Winton, L.; Kanaskie, A.; McWilliams, M.G. Incidence and Impact of Swiss Needle Cast in Forest Plantations of Douglas-fir in Coastal Oregon. Plant Dis. 2000, 84, 773–778. [Google Scholar] [CrossRef] [Green Version]
  50. Bradshaw, R.E. Dothistroma (red-band) needle blight of pines and the dothistromin toxin: A review. For. Pathol. 2004, 34, 163–185. [Google Scholar] [CrossRef]
  51. Gearman, M.; Blinnikov, M.S. Mapping the Potential Distribution of Oak Wilt (Bretziella fagacearum) in East Central and Southeast Minnesota Using Maxent. J. For. 2019, 117, 579–591. [Google Scholar] [CrossRef]
  52. Wyka, S.A.; Smith, C.; Munck, I.A.; Rock, B.N.; Ziniti, B.L.; Broders, K. Emergence of White Pine Needle Damage (WPND) in the northeastern U.S. is associated with changes in pathogen pressure in response to climate change. Glob. Chang. Biol. 2016, 23, 394–405. [Google Scholar] [CrossRef]
  53. Fokkema, M.; Edbrooke-Childs, J.; Wolpert, M. Generalized linear mixed-model (GLMM) trees: A flexible decision-tree method for multilevel and longitudinal data. Psychother. Res. 2020, 1–13. [Google Scholar] [CrossRef]
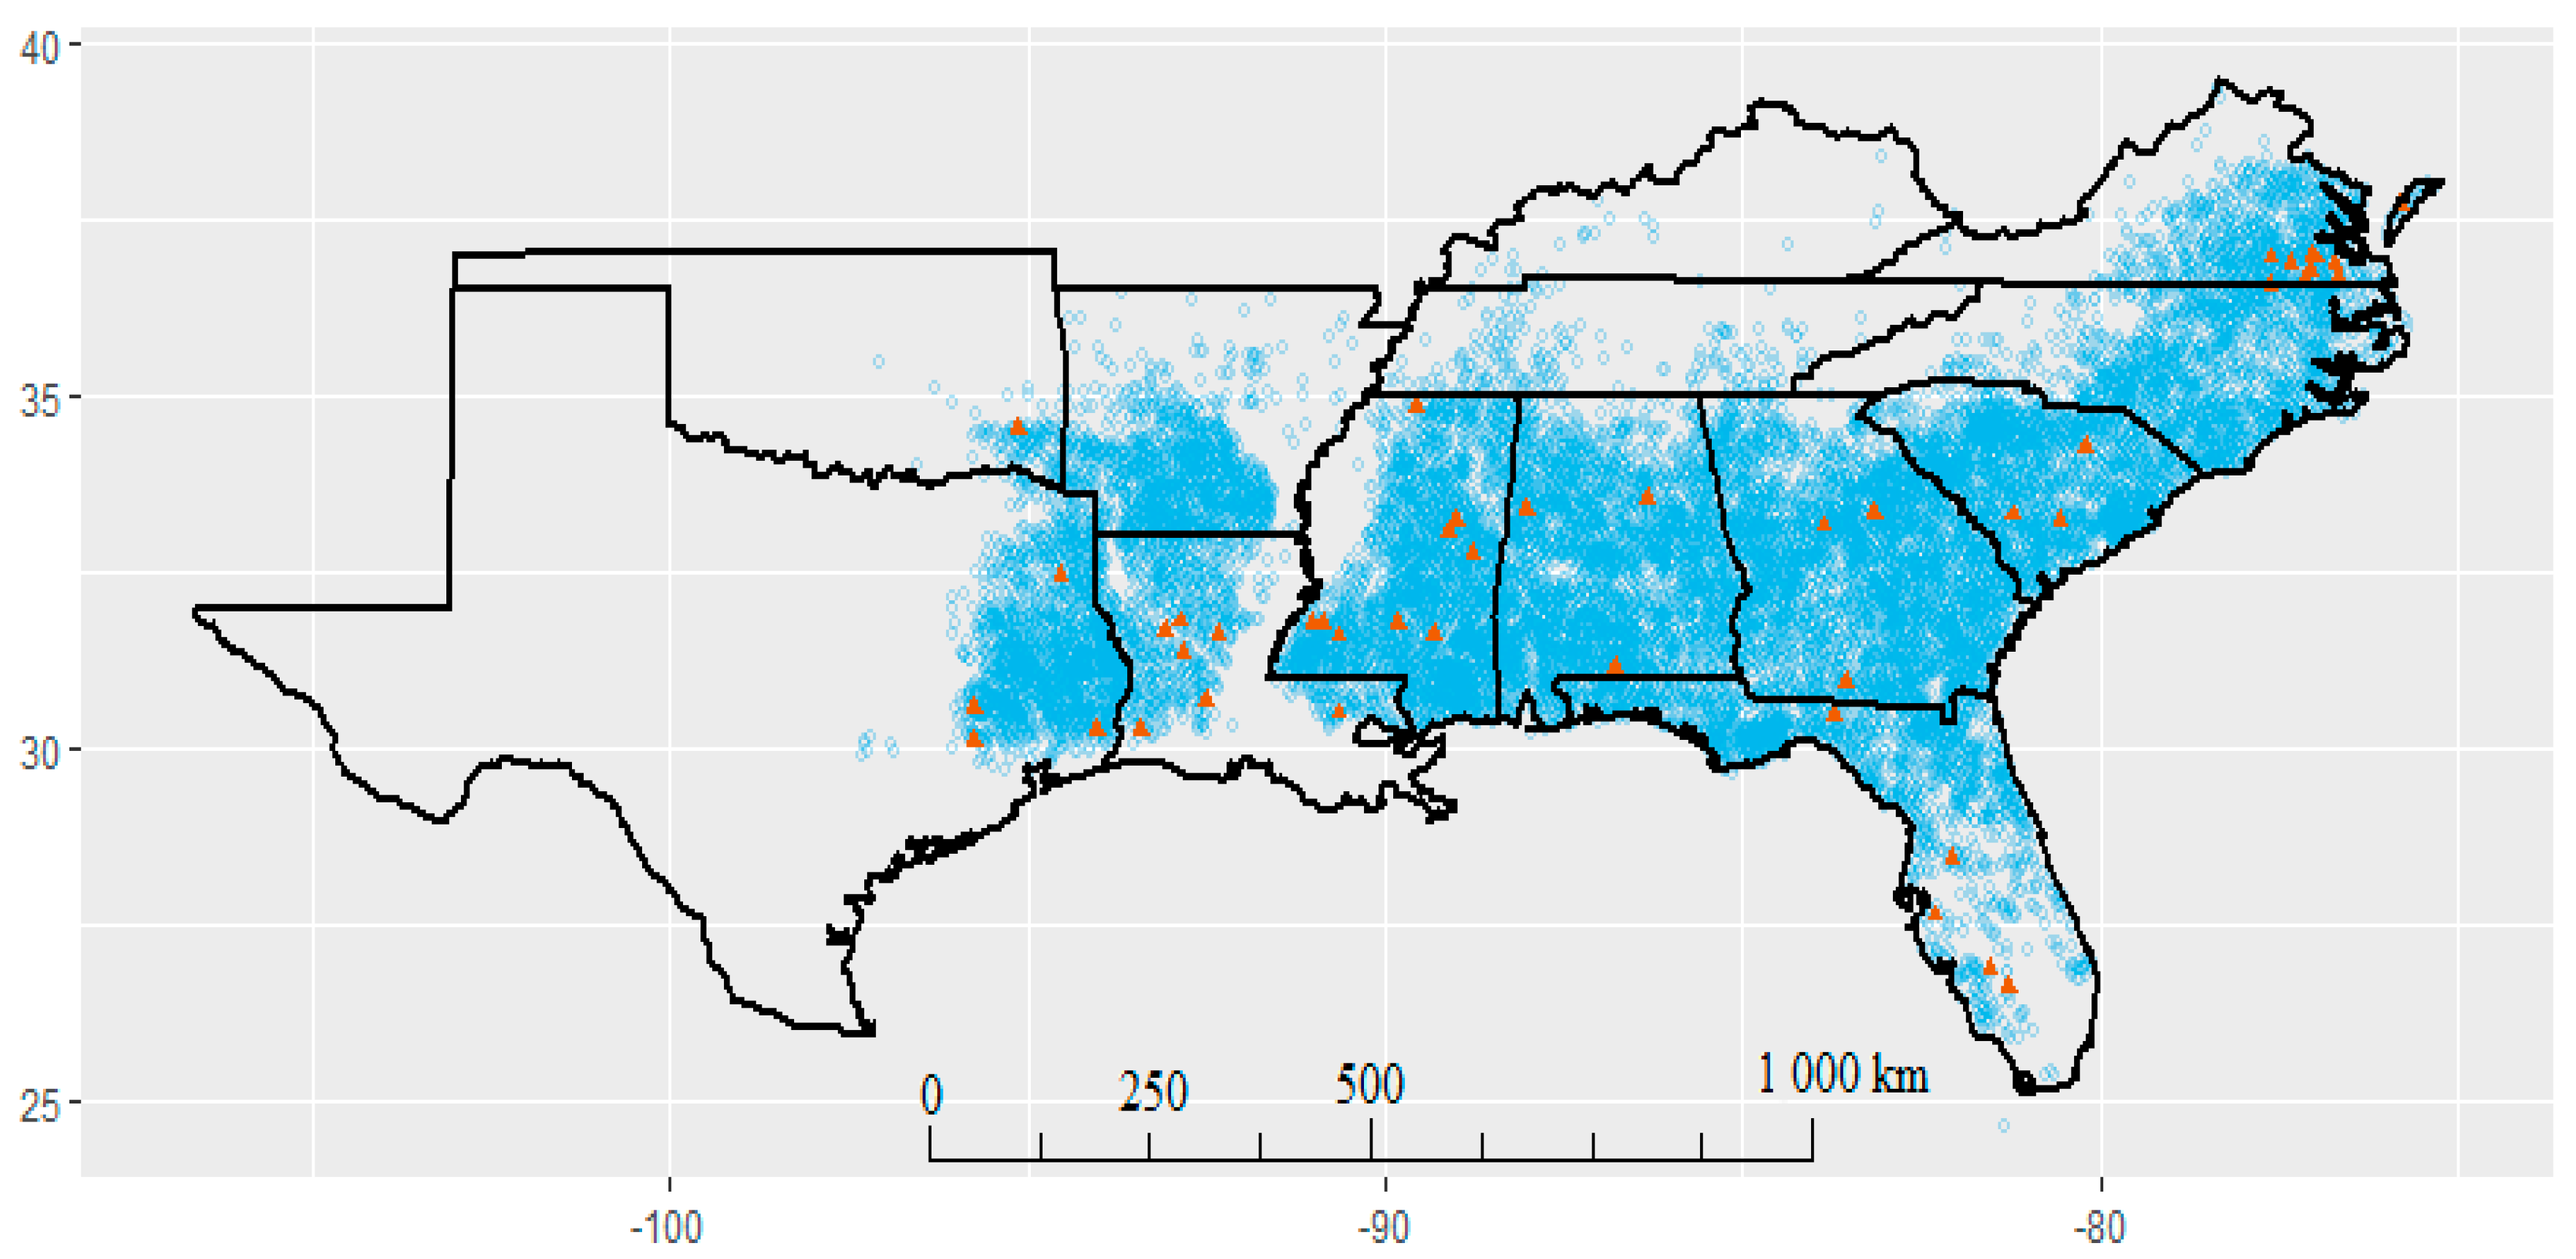
Figure 1. Distribution of Forest Inventory and Analysis (FIA) plots used in the study; plots with no foliar disease are represented with blue circles and those with incidences of foliar disease are represented with red triangles.
Forests 11 01155 g001
Figure 2. County level map showing hot spots of pine foliar disease based on binned Getis-Ord Gi statistics.
Forests 11 01155 g002
Figure 3. Frequency of monthly foliar disease per FIA plot between 2013 and 2019. Observations from the blue bars in the shaded region (between months July to October) were excluded from both the individual tree level mixed model and the MaxEnt analyses.
Forests 11 01155 g003
Figure 4. Boxplots showing the distribution of pine foliar disease as a function of different tree-level predictor variables; (a) diameter, (b) diameter growth, (c) crown ratio, and (d) crown ratio change. Trees affected by disease are shown in blue and trees with no record of foliar disease are shown in red.
Forests 11 01155 g004
Figure 5. Probability maps for disease distribution in the study area for 2016 and 2017. Black points represent the locations of disease observed by FIA in respective years. The color scale indicates the probability of disease occurrence based on climatic correlates from the MaxEnt model.
Forests 11 01155 g005
Table 1. List of predictor variables used in the generalized mixed model.
Predictor Variable
Diameter at breast height (cm)
Crown ratio, (%)
Diameter growth from past inventory (cm)
Crown ratio change from past inventory (%)
Table 2. Environmental variables used in the MaxEnt models.
Environment Variable
Mean annual precipitation from previous year (mm)
Mean annual temperature from previous year (°C)
Mean dew point temperature from previous year (°C)
Mean maximum vapor pressure deficit from previous year (hpa)
Mean precipitation during coldest months from last season (mm)
Mean temperature during coldest months from last season (°C)
Table 3. Results from general mixed model examining the effect of tree-level variables on disease probability.
Random Effect
NameVarianceStd. Dev
Plot (Intercept)126.0011.23
Fixed Effects:
NameEstimateStd. ErrorZ valuePr (>Z)LRTPr (Chi)
Intercept−15.470.98−15.820.00
Diameter0.100.320.310.760.100.76
Diameter growth0.150.290.510.610.260.61
Crown ratio−0.490.30−1.640.102.810.09
Crown ratio change−0.220.23−0.940.350.870.35
Table 4. Model regularization (beta multiplier), area under curve (AUC) under receivers operating characteristic (ROC), and contribution of each variable (%) for MaxEnt models explaining the disease probability as a function of environmental variables.
Description20162017
Beta multiplier0.900.10
AUC0.730.70
Mean dew point temperature (%)70.9037.40
Maximum vapor pressure deficit (%)21.1032.70
Precipitation during cold months (%)7.9022.30
Mean temperature during cold months (%)0.007.60
Annual mean temperature (%)0.000.00
Annual mean precipitation (%)0.000.00
Publisher’s Note: MDPI stays neutral with regard to jurisdictional claims in published maps and institutional affiliations.