Article

Atmospheric Pathways and Distance Range Analysis of Castanea Pollen Transport in Southern Spain

by
Rocío López-Orozco
1,*,
Miguel Ángel Hernández-Ceballos
2,
Carmen Galán
1 and
Herminia García-Mozo
1
1
Department of Botany, Ecology and Plant Physiology, University of Cordoba, 14071 Cordoba, Spain
2
Department of Physics, University of Cordoba, 14071 Cordoba, Spain
*
Author to whom correspondence should be addressed.
Forests 2020, 11(10), 1092; https://doi.org/10.3390/f11101092
Submission received: 16 September 2020 / Revised: 5 October 2020 / Accepted: 12 October 2020 / Published: 14 October 2020
(This article belongs to the Special Issue Tree Pollen and Floral Biology)

Abstract

:
The sweet chestnut (Castanea sativa Mill.) is the only native species of this genus in Europe, where it faces various threats that are causing a severe decrease in populations, with the resulting loss of genetic diversity. In the Iberian Peninsula, it is of high economic and ecological importance, being well represented, especially in northern areas, whilst it is limited to isolated populations in medium-range mountains in southern Spain (Andalusia region). Taking advantage of this fragmented distribution, this study analyzes the dynamics of atmospheric transport of Castanea pollen through Andalusia region in order to obtain a better understanding of the pollination pathways as a key aspect of the floral biology of this partially anemophilous species. The aerobiological characteristics of this species are also of special interest since its pollen has been recognized as allergenic. Pollen transport pathways were studied by applying back-trajectories analysis together with aerobiological, phenological, land cover, and meteorological data. The results reveal that airborne Castanea pollen concentrations recorded in the city of Cordoba, in the center of Andalusia region, reach medium- and even long-range distances. The backward-trajectory analysis indicates that most of the pollen data detected outside the Castanea flowering season were related to westerly slow and easterly airflows. Furthermore, some of the case studies analyzed indicate the presence of southerly airflow patterns, which could influence medium- and long-range transport events from chestnut populations further south, even from those located in north African mountains. The integrated analysis of the results offers us better knowledge of the cross-pollination pathways of this endangered species, which help us to understand its genetic flows, as a basis for designing conservation strategies for this highly fragmented species in southern Spain.

1. Introduction

The sweet chestnut (Castanea sativa Mill.) is an arboreal species native to southern Europe and Asia Minor, where it usually grows in humid forests located in mid-altitude mountains. This tree has a remarkable multipurpose character and has traditionally been managed for timber production as well as fruit production, including a broad range of secondary products and ecosystem services [1]. Its cultivation in Europe began 3000 years ago and its original natural distribution extended resulting in the establishment of the species at the limits of its potential ecological range, which makes it difficult to trace its original natural area [2]. The present distribution ranges from northwest Africa to northwest Europe and from southwest Asia to eastern Europe [3]. In Europe, chestnut forest areas occupy large expanses, overall, in countries such as Italy, France, Portugal, the United Kingdom, and Spain. In Spain, the sweet chestnut is present in an area of 1,100,000 ha and is the main species in 227,000 ha [4].
Our study was performed in Andalusia in southern Spain. In this region, the species occupies more than 12,000 ha; it is the second leading chestnut-producing region in Spain, with 22% of total production [5]. However, the presence of chestnut populations in Andalusia is characterized by high habitat fragmentation and the reduction of the area occupied by this species due to various causes: fires, climate change, crop changes, genetic ageing, and plant diseases such as canker, ink disease, and the chestnut wasp [1,4,6]. All these factors are affecting Castanea sativa distribution limiting it to climatically stable areas known as refugia [7]. In Andalusia, the distribution has been so severely reduced and, as a result of this situation, this species in southern Europe were included in the European Union’s Natura 2000 network for the conservation of natural habitats [8].
Despite the fragmented and scarce extension of chestnut populations in the Andalusia region, this species has a high economic importance in Andalusian due to their fruits and timber, and also to their secondary products, such as honey and associated mushrooms. In addition, the ecological services associated to the presence of this species in the landscape of rural tourism areas are very important [9].
Nowadays, the main Andalusian chestnut populations are in the Aracena Natural Park in Huelva province, in the west of the region, and in the mountains surrounding the Genal River Valley in Malaga province, in the south [9,10,11]. Nevertheless, there are minor expanses of chestnut populations in other provinces of Andalusia as Cordoba, in northern Andalusia, where our monitoring station was located.
One of the main consequences of the reduction of the sweet chestnut areas in the Andalusia region is the loss of biodiversity and therefore the lack of genetic diversity for this species. Cross-pollination is decreasing in favor of pollination within a given population or even self-pollination. Moreover, chestnut populations have been greatly affected by clonal propagation. This loss of genetic resources is severely affecting the species and accelerating the reduction in population size and the fragmentation of habitats [9,12,13].
These factors make it essential to acquire a deeper knowledge of the reproductive biology and current reproductive phenological pattern of this species in the present environmental conditions [14]. The chestnut is a dioecious species and its reproduction is conditioned by its partially anemophilous pollination, which releases a high percentage of its pollen grains into the atmosphere as a mechanism to ensure fertilization and genetic transmission [15]. Castanea pollen grains can be spread through the atmosphere, even reaching long distances, due to their small size (12 × 15 µm) and weight [16,17,18,19]. Moreover, the study of this airborne pollen is of great interest due to its allergenicity, reported in various parts of Europe, including Spain [20,21,22]. In fact, Castanea pollen has been described as a moderately allergenic pollen type, even causing allergy cross-reactivity with Quercus pollen or with various plant foods [23,24].
Airborne pollen transport, over medium or long distances, is essential for the genetic renewal of this endangered species. Studies on airborne pollen concentrations can offer information about the population distribution and the source and possible transport routes of the pollen. However, when working with small population, as in the case of the landscape of southern Spain, it is easier to elucidate this airborne pollen behavior, and this becomes an advantage in studies on Castanea pollen dynamics. Moreover, in these studies it is important to consider the distance between the forest population and the pollen sampling station, and atmospheric conditions that affect the pollen transport [25,26,27,28].
To achieve this purpose, our study focused on the following three objectives: (1) to analyze the airborne pollen and phenological behavior of Castanea by sampling both local chestnut populations and the city atmosphere, (2) to identify the source areas contributing to the Castanea pollen curve in the city of Cordoba, and (3) to define the temporal influence of each source area on the Castanea pollen curve, analyzing the possible medium- or long-distance transport pathways.

2. Materials and Methods

2.1. Study Area and Climate

The study was conducted in the region of Andalusia, in southern Spain (Figure 1a,b), to assess the possible sources and transport pathways of airborne Castanea pollen detected Cordoba, a city of 350,000 inhabitants placed in the central area of the region (37°53′ N, 4°47′ W, 111 m.a.s.l.). Another sampling point was placed at the Valdejetas estate, where this species occupies 7.35 out of their 170 ha. Here is located the only chestnut area of the province of Cordoba (37°56′ N, 4°56′ W, 520 m.a.s.l.) being situated more than 200 km away from the nearest chestnut population, placed at the Málaga province, southern Andalusia (Figure 1b). This research was carried out during the period 2015–2019, except in 2018, due to technical problems.
The city of Cordoba lies in the Guadalquivir River valley, where cereals and olives are the main crops, and is surrounded to the north by the Sierra Morena mountains (200–600 m.a.s.l.), where Mediterranean oak forests predominate, and to the south by the mountains of the Sub-Baetic system (2000 m.a.s.l), with large expanses of cultivated olive trees.
The scattered populations of Castanea sativa Mill. in the province of Cordoba, of limited spatial distribution, are located at the Sierra Morena mountains, mainly in and around the Valdejetas estate. We analyzed the Castanea pollen data recorded for four chestnut flowering seasons at two sampling sites 25 km apart (Figure 1c).
Cordoba province has a continental Mediterranean climate, with high temperatures in summer and low temperatures in winter. The annual average temperature is 18.2 °C, mean annual rainfall is 605 mm (data from 1981 to 2010, AEMET—State weather agency). Daily meteorological data for both sites were provided by the Andalusian Regional Government Agroclimatic Information Network’s automatic weather stations (https://www.juntadeandalucia.es/agriculturaypesca/ifapa/riaweb/web/).
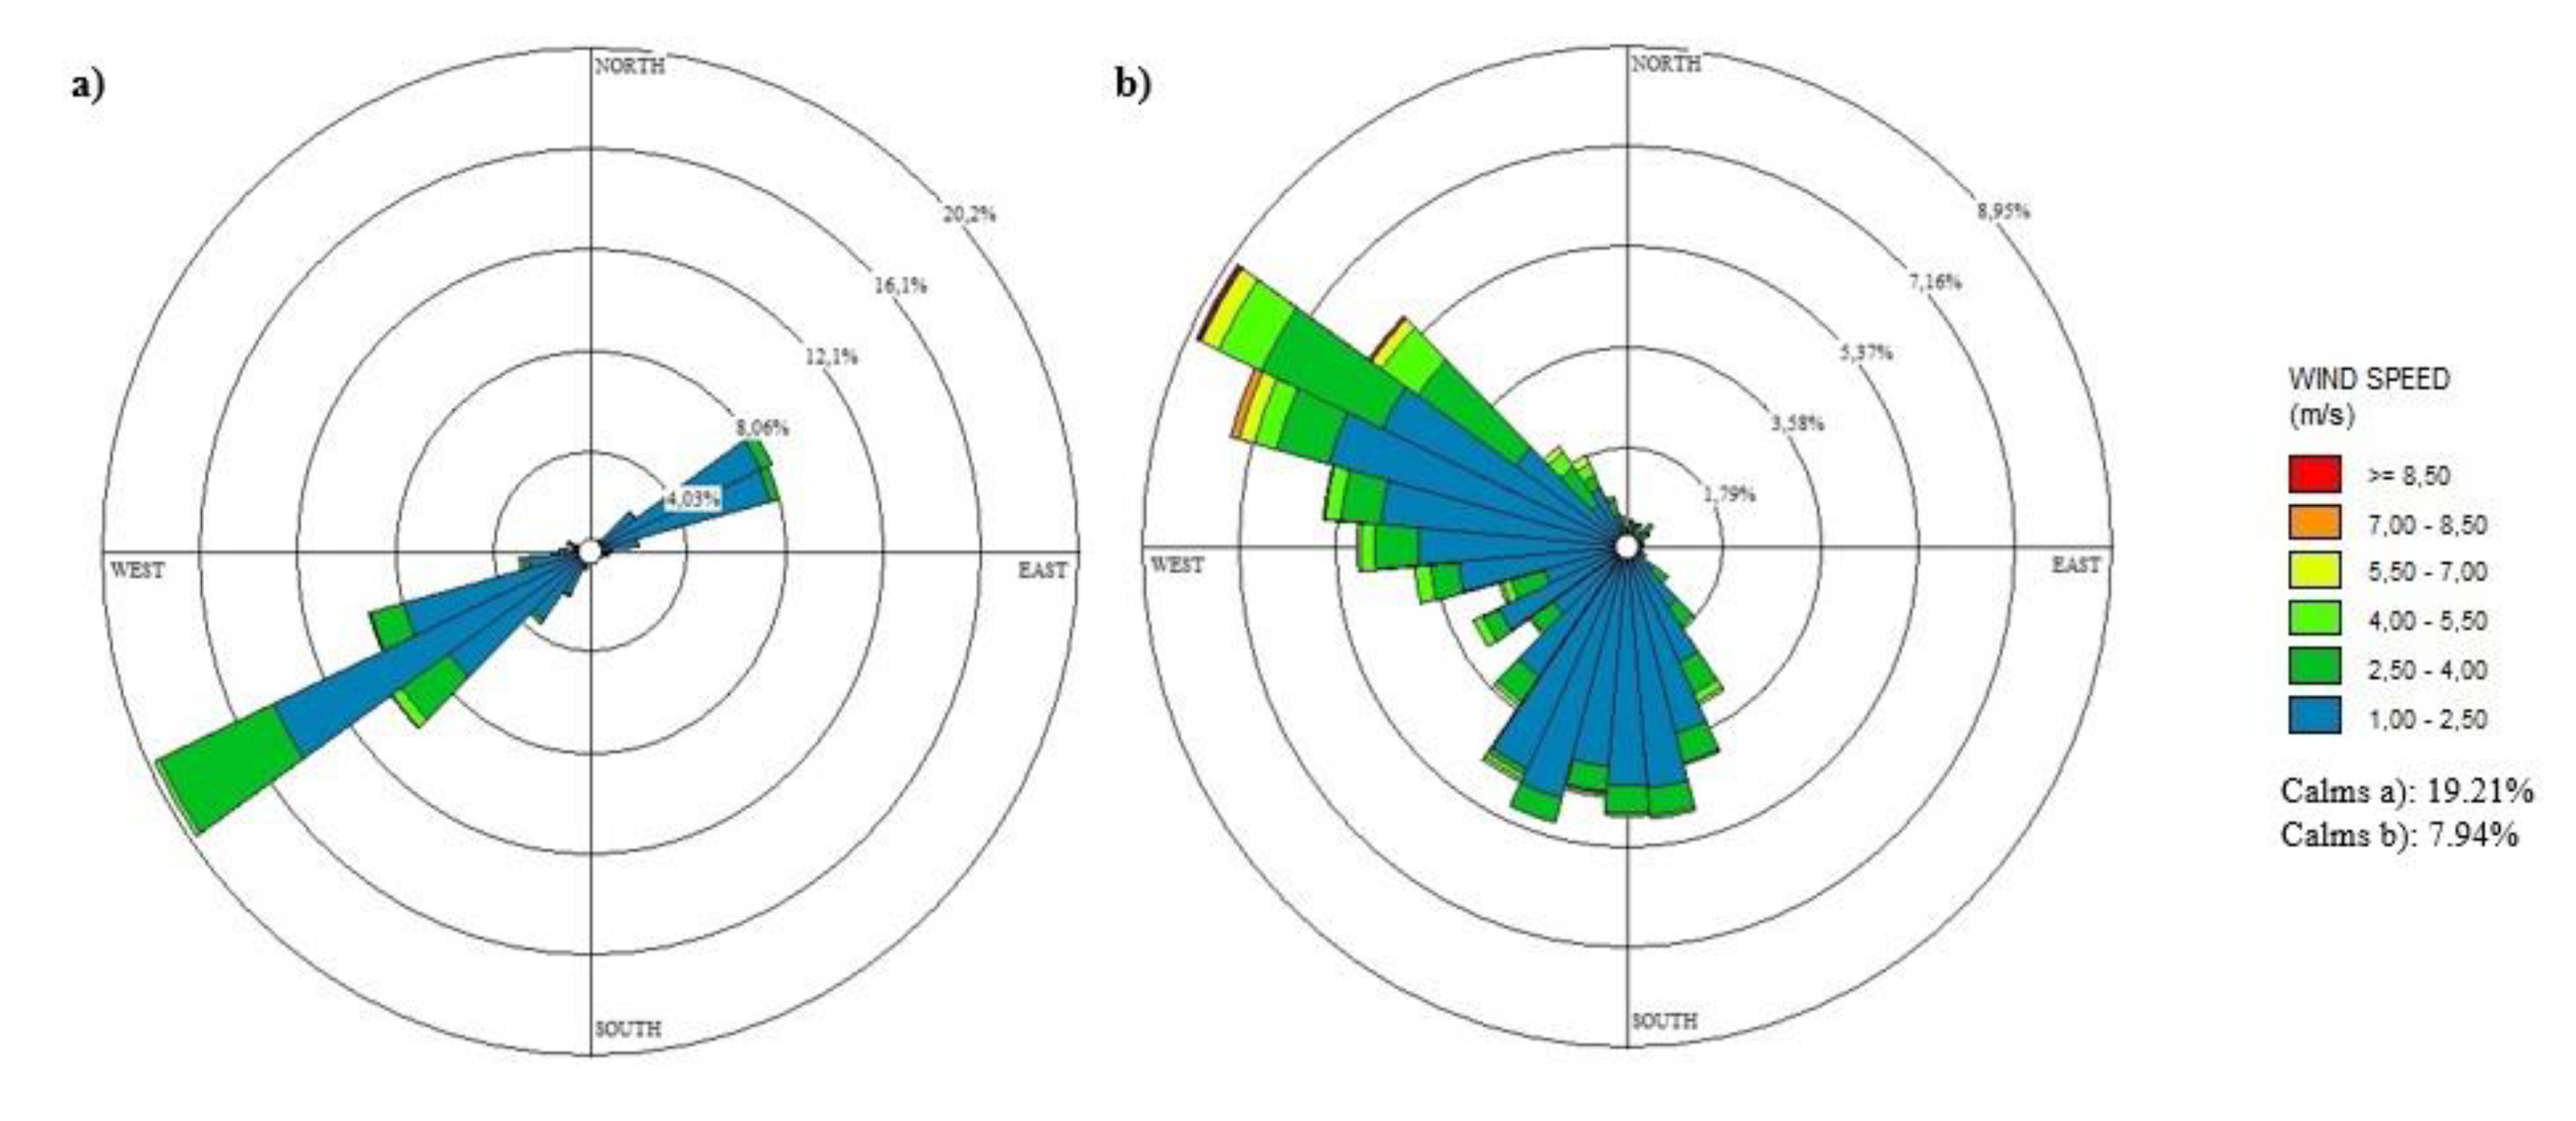
Wind rose diagrams (Figure 2) were determined to represent wind speeds and directions in both studied sites using the WRPlot™ program [29].

2.2. Phenological Analysis

In the Valdejetas estate and the surrounding area of the Sierra Morena mountains, weekly field phenological data were taken throughout the whole study period, based on the international BBCH scale [30], adapted to the Castanea sativa species. For this study we considered reproductive phenological behavior, mainly focusing on the full flowering (FF) phase (phase 55 according to the BBCH scale) including eight phenological sampling points, where 10 individuals were observed in each of them. The beginning of this phase occurs at each sampling point when more than 50% of the anthers of the observed individuals have opened. The end of the phase coincides with the senescence of more than 50% of the catkins.

2.3. Airborne Pollen Monitoring

A continuous daily sampling was performed during the study period (2015–2019) using a pollen trap placed in the city of Cordoba and another in the Valdejetas estate, which recorded weekly airborne pollen data. A volumetric Hirst-type sampler [31] was used for air monitoring in the city, and a Kelly sampler [32] in the Valdejetas property, the latter because of its non-dependence on electricity and robustness in the field.
Hirst pollen data were analyzed following the Spanish Aerobiology Network (REA) protocol [33], meeting the minimum requirements of the European Aerobiology Society (EAS) [34], including, for example, counting pollen covering 10% of the total slide area. Regarding the Kelly sampling protocol [32], for counting pollen we followed the description used in Martínez-Bracero et al. [35] also reading 10% of the slide. For pollen recorded by the Hirst-type sampler, the results were presented as the daily average of pollen grains per m3 of air. For pollen recorded by Kelly sampler, weekly results were presented in pollen grains per cm2. The Main Pollen Season (MPS) and the Pollen Season Integral (PSIn) were calculated [36]. The Pollen Season Start (PSS) was defined as the first of five consecutive days with ≥1 pollen grains/m3 or ≥1 pollen grains/cm2, and the Pollen Season End (PSE) as the last of five consecutive days with <1 pollen grains/m3 or <1 pollen grains/cm2, depending on the sampler in use.

2.4. Back Trajectory Analysis

The set of backward trajectories for studying pollen transport was calculated using the HYSPLIT (Hybrid Single-Particle Lagrangian Integrated Trajectory) model [37]. The trajectories were computed using meteorological inputs from the Global Data Assimilation System (GDAS), with a temporal resolution of 6 h and a spatial resolution of 1°. These files, by including vertical wind component information, make it possible to calculate three-dimensional kinematic trajectories, which are more accurate than others obtained by using other methods, such as the isobaric or isentropic [38]. Twelve backward trajectories were calculated for each period analyzed (one every 2 h). The calculation of these 12 trajectories for each period was aimed at reducing the effects of individual errors in the analysis. The air mass path for the previous 96 h was specified in time steps of 1 h, and the backward trajectory calculations ended at an altitude of 100 m above ground level. For the purposes of this study, designed to determine potential sources and transport routes of pollen grains, clusters of trajectories representing the airflow patterns over the city of Cordoba during the analysis period were calculated. This technique has worked very well for discriminating distinct flow patterns, and more information about the cluster technique can be found in Stunder 1996 [39] and in the HYSPLIT model user guide [40].

3. Results

Average temperature and rainfall in the Cordoba city area during the study period were analyzed, recorded an average temperature of 18.0 °C being slightly lower than reported in the average of the last decades. Regarding annual average rainfall (430.3 mm), it is drier than the last 10 years on record. The highest rainfall value was recorded in 2016 (615.2 mm), whereas 2015 was the driest year (336.5 mm). In the Valdejetas estate, the average temperature was 15.96 °C; the highest annual rainfall during the study period was recorded in 2016, with a value of 430.4 mm, exceeding the annual average for this location (308.3 mm), and 2015 was the driest year (237.6 mm).
Figure 2 shows surface wind rose diagrams that represent wind speeds and directions in both sites. The length of each spoke around the circle indicates the amount of time within the present study period that the wind blows from the indicated direction, while colors along the spokes indicate categories of wind speed. Daily wind speed and wind direction values recorded during the study period (2015–2019) were used. Figure 2a shows that the surface winds in the city of Cordoba are determined by its location in the Guadalquivir valley (southwest–northeast), being channeled along its axis, while in Valdejetas surface winds are mainly from the northwest and south–southwest (Figure 2b). Large differences are also observed between the percentage of calms (<1 m/s) in both places.

3.1. Phenological Survey

For each study year, the FF period at Valdejetas estate was taken as a reference to define a set of episode days in the city of Cordoba when pollen records could not be explained either by the Valdejetas pollen curve or by the field phenology of this area.
Phenological data reveal that chestnut flowering usually takes place from mid-May to early June (Figure 3). Few differences were observed between the phenological sampling points, with largely synchronous flowering in the area, favored by the small altitude differences between the sites, which are located within a range of 485–530 m.a.s.l.
Regarding interannual differences, the earliest field flowering start date was recorded in 2019 (22 May), and the latest occurred in 2016 (6 June) being the rainiest year. The chestnut flowering stage lasted an average of 30 days in the study area; in 2016, 2017, and 2019 it was 29 days. In contrast, 2015 had the longest flowering period (34 days), coinciding with the driest year. The earliest field flowering end date occurred in 2019 (19 June), presenting a lower average temperature; while the latest was in 2017 (7 July), which recorded the highest average temperature of the study period.

3.2. Aerobiological Survey

In Figure 3, pollen curves from Valdejetas and the city of Cordoba are represented together with the FF periods. The Main Pollen Season (MPS) for Castanea usually starts in this city in early June; the earliest Pollen Season Start (PSS) occurred in 2015, during the last week of May, and the latest in 2016, at the beginning of June. In the Valdejetas estate, the Castanea MPS usually occurred earlier than in the city of Cordoba, from the last fortnight of May until late June. The pollen peak value in the Cordoba sampler ranged from seven pollen grains/m3 in 2015 (21 June) to a maximum of 18 pollen grains/m3 in 2019 (23 June). The pollen peak value in Cordoba was found in the month of June, except in 2016, when it was found later, on 13 July. In contrast, the peak value was recorded at the beginning of June in Valdejetas, where the maximum weekly value was found in 2016, with 270,604 pollen grains/cm2 in the period from 13 to 19 June (week 24). This is nearly four times greater than the maximum value in 2015 (69,200 pollen grains/cm2). The end of the main pollen season in Cordoba usually occurred in the first half of July; it was earliest in 2015 (1 July) and latest in 2016 (17 July). It was always later than in the Valdejetas area, where the latest end of MPS was on 12 July. The average length of the MPS in the city of Cordoba was 34 days, although it decreased over the course of the study period (from 37 in 2015 to 30 in 2019). In the Valdejetas estate, the MPS was longer than in Cordoba: an average of 43 days. The Pollen Season Integral (PSIn), calculated as the annual total of pollen grains, was 95 pollen grains on average for the years of study, the highest figure being recorded in 2019 (116) and the lowest in 2015 (65) in Cordoba. For Valdejetas, the minimum was found in the same year as in Cordoba, with 136,833 pollen grains; in 2016, however, 467,959 pollen grains were found. As airborne pollen values recorded in the Valdejetas area were much higher than those found in the city of Cordoba, the Valdejetas pollen figures shown in Figure 3 were divided by 1000 to enable the curves to be compared.
It can be seen in this figure that the MPS in Valdejetas coincides with the chestnut’s flowering phenology stage, and the pollen curve peak date always falls within the FF period. However, it can also be observed that unusual Castanea pollen was still present in the city of Cordoba after the end of FF. Moreover, there were even some episode days on which no pollen grains were detected at Valdejetas, whereas unusual pollen data were recorded in Cordoba. These data are not explained either by flowering phenology (Table 1). In connection with this, it is remarkable that there are some dates far removed from the FF period, and even from both MPSs, on which Castanea pollen was recorded in the city of Cordoba. They include dates at the end of September 2015, during August and November 2016, and during August and September in 2017 and 2019, respectively. Table 1 presents the selected episode days in order to perform a more thorough integrated study, including back-trajectory analysis, for a better understanding of Castanea airborne pollen dynamics in this area.
The episode days can be divided into two groups: (1) those occurring within the FF period, with higher Castanea pollen concentrations recorded in the city of Cordoba than in Valdejetas; (2) those occurring after FF, with unusual pollen concentrations in Cordoba but not in Valdejetas.

3.3. Air Mass Backward Trajectories and Castanea Pollen Concentrations

In this section we present the set of airflow patterns associated with Castanea pollen concentrations in Cordoba by clustering the backward trajectories calculated for the episode days during and after the FF period (Table 1). The objective is to describe the potential atmospheric pathways of Castanea pollen and to investigate whether the potential differences between main airflow patterns in the two FF periods can account for the records of these unexplained episode days in the city of Cordoba.
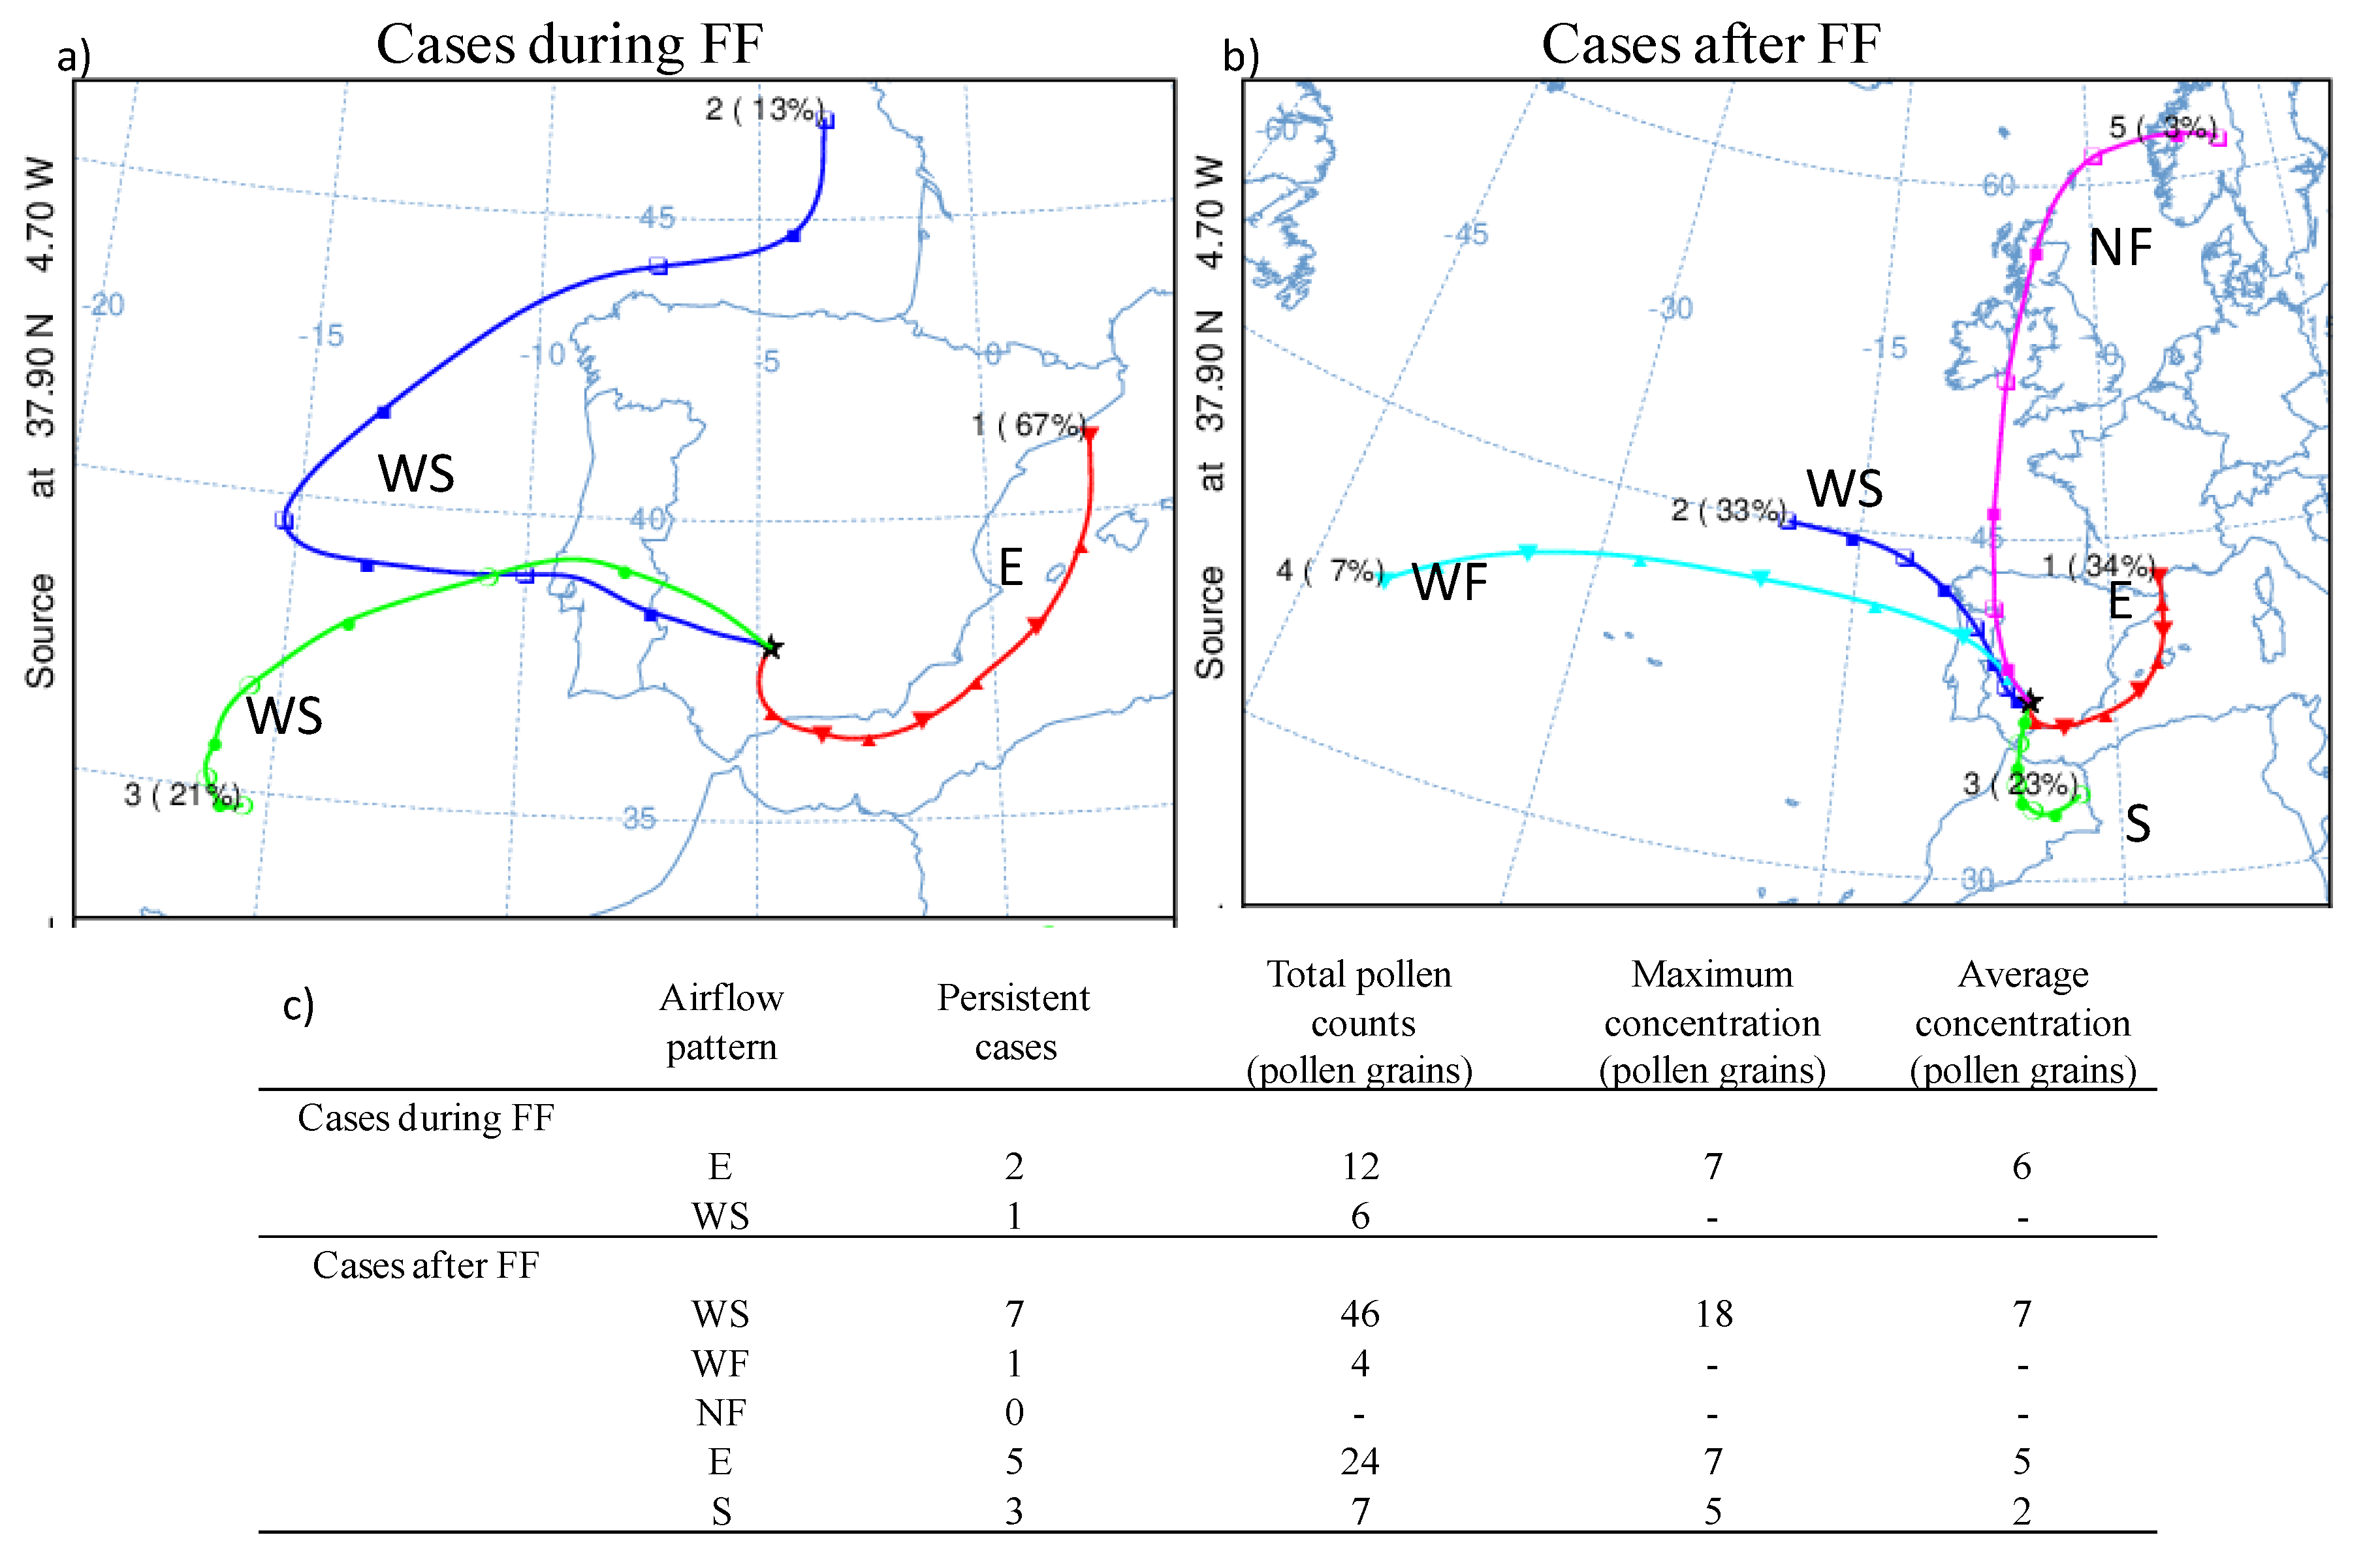
Figure 4 shows the average horizontal displacement of the airflow patterns observed during the analysis of episode days, distinguishing between those that occurred during (Figure 4a) and after (Figure 4b) the FF period. Considering both figures, five main airflow patterns were identified, as follows: (1) westerly fast (WF) and (2) westerly slow (WS), which assemble maritime air masses over the Atlantic Ocean before reaching the sampling point; (3) northerly fast (NF), travelling over land and sea from high latitudes; (4) slow continental southerly (S) flows originating over north Africa; (5) easterly (E) patterns representing air masses generated to the northeast/east and travelling over the Mediterranean Sea. Cluster names were chosen based on the combination of the average pathway followed by each airflow pattern (westerly, northerly, easterly, or southerly) and the length of the 96-h in each pathway, i.e., displacement speed (fast or slow).
The comparison of the two figures highlights similarities in airflow patterns between the two groups of FF periods. The only two patterns identified during FF (E and WS) are the most frequent in the cases after FF. During FF, WS flows were recorded in 34% of cases, while E pattern were detected in 66%, and during episode days recorded after FF, the percentages were 33% (WS) and 34% (E) respectively. These results reveal a certain coincidence between the most frequent airflow patterns associated with Castanea pollen concentrations in Cordoba in the two groups of episode days. The comparison also shows a high incidence of S airflows (23%) (Figure 4b), clearly indicating that this is an airflow pattern strongly associated with Castanea pollen concentrations in Cordoba after FF.
To establish the relationships between airflow patterns and Castanea pollen concentrations in Cordoba, we identified persistent cases in Table 1. These persistent cases are those in which the pollen concentrations can be attributed to a specific airflow pattern (Figure 4), meaning that at least 80% of the trajectories reaching Cordoba during those episode days show the same airflow pattern. The analysis revealed 19 persistent cases (75% of those analyzed) (Table 1), of which three occurred during FF and 16 after it. Considering only the days recorded after FF, the highest numbers of persistent cases are those with WS and E airflow patterns (seven and five cases, respectively) (Figure 4b), while three persistent cases show the S pattern, one has WF, and there are no cases with NF. Figure 4c summarizes the Castanea concentrations associated with persistent cases. The maximum Castanea concentrations were reached under the WS pattern (Figure 4). These results indicate that the level of Castanea pollen in Cordoba is mainly driven by the arrival of westerly slow and easterly patterns after the FF period.

3.4. Case Studies

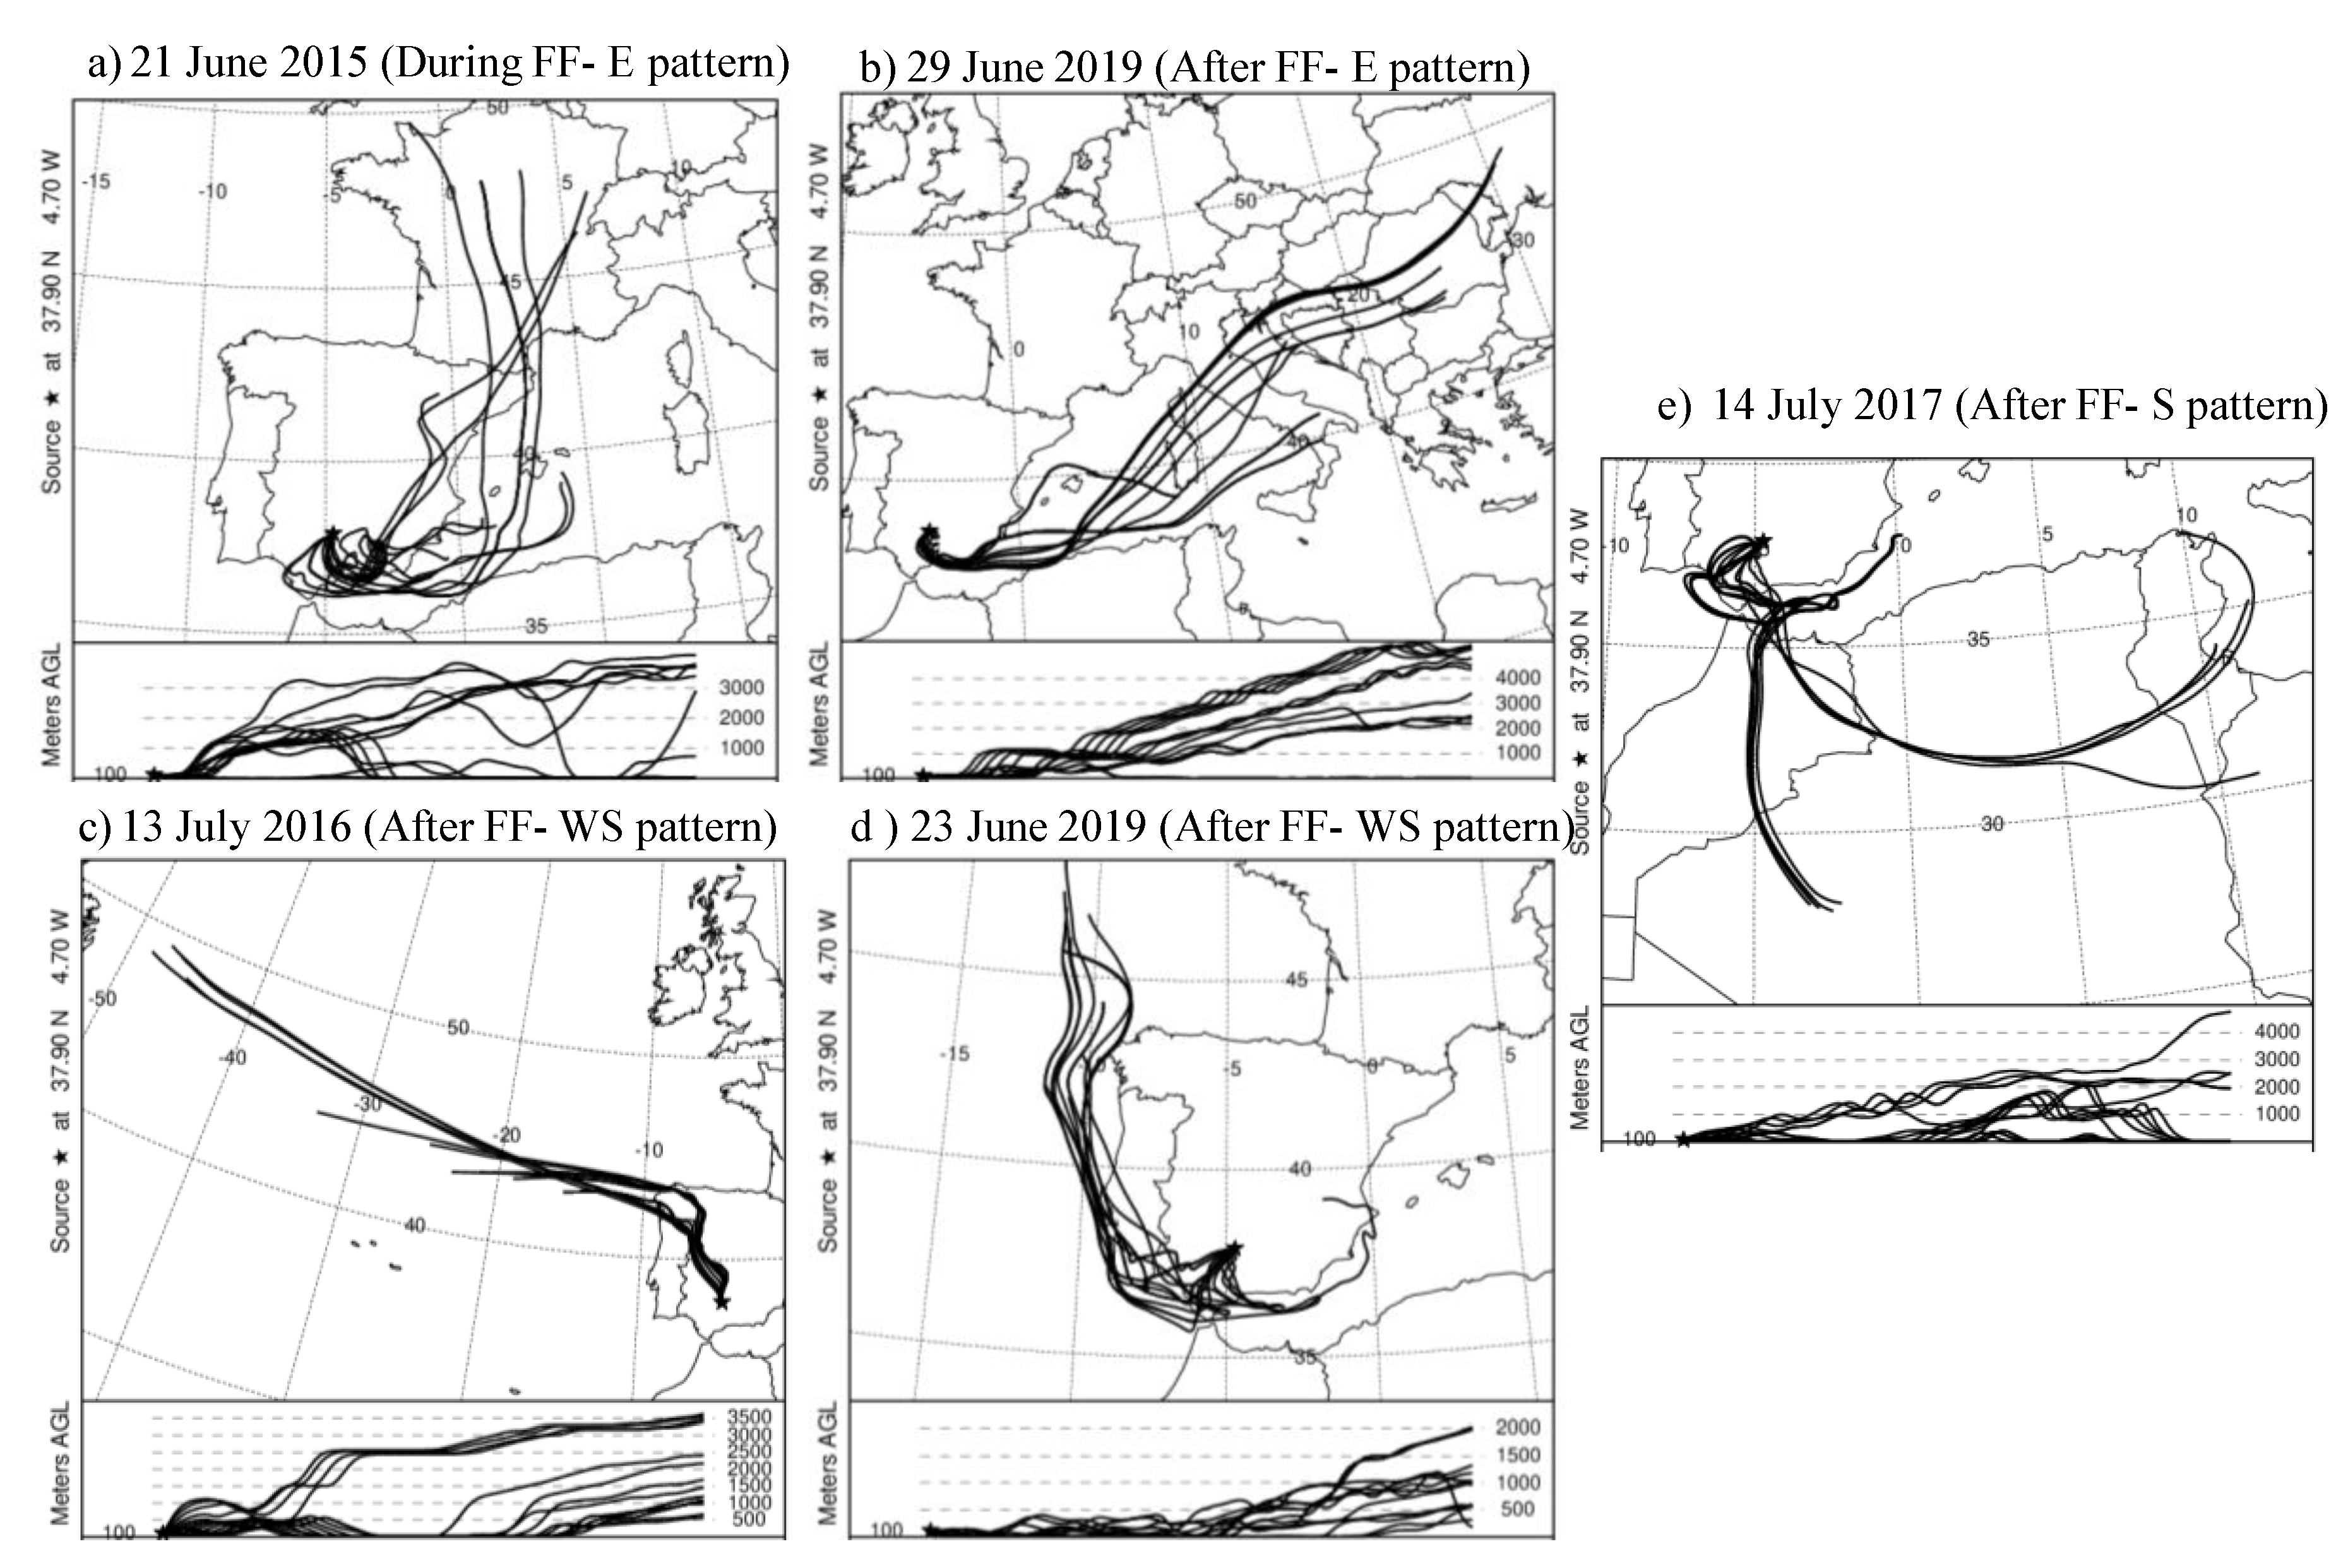
We analyzed case studies to provide a real basis for evaluating the potential influence of each airflow pattern on Castanea pollen concentrations in Cordoba. The selection criterion was persistent cases with the highest Castanea pollen concentrations. From the selected set of cases, we identified those registering Castanea concentrations above the 90th percentile (P90) over the whole period considered in this study (P90 ≥ 6 pollen grains/m3). Relationships between persistent cases and the highest pollen concentrations reveal that these four concentration periods were measured under two airflow patterns: two under the WS pattern (18 pollen grains/m3 on 23 June 2019 and 13 pollen grains/m3 on 13 July 2016) and two under the E pattern (seven pollen grains/m3 on 21 June 2015 and seven pollen grains/m3 on 29 June 2019). According to the information in Table 1, only one of these days (21 June 2015) was during the FF period; the others were after FF. In addition to these four sampling periods, we also analyzed the persistent case related to the arrival of air masses from north Africa (S pattern, 5 pollen grains/m3 on 14 July 2017) because it is representative of potential long-range transport of Castanea pollen.
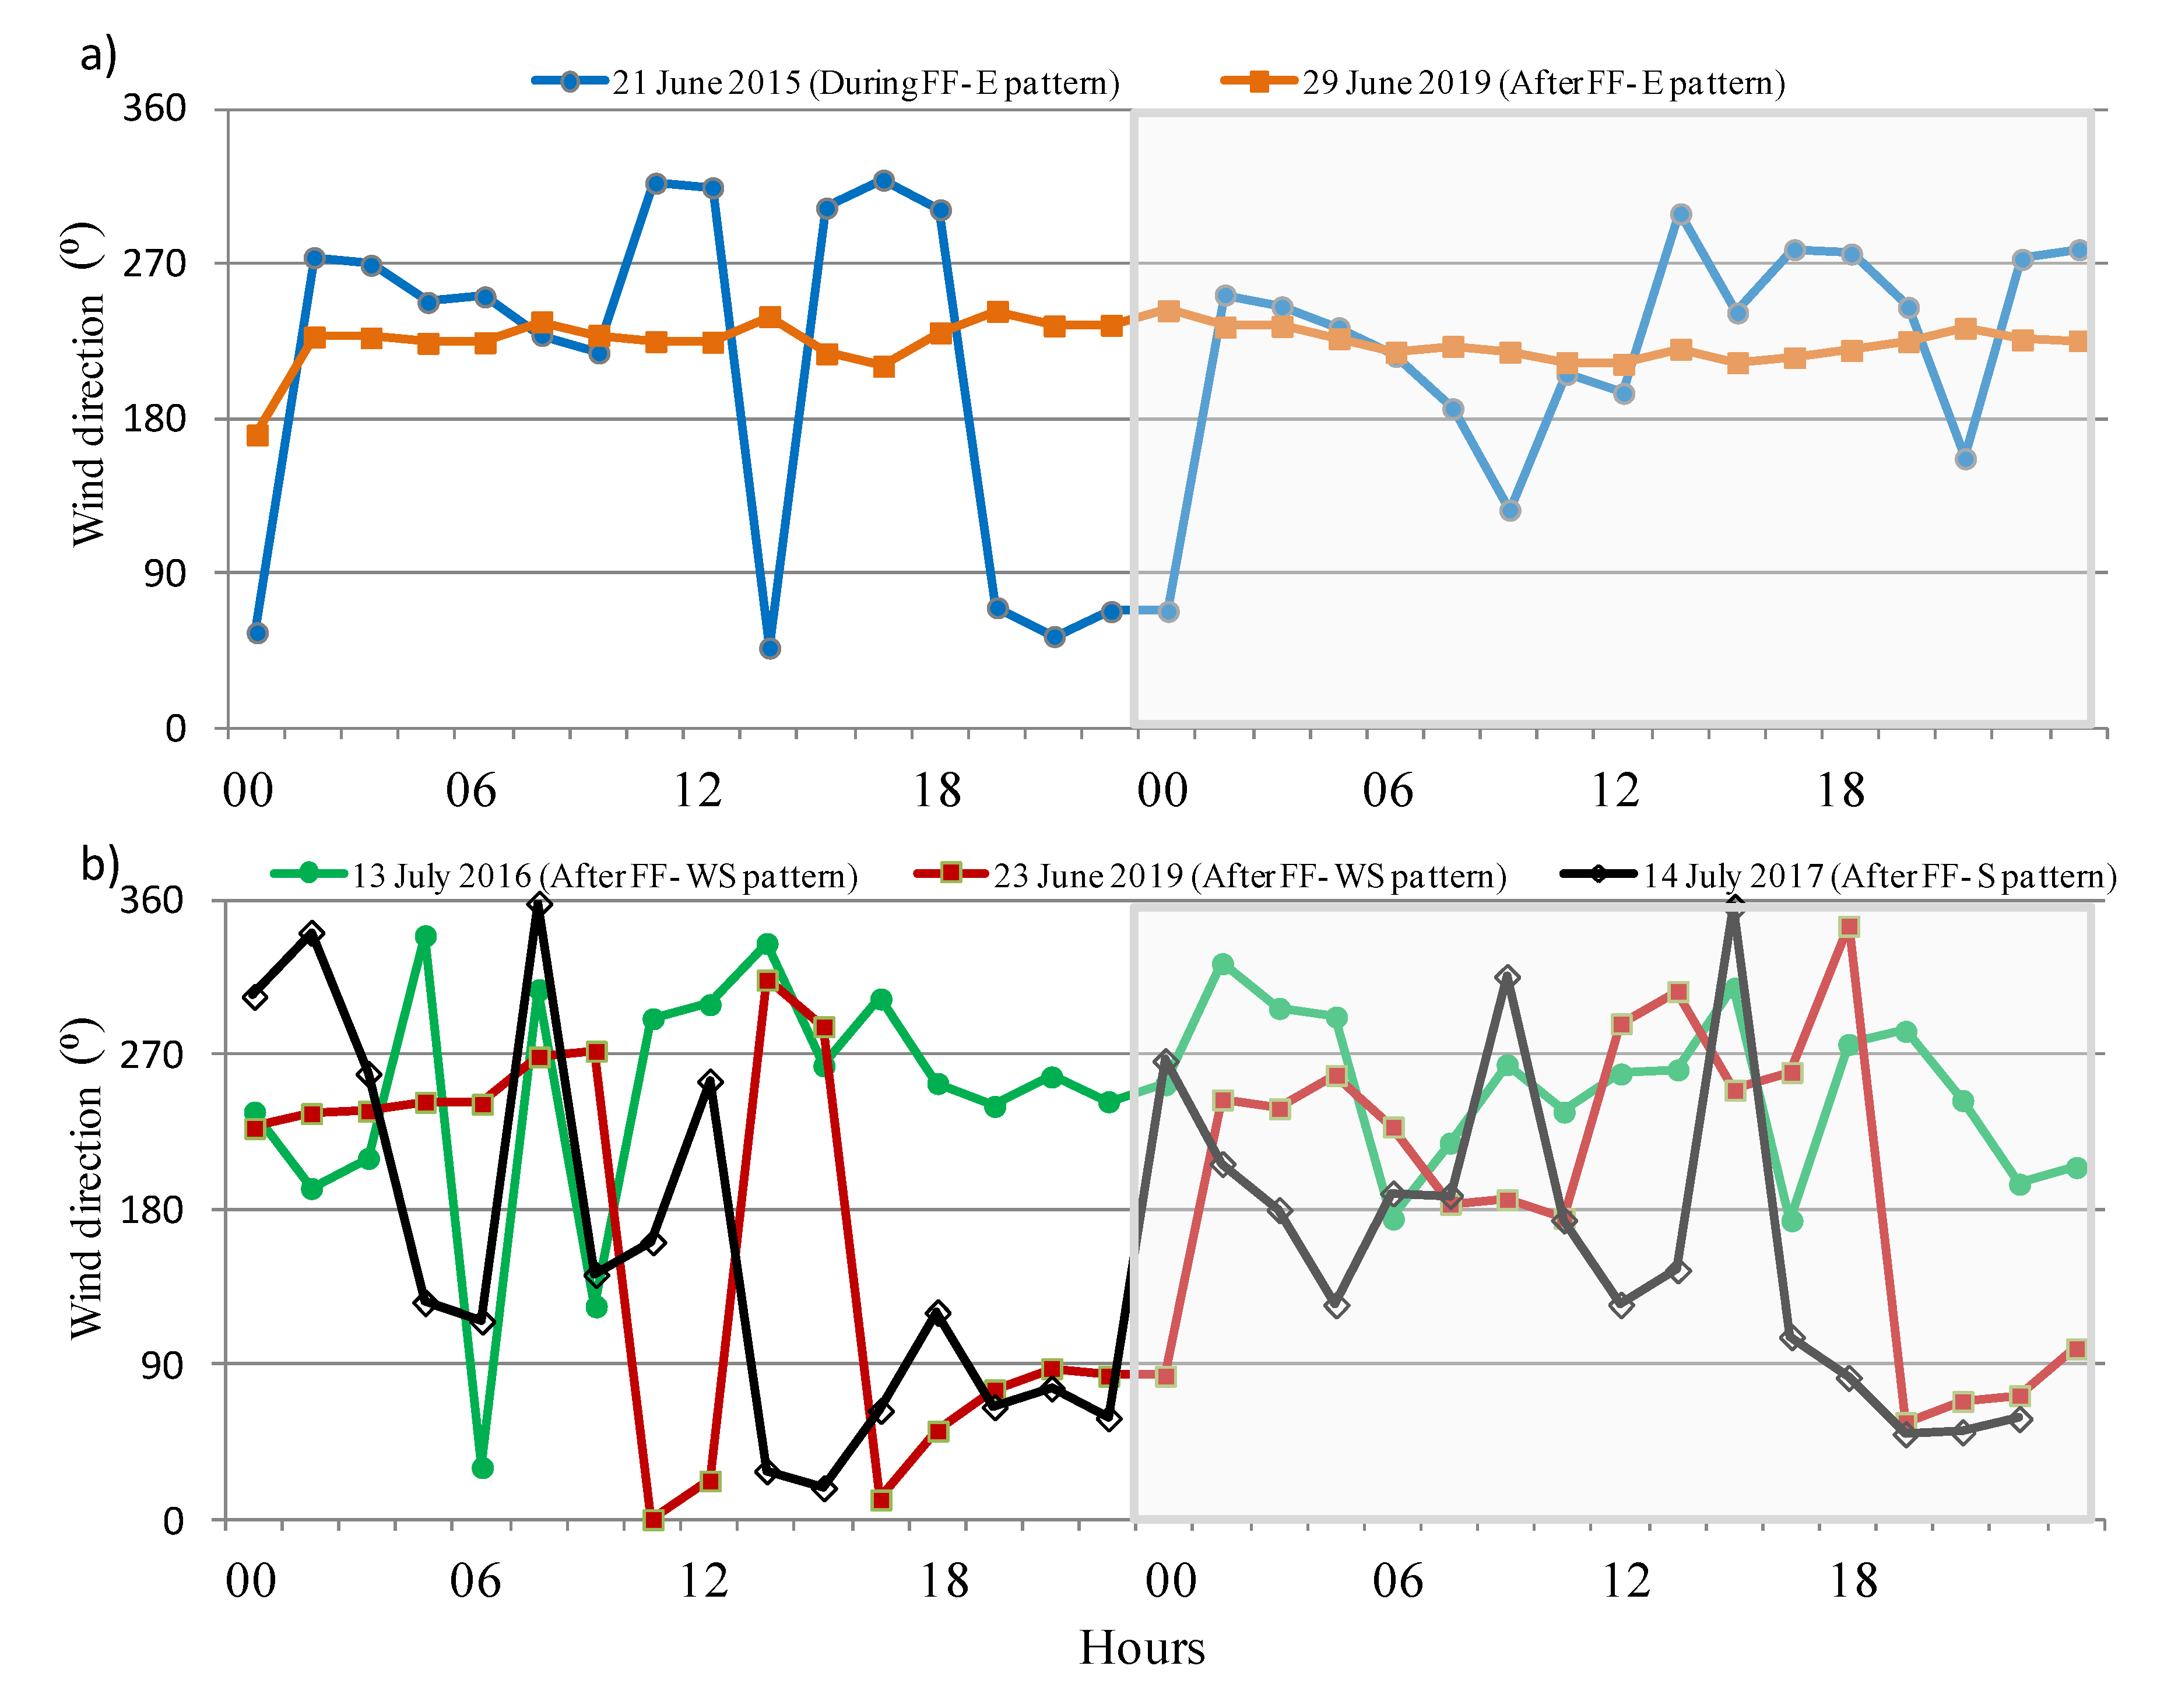
For each case analyzed, the corresponding air mass variability during the measuring day is shown in Figure 5, and surface winds for the measuring day and the previous day are displayed in Figure 6. Regarding air mass movement under E patterns, and regardless of the speed at which they traveled before reaching the Iberian Peninsula, Figure 6 shows a constant influx of air masses from the south, associated with displacement inland from the Mediterranean along the natural wind channels connecting the Mediterranean coast with the Guadalquivir valley. In the case of the WS pattern, back-trajectory computation revealed a constant influx of W flows on 13 July 2016, while the second date (23 June 2019) is characterized by an air mass displacement from the north along the Atlantic coast during the first hours of the day, changing to the arrival of Mediterranean air masses at the end of the sampling period. In both scenarios, air masses are being channeled from the Atlantic coastal area to inland areas by the Guadalquivir valley, which causes a prevalence of WS surface winds over Cordoba. The arrival of S airflows (Figure 5e) shows a movement of air masses over north Africa, reaching the study area along the Guadalquivir valley, as in the WS pattern.

4. Discussion

Studies of Castanea pollen transport have highlighted the occurrence of medium- and long-distance transport events in Europe [16,41,42]. Most of these studies were conducted in central and northern Europe, where this species occupies large forest areas e.g., [42,43]. Nevertheless, the characteristics of Castanea distribution in south Europe are different, especially in southern Spain with no large chestnut forests areas but extended fragmented populations.
To obtain precise knowledge of the airborne flow of Castanea pollen in southern Spain, this study analyzes the results of an integrated investigation of distribution information, aerobiological, field phenological, meteorological, and backward-trajectory data for this species. In fact, the focus was on the “unexplained” Castanea pollen concentrations detected outside the phenological flowering season in the city of Cordoba, even long after the closest chestnut populations in the area had finished flowering in the field. In addition, because of the allergenic nature of this pollen type, studies of this kind are of special interest to the sensitized allergic population and to medical specialists [20,21,44,45]. The integration and analysis of our results indicate the existence of medium- and long-distance transport of Castanea pollen even from North African populations, as has previously been reported for other pollen types in Europe [41,46].
Taking advantage of well identified location of chestnut populations that characterize the Cordoba area and southern Spain in general, we identified the atmospheric pathways leading to the city and established their relationship with pollen concentrations. Our results indicate that in the Cordoba area, chestnuts flower from the last week of May until the first half of July, depending on the year. These dates are similar than those reported by other studies carried out in northern Spain and other areas of Europe [19,47,48]. However, our aerobiological data show a lower pollen curve compared with those detected in other European areas with larger chestnut populations [48,49]. The pollen season in our case was shorter than in those locations, probably due to the small number of individuals in the Mediterranean area [19,48].
A comparison between our pollen curves recorded in the city of Cordoba and in the Valdejetas estate, the nearest chestnut population area, indicates that although they mostly coincide in time and pattern, Castanea pollen was usually detected earlier in Valdejetas than in the Cordoba samplings. In the city, both the start and end dates of the Main Pollen Season (MPS) occurred later, probably because the Castanea pollen detected in the city of Cordoba comes from elsewhere. Therefore, the number of days of the pollen season was frequently less in the city than that observed in the Valdejetas samplings. Regarding airborne pollen concentrations, the pollen curve detected in Cordoba, where no chestnut trees appear, can be entirely attributed to medium- or long-range transport. Lower Castanea pollen concentrations are found in the city of Cordoba compared to those observed in Valdejetas. Peak values were also lower in the city and were detected at later dates, due to the required transport time.
Phenological observations of anemophilous species are considered a key factor in understanding aerobiological pollen patterns, including sources, transport, and deposition [50,51]. Field data confirmed that the main source of the Castanea pollen detected in the city was the Valdejetas area. The longer MPS duration in Valdejetas could be attributed to remaining resuspended pollen load, favored by the small size and weight of this pollen type even after the main FF period was over [19].
Regarding the wind and back-trajectory analyses, it is important to point out the dominant natural channeling of winds detected in Cordoba along the Guadalquivir River valley, where the city is located, as it was observed by authors in previous studies [52,53]. Surface winds, hence, coming from the Atlantic and Mediterranean coastal areas are channeled by the valley causing the dominance of south–southwest winds over Cordoba. This location, with its complex orography, could make it difficult in some situations for Castanea pollen to reach the city from the Sierra Morena, including the Valdejetas estate, affecting the low concentrations detected in Cordoba and favoring the influence of other more distant pollen sources, as has previously been observed for other pollen types [54,55].
In our study, to identify possible episodes medium- or long-distance range of Castanea pollen transport, back-trajectories were analyzed based on the HYSPLIT trajectory model. The HYSPLIT model has been successfully applied in some previous aerobiological studies to determine potential pollen transport pathways in various anemophilous species e.g., [56,57]. However, few studies compared airborne pollen with field phenological observations [52,58]. Having a pool of field phenological data offers the possibility of better determining the pollen pathways, and even supporting the hypotheses of medium- or long-distance transport [52]. In this sense, other possible factors such as pollen resuspension or consecutive phenological flowering of trees of different varieties or located at different altitudes, can be ruled out on the basis of real data [59,60]. Our results indicated that most of the episode days we detected were related to westerly slow and easterly airflow patterns. These patterns have been previously identified in research studies carried out in the area as those responsible for Quercus and olive pollen transport [59,61].
The four persistent periods selected occurred after the FF period and, associated with westerly slow and easterly airflow patterns, indicating that these patterns are largely responsible for the detection of Castanea pollen in the city of Cordoba: (a) westerly airflows could be associated with the large mass of chestnut populations in the Extremadura region, or even from those growing in the upper northern part of the Iberian Peninsula. (b) Easterly airflows cross the Mediterranean and reach Cordoba via Malaga, to the south, probably favoring the dispersion of Castanea pollen from the Genal river valley, located in this province, which contains one of the largest populations in Andalusia.
In regard to the persistent case related to southerly airflows, it could be associated to the presence of Castanea sativa in high mountain locations of north Africa, where flowering phenology is significantly later than in Cordoba and even in Malaga province [62,63]. Frequent occurrence of African intrusion events in southern Spain [52] could indicate that some concentrations of Castanea pollen recorded in Cordoba after FF coincide with the arrival of southerly sub-Saharan airflows. In fact, a similar phenomenon has been observed for other pollen types, such as Cannabis or Olea pollen [46,52].
Medium- or long-distance transport of Castanea pollen grains has been demonstrated in this study. Pollen transport in anemophilous species favors cross-pollination and genetic diversity. These phenomena are of great importance in the case of fragmented populations and declining species, such as Castanea sativa in southern Spain with the ecological and economic consequences that this entails in the region. Previous studies on the genetic composition of Andalusian chestnut forests have indicated that most of them are composed of old populations, and that replacement by new individuals is scarce [13]. Cross-pollination is therefore crucial for these populations to improve the genetic diversity of the species, and consequently its conservation. Moreover, in view of the allergenic potential of this pollen type, the results are important for the allergic population and for medical specialists.
The analysis of airborne pollen sources and transport helps us to understand the genetic flows between individuals and populations. It may provide an interesting insight into the geographical origins, current distribution, and future of plant species [64]. Our integrated study will help to clarify the potential pollen sources and transport pathways that make these gene flows possible. These sort of studies, together with those on chestnut genetics, including molecular markers, will improve our knowledge of the genetic flows of Castanea, which is vital for the inventorying, conservation, and management of the genetic resources of forest populations.

5. Conclusions

The results obtained from this integrated study of land-cover, meteorological, phenological, and aerobiological data from different sites in southern Spain, together with an atmospheric back-trajectory analysis, help to clarify the potential Castanea pollination pathways in this area.
The comparative analysis of the pollen curve, together with phenological analysis of the nearest chestnut populations, confirmed that some unusual pollen concentrations detected in the city of Cordoba after the chestnut flowering period in those populations could be due to episodes of medium- and long-distance transport from other more remote chestnut areas.
The backward trajectory analysis indicated that most of these unusual Castanea pollen peaks were related to westerly slow and easterly atmospheric flows. Nevertheless, some of the case studies suggested a transport of pollen grains associated with southerly airflows. In these cases, pollen sources would be chestnut populations situated further south, even those located in north African mountains.
These results offer valuable information about the transport of Castanea pollen grains through southern Spain. Any knowledge related to the dynamics of this pollen type, and therefore about the reproductive biology of chestnut tree, is of major significance due to the importance of this species overall, from an economic and ecological point of view. The small pollen size favors medium- and long-distance transport events, which would increase cross-pollination and therefore genetic diversity and viability of the highly fragmented chestnut populations of southern Spain.

Author Contributions

Conceptualization, R.L.-O. and H.G.-M.; analyzed the data, R.L.-O., and M.Á.H.-C.; software, M.Á.H.-C.; writing—original draft preparation, R.L.-O.; writing—review and editing, M.Á.H.-C., C.G., and H.G.-M. All authors have read and agreed to the published version of the manuscript.

Funding

This research was funded by the CLIMAQUER project (Reference 1260464), awarded by the Ministry of Economy and Knowledge of the Andalusian Regional Government through the European Regional Development Funds (ERDF).

Acknowledgments

We would like to express our thanks to the Valdejetas estate and its owners, the Sotomayor family, and especially to the manager, José Sotomayor, for their kind assistance in facilitating this study. Finally, we thank Manuel Arenas, lecturer in the Botany Department of the University of Cordoba, for his valuable contribution to the phenological sampling. The authors also gratefully acknowledge the NOAA Air Resources Laboratory (ARL) for the provision of the HYSPLIT transport and dispersion model used in this publication.

Conflicts of Interest

The authors declare no conflict of interest.

References

  1. Conedera, M.; Tinner, W.; Krebs, P.; de Rigo, D.; Caudullo, G. Castanea sativa in Europe: Distribution, habitat, usage and threats. In European Atlas of Forest Tree Species; San-Miguel-Ayanz, J., de Rigo, D., Caudullo, G., Houston Durrant, T., Mauri, A., Eds.; Publication Office of the European Union: Luxembourg, 2016; pp. 78–79. ISBN 978-92-79-52833-0. [Google Scholar]
  2. Goldsbrough, G.H. A Beginners Guide to Chestnut Growing; Hilton Press: Auckland, New Zealand, 1990; p. 40. [Google Scholar]
  3. Caudullo, G.; Welk, E.; San-Miguel-Ayanz, J. Chorological maps for the main European woody species. Data Brief 2017, 12, 662–666. [Google Scholar] [CrossRef] [PubMed]
  4. CMAOT, Conserjería de Medio Ambiente y Ordenación del Territorio. 2017. Plan Estratégico del Castañar. Available online: http://www.juntadeandalucia.es/medioambiente/portal_web/web/participa/opina_partcipa/plan_estrategico_castanar_sometido_informacion_publica.pdf (accessed on 14 July 2020).
  5. CAPDR, Consejería de Agricultura, Pesca y Desarrollo Rural. 2018. Estadísticas de Andalucía. Available online: https://www.juntadeandalucia.es/organismos/agriculturaganaderiapescaydesarrollosostenible/servicios/estadistica-cartografia/anuarios.html (accessed on 14 July 2020).
  6. Seijo, F.; Cespedes, B.; Zavala, G. Traditional fire use impact in the aboveground carbon stock of the chestnut forests of Central Spain and its implications for prescribed burning. Sci. Total Environ. 2018, 625, 1405–1414. [Google Scholar] [CrossRef] [PubMed]
  7. Hewitt, G.M. The genetic legacy of the Quaternary ice ages. Nat. Cell Biol. 2000, 405, 907–913. [Google Scholar] [CrossRef] [PubMed]
  8. Official Journal of the European Communities Commission. Decision of 18 December 1996 concerning a site information format for proposed Natura 2000 sites. (97/266/EC). Off. J. L. 1997, 107, 1–156. [Google Scholar]
  9. Martin, M.A.; Moral, A.; Martin, L.M.; Alvarez, J.B. The Genetic Resources of European Sweet Chestnut (Castanea sativa Miller) in Andalusia, Spain. Genet. Resour. Crop. Evol. 2006, 54, 379–387. [Google Scholar] [CrossRef]
  10. Martín, M.A.; Alvarez, J.B.; Mattioni, C.; Cherubini, M.; Villani, F.; Martín, L.M. On-farm conservation of sweet chestnut (Castanea sativa Mill.) in Andalusia. J. Agric. Sci. Technol. 2011, 5, 154. [Google Scholar]
  11. Zotano, J.G. El castañar de Pujerra: Caracterización geohistórica de un paisaje agroforestal singular. Takurunna Anu. Estud. Sobre Ronda Serranía 2011. pp. 74–82, ISSN: 2253-6191. Available online: https://dialnet.unirioja.es/servlet/articulo?codigo=5651590 (accessed on 14 July 2020).
  12. Rubio, A. Bases Ecologicas Preliminares Para La Conservacion De Los Tipos De Habitat De Interes Comunitario En España Recurso Electronico; Ministerio Medio Ambiente y Medio Rural y Marino: Madrid, Spain, 2009; ISBN 978-84-491-0911-9. [Google Scholar]
  13. Martín, M.A.; Mattioni, C.; Molina, J.R.; Alvarez, J.B.; Cherubini, M.; Herrera, M.A.; Villani, F.; Martín, L.M. Landscape genetic structure of chestnut (Castanea sativa Mill.) in Spain. Tree Genet. Genomes 2011, 8, 127–136. [Google Scholar] [CrossRef]
  14. Martin, M.A.; Mattioni, C.; Cherubini, M.; Taurchini, D.; Villani, F. Genetic diversity in European chestnut populations by means of genomic and genic microsatellite markers. Tree Genet. Genomes 2010, 6, 735–744. [Google Scholar] [CrossRef]
  15. Giovanetti, M.; Aronne, G. Honeybee interest in flowers with anemophilous characteristics: First notes on handling time and routine on Fraxinus ornus and Castanea sativa. Bull. Insectol. 2011, 64, 77–82, ISSN 1721-8861. [Google Scholar]
  16. Peeters, A.G.; Zoller, H. Long range transport of Castanea sativa pollen. Grana 1988, 27, 203–207. [Google Scholar] [CrossRef]
  17. Frei, T. Pollen distribution at high elevation in Switzerland: Evidence for medium range transport. Grana 1997, 36, 34–38. [Google Scholar] [CrossRef]
  18. Rousseau, D.-D.; Schevin, P.; Ferrier, J.; Jolly, D.; Andreasen, T.; Ascanius, S.E.; Hendriksen, S.-E.; Poulsen, U. Long-distance pollen transport from North America to Greenland in spring. J. Geophys. Res. Space Phys. 2008, 113. [Google Scholar] [CrossRef]
  19. Rizzi Longo, L.; Pizzulin Sauli, M. Flowering phenology and airborne pollen occurrence of Corylus and Castanea in Trieste (Italy), 1991–2004. Acta Bot. Croat. 2010, 69, 199–214, ISSN 0365–0588. [Google Scholar]
  20. Hirschwehr, R.; Jager, S.; Horak, F.; Ferreira, F.; Valenta, R.; Ebner, C.; Kraft, D.; Scheiner, O. Allergens from birch pollen and pollen of the European chestnut share common epitopes. Clin. Exp. Allergy 1993, 23, 755–761. [Google Scholar] [CrossRef]
  21. Kos, T.; Hoffmann-Sommergruber, K.; Ferreira, F.; Hirschwehr, R.; Ahorn, H.; Horak, F.; Jäger, S.; Sperr, W.; Kraft, D.; Scheiner, O. Purification, Characterization and N-Terminal Amino Acid Sequence of a New Major Allergen from European Chestnut Pollen—Cas s 1. Biochem. Biophys. Res. Commun. 1993, 196, 1086–1092. [Google Scholar] [CrossRef]
  22. Martín, P.C.; Ancillo, A.M.; Noche, C.D.; Vivas, A.G.; Soler, J.B.; Nolla, J.R. Sensibilización a polen de castaño y polinosis en el norte de Extremadura. Allergol. Et Immunopathol. 2005, 33, 145–150. [Google Scholar] [CrossRef]
  23. Ickovic, M.R.; Thibaudon, M. Allergenic significance of Fagaceae pollen. In Allergenic Pollen and Pollinosis in Europe; Blackwell Science: Oxford, UK, 1991; pp. 36–44. [Google Scholar]
  24. Sanchezmonge, R.; Blanco, C.; Lopeztorrejon, G.; Cumplido, J.; Recas, M.; Figueroa, J.; Carrillo, T.; Salcedo, G. Differential allergen sensitization patterns in chestnut allergy with or without associated latex-fruit syndrome. J. Allergy Clin. Immunol. 2006, 118, 705–710. [Google Scholar] [CrossRef]
  25. Skjoth, C.A.; Geels, C.; Hvidberg, M.; Hertel, O.; Brandt, J.; Frohn, L.M.; Hansen, K.M.; Hedegaard, G.B.; Christensen, J.H.; Moseholm, L. An inventory of tree species in Europe—An essential data input for air pollution modelling. Ecol. Model. 2008, 217, 292–304. [Google Scholar] [CrossRef]
  26. Pauling, A.; Ean, C.T.T.E.A.N.; Rotach, M.W.; Gehrig, R.; Clot, B. A method to derive vegetation distribution maps for pollen dispersion models using birch as an example. Int. J. Biometeorol. 2011, 56, 949–958. [Google Scholar] [CrossRef]
  27. Sofiev, M.; Belmonte, J.; Gehrig, R.; Izquierdo, R.; Smith, M.; Dahl, Å.; Siljamo, P. Airborne Pollen Transport. In Allergenic Pollen: A Review of the Production, Release, Distribution and Health Impacts; Sofiev, M., Bergmann, K.-C., Eds.; Springer: Dordrecht, The Netherlands, 2013; pp. 127–159. ISBN 978-94-007-4881-1. [Google Scholar]
  28. Sofiev, M.; Siljamo, P.; Ranta, H.; Linkosalo, T.; Jaeger, S.; Rasmussen, A.; Rantio-Lehtimaki, A.; Severova, E.; Kukkonen, J. A numerical model of birch pollen emission and dispersion in the atmosphere. Description of the emission module. Int. J. Biometeorol. 2012, 57, 45–58. [Google Scholar] [CrossRef] [PubMed] [Green Version]
  29. Lakes Environmental. WRPLOT View Version 8.0: Wind Rose Plots for Meteorological Data. 2018. Available online: http://www.weblakes.com/products/wrplot/index.html (accessed on 11 June 2020).
  30. Meier, U.; Bleiholder, H.; Buhr, L.; Feller, C.; Hack, H.; Heß, M.; Lancashire, P.D.; Schnock, U.; Stauß, R.; Van Den Boom, T. The BBCH system to coding the phenological growth stages of plants–history and publications. J. Für Kult. 2009, 61, 41–52, ISSN 0027-7479. [Google Scholar]
  31. Hirst, J.M. An Automatic Volumetric Spore Trap. Ann. Appl. Biol. 1952, 39, 257–265. [Google Scholar] [CrossRef]
  32. Kelly, H.Y.; Dufault, N.S.; Walker, D.R.; Isard, S.A.; Schneider, R.W.; Giesler, L.J.; Wright, D.L.; Marois, J.J.; Hartman, G.L. From Select Agent to an Established Pathogen: The Response to Phakopsora pachyrhizi (Soybean Rust) in North America. Phytopathology 2015, 105, 905–916. [Google Scholar] [CrossRef] [PubMed] [Green Version]
  33. Galán, C.; Cariñanos, P.; Alcázar, P.; Domínguez-Vilches, E. Spanish Aerobiology Network (Rea): Management and Quality Manual; Servicio Publicaciones Universitad Córdoba: Córdoba, Spain, 2007; pp. 1–300. ISBN 978-84-690-6354-5. [Google Scholar]
  34. Galán, C.; Smith, M.; Thibaudon, M.; Frenguelli, G.; Oteros, J.; Gehrig, R.; Berger, U.; Clot, B.; Brandao, R.; EAS QC Working Group. Pollen monitoring: Minimum requirements and reproducibility of analysis. Aerobiology 2014, 30, 385–395. [Google Scholar] [CrossRef]
  35. Martínez-Bracero, M.; Alcázar, P.; Velasco-Jiménez, M.J.; Calderón-Ezquerro, C.; Galán, C. Phenological and aerobiological study of vineyards in the Montilla-Moriles PDO area, Cordoba, southern Spain. J. Agric. Sci. 2018, 156, 821–831. [Google Scholar] [CrossRef]
  36. Galán, C.; Ariatti, A.; Bonini, M.; Clot, B.; Crouzy, B.; Dahl, A.; Fernandez-González, D.; Frenguelli, G.; Gehrig, R.; Isard, S.; et al. Recommended terminology for aerobiological studies. Aerobiology 2017, 33, 293–295. [Google Scholar] [CrossRef]
  37. Stein, A.F.; Draxler, R.R.; Rolph, G.D.; Stunder, B.J.B.; Cohen, M.D.; Ngan, F. NOAA’s HYSPLIT Atmospheric Transport and Dispersion Modeling System. Bull. Am. Meteorol. Soc. 2015, 96, 2059–2077. [Google Scholar] [CrossRef]
  38. Stohl, A. Computation, accuracy and applications of trajectories—A review and bibliography. Atmos. Environ. 1998, 32, 947–966. [Google Scholar] [CrossRef]
  39. Stunder, B.J.B. An Assessment of the Quality of Forecast Trajectories. J. Appl. Meteorol. 1996, 35, 1319–1331. [Google Scholar] [CrossRef]
  40. Draxler, R.; Stunder, B.; Rolph, G.; Stein, A.; Taylor, A. Hysplit4 User’s Guide; NOAA Air Resources Laboratory: College Park, MD, USA, 2018. [Google Scholar]
  41. Hjelmroos, M.; Franzén, L.G. Implications of recent long-distance pollen transport events for the interpretation of fossil pollen records in Fennoscandia. Rev. Palaeobot. Palynol. 1994, 82, 175–189. [Google Scholar] [CrossRef]
  42. Brugiapaglia, E.; De Beaulieu, J.-L.; Guiot, J.; Reille, M. Transect de pluie pollinique et étagement de la végétation dans le massif du Taillefer (Isère, France). Géographie Phys. Et Quat. 2002, 52, 209–218. [Google Scholar] [CrossRef] [Green Version]
  43. Jochimsen, M. Problem des Pollenfluqes in den Hochalpen; Lubrecht & Cramer Ltd.: Edinburgh, UK, 1986; p. 249. [Google Scholar]
  44. Halse, R.R. Nomenclature of allergenic plants. I. Ann. Allergy 1984, 53, 291–309, ISSN: 0003-4738. [Google Scholar] [PubMed]
  45. Jäger, S.; Litschaner, R. Aerobiological survey on Castanea pollen in Austria. In Proceedings of the International Symposium Castanea sativa Allergies and Plant Diseases, Lugano, Switzerland, 16–18 September 1999. [Google Scholar]
  46. Cabezudo, B.; Criado, M.R.; Sanchez-Laulhe, J.M.; Trigo, M.D.M.; Toro, F.J.; Polvorinos, F. Atmospheric transportation of marihuana pollen from North Africa to the Southwest of Europe. Atmos. Environ. 1997, 31, 3323–3328. [Google Scholar] [CrossRef] [Green Version]
  47. Hrga, I.; Mitić, B.; Alegro, A.; Dragojlović, D.; Stjepanović, B.; Puntarić, D. Aerobiology of Sweet Chestnut (Castanea sativa Mill.) in North-West Croatia. Coll. Antropol. 2010, 34, 501–507. [Google Scholar]
  48. Jato, V.; Rodríguez-Rajo, F.J.; Aira, M.J.; Tedeschini, E.; Frenguelli, G. Differences in atmospheric trees pollen seasons in winter, spring and summer in two European geographic areas, Spain and Italy. Aerobiology 2012, 29, 263–278. [Google Scholar] [CrossRef]
  49. Astray, G.; Fernández-González, M.; Rodríguez-Rajo, F.; López, D.; Mejuto, J. Airborne Castanea pollen forecasting model for ecological and allergological implementation. Sci. Total Environ. 2016, 676, 110–121. [Google Scholar] [CrossRef]
  50. González-Naharro, R.; Quirós, E.; Fernández-Rodríguez, S.; Silva-Palacios, I.; Maya-Manzano, J.M.; Tormo-Molina, R.; Pecero-Casimiro, R.; Monroy-Colin, A.; Gonzalo-Garijo, Á. Relationship of NDVI and oak (Quercus) pollen including a predictive model in the SW Mediterranean region. Sci. Total Environ. 2019, 676, 407–419. [Google Scholar] [CrossRef]
  51. Monroy-Colín, A.; Maya-Manzano, J.M.; Tormo-Molina, R.; Pecero-Casimiro, R.; Gonzalo-Garijo, M.Á.; Fernández-Rodríguez, S. HYSPLIT as an environmental impact assessment tool to study the data discrepancies between Olea europaea airborne pollen records and its phenology in SW Spain. Urban For. Urban Green. 2020, 53, 126715. [Google Scholar] [CrossRef]
  52. García-Mozo, H.; Hernández-Ceballos, M.A.; Trigo, M.; Galán, C. Wind dynamics’ influence on south Spain airborne olive-pollen during African intrusions. Sci. Total Environ. 2017, 609, 1340–1348. [Google Scholar] [CrossRef]
  53. Hernández-Ceballos, M.A.; Adame, J.; Bolívar, J.; De La Morena, B. A mesoscale simulation of coastal circulation in the Guadalquivir valley (southwestern Iberian Peninsula) using the WRF-ARW model. Atmos. Res. 2013, 124, 1–20. [Google Scholar] [CrossRef]
  54. Hernández-Ceballos, M.A.; Soares, J.; García-Mozo, H.; Sofiev, M.; Bolivar, J.; Galan, C. Analysis of atmospheric dispersion of olive pollen in southern Spain using SILAM and HYSPLIT models. Aerobiology 2013, 30, 239–255. [Google Scholar] [CrossRef]
  55. Hernández-Ceballos, M.A.; García-Mozo, H.; Galan, C. Cluster analysis of intradiurnal holm oak pollen cycles at peri-urban and rural sampling sites in southwestern Spain. Int. J. Biometeorol. 2014, 59, 971–982. [Google Scholar] [CrossRef] [PubMed]
  56. Bogawski, P.; Borycka, K.; Grewling, Ł.; Kasprzyk, I. Detecting distant sources of airborne pollen for Poland: Integrating back-trajectory and dispersion modelling with a satellite-based phenology. Sci. Total Environ. 2019, 689, 109–125. [Google Scholar] [CrossRef]
  57. Celenk, S. Detection of reactive allergens in long-distance transported pollen grains: Evidence from Ambrosia. Atmos. Environ. 2019, 209, 212–219. [Google Scholar] [CrossRef]
  58. Ghasemifard, H.; Ghada, W.; Estrella, N.; Lüpke, M.; Oteros, J.; Traidl-Hoffmann, C.; Damialis, A.; Buters, J.; Menzel, A. High post-season Alnus pollen loads successfully identified as long-range transport of an alpine species. Atmos. Environ. 2020, 231, 117453. [Google Scholar] [CrossRef]
  59. Hernández-Ceballos, M.A.; García-Mozo, H.; Adame, J.A.; Domínguez-Vilches, E.; De La Morena, B.A.; Bolívar, J.P.; Galán, C. Synoptic and meteorological characterisation of olive pollen transport in Córdoba province (south-western Spain). Int. J. Biometeorol. 2010, 55, 17–34. [Google Scholar] [CrossRef]
  60. Rojo, J.; Pérez-Badia, R. Spatiotemporal analysis of olive flowering using geostatistical techniques. Sci. Total Environ. 2015, 505, 860–869. [Google Scholar] [CrossRef]
  61. Hernández-Ceballos, M.A.; García-Mozo, H.; Adame, J.A.; Domínguez-Vilches, E.; Bolívar, J.P.; De La Morena, B.A.; Pérez-Badía, R.; Galán, C. Determination of potential sources of Quercus airborne pollen in Córdoba city (southern Spain) using back-trajectory analysis. Aerobiology 2011, 27, 261–276. [Google Scholar] [CrossRef]
  62. Bounous, G. The Chestnut: A Multipurpose Resource for The New Millennium. Acta Hortic. 2005, 13, 33–40. [Google Scholar] [CrossRef]
  63. Krebs, P.; Conedera, M.; Pradella, M.; Torriani, D.; Felber, M.; Tinner, W. Quaternary refugia of the sweet chestnut (Castanea sativa Mill.): An extended palynological approach. Veg. Hist. Archaeobotany 2004, 13, 145–160. [Google Scholar] [CrossRef] [Green Version]
  64. Mattioni, C.; Martin, M.A.; Pollegioni, P.; Cherubini, M.; Villani, F. Microsatellite markers reveal a strong geographical structure in European populations of Castanea sativa (Fagaceae): Evidence for multiple glacial refugia. Am. J. Bot. 2013, 100, 951–961. [Google Scholar] [CrossRef] [PubMed] [Green Version]
Figure 1. Study area: (a) distribution map of Castanea sativa in Europe and north Africa based on the distribution layers proposed by Caudullo et al. [3]. (b) Chestnut population in Spain and in the Andalusia region (darker marked area). (c) Location of samplers in Cordoba province.
Forests 11 01092 g001
Figure 2. Wind rose during the study period (2015–2019) for (a) Cordoba city and (b) the Valdejetas estate.
Forests 11 01092 g002
Figure 3. Castanea pollen concentrations recorded in each year of the study in each location. Pollen grains/m3 per day in the city of Cordoba (blue line); pollen grains/cm2 per week in the Valdejetas estate (yellow line); full flowering detected in the Sierra Morena mountains.
Forests 11 01092 g003
Figure 4. Average cluster results (centroids) in Cordoba at 100 m (a) on dates during full flowering (FF) and (b) after FF of Castanea pollen (Table 1). In both, the numbers on the right in the centroids are the percentage of complete trajectories occurring in that cluster, and the numbers on the left are an identification number of the centroid. (c) Castanea pollen concentrations statistics by persistent cases within and after FF.
Forests 11 01092 g004
Figure 5. Daily 96-h backward trajectories in Cordoba at 100 m during (a) 21 June 2015 and after (b) 29 June 2019, (c) 13 July 2016, (d) 23 June 2019 the Castanea pollen periods above the 90th percentile, and (e) under the arrival of air masses from north Africa (14 July 2017).
Forests 11 01092 g005
Figure 6. Variation of wind direction in the city of Cordoba during the selected episode days. Graphs show wind direction data every 90 min during 48 h, corresponding to the day before and the episode day, under different patterns: (a) E pattern (21 June 2015 and 29 June 2019); (b) WS pattern (13 July 2016 and 23 June 2019); S pattern (14 July 2017). The grey box indicates the episode day.
Forests 11 01092 g006
Table 1. Selected episode days during the study period that reported unusual pollen data in Cordoba.
2015201620172019
21 June13 July *21 June23 June *
23 June5 August *5 July *29 June *
29 June *8 August *14 July *2 July *
8 August *15 August *28 July *12 July *
27 September *19 August *22 August *23 August *
29 September *8 November *6 September *17 September *
* Dates after the full flowering (FF) period.
Publisher’s Note: MDPI stays neutral with regard to jurisdictional claims in published maps and institutional affiliations.