Article

Assessing and Modeling Soil Detachment Capacity by Overland Flow in Forest and Woodland of Northern Iran

by
Misagh Parhizkar
1,
Mahmood Shabanpour
1,
Mohammadreza Khaledian
1,
Artemio Cerdà
2,
Calvin W. Rose
3,
Hossein Asadi
4,
Manuel Esteban Lucas-Borja
5 and
Demetrio Antonio Zema
6,*
1
Faculty of Agricultural Sciences, University of Guilan, Rasht 41635-1314, Iran
2
Soil Erosion and Degradation Research Group (SEDER), University of Valencia, E-46001 Valencia, Spain
3
Faculty of Environmental Sciences, Environmental Future Centre, Griffith University, Nathan, Queensland 4111, Australia
4
Department of soil science, University of Tehran, Tehran 11369, Iran
5
Escuela Técnica Superior Ingenieros Agrónomos y Montes, Universidad de Castilla-La Mancha, Campus Universitario, E-02071 Albacete, Spain
6
Department AGRARIA, Mediterranean University of Reggio Calabria, Loc. Feo di Vito, I-89122 Reggio Calabria, Italy
*
Author to whom correspondence should be addressed.
Forests 2020, 11(1), 65; https://doi.org/10.3390/f11010065
Submission received: 25 November 2019 / Revised: 26 December 2019 / Accepted: 3 January 2020 / Published: 4 January 2020
(This article belongs to the Section Forest Inventory, Modeling and Remote Sensing)

Abstract

:
Land use has significant effects on the erosion process, since it influences the soil detachment capacity by causing an overland flow (Dc). The effects of different land uses on the rill detachment capacity have not been explained in depth, and the hydraulic parameters providing accurate estimates of this soil property have not been completely identified. This study quantifies Dc at low flow rates in woodland and forestland, compared to two other land uses (cropland and grassland), in the Saravan watershed (Northern Iran), and develops prediction models of Dc and rill erodibility (Kr). Dc was measured on undisturbed soil samples, collected in the four land uses, and characterized in terms of the main physico-chemical properties in a flume experiment, simulating five slopes and five shallow water flows. The results showed that Dc was significantly lower in woodland and forestland compared to cropland and grassland, as the consequence of the changes in the main soil properties and the more developed vegetation cover and structure. Dc was positively correlated to clay and silt contents of soils, and negatively correlated to sand content, aggregate stability, root density, and organic matter. The stream power and unit stream power were found to be very accurate predictors of Dc in woodland and forestland, respectively. Kr values, which assumed the lowest values in woodland and forestland, were provided by interpolating Dc and the shear stress of water flow. Overall, this study has confirmed that vegetation cover and improved soil properties in forestland and woodland may help to reduce erosion in delicate environment ecosystems, such as the forests of Northern Iran.

1. Introduction

Soil erosion consists of detachment, transportation, and deposition of sediments due to rainfall and surface runoff [1,2]. Soil detachment is the separation of soil particles from the matrix over the terrain surface caused by erosive agents [3], providing loose and non-cohesive sediment for subsequent transport and deposition [4]. The process of soil detachment may be due to both raindrop impact and the overland flow [5,6]. When detachment is due to the overland flow, this process plays an important role in the overall erosion process [1,7,8]. The maximum value of the soil detachment due to the overland flow is the soil detachment capacity [9].
The mechanisms of soil detachment due to overland flow are different for inter-rill and rill erosion [10]. Soil detachment in inter-rill erosion is mainly caused and enhanced by raindrop impact, which is insignificant in soil detachment due to rill erosion [11,12]. The latter mechanism, which mainly caused by overland flow, is the most important erosive process on steep slopes [7,13] and it is different between shallow or low flows and high flow rates [14].
Understanding rill erosion due to low flow rates, particularly when erosion affects delicate forestland ecosystems, is important for hydrological predictions using process-based erosion models [15], such as the Water Erosion Prediction Project (WEPP) [16]. Since rill erosion is the prevailing form in process-based erosion models, the so-called “soil detachment capacity by rill flow” or, more simply, the “rill detachment capacity” (hereinafter indicated by “Dc”), is a key parameter for accurate predictions of erosion [17]. Therefore, the quantification of Dc under different conditions is a critical issue to improve the prediction accuracy of these models.
Dc depends on both the characteristics of the overland flow and soil properties [18]. In regards to the flow characteristics, the shear stress [18,19], stream power [20,21], unit stream power [22,23], and unit energy [8,24] are the hydraulic parameters that mainly influence the rill detachment capacity. In general, the shear stress and stream power are most commonly used to predict the soil detachment capacity using power functions [25], although stream power is preferred [10,26,27]. Among the relationships between the soil properties on Dc, the type, texture, bulk density, cohesion, stability and median diameter of aggregates, organic matter and water content, and infiltrability [4,22,28] are the most effective characteristics for predicting the soil detachment capacity. In more detail, Li et al. [27] showed that the latter is well estimated using the soil bulk density, median diameter, silt content, cohesion, and root density, while the bulk density and moisture of undisturbed soil samples were the best predictors of soil detachment capacity according to De Baets and Poesen [29].
Having highlighted the importance of soil properties in estimating Dc, it is thus clear that a specific land use plays an important role on soil erodibility, since it influences soil hydrology by modifying the soil properties [30,31,32,33,34,35]. Therefore, an inappropriate land use can have a strong influence on the erosion process [33,36], due to variations in soil detachment capacity [4,27]. For instance, intensive agriculture and land abandonment may generally cause soil damage, thus increasing the erosion rates [37,38,39], on which soil detachment clearly has some impact. Since forestland and woodland are very delicate ecosystems, and land use changes (such as deforestation and conversion into agricultural activities) may aggravate their susceptibility to soil erosion, it is important to evaluate the effects of land use on the rill detachment capacity due to the rill overland flow. At present, few studies have accomplished this task and the effects of different land uses on rill detachment capacity have not been quantified in depth [4], particularly for forestland and woodland. Zhang et al. [4,40] found that the detachment rate of cropland soil was from two to 13 times greater than in grassland, shrubland, and wasteland. More recently, Li et al. [27] reported that, on average, the ratios of the soil detachment capacity of cropland due to overland flow are much higher (from seven to 45 times) compared to for orchards, shrubland, woodland, grassland, and wasteland, and their variability for different types of land uses is closely related to soil properties, root systems, and tillage operations.
Evidently, there is still a need for a better comprehension of the land use influence on rill detachment capacity. Moreover, the hydraulic parameters of overland flow, which provide accurate estimates of rill detachment capacity (with particular attention to forestland and woodland), have not been completely identified and this need deserves more investigation.
To fill these gaps, this study quantifies the rill detachment capacity at low flow rates using an experimental flume on soils sampled in woodland, forestland, cropland, and grassland of the Saravan watershed (Northern Iran). We hypothesize that the more developed vegetation cover and structure of woodland and forestland are able to reduce the rill detachment capacity, compared to the other land uses. Moreover, regression equations are proposed to predict Dc and Kr from hydraulic parameters under controlled conditions of flow rate and terrain slope.
The study is a contribution to understand the relationships between the soil erodibility and both the soil properties and the hydraulic parameters under different land uses.

2. Materials and Methods

2.1. Study Area

In Iran, the anthropogenic activities (e.g., deforestation, intensive agriculture, farm abandonment), which play important influences on the natural soil pedogenesis, have been very intense in the past 50 years. In the northern part of this country, the reduction of forestland cover, due to the expansion of arable land and intensive cultivation, population growth, and technological development [41], has led to soil degradation in large areas [42]. Therefore, this region seems to be suitable for the study aims, since degradation of soil quality and increased erosion rate have been the main results of land use changes.
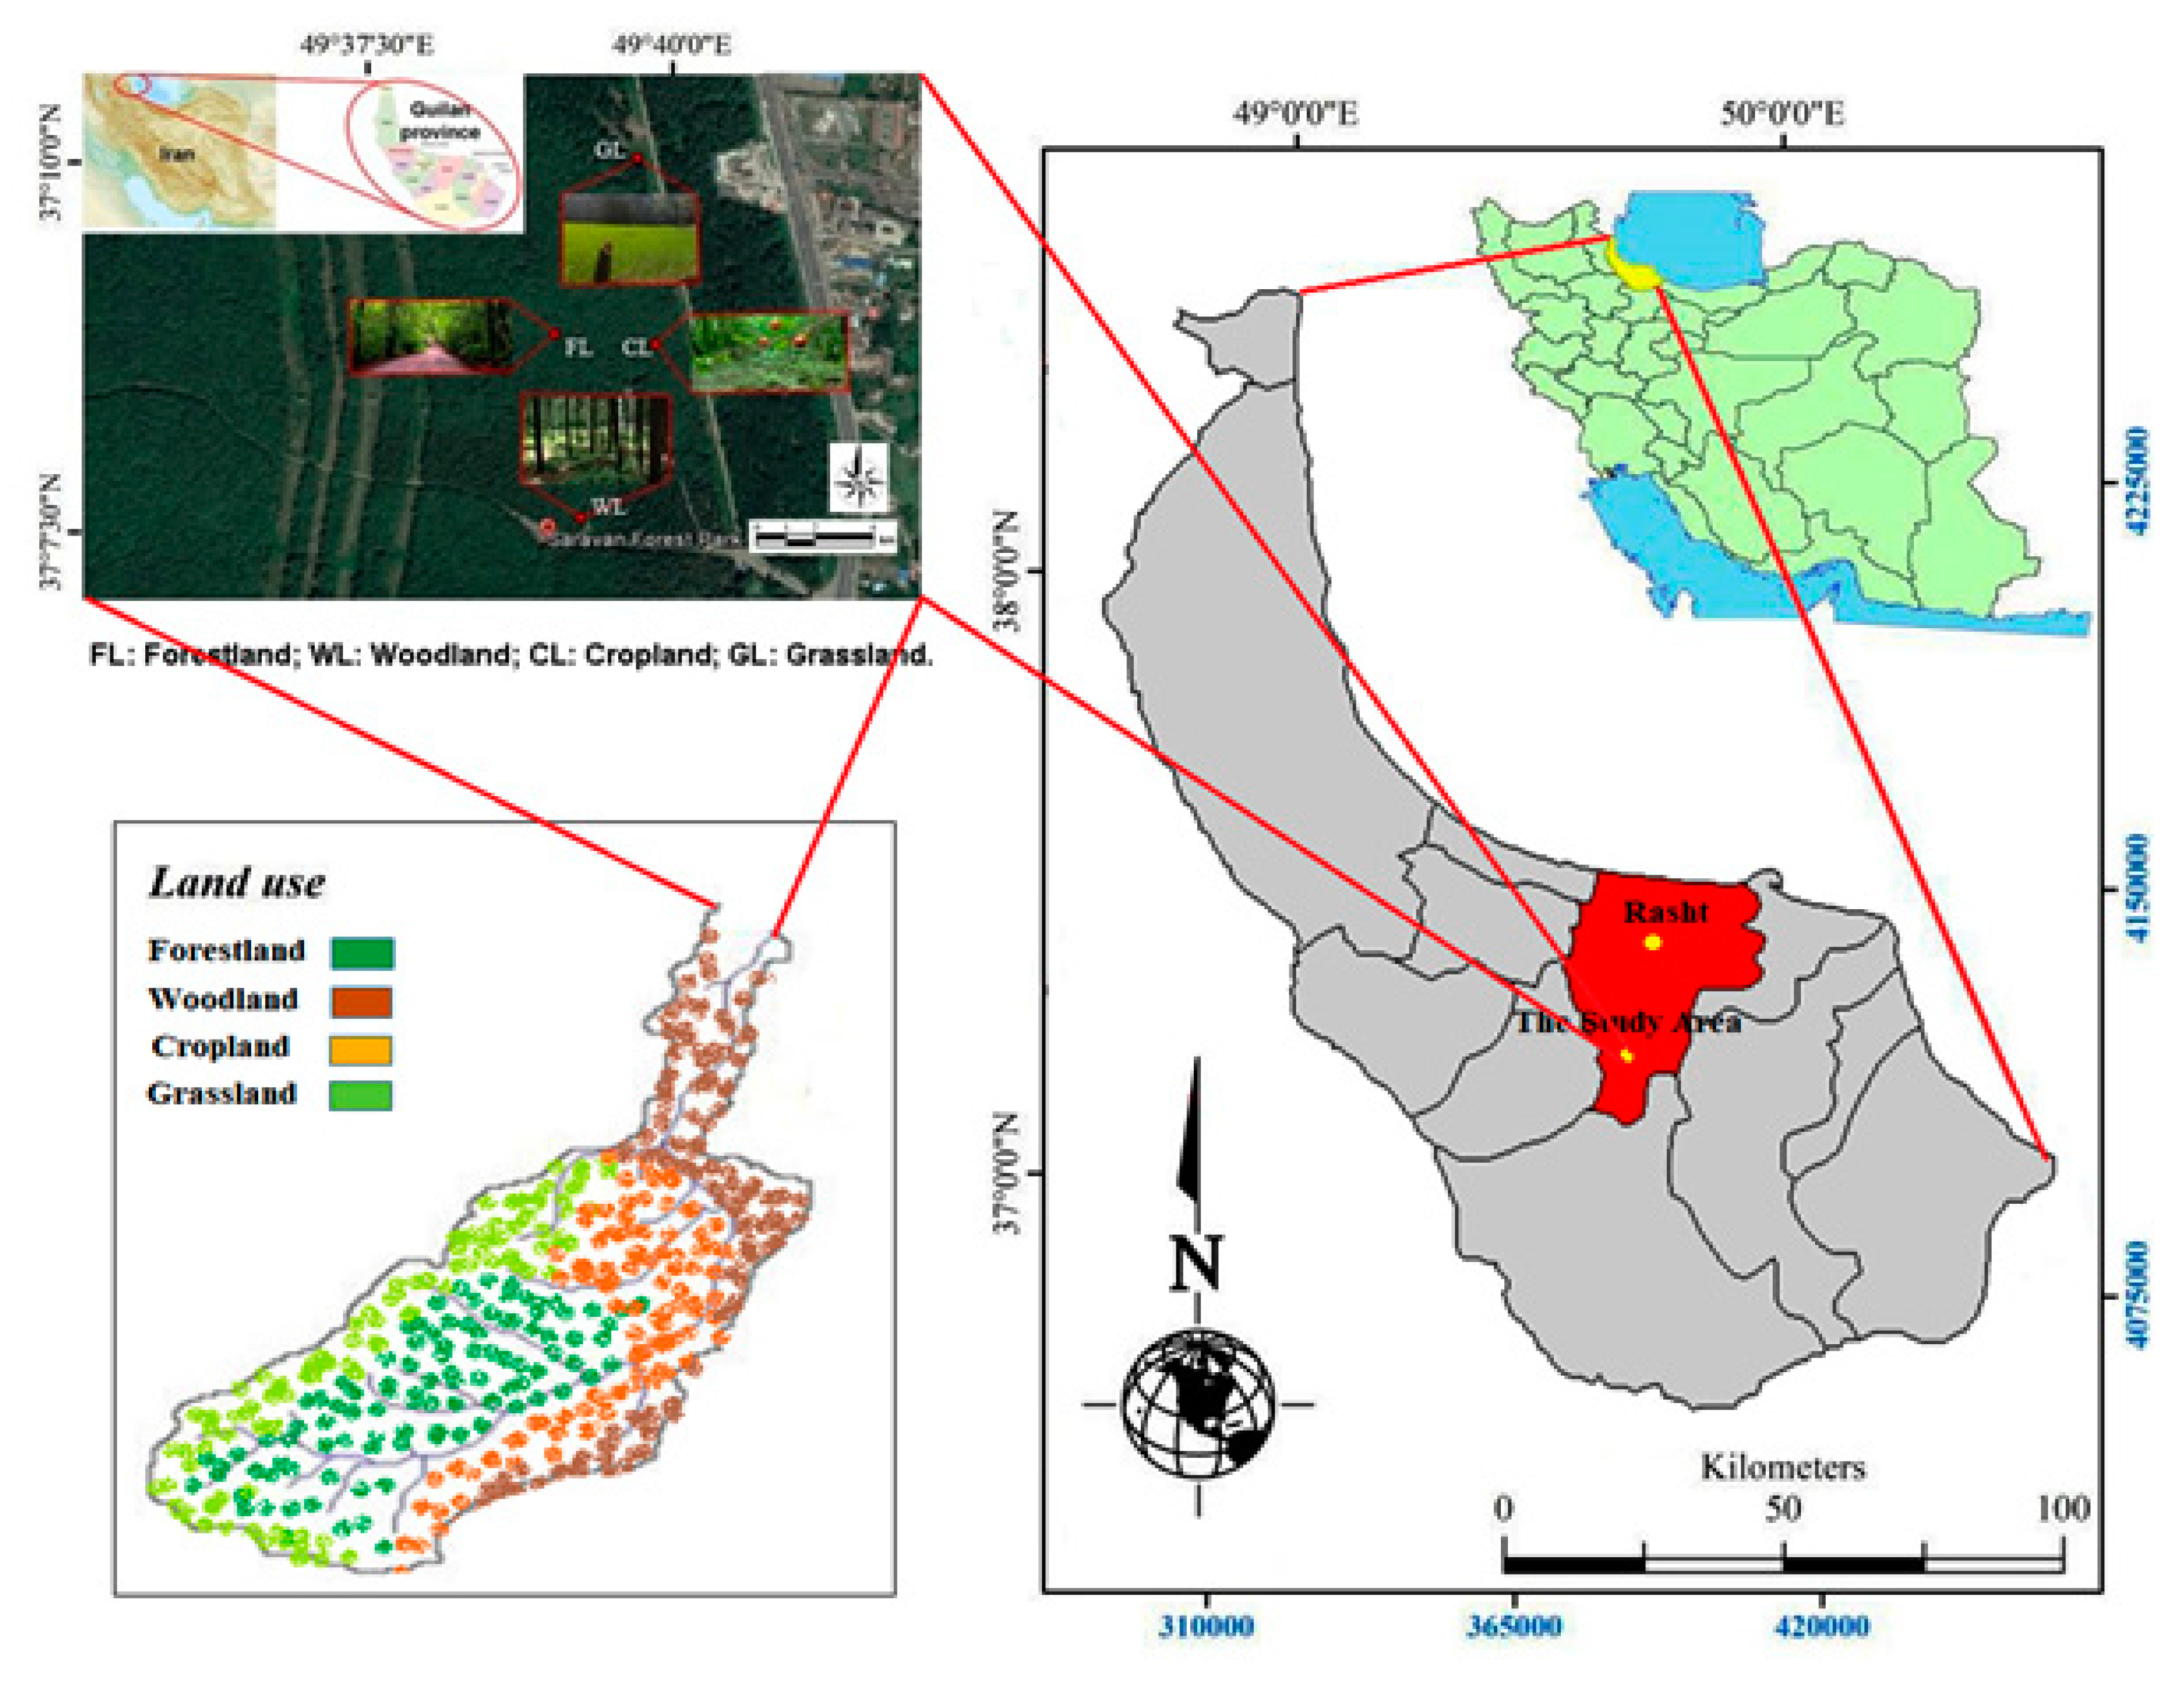
The study area is the Saravan Forestland Park, which is one of the oldest forestlands in Guilan province. The experiments were carried out in the Saravan watershed, which covers an area of 14.87 km2 (outlet coordinates 37°08′04′′ N, 49°39′44″ E) between 50 and 250 m above the mean sea level (Figure 1).
The climate of the area is typically Mediterranean, Csa type, according to the Köppen-Geiger classification [43]. The mean annual temperature and precipitation are 16.3 °C and 1360 mm, respectively [44].
Forestland, cropland, grassland, and woodland in the Saravan watershed were the land uses under investigation in this study. The representative tree and plant species of the forestland are Carpinus betulus, Parrotia, willow, and pussy willow. Woodland is covered by smaller trees with lower density than forestlands. Grassland is covered by herbaceous vegetation and shrubs. Cropland consists of planted black berry, greengage, and sloe, subjected only to planting and harvesting as tillage operations.

2.2. Soil Sampling and Analyses

Dc was measured between August and September 2018 after collecting undisturbed soil samples of the four land uses in areas with similar slope gradients and elevation. In cropland, soil was sampled from flat patches.
The sampling procedure was adopted in accordance with the work of Zhang et al. [4,10]. A steel ring (0.1 m in diameter and 0.05 m in height) was used to extract the samples from soil. Before sampling, rocks, weeds, and litter were removed over the soil surface. In other to ensure minimum disturbance of the soil sample, roots and other debris surrounding the steel ring were clipped, while gently pressing the ring into the soil. After that, the steel ring was inserted into the soil and the sample bottom was carefully trimmed to remove the excess soil. Two cotton cloths were used to cushion the top and bottom of the steel ring, in order to avoid disturbance while the sample was transported to the laboratory.
Bulk density, aggregate stability in water, organic matter content, and root weight density were determined on additional 100 soil samples (25 samples × 4 land uses), randomly collected in the same location of each land use. Soil bulk density and aggregate stability were measured by the oven-drying and the wet-sieving methods, respectively. Soil organic matter was estimated by using the potassium dichromate colorimetric method. Root weight density was measured using a washing method over a sieve with a 1-mm mesh and subsequently roots of each soil sample were weighted after oven-drying for 24 h at 65 °C.

2.3. The Laboratory Flume

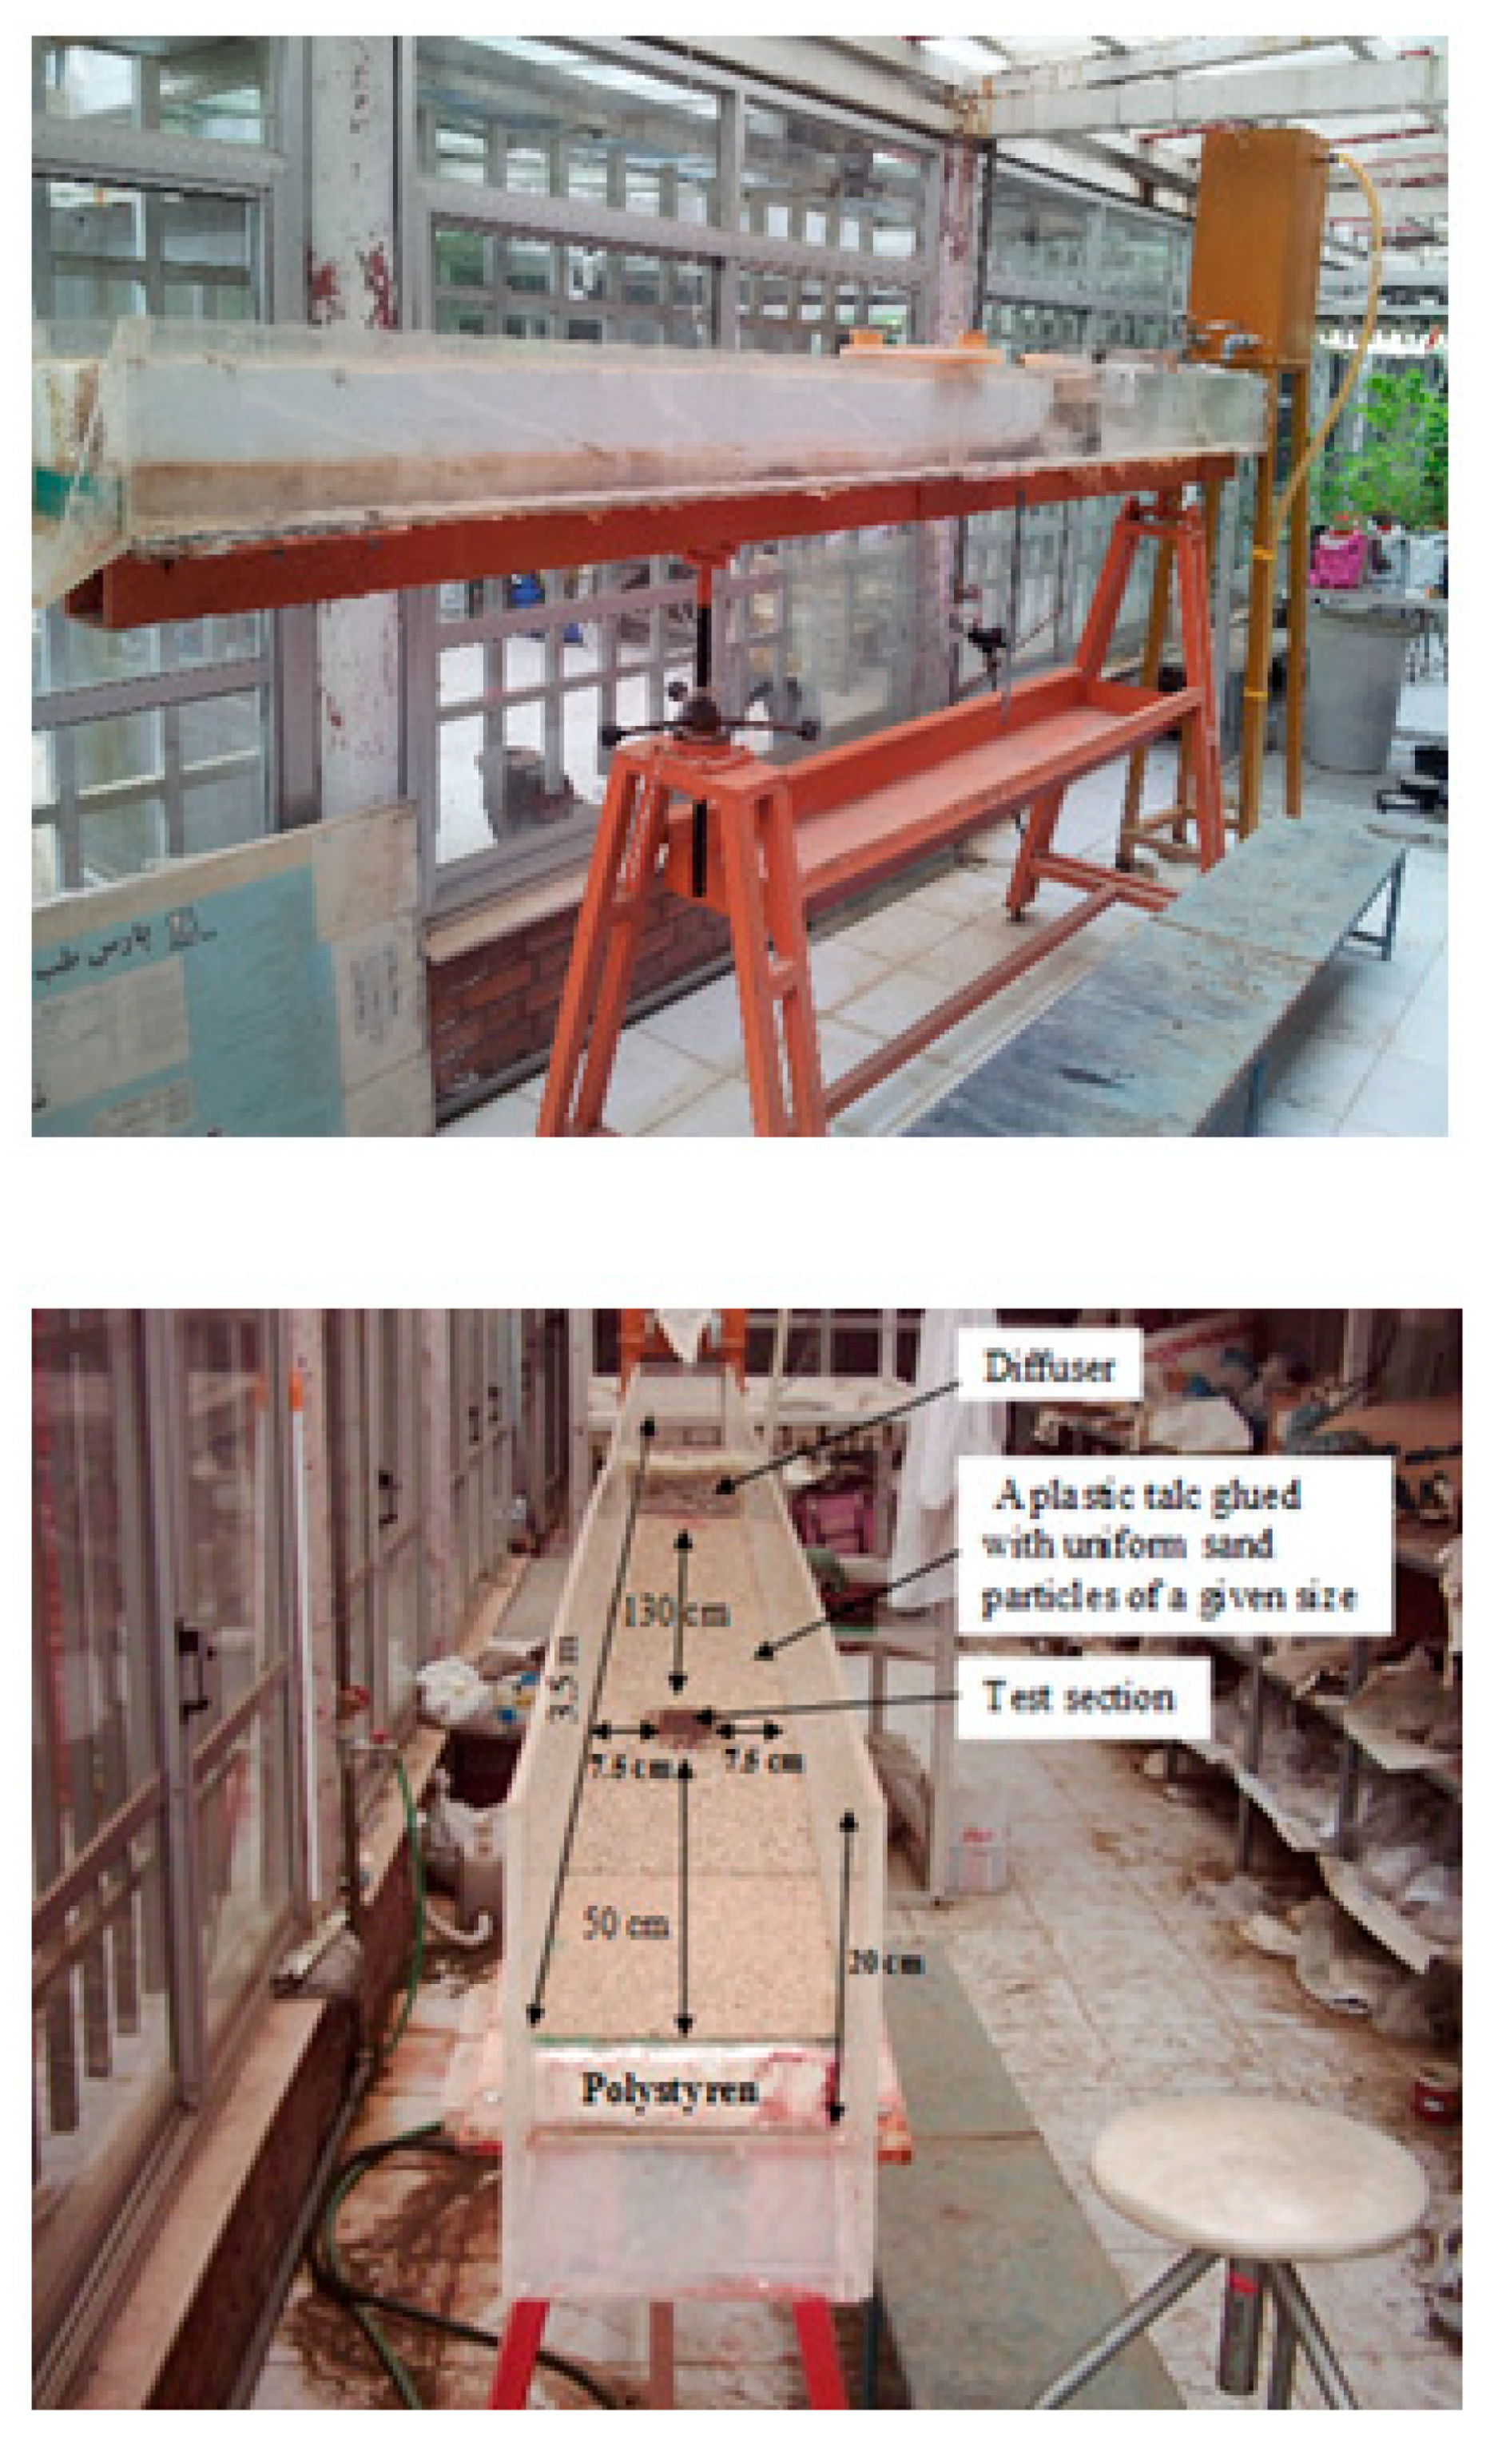
To generate rill flows, a laboratory scale flume was used (Figure 2). Combinations of soil samples of each land use and different values of flow rate and terrain slope were simulated (hereinafter each combination will be indicated as “experiment”).
More detailed information about the experimental flume is reported in Asadi et al. [45,46]. To summarize, this flume, with a rectangular cross section, was 3.5-m long and 0.2-m wide. In order to reproduce the natural roughness of the soil, a 5-mm layer was put on the flume bed [14].

2.4. The Experimental Design

For each experiment, a sample of soil was packed in a steel ring (0.1 m in diameter, 0.05 m in height). The surface of each soil sample, sieved through a 2-mm mesh, was wetted by light spraying. The wetted sample in the steel ring was then placed in a hole (0.1 m in diameter) of the flume bed, located far from the flume outlet [10], making sure that the sample upper surface was flushed by water flowing over the flume bed surface [14,18]. Then, the flume slope and flow rate were adjusted to the desired values. The slope of the flume, set manually, could range between 0 and 38%. Water was poured into the flume from an upstream tap and the flow rate measured at the outlet, as explained in Section 2.6.
Before starting the experiment, a cover panel was used to prevent soil samples from scouring. Once the water flow started and stabilized, the panel was removed and Dc was measured together with the hydraulic parameters of the water flow. Each experiment was carried out for no more than five minutes. In order to reduce the influence of uneven detachment within the sample, the time of the experimental test was controlled by the scouring depth (0.02 m) for each soil sample [14,18]. The experiment ended when the depth of the eroded soil in the steel ring was 0.015 m. Finally, the wet soil of the sample was oven-dried at 105 °C for 24 h to measure its dry weight.
For each land use, five water flow rates (0.22, 0.33, 0.44, 0.56, and 0.67 L m−1 s−1) and as many slope gradients (3.4%, 8.5%, 17.6%, 26.8%, and 36.4%) were simulated in the flume. Overall, 400 soil samples (4 land uses × 5 water flow rates × 5 slope gradients × 4 replications) were subjected to the experiments.

2.5. Determination of the Rill Detachment Capacity and Erodibility

During each experiment, Dc [kg s−1 m−2] was calculated as the average value of four replicates, using the following equation:
D c = Δ M A Δ t
where:
  • ΔM [kg] = dry weight of detached soil
  • Δt [s] = experiment duration [s]
  • A [m2] = area of the soil sample.
Soil detachment in rills occurs when shear stress of the water flow acting on the soil (τ) exceeds the critical shear stress (τc) and the sediment load is lower than sediment transport capacity [17]. According to the WEPP model formulation, the rill erodibility (Kr, [s m−1]) and τc ([Pa]) were calculated as the slope and intercept of the following regression equation interpolating Dc and τ (Nearing et al., 1989):
D C = K r ( τ τ c ) .

2.6. Determination of the Hydraulic Parameters

When the flow stabilized into the flume, the water depth was measured in two cross sections (placed 0.4 m and 1 m upstream of the flume outlet, respectively), using a level-probe with an accuracy of 1 mm. For each cross section, three points were considered for these measurements, of which one in the center of the flume and two others at 0.01 m from each side of the flume. Based on these six measurements, the average value of the flow depth was calculated for each experiment.
In accordance with the equations developed from several authors [47] for streams, rivers, and open channels, a rectangular cross section was assumed for the rills and its hydraulic radius (R, [m]) was calculated as follows:
R = h p 2 p + h
where h (equal to 0.2 m in this study) and p [m] are the flow width and depth, respectively.
The flow rate per unit width (q, [L m−1 s−1]) was measured five times per experiment, collecting the water into a graduated plastic cylinder. The flow velocity (v, [m s−1]) m was estimated using a fluorescent dye technique in ten replicated measurements. The water temperature (T, [°C]) was also recorded in order to calculate its viscosity. Based on these data, the Reynolds number (Re, [–]) was calculated. Furthermore, the mean water flow velocity (V, [m s−1]) was determined reducing the water velocity by 0.6, 0.7, or 0.8, when the flow was laminar, transitional or turbulent, respectively [48].
The shear stress τ [Pa]) [9], stream power (ω, [kg s−3]) [49], unit stream power (ϕ, [m s−1]) [23] and unit energy (E, [m]) [15] were calculated using the following equations:
τ = ρ g R S
ω = ρ g R S V = τ V
ϕ = S V
E = α V 2 2 g + h cos θ
where:
  • ρ = water density [kg m−3]
  • g = gravity acceleration [m s−2]
  • S = slope gradient [m m−1]
  • α = kinetic energy correction (in this case assumed as one)
  • θ = slope gradient [°] of the flume.
Table 1 reports the values of the hydraulic parameters calculated for the different land uses, slopes, and flow rates.

2.7. Statistical Analysis

Hypothesizing that the samples were independent and the distribution was normal, the t-test was used to assess the statistical significance of the soil properties among the land uses (at p level lower than 0.05). The normal distribution hypothesis was checked using QQ-plots.
Then, a Principal Component Analysis (PCA) was applied to the soil parameters, in order to find correlations (using Pearson’s method), [50] among the soil properties, to identify the existence of meaningful derivative variables (the Principal Components, PCs) and to group soil samples according to the investigated land uses.
The relationships between Dc (considered as the dependent variable) and the hydraulic parameters (i.e., V, τ, ω, ϕ and E, assumed as independent variables) were analyzed by a non-linear regression method based on power functions, according to the literature e.g., reference [25]. The accuracy of the regression equations was evaluated using quantitative indexes, as the relative error (RE), the coefficient of determination (r2) and the coefficient of efficiency (NSE) [51]. The optimal values of these indexes are one for r2 and E as well as zero for RE, while the acceptance limits of r2 and NSE are 0.50 and 0.35, respectively. The prediction capacity of a model is considered to be good when r2 and E are higher than 0.75 [52,53,54].
All statistical analyses were carried out using the software XLSTAT 9.0, Addinsoft, Paris, France, SPSS 22.0, IBM, New York, USA, Statgraphics® Plus 6.0, Statgraphics Technologies, Inc., Virginia, USA, and JMP® 7.0, SAS Institute, Milan, Italy.

3. Results

3.1. Variability of Soil Properties and Detachment Capacity among Land Uses

The characterization of soil texture shows that all samples were clay loamy (according to SSDS, 2017, classification) [55], with about 33%–37% of clay, 47%–49% of silt, and 14%–20% of sand (Table 2). The clay and sand contents were slightly different in cropland compared to the other land uses, although not to a significant degree (p < 0.05).
In general, the other soil properties varied among the investigated land uses. The cultivated soil had the highest bulk density and the lowest aggregate stability, root weight density and organic matter content. All these properties were significantly different from those detected in the other land uses (Table 2).
The aggregate stability was the maximum possible level in woodland (about 3-fold and 2-fold the values measured in cropland and grassland, respectively) and slightly lower (−25%) in forestland (although not significantly). The soils sampled in woodland and forestland showed the highest root weight density (with a maximum of 0.63 ± 0.03 kg m−3 in forestland) and organic matter content (with a maximum of 1.87 ± 0.02% in forestland). The differences in these soil properties were statistically significant compared to the two other land uses (Table 2).
As shown in Figure 3, the rill detachment capacity was significantly influenced by the land use. On average, this soil property was the highest in cropland (0.049 kg m−2 s−1) and the lowest in forestland (0.008 kg m−2 s−1). Dc of grassland and woodland was closer to the latter land use rather to cropland. The rill detachment capacity of cropland was 2-fold, 4-fold, and 6-fold greater than in grassland, woodland and forestland, respectively. Moreover, the variability of this soil properties was larger than in the other land uses (standard deviation of 0.045 kg m−2 s−1 against 0.024, 0.01, and 0.005 kg m−2 s−1 of grassland, woodland, and forestland) (Figure 3).
The analysis of Pearson’s matrix shows that rill detachment capacity was positively correlated with silt and clay contents of soil and negatively correlated with bulk density (although not significantly), root weight density, sand content, aggregate stability, and organic matter. Many other significant correlations were also found among the soil properties, except for bulk density, which was not correlated with Dc and organic matter (Table 3).
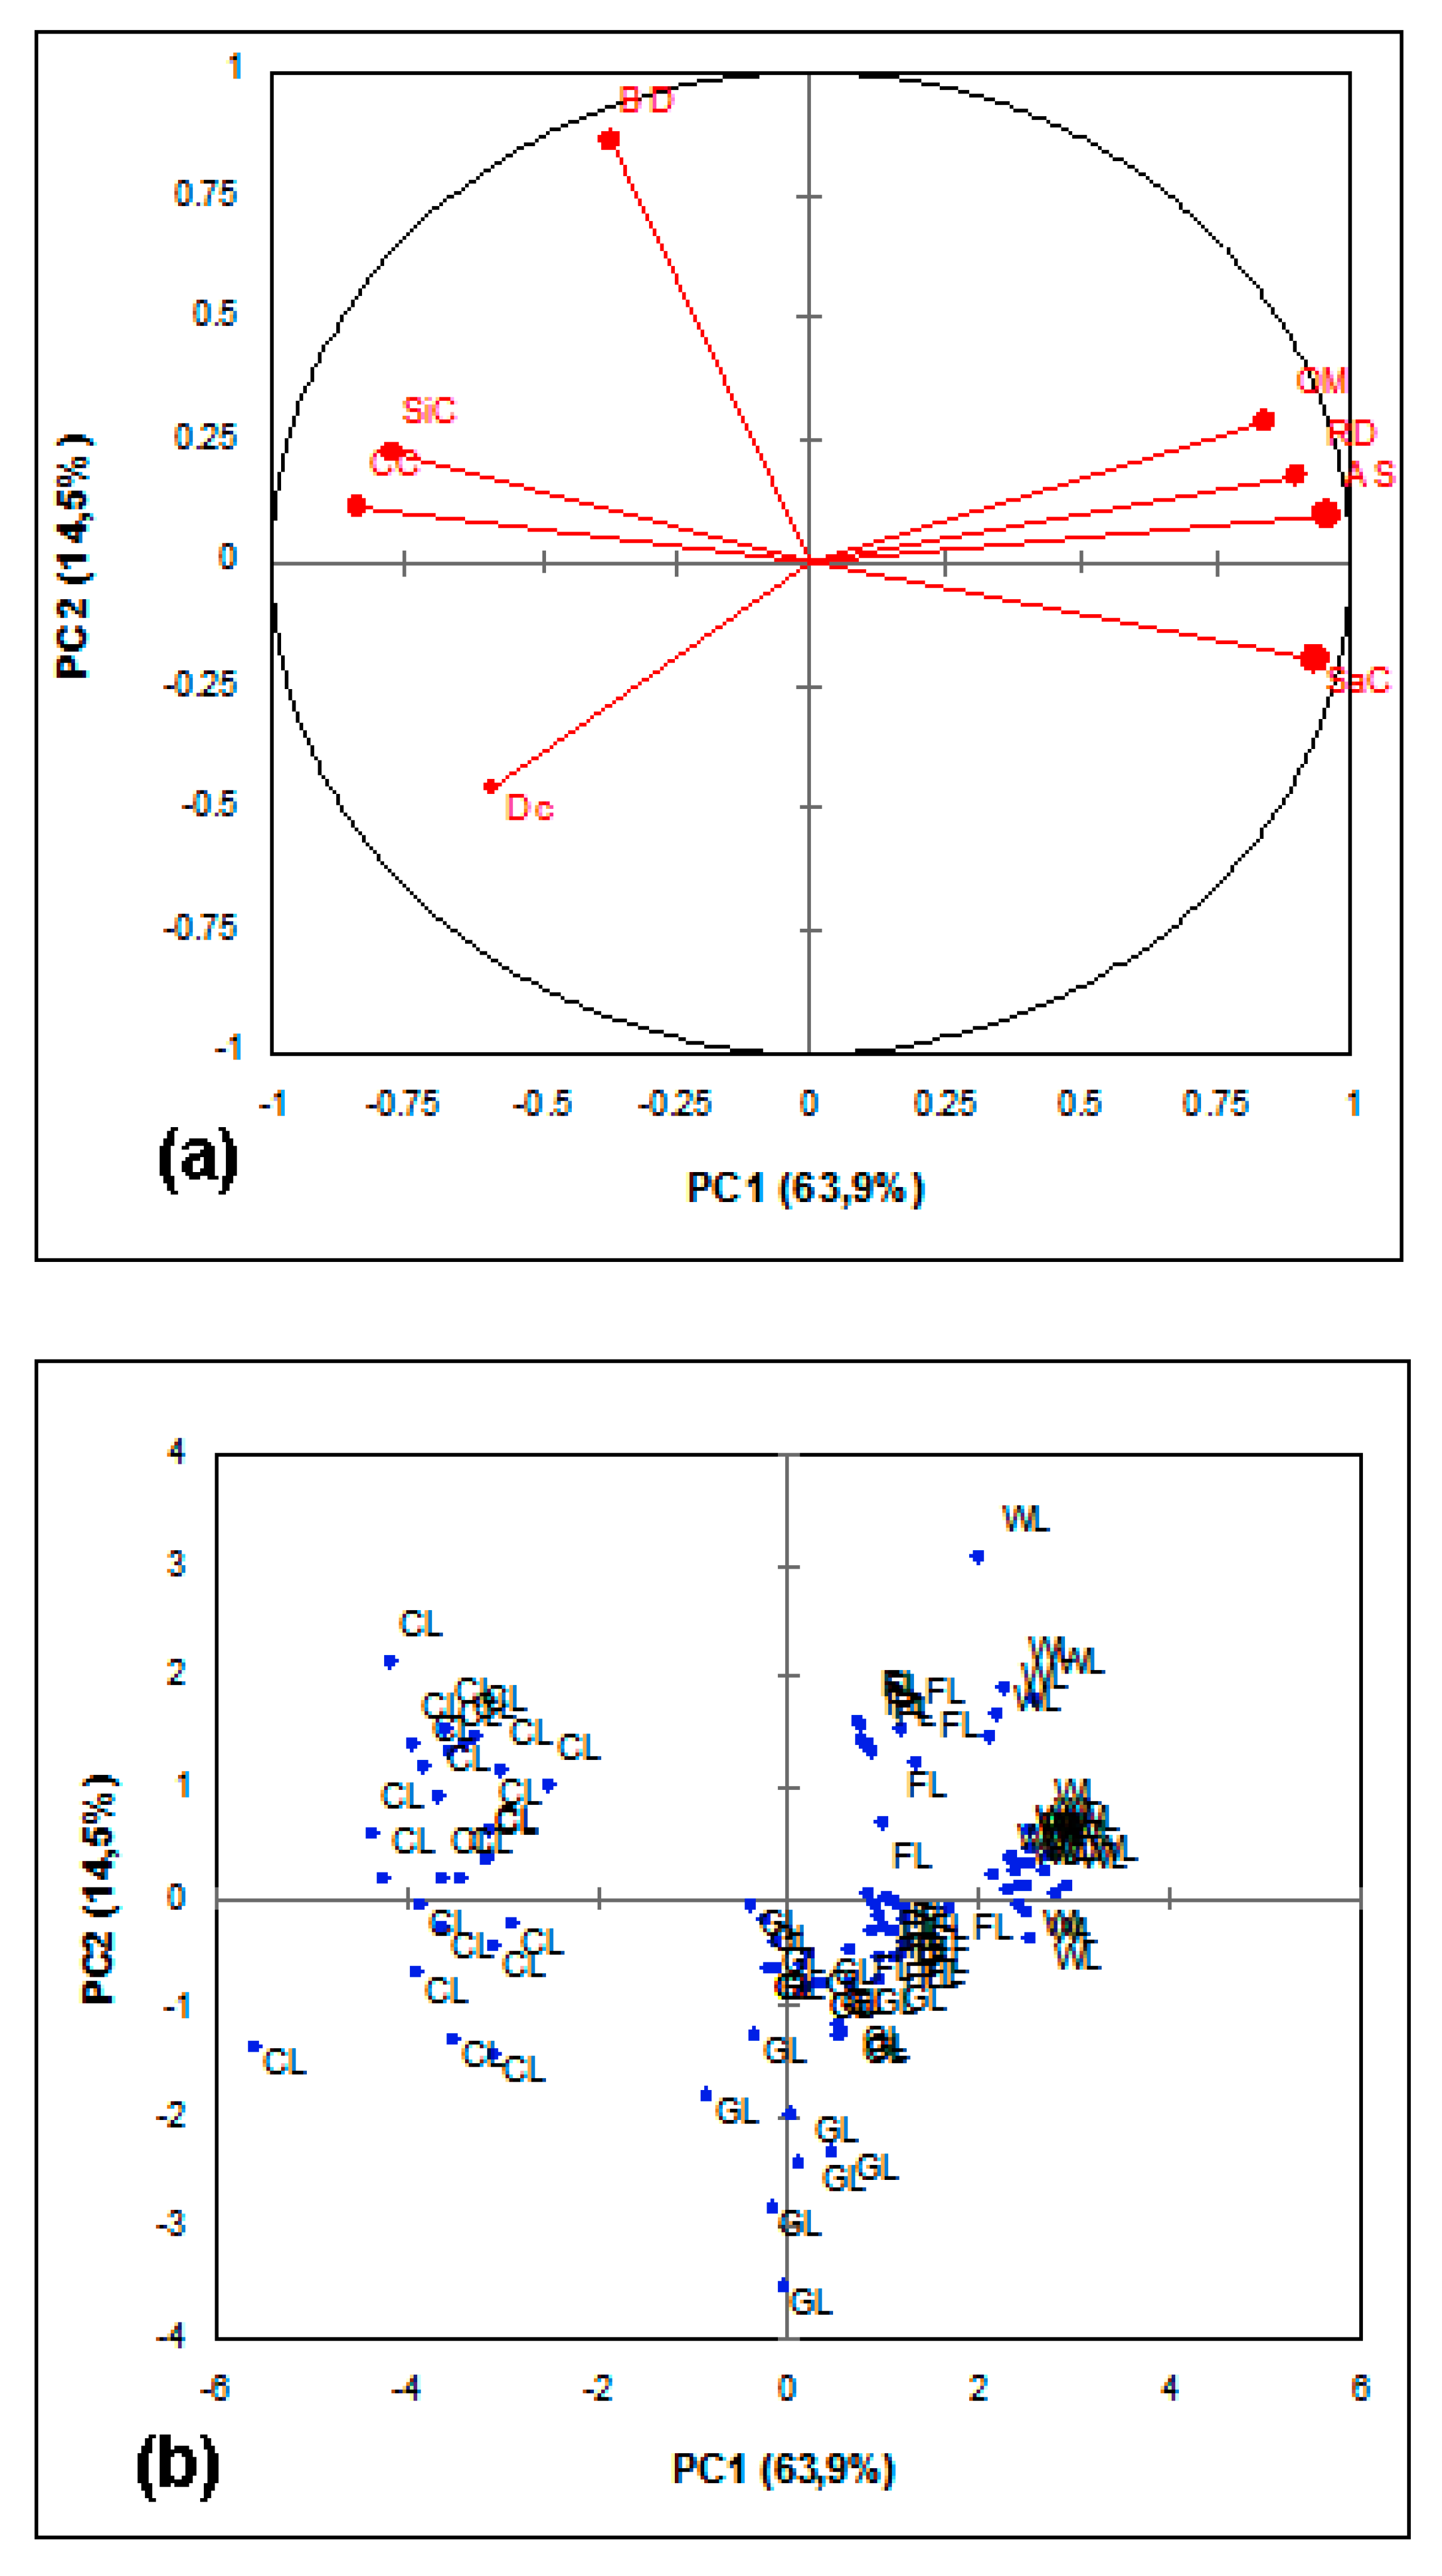
Using PCA, two principal components (PCs) were identified, explaining together about 80% of the total variance of the soil properties. In more detail, PC1 explained 64% of this variability, whereas PC2 explained another 15%. Dc and all soil properties (except for the bulk density) had a significant loading on the first PC, while the bulk density had a significant weight on the second PC (Table 4).
In other words, Dc was associated with low values of organic matter, root weight density, sand content, and aggregate stability of soil, as well as with high values of silt and clay contents (see PC1), while no direct association was found between Dc and the bulk density (Table 4 and Figure 4a).
Plotting the sample scores on the first two PCs, evident differences in soil properties emerged among land uses. Three well-differentiated groups, one for each land use, were evidenced besides a clear overlapping of points corresponding to FL and WL (Figure 4b).

3.2. Relationships between the Rill Detachment Capacity, Rill Erodibility and Hydraulic Parameters

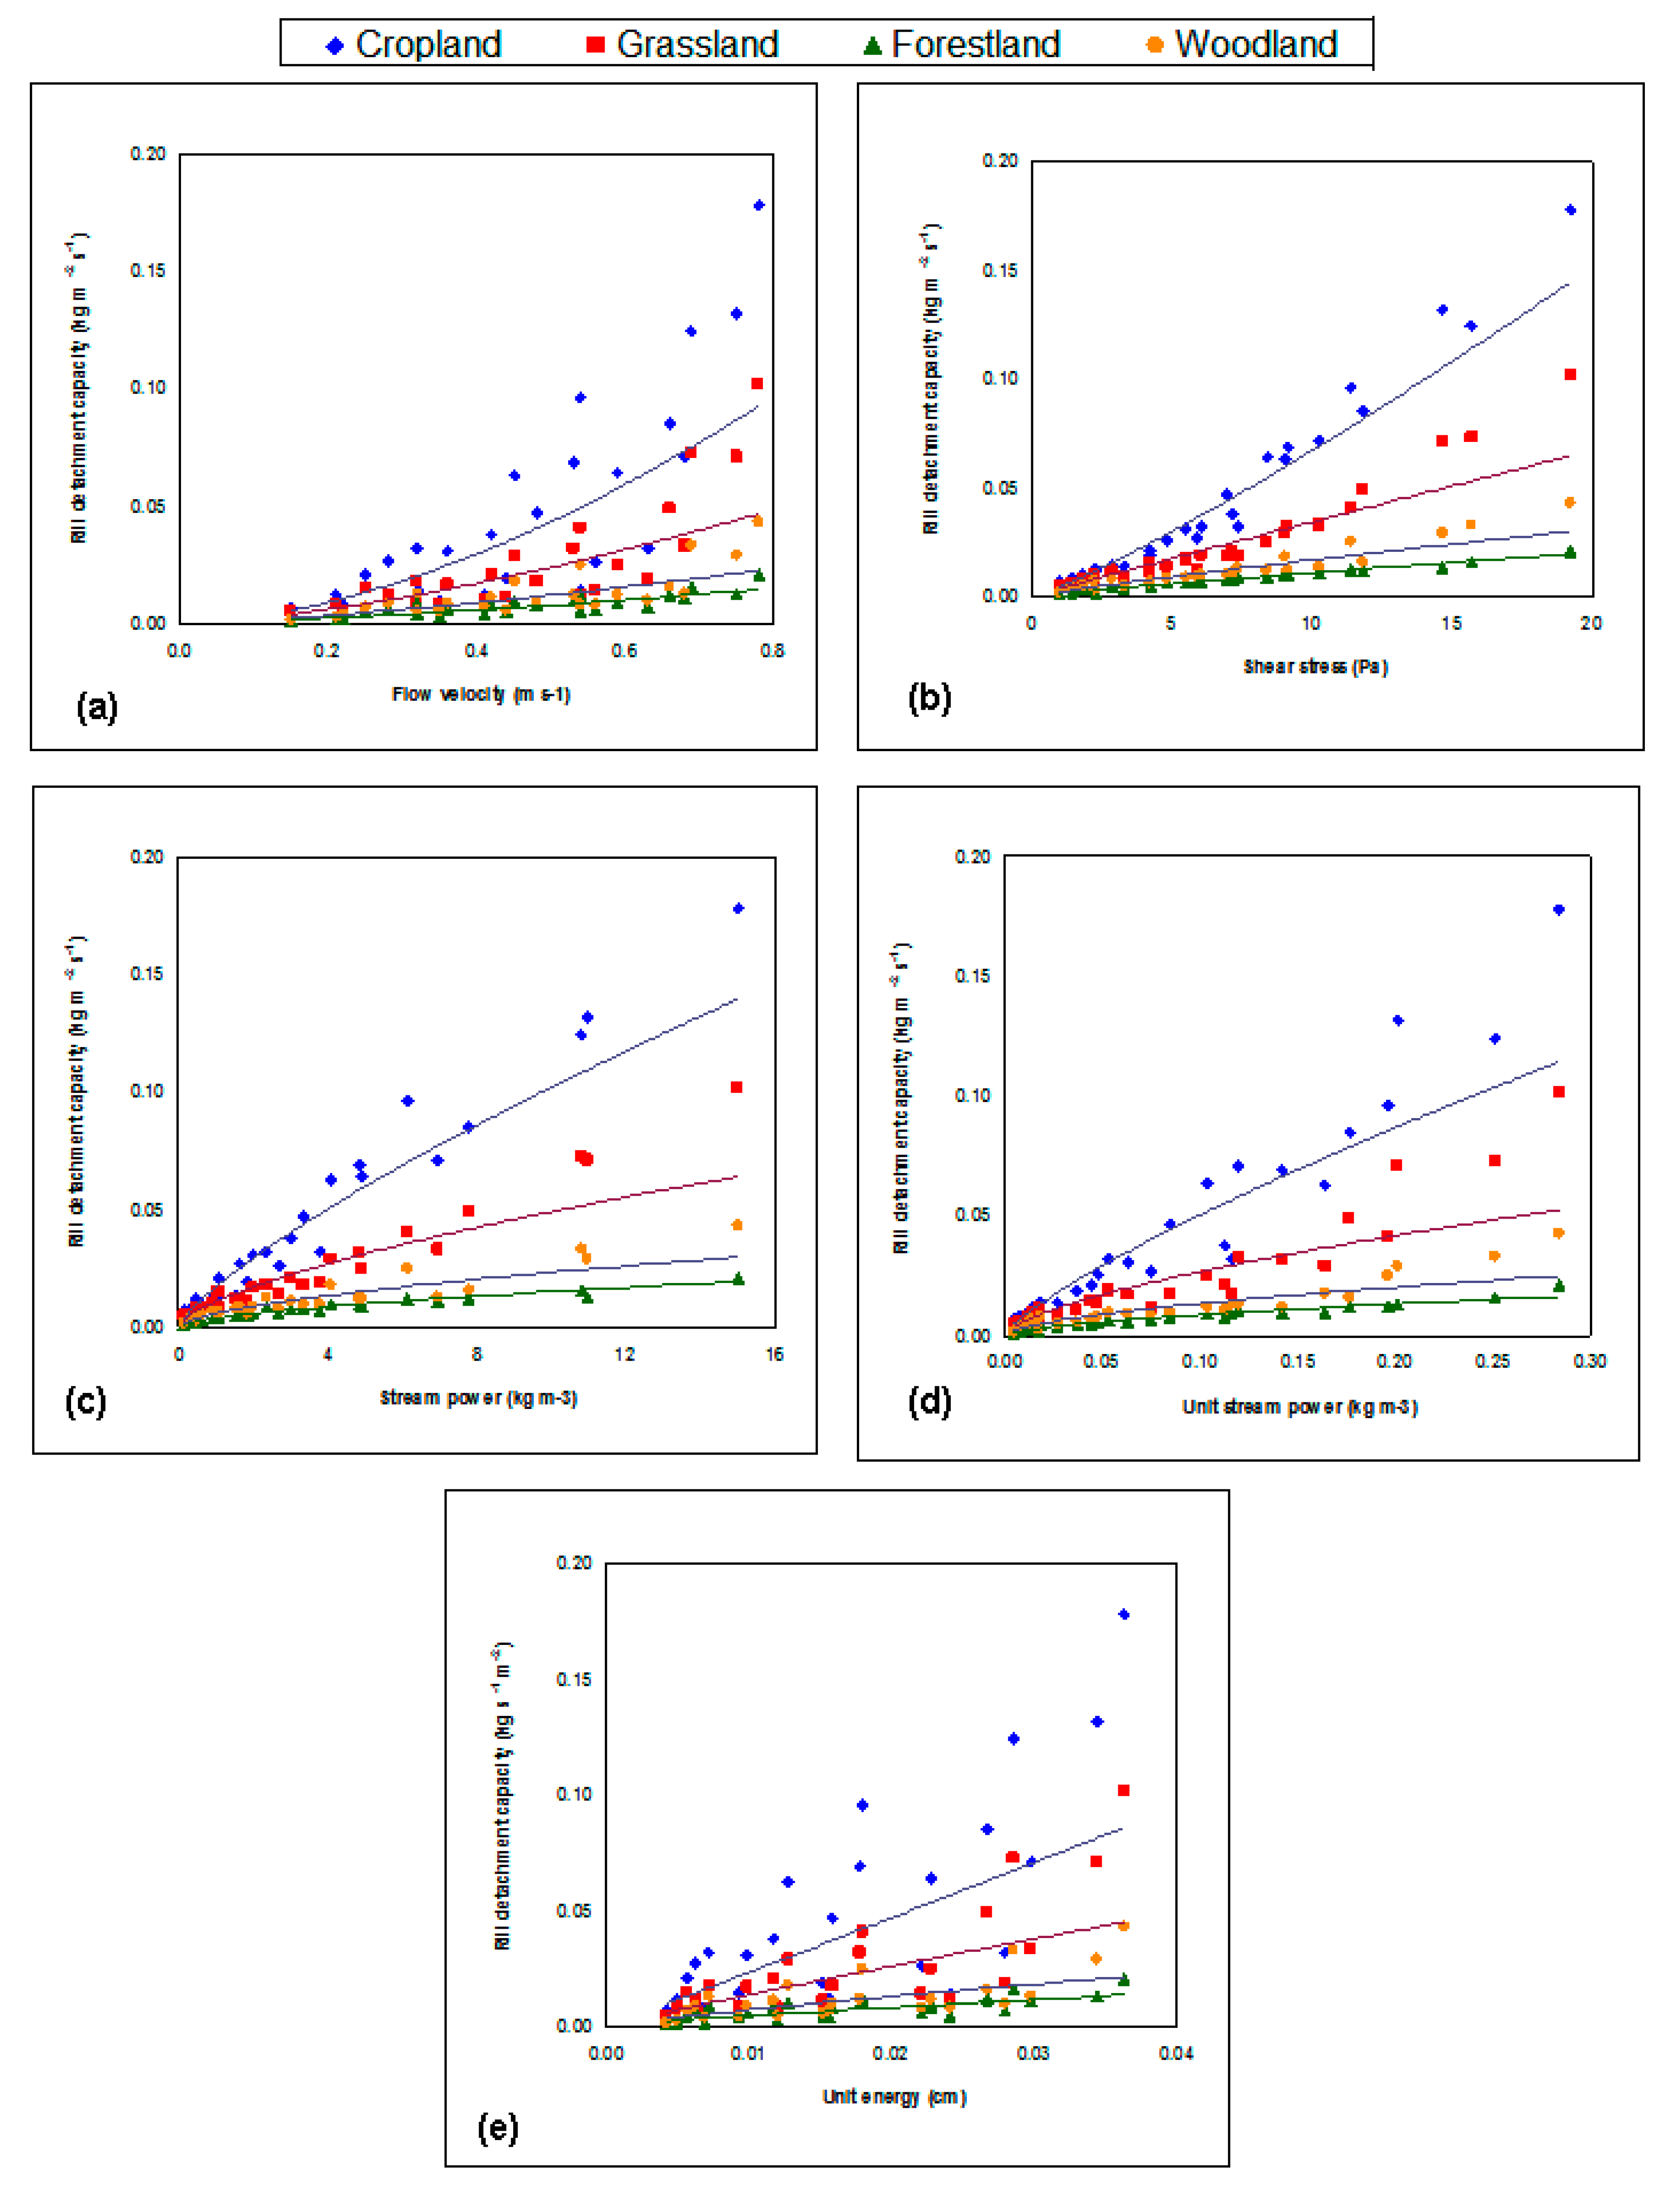
Table 4 reports the power equations correlating the rill detachment capacity with individual hydraulic parameters, while the values of the indexes evaluating the prediction capacity of these equations are shown in Table 5. In general, all the equations simulated Dc quite well, as shown by the satisfactory values of r2 (over 0.50, except for the equation Dc-E in woodland) and NSE (always over 0.35). NSE was only negative in the regression Dc-τ for cropland, (which means that the model performance is very poor) while the RE was very high (>85%) in this case. The best predictor of Dc was the stream power for cropland, grassland and woodland, since, by using these equations, the best combination of RE, r2 and NSE (always good) was achieved, while the rill detachment capacity was better simulated by the unit stream power for forestland (RE = −0.1, r2 = 0.92 and NSE = 0.92) (Table 6). Conversely, the Dc values were more scattered around the regression line using flow velocity, shear stress, and unit energy compared to stream power and unit stream power (Figure 5).
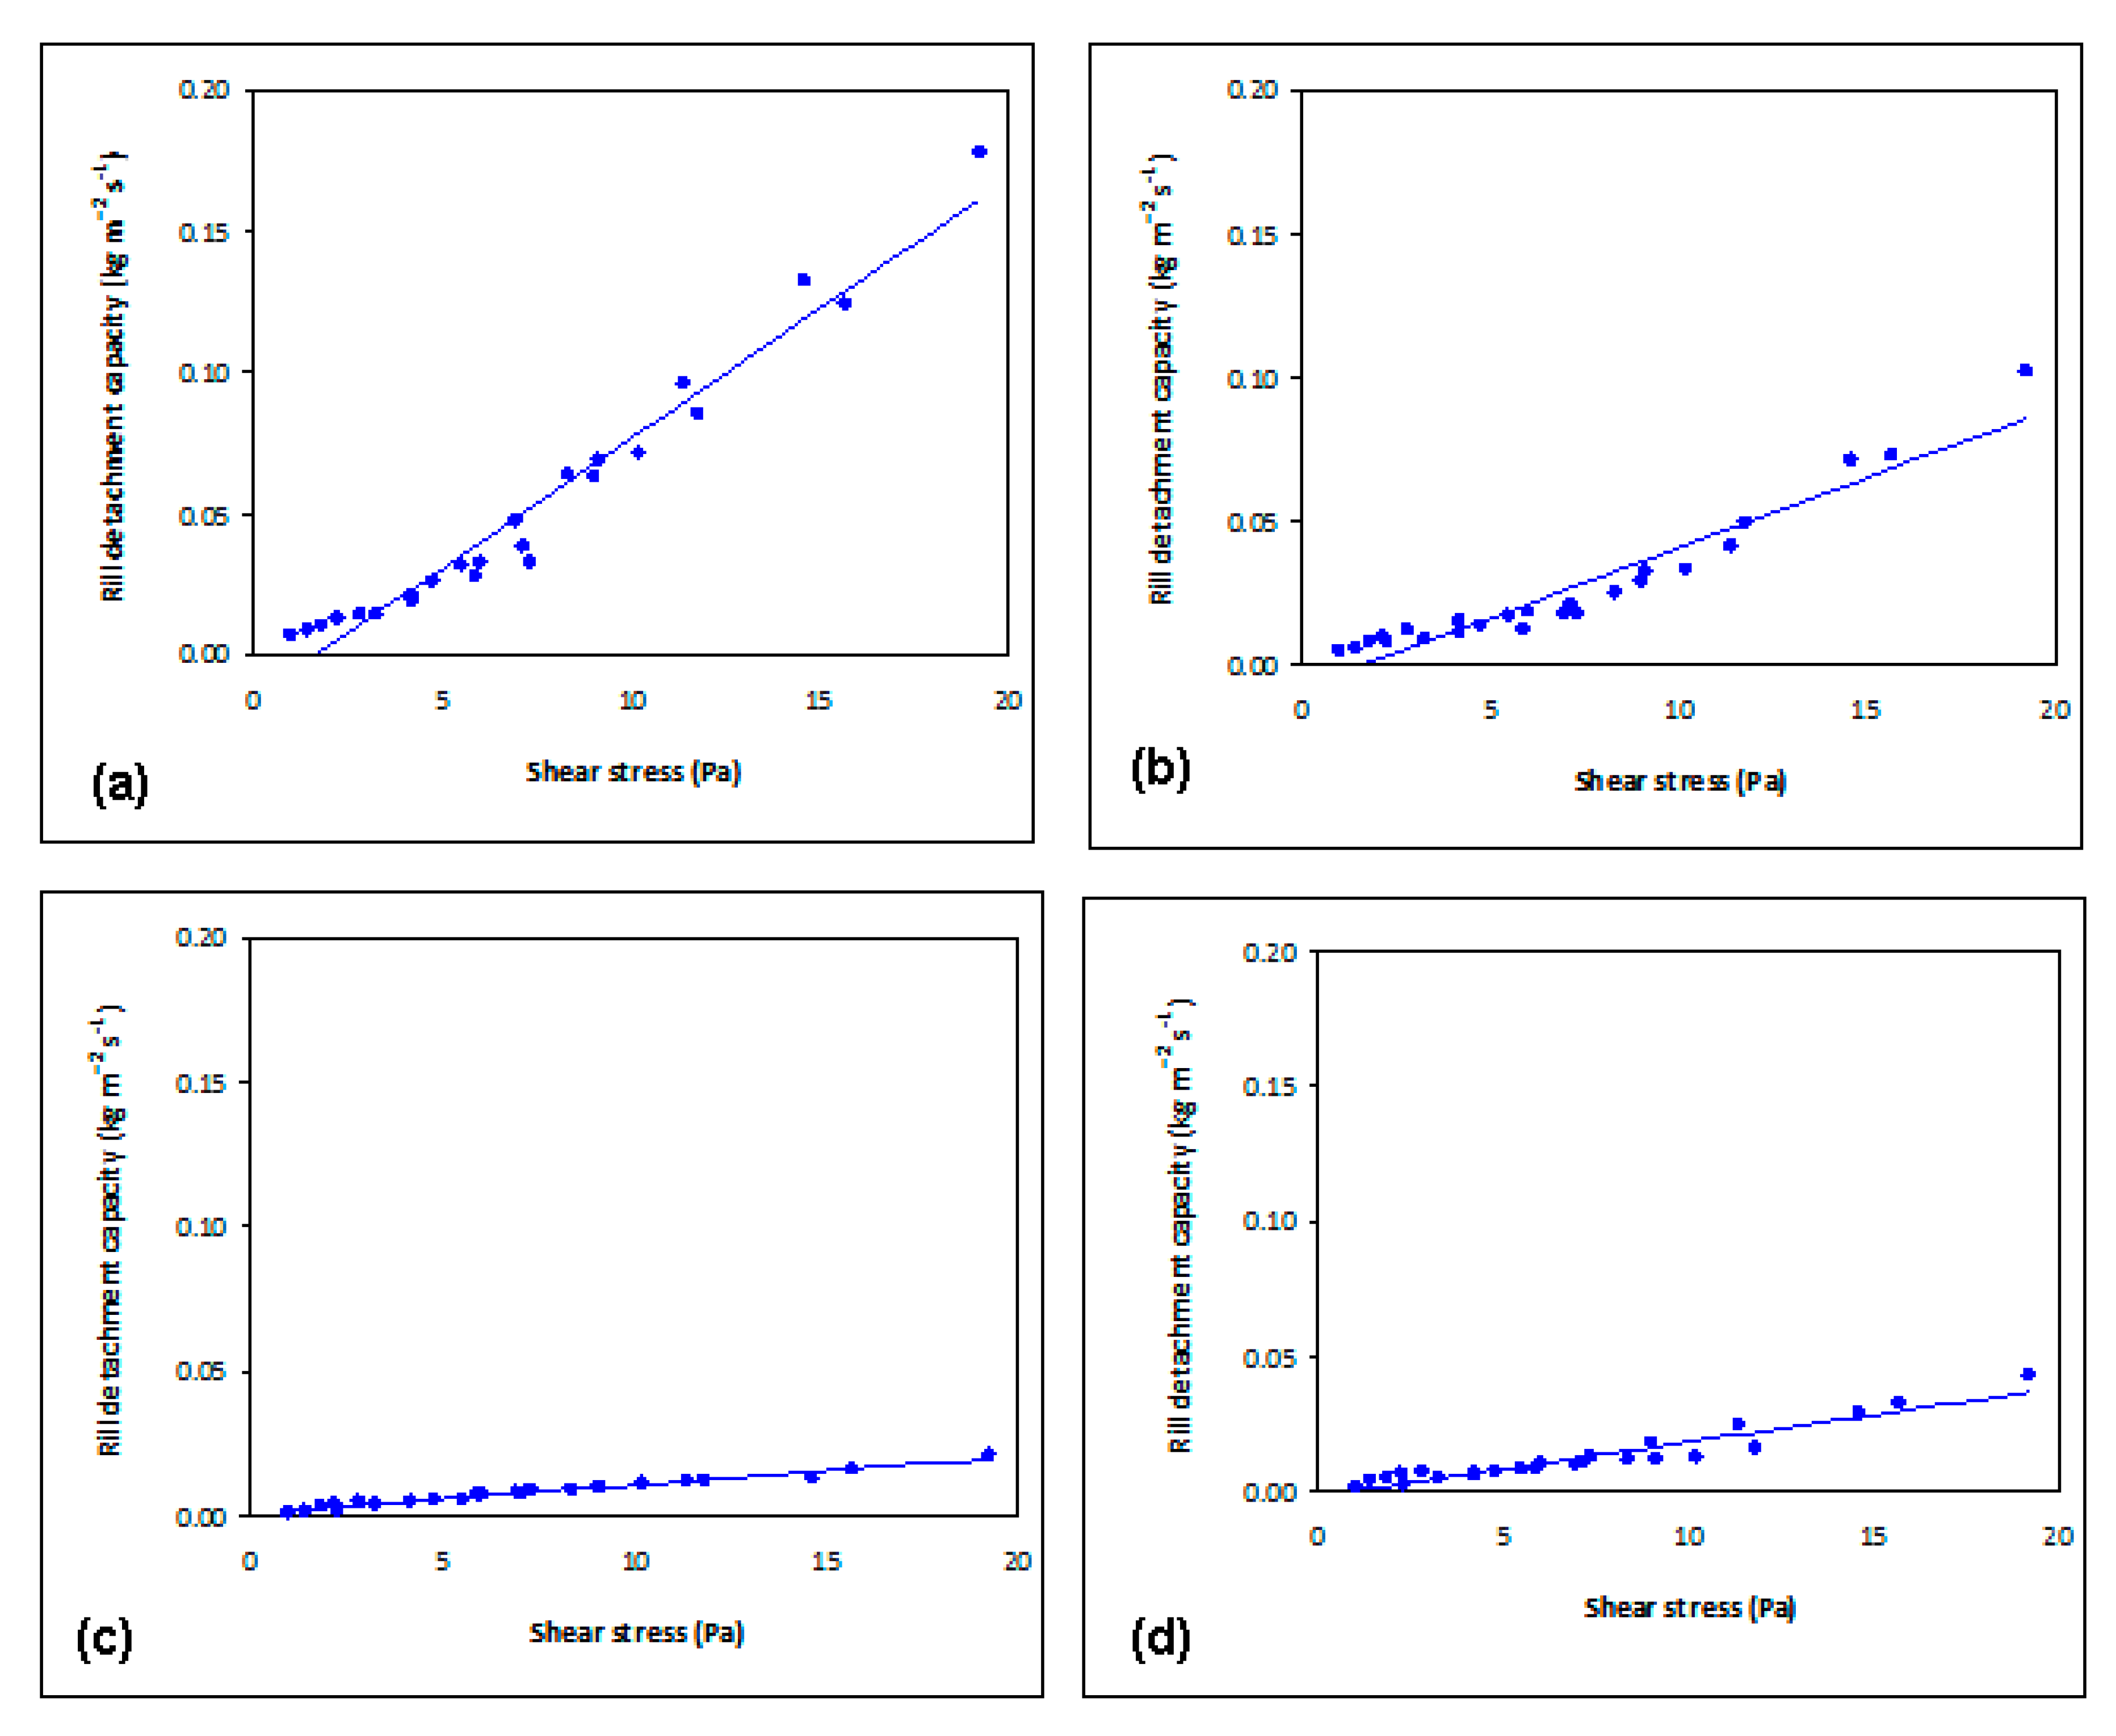
Different linear regression equations with expression [2] were established between Dc and τ for the different land uses, always with high coefficients of determination (r2 > 0.90) between Dc and τ (Figure 6). Cropland showed the maximum rill erodibility (0.0092 s m−1) and critical shear stress (1.71 Pa). The Kr value for cropland was 1.8, 4.6, and 9.2 times greater than in grassland, woodland, and forestland soil, respectively. Thus, the rill erodibility was the lowest in forestland (0.001 s m−1), while woodland showed a slightly higher value (0.002 s m−1). The critical shear stress was higher in cropland (1.71 Pa) and grassland (1.65 Pa), and lower in forestland (1.0 Pa) and woodland (0.70 Pa) (Table 7).

4. Discussions

4.1. Impacts of Land Use on Soil Properties and Rill Detachment Capacity

Literature studies have demonstrated that land uses influence the physico-chemical and hydrological characteristics of a soil e.g., reference [33,35,56,57,58,59]. It is also known that soil detachment capacity affected by overland flow varies widely under different land uses [26,60]. The characterization of the soil properties under the different land uses of this study confirms this variability [61,62,63]. The clay loam texture of the investigated soils was the same in all studied land uses, indicating the homogeneity of soil forming processes and the similarity of parent materials [61]. Therefore, the plant survival and growth in woodland, forestland and grassland, combined with the agricultural practices used in cropland, may explain the variability of the soil properties and particularly the variations detected for the rill detachment capacity.
Agricultural cultivation and its associated biomass extraction, and the use of machinery are responsible for the decrease in organic matter and the compaction of the soil. The higher bulk density values and the lower aggregate stability of the cultivated soil could be due to these actions. Organic matter content is significantly lower compared to the values measured in forestland and woodland and is in close accordance with other recent studies [26,27,64]. As a matter of fact, it is well known that soils with a noticeable vegetation cover and structure—such as woodland and forestland of this study—show a higher content of organic matter [65,66,67], which, in turn, increases root weight density, micro-porosity, and macro-porosity and thus increases the aggregate stability of soils. Plant roots bind soil particles at the soil surface [29,68], increasing the soil infiltration rate [69] and providing additional surface roughness [70].
The changes in soil properties also reflect its hydrological parameters, such as the higher water infiltration capacity as well as the reduced runoff generation ability and low soil erodibility in vegetated soil [71,72,73]. The latter property can be directly linked to the rill detachment capacity, which, as has been shown in this study, was significantly influenced by the land use. The lower rill detachment capacity among the four land uses was detected in forestland and woodland soil, corroborating outcomes of some recent studies e.g., references [4,7,27,40]. As a matter of fact, in cropland the surface soil was disturbed by farming operations (e.g., weed mechanical removal, tillage), which often left the soil bare and disrupted the aggregates, thus increasing its potential for erosion. Conversely, the higher vegetal cover and structure of forestland and woodland determined a lower rill detachment capacity. This is in accordance with many authors e.g., references [74,75,76,77,78], who concluded that vegetation cover is an important factor in the reduction of soil erosion, although some studies suggested that vegetation cover might not be so important or is even insignificant for rill erosion [7,69].
The correlation analysis and PCA basically confirm the relationships between some important soil properties and its erodibility. As a matter of fact, these statistical techniques have demonstrated that, for the investigated land uses, the rill detachment capacity is directly associated with the organic matter, root density, and aggregate stability, as well as the textural properties of sampled soils. In other words, when the organic matter (and thus the aggregate stability and root density) as well as the sand content decrease, the rill detachment capacity increases. Conversely, the influence of bulk density on rill detachment capacity is not evident under the experimental conditions. Moreover, in soils with higher silt and clay contents, particle detachability increases (as shown by the positive correlations between Dc, silt and clay contents). As found by Li (2015), an increase in silt—in loess soils with already very high silt content—implies an increase in Dc while cohesion works in the opposite direction, which is consistent with numerous results (e.g., references [4,60,64]). The susceptibility of soils with finer particles is an important outcome of this study, since it confirms that soils with prevalent clay or silt contents are more erodible compared to soils with a proper vegetal cover, such as woodland or forestland. Therefore, land management activities favoring an evolution from agriculture to forestland land use may be suggested and, at the same time, deforestation of woody areas should be avoided in order to avoid intolerable soil erosion rates. This is a worldwide priority [79] due to the control vegetation exerts on soil particle detachment.
As a response to the associations between soil properties and its erodibility found in this study, two land uses (cropland and grassland) were discriminated from woodland and forestland, as shown by the evident clusters arranged along a clear gradient on the score plot. This is in accordance with a previous investigation carried out in the same environment, which showed that soils with different land uses can be grouped in separate clusters, depending on the changes induced on their physico-chemical properties caused by land use [35]. There are close relationships between soil detachment capacity on one hand and soil bulk density, size, silt content, cohesion, and root density [27], and bulk density on the other [27,29].

4.2. Relationships between the Rill Detachment Capacity, Erodibility and Hydraulic Parameters

Beside the soil properties, soil detachment in rills depends on the hydraulic characteristic of the overland flow [18]. The regression analysis carried out in this study has demonstrated that the rill detachment capacity can be estimated from common hydraulic parameters using power equations with different accuracy levels, which are generally appreciable. Also, many other authors [18,19,20,21,22,23,24,80] showed that flow discharge, shear stress, stream power, unit stream power, and unit energy had significant positive correlations with the rill detachment capacity and thus they can be assumed as being Dc predictors.
Moreover, the simple regression models found in this study were more accurate in forestland and woodland soils. The response curves of Dc versus hydraulic parameters also showed greater proximity of woodland in relation to forestland than the other land uses. The study has shown that, when the best predictor should be chosen among the analyzed parameters, the stream power is the most representative hydraulic variable for cropland, grassland, and woodland, while the unit value of this parameter is suggested for forestland. Conversely, the use of the flow velocity, shear stress, and unit energy should be avoided to estimate rill detachment capacity, since in some cases this may lead to large overestimation or underestimation of the soil erodibility. The higher accuracy of stream power and unit stream power may be due to the fact that this hydraulic parameter simultaneously takes into account the flow velocity (such as V) and slope (such as E and τ), which both have a clear influence on soil detachability due to the overland flow.
The evaluation of the effects of land use on rill erodibility and critical shear stress is important, because Kr and τc are two of the most important parameters reflecting soil resistance to rill erosion [17]. It has been shown above that the lower rill detachment capacity detected in forestland and woodland, compared to the other land uses, may be due to the interactive effects of vegetation and soil properties, and this also influences the values of rill erodibility and critical shear stress, which are mathematically linked to the Dc (as shown by the accuracy of the regression models developed in this study). This accuracy is consistent with findings of Zhang et al. [4], who stated that the linear regression functions between soil detachment and shear stress can be used to fit the observed data satisfactorily, with coefficients of determination of up to 0.9 for each land use. The lower rill erodibility and critical shear stress is in accordance with previous studies, showing that cropland is subject to the highest erosion rates among the investigated land uses [4,7,27,40].

5. Conclusions

Few studies have explained the quantitative relations among the soil detachment capacity due to overland flow and the properties of forest soils. Moreover, the methods for its estimation from hydraulic parameters are quite scarce in forestland and in woodland. This study has quantified the rill detachment capacity and proposed prediction equations of this parameter for woodland, forestland, grassland, and cropland. It has been demonstrated how and to what extent the rill detachment capacity is affected by the different land uses in the case study of Saravan watershed in Northern Iran. Although the textural characteristics of the investigated soils were quite similar among the four studied land uses, the hydraulic parameters and the physico-chemical properties were significantly different. The mean rill detachment capacity of soils was lower in woodland and forestland than in cropland and grassland. This outcome confirms the working hypothesis that the more developed vegetation cover and structure of woodland and forestland are able to reduce the rill detachment capacity, compared to other land uses. Rill detachment was positively correlated with clay and silt contents and negatively correlated with sand content, aggregate stability, organic matter, and root density, while no statistically significant correlations were found with bulk density.
For all land uses, a power function was used to estimate the rill detachment capacity from the hydraulic parameters and a generally good accuracy (in particular for woodland and forestland) was achieved for the proposed equations. The best predictor of rill detachment capacity was the stream power for cropland, grassland, and woodland, and the unit stream power for forestland. The use of flow velocity and unit energy should be avoided when estimating the rill detachment capacity. The rill erodibility and critical shear stress, which were the lowest in forestland and woodland out of all of the investigated land uses, were predicted with good accuracy along with the slope and intercept of linear regressions between the rill detachment capacity and shear stress.
Overall, the case study of the Saravan watershed has provided a contribution in understanding the linkages between the rill detachment capacity on one side, and the soil properties and hydraulic parameters on the other side under different land uses. It has been finally demonstrated that forestland and woodland can be suitable land uses (mainly in soils with prevalent clayey and silty content) when the soil conservation purposes are achieved by land planners and watershed managers. Therefore, afforestation in the croplands should be prioritized when possible, in order to reverse or mitigate possible erosion-degradation.
Author Contributions

Conceptualization, methodology, and fieldwork, M.P., A.C., M.S., M.K., H.A. and C.W.R.; writing and review M.P., M.E.L.-B.; D.A.Z. All authors have read and agreed to the published version of the manuscript.

Funding

Faculty of Agricultural Sciences, University of Guilan.

Acknowledgments

The authors thank the Faculty of Agricultural Sciences, University of Guilan for their support and experimental assistance.

Conflicts of Interest

The authors declare no conflict of interest.

References

  1. Ellison, W.D. Soil erosion studies: Part I. Agric. Eng. 1947, 28, 145–146. [Google Scholar]
  2. Shi, Z.H.; Fang, N.F.; Wu, F.Z.; Wang, L.; Yue, B.J.; Wu, G.L. Soil erosion processes and sediment sorting associated with transport mechanisms on steep slopes. J. Hydrol. 2012, 454, 123–130. [Google Scholar] [CrossRef]
  3. Govers, G.; Everaert, W.; Poesen, J.; Rauws, G.; De Ploey, J.; Lautridou, J.P. A long flume study of the dynamic factors affecting the resistance of a loamy soil to concentrated flow erosion. Earth Surf. Process. Landf. 1990, 15, 313–328. [Google Scholar] [CrossRef]
  4. Zhang, G.H.; Liu, G.B.; Tang, K.M.; Zhang, X.C. Flow detachment of soils under different land uses in the Loess Plateau of China. Trans. ASABE 2008, 51, 883–890. [Google Scholar] [CrossRef]
  5. Polyakov, V.O.; Nearing, M.A. Sediment transport in rill flow under deposition and detachment conditions. Catena 2003, 51, 33–43. [Google Scholar] [CrossRef] [Green Version]
  6. Aksoy, H.; Kavvas, M.L. A review of hillslope and watershed scale erosion and sediment transport models. Catena 2005, 64, 247–271. [Google Scholar] [CrossRef]
  7. Wang, B.; Zhang, G.H.; Shi, Y.Y.; Zhang, X.C. Soil detachment by overland flow under different vegetation restoration models in the Loess Plateau of China. Catena 2014, 116, 51–59. [Google Scholar] [CrossRef]
  8. Li, T.Y.; Li, S.; Liang, C.; He, B.H.; Bush, R.T. Erosion vulnerability of sandy clay loam soil in Southwest China: Modeling soil detachment capacity by flume simulation. Catena 2019, 178, 90–99. [Google Scholar] [CrossRef]
  9. Foster, G.R. Modeling the erosion process. In Hydrologic Modeling of Small Watersheds; Haan, C.T., Ed.; ASAE: St. Joseph, MI, USA, 1982; pp. 296–380. [Google Scholar]
  10. Zhang, G.H.; Liu, B.Y.; Liu, G.B.; He, X.W.; Nearing, M.A. Detachment of undisturbed soil by shallow flow. Soil Sci. Soc. Am. J. 2003, 67, 713–719. [Google Scholar] [CrossRef] [Green Version]
  11. Young, R.A.; Wiersma, J. The role of rainfall impact in soil detachment and transport. Water Resour. Res. 1973, 9, 1629–1636. [Google Scholar] [CrossRef]
  12. Beuselinck, L.; Govers, G.; Hairsine, P.; Sander, G.; Breynaert, M. The influence of rainfall on sediment transport by overland flow over areas of net deposition. J. Hydrol. 2002, 257, 145–163. [Google Scholar] [CrossRef]
  13. Owoputi, L.; Stolte, W. Soil detachment in the physically based soil erosion process: A review. Trans. ASAE 1995, 38, 1099–1110. [Google Scholar] [CrossRef]
  14. Zhang, G.H.; Liu, B.Y.; Nearing, M.A.; Huang, C.H.; Zhang, K.L. Soil detachment by shallow flow. Trans. ASAE 2002, 45, 351–357. [Google Scholar]
  15. Wang, D.D.; Wang, Z.L.; Shen, N.; Chen, H. Modeling soil detachment capacity by rill flow using hydraulic parameters. J. Hydrol. 2016, 535, 473–479. [Google Scholar] [CrossRef]
  16. Laflen, J.M.; Lane, J.L.; Foster, G.R. WEPP—A New Generation of Erosion Prediction Technology. J. Soil Water Conserv. 1991, 46, 34–38. [Google Scholar]
  17. Nearing, M.A.; Foster, G.R.; Lane, L.J.; Finkner, S.C. A process-based soil erosion model for USDA-Water Erosion Prediction Project technology. Trans. ASAE 1989, 32, 1587–1593. [Google Scholar] [CrossRef]
  18. Nearing, M.A.; Bradford, J.M.; Parker, S.C. Soil detachment by shallow flow at low slopes. Soil Sci. Soc. Am. J. 1991, 55, 339–344. [Google Scholar] [CrossRef]
  19. Foster, G.R.; Flanagan, D.C.; Nearing, M.A.; Lane, L.J.; Risse, L.M.; Finkner, S.C. Hillslope erosion component. In USDA-Water Erosion Prediction Project, Hillslope Profile and Watershed Model Documentation; Flanagan, D.C., Nearing, M.A., Eds.; NSERL Report No. 10 USDA; Agricultural Research Service, National Soil Erosion Research Laboratory: West Lafayette, IN, USA, 1995. [Google Scholar]
  20. Hairsine, P.B.; Rose, C.W. Modeling water erosion due to overland flow using physical principles, II. Rill flow. Water Resour. Res. 1992, 28, 237–243. [Google Scholar] [CrossRef]
  21. Rose, C.W.; Williams, J.R.; Sander, G.C.; Barry, D.A. A mathematical model of soil erosion and deposition processes: I. Theory for a plane land element. Soil Sci. Soc. Am. J. 1983, 47, 991–995. [Google Scholar] [CrossRef]
  22. Morgan, R.P.; Quinton, J.N.; Smith, R.E.; Govers, G.; Poesen, J.W.A.; Auerswald, K.; Chisci, G.; Torri, D.; Styczen, M.E. The European soil erosion model (EUROSEM): A dynamic approach for predicting sediment transport from fields and small catchments. Earth Surf. Process. Landf. 1998, 23, 527–544. [Google Scholar] [CrossRef]
  23. Yang, C.T. Unit stream power and sediment transport. J. Hydrol. Div. ASCE 1972, 98, 1805–1826. [Google Scholar]
  24. Xiao, H.; Liu, G.; Liu, P.L.; Zheng, F.L.; Zhang, J.Q.; Hu, F.N. Response of soil detachment rate to the hydraulic parameters of concentrated flow on steep loessial slopes on the loess plateau of China. Hydrol. Process. 2017, 31, 2613–2621. [Google Scholar] [CrossRef]
  25. Nearing, M.A.; Simanton, J.R.; Norton, L.D.; Bulygin, S.J.; Stone, J. Soil erosion by surface water flow on a stony, semiarid hillslope. Earth Surf. Process. Landf. 1999, 24, 677–686. [Google Scholar] [CrossRef]
  26. Knapen, A.; Poesen, J.; Govers, G.; Gyssels, G.; Nachtergaele, J. Resistance of soils to concentrated flow erosion: A review. Earth Sci. Rev. 2007, 80, 75–109. [Google Scholar] [CrossRef]
  27. Li, Z.W.; Zhang, G.H.; Geng, R.; Wang, H.; Zhang, X.C. Land use impacts on soil detachment capacity by overland flow in the Loess Plateau, China. Catena 2015, 124, 9–17. [Google Scholar] [CrossRef]
  28. Wang, B.; Zhang, G.H.; Shi, Y.Y.; Zhang, X.C.; Ren, Z.P.; Zhu, L.J. Effect of natural restoration time of abandoned farmland on soil detachment by overland flow in the Loess Plateau of China. Earth Surf. Process. Landf. 2013, 38, 1725–1734. [Google Scholar] [CrossRef]
  29. De Baets, S.; Poesen, J.; Gyssels, G.; Knapen, A. Effects of grass roots on the erodibility of topsoils during concentrated flow. Geomorphology 2006, 76, 54–67. [Google Scholar] [CrossRef]
  30. Carter, M.R. Soil Quality for Sustainable Land Management: Organic Matter and Aggregation Interactions that Maintain Soil Functions. Agron. J. 2002, 94, 38–47. [Google Scholar] [CrossRef]
  31. Tiwari, K.R.; Sitaula, B.K.; Borresen, T.; Bajracharya, R.M. An assessment of soil quality in Pokhare Khola watershed of the Middle Mountains in Nepal. J. Food Agric. Environ. 2006, 4, 276–283. [Google Scholar]
  32. García-Ruiz, J.M. The effects of land uses on soil erosion in Spain: A review. Catena 2010, 81, 1–11. [Google Scholar] [CrossRef]
  33. Nunes, A.N.; De Almeida, A.C.; Coelho, C.O. Impacts of land use and cover type on runoff and soil erosion in a marginal area of Portugal. Appl. Geogr. 2011, 31, 687–699. [Google Scholar] [CrossRef]
  34. Lucas-Borja, M.E.; Zema, D.A.; Plaza-Álvarez, P.A.; Zupanc, V.; Baartman, J.; Sagra, J.; de las Heras, J. Effects of different land uses (abandoned farmland, intensive agriculture and forestland) on soil hydrological properties in Southern Spain. Water 2019, 11, 503. [Google Scholar] [CrossRef] [Green Version]
  35. Shabanpour, M.; Daneshyar, M.; Parhizkar, M.; Lucas-Borja, M.E.; Zema, D.A. Influence of crops on soil properties in agricultural lands of northern Iran. Sci. Total Environ. 2020, in press. [Google Scholar] [CrossRef]
  36. Dunjó, G.; Pardini, G.; Gispert, M. The role of land use-land cover on runoff generation and sediment yield at a microplot scale, in a small Mediterranean catchment. J. Arid Environ. 2004, 57, 239–256. [Google Scholar] [CrossRef]
  37. Cherubin, M.R.; Tormena, C.A.; Karlen, D.L. Soil Quality Evaluation Using the Soil Management Assessment Framework (SMAF) in Brazilian Oxisols with Contrasting Texture. Rev. Bras. Ciência Solo 2017, 41, 1806–9657. [Google Scholar] [CrossRef] [Green Version]
  38. Lasanta, T.; Garcìa-Ruiz, J.M.; Pérez-Rontomé, C.; Sancho-Marcén, C. Runoff and sediment yield in a semi-arid environment: The effect of the land management after farmland abandonment. Catena 2000, 38, 265–278. [Google Scholar] [CrossRef] [Green Version]
  39. MacDonald, D.; Crabtree, J.R.; Wiesinger, G.; Dax, T.; Stamou, N.; Fleury, P.; Lazpita, J.G.; Gibon, A. Agricultural abandonment in mountain areas of Europe: Environmental consequences and policy response. J. Environ. Manag. 2000, 59, 47–69. [Google Scholar] [CrossRef]
  40. Zhang, G.H.; Tang, K.M.; Zhang, X.C. Temporal variation in soil detachment under different land uses in the Loess Plateau of China. Earth Surf. Process. Landf. 2009, 34, 1302–1309. [Google Scholar] [CrossRef]
  41. Emadodin, I. Human-induced soil degradation in Iran. In Ecosystem Services Workshop; Salzau Castle: Kiel, Germany, 2008. [Google Scholar]
  42. Bahrami, A.; Emadodin, I.; Ranjbar Atashi, M.; Bork, H.R. Land-use change and soil degradation: A case study, North of Iran. Agric. Biol. J. N. Am. 2010, 4, 600–605. [Google Scholar]
  43. Kottek, M.; Grieser, J.; Beck, C.; Rudolf, B.; Rubel, F. World Map of the Köppen-Geiger climate classification updated. Meteorol. Z. 2006, 15, 259–263. [Google Scholar] [CrossRef]
  44. Islamic Republic of Iran Meteorological Organization. Annual Rainfall Report. 2016. Available online: www.irimo.ir (accessed on 20 September 2019).
  45. Asadi, H.; Moussavi, A.; Ghadiri, H.; Rose, C.W. Flow-driven soil erosion processes and the size selectivity of sediment. J. Hydrol. 2011, 406, 73–81. [Google Scholar] [CrossRef] [Green Version]
  46. Raei, B.; Asadi, H.; Moussavi, A.; Ghadiri, H. A study of initial motion of soil aggregates in comparison with sand particles of various sizes. Catena 2015, 127, 279–286. [Google Scholar] [CrossRef] [Green Version]
  47. Nearing, M.A.; Norton, L.D.; Bulgakov, D.A.; Larionov, G.A.; West, L.T.; Dontsova, K.M. Hydraulics and erosion in eroding rills. Water Resour. Res. 1997, 33, 865–876. [Google Scholar] [CrossRef]
  48. Abrahams, A.D.; Parsons, A.J.; Luk, S.H. Field measurement of the velocity of overland flow using dye tracing. Earth Surf. Process. Landf. 1985, 11, 653–657. [Google Scholar] [CrossRef]
  49. Bagnold, R.A. An approach to the sediment transport problem for general physics. In U.S. Geological Survey Professional Paper 422-I; U.S. Government Printing Office: Washington, DC, USA, 1966. [Google Scholar]
  50. Rodgers, J.L.; Nicewander, W.A. Thirteen ways to look at the correlation coefficient. Am. Stat. 1988, 42, 59–66. [Google Scholar] [CrossRef]
  51. Nash, J.E.; Sutcliffe, J.V. River flow forecasting through conceptual models part I-a discussion of principles. J. Hydrol. 1970, 10, 282–290. [Google Scholar] [CrossRef]
  52. Van Liew, M.W.; Garbrecht, J. Hydrologic simulation of the Little Washita River experimental watershed using SWAT. J. Am. Water Resour. Assoc. 2003, 39, 413–426. [Google Scholar] [CrossRef]
  53. Singh, J.; Knapp, H.V.; Demissie, M. Hydrologic Modeling of the Iroquois River Watershed Using HSPF and SWAT. ISWS CR 2004–2008. Champaign, Ill.: Illinois State Water Survey. 2004. Available online: http://www.sws.uiuc.edu/pubdoc/CR/ISWSCR2004-08.pdf (accessed on 14 February 2018).
  54. Moriasi, D.N.; Arnold, J.G.; Van Liew, M.W.; Bingner, R.L.; Harmel, R.D.; Veith, T.L. Model evaluation guidelines for systematic quantification of accuracy in watershed simulations. Trans. ASABE 2007, 50, 885–900. [Google Scholar] [CrossRef]
  55. SDSD (Soil Science Division Staff). Soil Survey Manual; Ditzler, C., Scheffe, K., Monger, H.C., Eds.; USDA Handbook 18 Government Printing Office: Washington, DC, USA, 2017. [Google Scholar]
  56. Lucas-Borja, M.E.; Calsamiglia, A.; Fortesa, J.; García-Comendador, J.; Guardiola, E.L.; García-Orenes, F.; Estrany, J. The role of wildfire on soil quality in abandoned terraces of three Mediterranean micro-catchments. Catena 2018, 170, 246–256. [Google Scholar] [CrossRef]
  57. Lucas-Borja, M.E.; Zema, D.A.; Carrà, B.G.; Cerdà, A.; Plaza-Alvarez, P.A.; Cózar, J.S.; de las Heras, J. Short-term changes in infiltration between straw mulched and non-mulched soils after wildfire in Mediterranean forestland ecosystems. Ecol. Eng. 2018, 122, 27–31. [Google Scholar] [CrossRef] [Green Version]
  58. Vacca, A.; Loddo, S.; Ollesch, G.; Puddu, R.; Serra, G.; Tomasi, D.; Aru, A. Measurement of runoff and soil erosion in three areas under different land use in Sardinia (Italy). Catena 2000, 40, 69–92. [Google Scholar] [CrossRef]
  59. Plaza-Álvarez, P.A.; Lucas-Borja, M.E.; Sagra, J.; Zema, D.A.; González-Romero, J.; Moya, D.; De las Heras, J. Changes in soil hydraulic conductivity after prescribed fires in Mediterranean pine forestlands. J. Environ. Manag. 2019, 232, 1021–1027. [Google Scholar] [CrossRef]
  60. Ciampalini, R.; Torri, D. Detachment of soil particles by shallow flow: Sampling methodology and observations. Catena 1988, 32, 37–53. [Google Scholar] [CrossRef]
  61. Foth, H.D. Fundamentals of Soil Science, 8th ed.; John Wiley and Sons: New York, NY, USA, 1990. [Google Scholar]
  62. Vaezi, A.R.; Hasanzadeh, H.; Cerdà, A. Developing an erodibility triangle for soil textures in semi-arid regions, NW Iran. Catena 2016, 142, 221–232. [Google Scholar] [CrossRef]
  63. Vaezi, A.R.; Abbasi, M.; Keesstra, S.; Cerdà, A. Assessment of soil particle erodibility and sediment trapping using check dams in small semi-arid catchments. Catena 2017, 157, 227–240. [Google Scholar] [CrossRef] [Green Version]
  64. Vaezi, A.R.; Eslami, S.F.; Keesstra, S. Interrill erodibility in relation to aggregate size class in a semi-arid soil under simulated rainfalls. Catena 2018, 167, 385–398. [Google Scholar] [CrossRef]
  65. Wang, B.; Zhang, G.H.; Yang, Y.F.; Li, F.F.; Liu, J.X. Response of soil detachment capacity to plant root and soil properties in typical grasslands on the Loess Plateau. Agric. Ecosyst. Environ. 2018, 266, 68–75. [Google Scholar] [CrossRef]
  66. Quideau, S.A.; Chadwick, O.A.; Benesi, A.; Graham, R.C.; Anderson, M.A. A direct link between forestland vegetation type and soil organic matter composition. Geoderma 2001, 104, 41–60. [Google Scholar] [CrossRef]
  67. Ernst, W.H.O. Vegetation, organic matter and soil quality. In Developments in Soil Science; Elsevier: Amsterdam, The Netherlands, 2004; Volume 29, pp. 41–98. [Google Scholar]
  68. An, S.; Mentler, A.; Mayer, H.; Blum, W.E. Soil aggregation, aggregate stability, organic carbon and nitrogen in different soil aggregate fractions under forestland and shrub vegetation on the Loess Plateau, China. Catena 2010, 81, 226–233. [Google Scholar] [CrossRef]
  69. De Baets, S.; Poesen, J.; Knapen, A.; Galindo, P. Impact of root architecture on the 23 erosion-reducing potential of roots during concentrated flow. Earth Surf. Process. Landf. J. Br. Geomorphol. Res. Group 2007, 32, 1323–1345. [Google Scholar] [CrossRef]
  70. Gyssels, G.; Poesen, J.; Bochet, E.; Li, Y. Impact of plant roots on the resistance of soils to erosion by water: A review. Prog. Phys. Geogr. 2005, 29, 189–217. [Google Scholar] [CrossRef] [Green Version]
  71. Viles, H.A. The agency of organic beings: A selective review of recent work in biogeomorphology. In Vegetation and Erosion: Processes and Environments; Thornes, J.B., Ed.; Wiley: Chichester, UK, 1990; pp. 5–25. [Google Scholar]
  72. Germer, S.; Neill, C.; Krusche, A.V.; Elsenbeer, H. Influence of land-use change on near-surface hydrological processes: Undisturbed forestland to pasture. J. Hydrol. 2010, 380, 473–480. [Google Scholar] [CrossRef]
  73. Alaoui, A.; Caduff, U.; Gerke, H.H.; Weingartner, R. Apreferential flow effects on infiltration and runoff in grassland and forestland soils. Vadose Zone J. 2011, 10, 367–377. [Google Scholar] [CrossRef]
  74. Zimmermann, B.; Elsenbeer, H.; De Moraes, J.M. The influence of land-use changes on soil hydraulic properties: Implications for runoff generation. For. Ecol. Manag. 2006, 222, 29–38. [Google Scholar] [CrossRef]
  75. Smets, T.; Poesen, J.; Bochet, E. Impact of plot length on the effectiveness of different soil-surface covers in reducing runoff and soil loss bywater. Prog. Phys. Geogr. 2008, 32, 654–677. [Google Scholar] [CrossRef]
  76. Zhou, P.; Luukkanen, O.; Tokola, T.; Nieminen, J. Effect of vegetation cover on soil erosion in a mountainous watershed. Catena 2008, 75, 319–325. [Google Scholar] [CrossRef]
  77. Cerda, A. Parent material and vegetation affect soil erosion in eastern Spain. Soil Sci. Soc. Am. J. 1999, 63, 362–368. [Google Scholar] [CrossRef]
  78. Quinton, J.N.; Edwards, G.M.; Morgan, R.P.C. The influence of vegetation species and plant properties on runoff and soil erosion: Results from a rainfall simulation study in south east Spain. Soil Use Manag. 1997, 13, 143–148. [Google Scholar] [CrossRef]
  79. Cerdà, A.; Doerr, S.H. Soil wettability, runoff and erodibility of major dry-Mediterranean land use types on calcareous soils. Hydrol. Process. Int. J. 2007, 21, 2325–2336. [Google Scholar] [CrossRef]
  80. Li, M.; Hai, X.; Hong, H.; Shao, Y.; Peng, D.; Xu, W.; Yang, Y.; Zheng, Y.; Xia, Z. Modelling soil detachment by overland flow for the soil in the Tibet Plateau of China. Sci. Rep. 2019, 9, 8063. [Google Scholar] [CrossRef] [Green Version]
Figure 1. Geographical location and aerial map (source: Google® Map®) with soil sampling points of the study area.
Forests 11 00065 g001
Figure 2. The experimental flume used to measure the rill detachment capacity under four land uses in the Saravan watershed (Northern Iran) [45,46].
Forests 11 00065 g002
Figure 3. Rill detachment capacity (Dc) under four land uses in the Saravan watershed (Northern Iran) (different lowercase letters indicate significantly different means at p level < 0.05, n = 25 for each land use).
Forests 11 00065 g003
Figure 4. Loadings of soil and hydraulic parameters (a), and scores of soil samples (b) on the first two principal components (PC) (the percentage variation explained by the principal components is given in parentheses) for four land uses in the Saravan watershed (Northern Iran). Legend: Dc = rill detachment capacity; OM = organic matter content; BD = bulk density; RD = root weight density; AS = aggregate stability in water; SaC = sand content; SiC = silt content; CC = clay content; CL = cropland; GL = grassland; WL = woodland; FL = forestland.
Forests 11 00065 g004
Figure 5. Correlations between the rill detachment capacity (Dc) and five hydraulic parameters using equations of Table 5 for the four land uses of the Saravan watershed (Northern Iran) (n = 25). (a) Dc - flow velocity; (b) Dc - shear stress; (c) Dc - stream power; (d) Dc - unit stream power; (e) Dc - unit energy.
Forests 11 00065 g005
Figure 6. Linear regression equations between rill detachment capacity and shear stress to estimate rill detachment and critical shear stress in cropland (a), grassland (b), forestland (c) and woodland (d) in the Saravan watershed (Iran) (n = 25).
Forests 11 00065 g006
Table 1. Flow characteristics in the experiments carried out for measuring the rill detachment capacity under four land uses in the Saravan watershed (Northern Iran).
ExperimentSlope (S, m m−1)Flow Rate (q, L m−1 s−1)Flow Depth (h, m)Hydraulic Radius (R, m)Flow Velocity (V, m s−1)Shear Stress (τ, Pa)Stream Power (ω, kg s−3)Unit stream Power (ϕ, m s−1)Unit Energy (E, m)
10.0340.220.0030.0030.1510.150.0050.004
20.330.0050.0040.221.430.310.0070.006
30.440.0060.0050.351.820.630.0110.012
40.560.0070.0070.412.20.90.0130.015
50.670.0090.0090.542.831.530.0180.024
60.0850.220.0030.0030.212.260.470.0170.005
70.330.0040.0040.323.281.040.0270.009
80.440.0050.0050.444.191.840.0370.015
90.560.0060.0060.564.782.680.0470.022
100.670.0080.0070.636.023.790.0530.028
110.1760.220.0030.0020.254.21.050.0440.005
120.330.0030.0030.365.511.980.0630.009
130.440.0040.0040.486.953.330.0840.015
140.560.0050.0050.598.364.930.1030.022
150.670.0060.0060.6810.226.950.1190.029
160.2680.220.0020.0020.285.91.650.0750.006
170.330.0030.0030.427.1530.1120.011
180.440.0040.0030.539.124.830.1420.017
190.560.0050.0040.6611.787.780.1760.026
200.670.0060.0060.7514.6310.970.2010.034
210.3640.220.0020.0020.327.332.340.1160.007
220.330.0030.0030.459.034.060.1630.012
230.440.0030.0030.5411.396.150.1960.017
240.560.0050.0040.6915.6810.820.2510.028
250.670.0060.0050.7819.23150.2830.036
Table 2. Main characteristics of soils under four land uses in the Saravan watershed (Northern Iran).
Land UseCover (% on the Total Area)Texture (%)Bulk Density (kg m−3)Root Weight Density (kg m−3)Aggregate Stability in Water (0–1)Organic Matter Content (%)
ClaySiltSand
Cropland1036.6 ± 1.27a48.9 ± 1.22a14.5 ± 1.17a1432 ± 29a0.12 ± 0.01a0.25 ± 0.02a1.28 ± 0.08a
Grassland1033.6 ± 0.62a47.1 ± 0.57a19.3 ± 0.46a1340 ± 45b0.28 ± 0.03b0.43 ± 0.02a1.36 ± 0.02a
Forestland5033.5 ± 0.51a46.7 ± 0.44a19.8 ± 0.09a1394 ± 47b0.63 ± 0.03c0.53 ± 0.04b1.87 ± 0.02b
Woodland3033.7 ± 0.21a47.1 ± 0.26a19.3 ± 0.20a1383 ± 52b0.36 ± 0.02b0.66 ± 0.04b1.66 ± 0.01b
Note: the lowercase letters indicate significant differences among land uses at p < 0.05 of t-test (n = 25 for each land use).
Table 3. Pearson’s correlation matrix among the soil properties for the four land uses (cropland, grassland, woodland and forestland, n = 25 for each land use) of the Saravan watershed (Northern Iran).
Soil PropertiesDcOMBDRDASSaCSiCCC
Dc1−0.438−0.038−0.470−0.542−0.4970.2770.531
OM−0.4381−0.1020.9280.8620.642−0.562−0.568
BD−0.038−0.1021−0.208−0.257−0.4440.3510.384
RD−0.4700.928−0.20810.8740.742−0.661−0.635
AS−0.5420.862−0.2570.87410.862−0.729−0.760
SaC−0.4970.642−0.4440.7420.8621−0.789−0.904
SiC0.277−0.5620.351−0.661−0.729−0.78910.461
CC0.531−0.5680.384−0.635−0.760−0.9040.4611
Notes: Dc = rill detachment capacity; OM = organic matter content; BD = bulk density; RD = root weight density; AS = aggregate stability in water; SaC = sand content; SiC = silt content; CC = clay content; values in bold are different from 0 at p level < 0.05.
Table 4. Loadings of the original variables (soil properties and hydraulic parameters) on the first two Principal Components (PC1 and PC2) for the four land uses (cropland, grassland, woodland, and forestland) of the Saravan watershed (Northern Iran).
Soil PropertiesPrincipal Components
PC1PC2
Dc0.3480.212
OM0.7140.081
BD0.1340.728
RD0.8160.029
AS0.9180.009
SaC0.8820.038
SiC0.6010.048
CC0.7000.012
Note: Dc = rill detachment capacity; OM = organic matter content; BD = bulk density; RD = root weight density; AS = aggregate stability in water; SaC = sand content; SiC = silt content; CC = clay content.
Table 5. The equations correlating the rill detachment capacity (Dc, [kg m−2 s−1) with the hydraulic parameters (flow velocity, V [m s−1]), shear stress, τ [Pa], stream power, ω [kg s−3], unit stream power, P [m s−1], and unit energy, E [cm]) for four land uses of the Saravan watershed (Northern Iran) (n = 25).
Independent VariableLand UseEquation
Flow velocity (V)CroplandDc = 0.141V1.701
GrasslandDc = 0.068V1.492
ForestlandDc = 0.021V1.378
WoodlandDc = 0.032V1.375
Shear stress (τ)CroplandDc = 0.005τ0.171
GrasslandDc = 0.004τ0.974
ForestlandDc = 0.001τ0.887
WoodlandDc = 0.002τ0.884
Stream power (ω)CroplandDc = 0.017ω0.772
GrasslandDc = 0.011ω0.654
ForestlandDc = 0.004ω0.598
WoodlandDc = 0.006ω0.596
Unit stream power (ϕ)CroplandDc = 0.307P0.784
GrasslandDc = 0.118P0.643
ForestlandDc = 0.035P0.595
WoodlandDc = 0.052P0.588
Unit energy (E)CroplandDc = 2.492E1.015
GrasslandDc = 0.952E0.920
ForestlandDc = 0.196E0.805
WoodlandDc = 0.335E0.829
Table 6. Values of the criteria adopted for evaluating the accuracy of equations in Table 5 to predict the rill detachment capacity from hydraulic variables under four land uses in the Saravan watershed (Northern Iran).
Hydraulic ParameterLand UseIndex
REr2NSE
Flow velocityCropland15.80.690.59
Grassland13.40.660.55
Forestland3.40.680.68
Woodland9.10.580.54
Shear stressCropland86.30.78−0.91
Grassland−1.40.910.86
Forestland29.40.970.65
Woodland13.50.890.78
Stream powerCropland7.90.960.91
Grassland−4.00.940.93
Forestland29.40.970.65
Woodland4.20.850.81
Unit stream powerCropland7.60.890.83
Grassland9.70.780.68
Forestland−0.10.920.92
Woodland6.90.800.74
Unit energyCropland18.70.580.47
Grassland15.50.570.47
Forestland8.00.540.53
Woodland11.90.490.44
Notes: RE = relative error (%); r2 = coefficient of determination; NSE = coefficient of efficiency of Nash and Sutcliffe.
Table 7. Results of regression analysis between the rill detachment capacity (Dc) and shear stress (τ) in four land uses of the Saravan watershed (Northern Iran) (n = 25).
Land UseLinear Regression Equation [2]Kr [s m−1]τc [Pa]r2
CroplandDc = 0.0092τ − 0.01570.00921.710.96
GrasslandDc = 0.0049τ − 0.00810.00491.650.92
ForestlandDc = 0.0010τ + 0.00100.00101.000.98
WoodlandDc = 0.0020τ − 0.00140.00200.700.90