Article

Bacterial Community Changes Associated with Land Use Type in the Forest Montane Region of Northeast China

1
College of Land and Environment, Shenyang Agricultural University, Shenyang 110866, China
2
College of Forestry, Shenyang Agricultural University, Shenyang 110161, China
3
Research Station of Liaohe-River Plain Forest Ecosystem, Chinese Forest Ecosystem Research Network, Shenyang 112500, China
4
College of Biology and the Environments, Nanjing Forestry University, Nanjing 210037, China
*
Authors to whom correspondence should be addressed.
The authors contributed equally to this work.
Forests 2020, 11(1), 40; https://doi.org/10.3390/f11010040
Submission received: 15 November 2019 / Revised: 20 December 2019 / Accepted: 23 December 2019 / Published: 27 December 2019
(This article belongs to the Special Issue Relationship between Forest Biodiversity and Soil Functions)

Abstract

:
Soil microorganisms play a vital role in the biogeochemical cycle, whereas land use change is one of the primary factors that affects the biodiversity and functionality of terrestrial ecosystems. The composition and diversity of bacterial communities (by high-throughput sequencing of the bacterial 16S rRNA gene) were evaluated in the soils of the Montane Region of Northeast China, across different land use types, e.g., natural secondary forest (Quercus mongolica, QM), shrubland (SL), coniferous plantation (Larix gmelinii, LG, and Pinus koraiensis, PK), and agricultural land (Zea mays, ZM). Significant differences in the chemical characteristics and bacterial communities in soils under different land uses were observed in this study. Soil resident TC (total carbon) and TN (total nitrogen) were much higher in secondary natural forest soils, than in coniferous plantation and agricultural soils. Compared with forest and shrubland soils, soil bacterial OTUs, the Chao1 index, and the ACE index were the lowest in the ZM. There were high proportions of Proteobacteria, Actinobacteria, Acidobacteria, Chloroflexi, Gemmatimonadetes, Verrucomicrobia, Bacteroidetes, Planctomycetes, Saccharibacteria, and Nitrospirae in agricultural and forest soils, which accounted for over 90% of the reads in each sample. We found that the dominant group in the forest and shrubland soils was Proteobacteria, while the most dominant group in the ZM was Actinobacteria. The results of both heatmap and principal component analyses displayed groups according to land use types, which indicated that the bacterial communities in the areas under study were significantly influenced by long term differently managed land use. Furthermore, redundancy and Pearson correlation analyses revealed that the bacterial communities were primarily regulated by soil characteristics. This suggested that altered land use patterns initiated changes in the chemical properties of the soils, which affected the composition of microbial communities in this area. This provides a scientific basis for the evolutionary mechanism of soil quality, as well as the rational development and utilization of land resources.

1. Introduction

The microbial communities of soils dominate biogeochemical cycling, while playing key roles in natural ecosystems [1,2,3,4]. Soil microorganisms provide the impetus for the transformation and recycling of soil resident organic matter and elemental nutrients, such as C and N [5,6]. They are incredibly active and diverse, and play invaluable roles in the maintenance of soil structure, conservation of soil fertility, and soil formation and development, and ensuring system stability [7]. The composition, activity, and diversity of microbial communities largely determines the circulation of nutrients and soil fertility.
As sensitive indicators, changes in the bacterial diversity and community compositions of soils may be employed to rapidly reflect soil quality variations [8]. Soil microbes also play a critical role in plant growth and crop production [9]. The structures of microbial communities in soils are impacted by alterations in land cover, climatic factors, soil properties, vegetation community structures and diversity, and land use patterns [10,11,12]. Changes in land use practices comprise the most direct anthropogenic interventions that can modify vegetation growth, litter decomposition, soil nutrient accumulation, and microbial activity [13]. Land use patterns affect soil-dwelling microbial communities [14], modifying soil pH, sources of C, C/N, and the availability of nutrients for soil microorganisms [15]. Furthermore, land use and cover changes impact plant litter on the soil surface, as well as environmental conditions (water and heat), the transformation and flow of soil nutrients, and the quantity, composition, and activity of soil microorganisms [16]. Recently, there have been numerous published studies about the influences of different land use patterns on soil microbiological communities, as well as their metabolic activity and functional capacity [17,18,19,20,21,22,23], including chemical and organic fertilizers and anthropogenic interventions [24,25,26]. Nevertheless, further research is needed to explain the effects, on soil microorganisms, of some land use types, such as secondary forests, plantations and farmland.
The native vegetation in the mountainous region (part of the Changbai Mountains) of Eastern Liaoning Province, China, is mixed forest of broadleaved species and Korean pine (Pinus koraiensis). This area possesses a relatively rich and unique biodiversity, which is of significant ecological and scientific value, both for China and globally. However, due to excessive harvesting over the last 100 years, the original vegetation has been seriously damaged. A large proportion of the secondary forests has been transformed to Pinus koraiensis and Larix gmelinii plantations due to the increased demand for timber, some of which were reclaimed farmlands.
Currently, the vegetation in Eastern Liaoning Province is dominated by broadleaved secondary forests, artificial coniferous forests, shrubland, and croplands, where soil microorganisms, and thus the quality of soils, have been modified via the replacement of the primary vegetation (mixed forest of broadleaved species and Korean pine) with artificial forests, and the downstream effects of afforestation. The monitoring of structural changes between soil microbial communities in different land use types can provide a theoretical basis for the restoration of degraded soil ecosystems, while inspiring sustainable management.
A recent investigation of the soil microorganisms in the mountainous region of Liaodong focused primarily on the microbial biomass of secondary forest soils, and the effects of forest gaps on soil microbial biomass (carbon and nitrogen) [27,28]. However, few studies [29,30] have reported on the effects of vegetation types on the composition and diversity of microbial communities in soils. For this study, the microbial patterns of soils in areas dominated by Quercus mongolica (QM), shrubland (SL), Larix gmelinii (LG), Pinus koraiensis (PK), and Zea mays (ZM) were investigated. High-throughput 16S rRNA sequencing was employed to determine the bacterial community compositions and diversity in the mountainous forest region and to evaluate the influences of different land use types on bacterial diversity.

2. Materials and Methods

2.1. Research Area

The research site was located in an experimental forest farm of the Liaoning Institute of Forest Management, Liaoning Province, China (40°52′31′′ N, 123°56′43′′ E), which is a forest montane region in Northeastern China. It has a typical temperate continental monsoon climate with an annual average temperature of 6.5 °C and a mean annual precipitation of 926.3 mm. Prior to the cultivation of Zea mays (that lasts for five years), the vegetation was a shrubland. Field management in the area is extensive, no irrigation is used, and harvested corn straw is not returned to the field.

2.2. Sample Unit Selection, Sample Collection

For the present study, five land use types with uniform conditions (the same elevation, slope direction), which included Quercus mongolica, shrubland, Larix gmelinii, Pinus koraiensis, and Zea mays, were selected in July 2017 (Table 1). Soil samples were collected from three plots (20 m × 20 m) as three independent replicates using a soil auger (Ø8 cm) at a 10 cm depth from each land use type. For each plot, a strip sampling method was employed, and fifteen soil samples were well mixed, placed in sterile plastic bags as replicate sample, marked, and subsequently stored in ice boxes. Residual plant roots and debris were removed from the soil samples at the Forest Ecological Laboratory of Shenyang Agricultural University, after which the soil samples were ground, well mixed, and screened using 2 mm sieves. A portion of the prepared soil samples was stored at −80 °C for high-throughput sequencing, with the remainder being air-dried at room temperature.

2.2.1. Soil Chemical Properties

Soil pH was measured via a supernatant of the soil with a digital pH-meter (PB-10, SARTORIUS, Germany). The air-dried subsamples were rehydrated with water at a ratio of 1:5, stirred for 2 min with an electromagnetic oscillator, and then left to stand for 30 min. The total C and N contents were analyzed in the fine-ground soil subsamples using an Isoprime isotope ratio mass spectrometer with a Eurovector elemental analyzer (Elementar Vario EL III, Elementar, Germany). The alkali solution-diffusion method was employed to detect the available nitrogen in the samples. The soil C/N ratio was calculated using the TC and TN datasets, and the inorganic N was extracted from the soil samples using a KCl (2N) solution. Phenyl mercury acetate (0.1 mL) was added to the filtrate to preserve the samples. The ammonium (NH4+–N) and nitrate (NO3–N) contents of the extracts were determined using an automatic flow injection analysis system.

2.2.2. Soil DNA Extraction

The total genomic DNA was extracted from 0.5 g of soil using a Fast DNA SPIN extraction kit (MP Biomedicals, Santa Ana, CA, USA) following the manufacturer’s protocol. This was stored at -20 °C until further analysis. The extracted DNA was measured using a NanoDrop ND-1000 spectrophotometer (Thermo Fisher Scientific, Waltham, MA, USA), whereas agarose gel electrophoresis was employed to assess the quality of the DNA.

2.3. 16S rDNA High-Throughput Sequencing

In this study, the PCR amplification of the V3–V4 region of bacterial 16S rRNA was performed using the forward primer 338F (5’-ACTC CTA CGG GAG GCA GCA-3’) and the reverse primer 806R (5’-GGA CTA CHV GGG TWT CTA AT-3’) [30]. PCR was carried out in 25 µL reaction tubes which contain 5 μL of a Q5 reaction buffer (5×), 5 μL of a Q5 High-Fidelity GC buffer (5×), 2 μL (2.5 mM) of dNTPs, 2 μL of a DNA template, 0.25 μL of Q5 High-Fidelity DNA Polymerase (5U/μL) and 8.75 μL of ddH2O. In addition, to each reactions, 1 μL (10 uM) of each forward and reverse primer was added. Each sample contains three duplicates.
The cycling conditions were 98 °C for 5 min, then 25 cycles of 98 °C for 15 s, 55 °C for 30 s, and 72 °C for 30 s, with a final extension for 5 min at 72 °C. Agencourt AMPure Beads (Beckman Coulter, Indianapolis, IN, USA) and PicoGreen dsDNA Assay Kit (Invitrogen, Carlsbad, CA, USA) were used for the PCR amplification, purification and quantification. The pair-end 2 × 300 bp sequencing libraries of 16 s regions were processed using the Illlumina MiSeq platform with a MiSeq Reagent Kit v3 from Shanghai Personal Biotechnology Co., Ltd. (Shanghai, China).

2.4. Bioinformatics and Statistical Analyses

Sequence data analyses were mostly performed using QIIME and R packages (v3.2.0). Operational taxonomic units (OUT)-level alpha diversity indices, such as the Chao1 richness estimator, ACE metric (Abundance-based Coverage Estimator), Shannon diversity index, and Simpson index, were calculated using the OTU table in QIIME. Following the preprocessing of all reads, the entire dataset comprised a total of 909,110 high quality sequences, subsequent to the elimination of chimeras, with an average of 60,607 sequences being obtained from each soil sample. After multiple levels of sequence processing, quality filtering, and sequence number normalization were followed by 3% dissimilarity clustering. To determine the rarefaction curves, richness, and diversity, 18,000 reads were randomly selected from each sample. Venn diagrams were employed to visualize the shared and unique OTUs between the samples using the R package. LEfSe (Line Discriminant Analysis (LDA) Effect Size) analysis was carried out to determine the significantly abundant microbial organisms using Galaxy (https://huttenhower.sph.harvard.edu/galaxy/).The heatmap representation of the relative abundance of bacterial OTUs among the samples was developed using R. A principal component analysis (PCA) was also conducted based on genus-level composition profiles.
One-way analysis of variance (ANOVA) was performed using SPSS 19.0 software (SPSS Inc., Chicago, USA). The chemical characteristics, total bacterial abundance, alpha diversity indices, and the taxa (phyla and genus) of different soils were compared using a least significant difference (LSD) test. Pearson correlation analysis was utilized to evaluate correlations between the alpha diversity indices and the soil characteristics. A PCA plot of the 16S rRNA gene clone libraries was developed using CANOCO software to reveal and easily distinguish distinct variables among different land use types. A redundancy analysis (RDA) was performed using R package and employed to evaluate the linkages between the dominant bacterial groups associated with soil environmental factors.

3. Results

3.1. Chemical Soil Characteristics

The ANOVA revealed significant differences in basic soil chemical properties. The soil pH value ranged from 5.54 to 6.29 in the samples from all land use types. The soil pH was the highest in SL (6.29) and was significantly higher than that of the LG, PK, and ZM samples. No significant differences in the soil C/N between the samples was observed, with the C/N varying from 13.09 to 13.71. The natural secondary forest (QM) possessed the highest total carbon (TC), total nitrogen (TN), and available nitrogen (AN) contents, showing significantly higher values than those found in SL, PK, and ZM; however, there were no significant differences with LG. The NH4+–N content of LG and PK was 6.33 mg·kg−1 and 7.68 mg·kg−1, respectively, which was considerably higher than the NH4+–N content of QM, SL, and ZM. The NO3–N content under different land use types decreased in the following order: LG > PK > ZM > QM> SL (Table 2).

3.2. Diversity of Soil Bacterial Communities under Different Land Use Patterns

We found 2940, 2871, 2773, 2418, and 1965 sequences in the soil samples from Quercus mongolica, shrubland, Larix gmelinii, Pinus koraiensis, and Zea mays, respectively, at the bacterial phylum level (Table 3). No asymptote was observed for the rarefaction curves at the 3% dissimilarity level (Figure 1), and the curve tended to flatten as the number of measured sequences increased. This indicated that the experiment had obtained most of the sample data, which reflected the composition of the bacterial communities in the studied soils.
Chao1, ACE, Simpson, and Shannon alpha diversity indices were calculated to estimate the species richness and biodiversity in the 15 samples (Table 3). Between the five land use types, the average values of the Shannon index, Chao1 index, ACE index, and Simpson index in the SL, LG, and PK samples were remarkably higher than those in the QM and ZM samples. The average values of the Chao1 and ACE indices in ZM were the lowest, at 2072.43 and 2114.55, respectively.
Pearson correlation analysis revealed that the Simpson index had markedly positive relationships with soil pH (r = 0.688, p < 0.01), TC (r = 0.593, p < 0.05), TN (r = 0.583, p < 0.05), and AN (r = 0.585, p < 0.05) and a significantly negative relationship with NH4+–N (r = −0.723, p < 0.01). The Shannon, Chao1, and ACE indices exhibited highly significant positive correlations with TC (r = 0.729, p < 0.01; r = 0.686, p < 0.01; r = 0.710, p < 0.01), TN (r = 0.724, p < 0.01; r = 0.683, p < 0.01; r = 0.703, p < 0.01), and AN (r = 0.727, p < 0.01; r = 0.691, p < 0.01; r = 0.716, p < 0.01), respectively (Table 4).

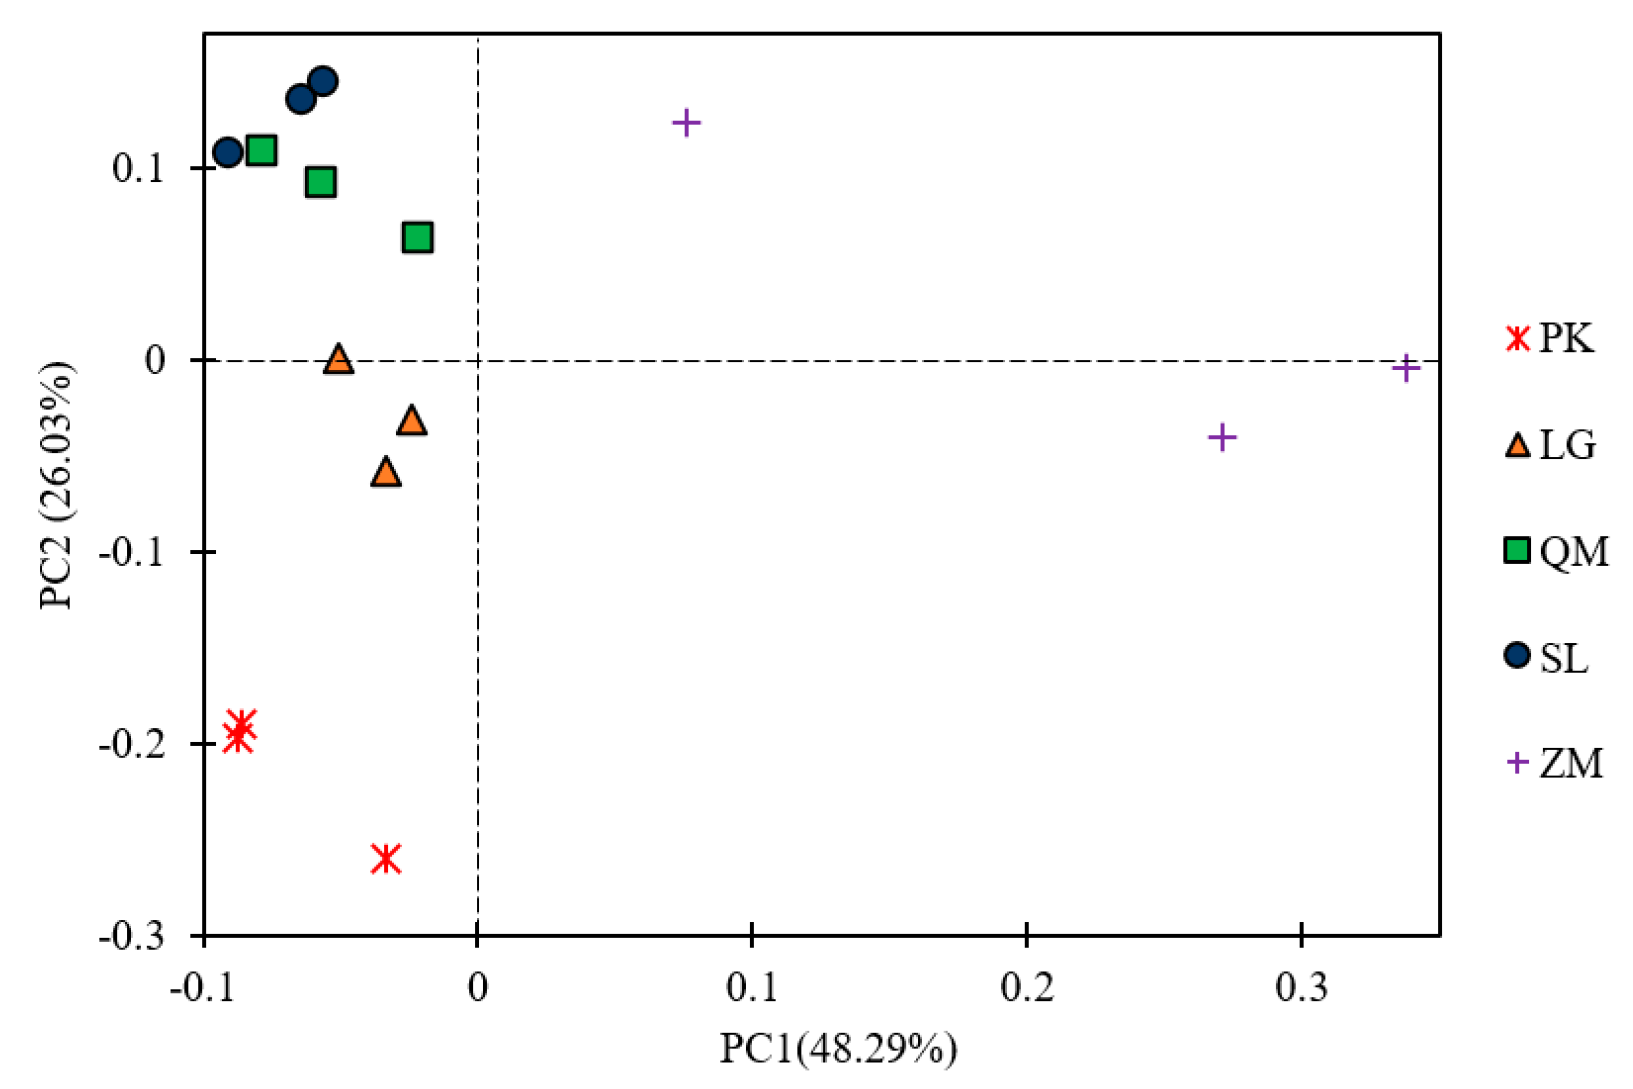
3.3. Soil Bacterial Community Compositions under Different Land Use Patterns

All valid extracted sequences from the five land use types were classified from phylum to genus based on the RDP (Ribosomal Database Project) database. There were significant differences in the bacterial community abundance at different phylogenetic levels. Thirty-two phyla were identified in the five samples, of which Proteobacteria (35.25%), Actinobacteria (28.18%), Acidobacteria (12.63%), Chloroflexi (7.74%), Gemmatimonadetes (5.86%), Verrucomicrobia (2.14%), Bacteroidetes (2.01%), Planctomycetes (1.43%), Saccharibacteria (1.31%), and Nitrospirae (1.24%) were dominant, accounting for > 90% of the reads in each sample (Figure 2). The most abundant sequences in the PK, LG, QM, and SL samples were from Proteobacteria, while the most abundant sequences in the ZM sample were from Actinobacteria. There were significantly higher abundances of Proteobacteria, Acidobacteria, and Chloroflexi in PK than the other samples, while the relative abundances of Actinobacteria and Bacteroidetes were the lowest. There were also much higher abundances of Actinobacteria, Gemmatimonadetes, and Saccharibacteria in the ZM samples compared with the others; however, the abundances of Proteobacteria, Acidobacteria, and Verrucomicrobia were the lowest. The Planctomycetes and Nitrospirae populations were similar between the five soil samples. LEfSe analysis with a threshold of 4.12 showed that the enriched bacterial populations encompassed Acidobacteria and Proteobacteria in the PK soil; Actinobacteria, Gemmatimonadetes, and Saccharibacteria in the ZM soil; and Deltaproteobacteria in the QM soil (Figure 3).
At the genus level, the dominant genera that accounted for more than 1% each of the overall communities across QM, SL, LG, PK, and ZM were Nitrobacter, Gemmatimonas, Sphingomonas, Rhodoplanes, Variibacter, RB41, Pseudolabrys, Mycobacterium, Actinoplanes, Solirubrobacter, Haliangium, Candidatus-Solibacter, and Pseudonocardia. The relative abundances of Gemmatimonas and Sphingomonas were higher in ZM than for the other land use types. The populations of Nitrobacter, Rhodoplanes, Variibacter, RB41, Mycobacterium, and Pseudonocardia were smaller in the ZM soil than in the other land use type soils. The relative abundances of Nitrobacter, Variibacter, Pseudolabrys, Mycobacterium, and Candidatus-Solibacter were observably higher in the PK than in the other land use types, whereas the Rhodoplanes, RB41, Actinoplanes, and Pseudonocardia populations were significantly higher in the SL than in the other land use types (Figure S1). Venn diagrams were employed to compare the bacterial communities based on shared and unique OTUs among the samples. At the genus level, the Venn diagram revealed 789 shared OTUs between the five land use patterns (Figure S2). A total of 3759, 4514, 4936, 4502, and 3593 OTUs were observed in the soil samples from QM, SL, LG, PK, and ZM, respectively. The number of unique OTUs harbored in each of the soil samples included 466 for QM, 465 for SL, 404 for LG, 619 for PK, and 1037 for ZM.
A hierarchically clustered heatmap revealed that the five soil samples were separated into four groups, where one group contained QM and SL, while the other three groups were LG, PK, and ZM (Figure 4). The most populous genus (Nitrobacter) was found in the PK sample. Although the sequences belonging to Gemmatimonas, Massilia, Singulisphaera, Patulibacter, Roseiflexus, Burkholderia-Paraburkholderia, Devosia, Jatrophihabitans, Blastococcus, Gemmatimonas, and Sphingomonas were detected in ZM, they were absent or rarely detected in the other soil samples (Figure 4). Principal component analysis (PCA) was employed to extract the primary components, and a PCA was performed according to the Bray–Curtis distance matrix (Figure 5). The PCA of the abundance of bacterial genera revealed that the microbial communities of LG and PK were grouped together as well as the microbial communities of QM and SL. The ZM samples tended to be distinct from PK, QM, SL, and LG, particularly along PC1 (Figure 5). Both analyses (Heatmap and PCA) indicated that soil bacterial communities were clearly different among different land use types.

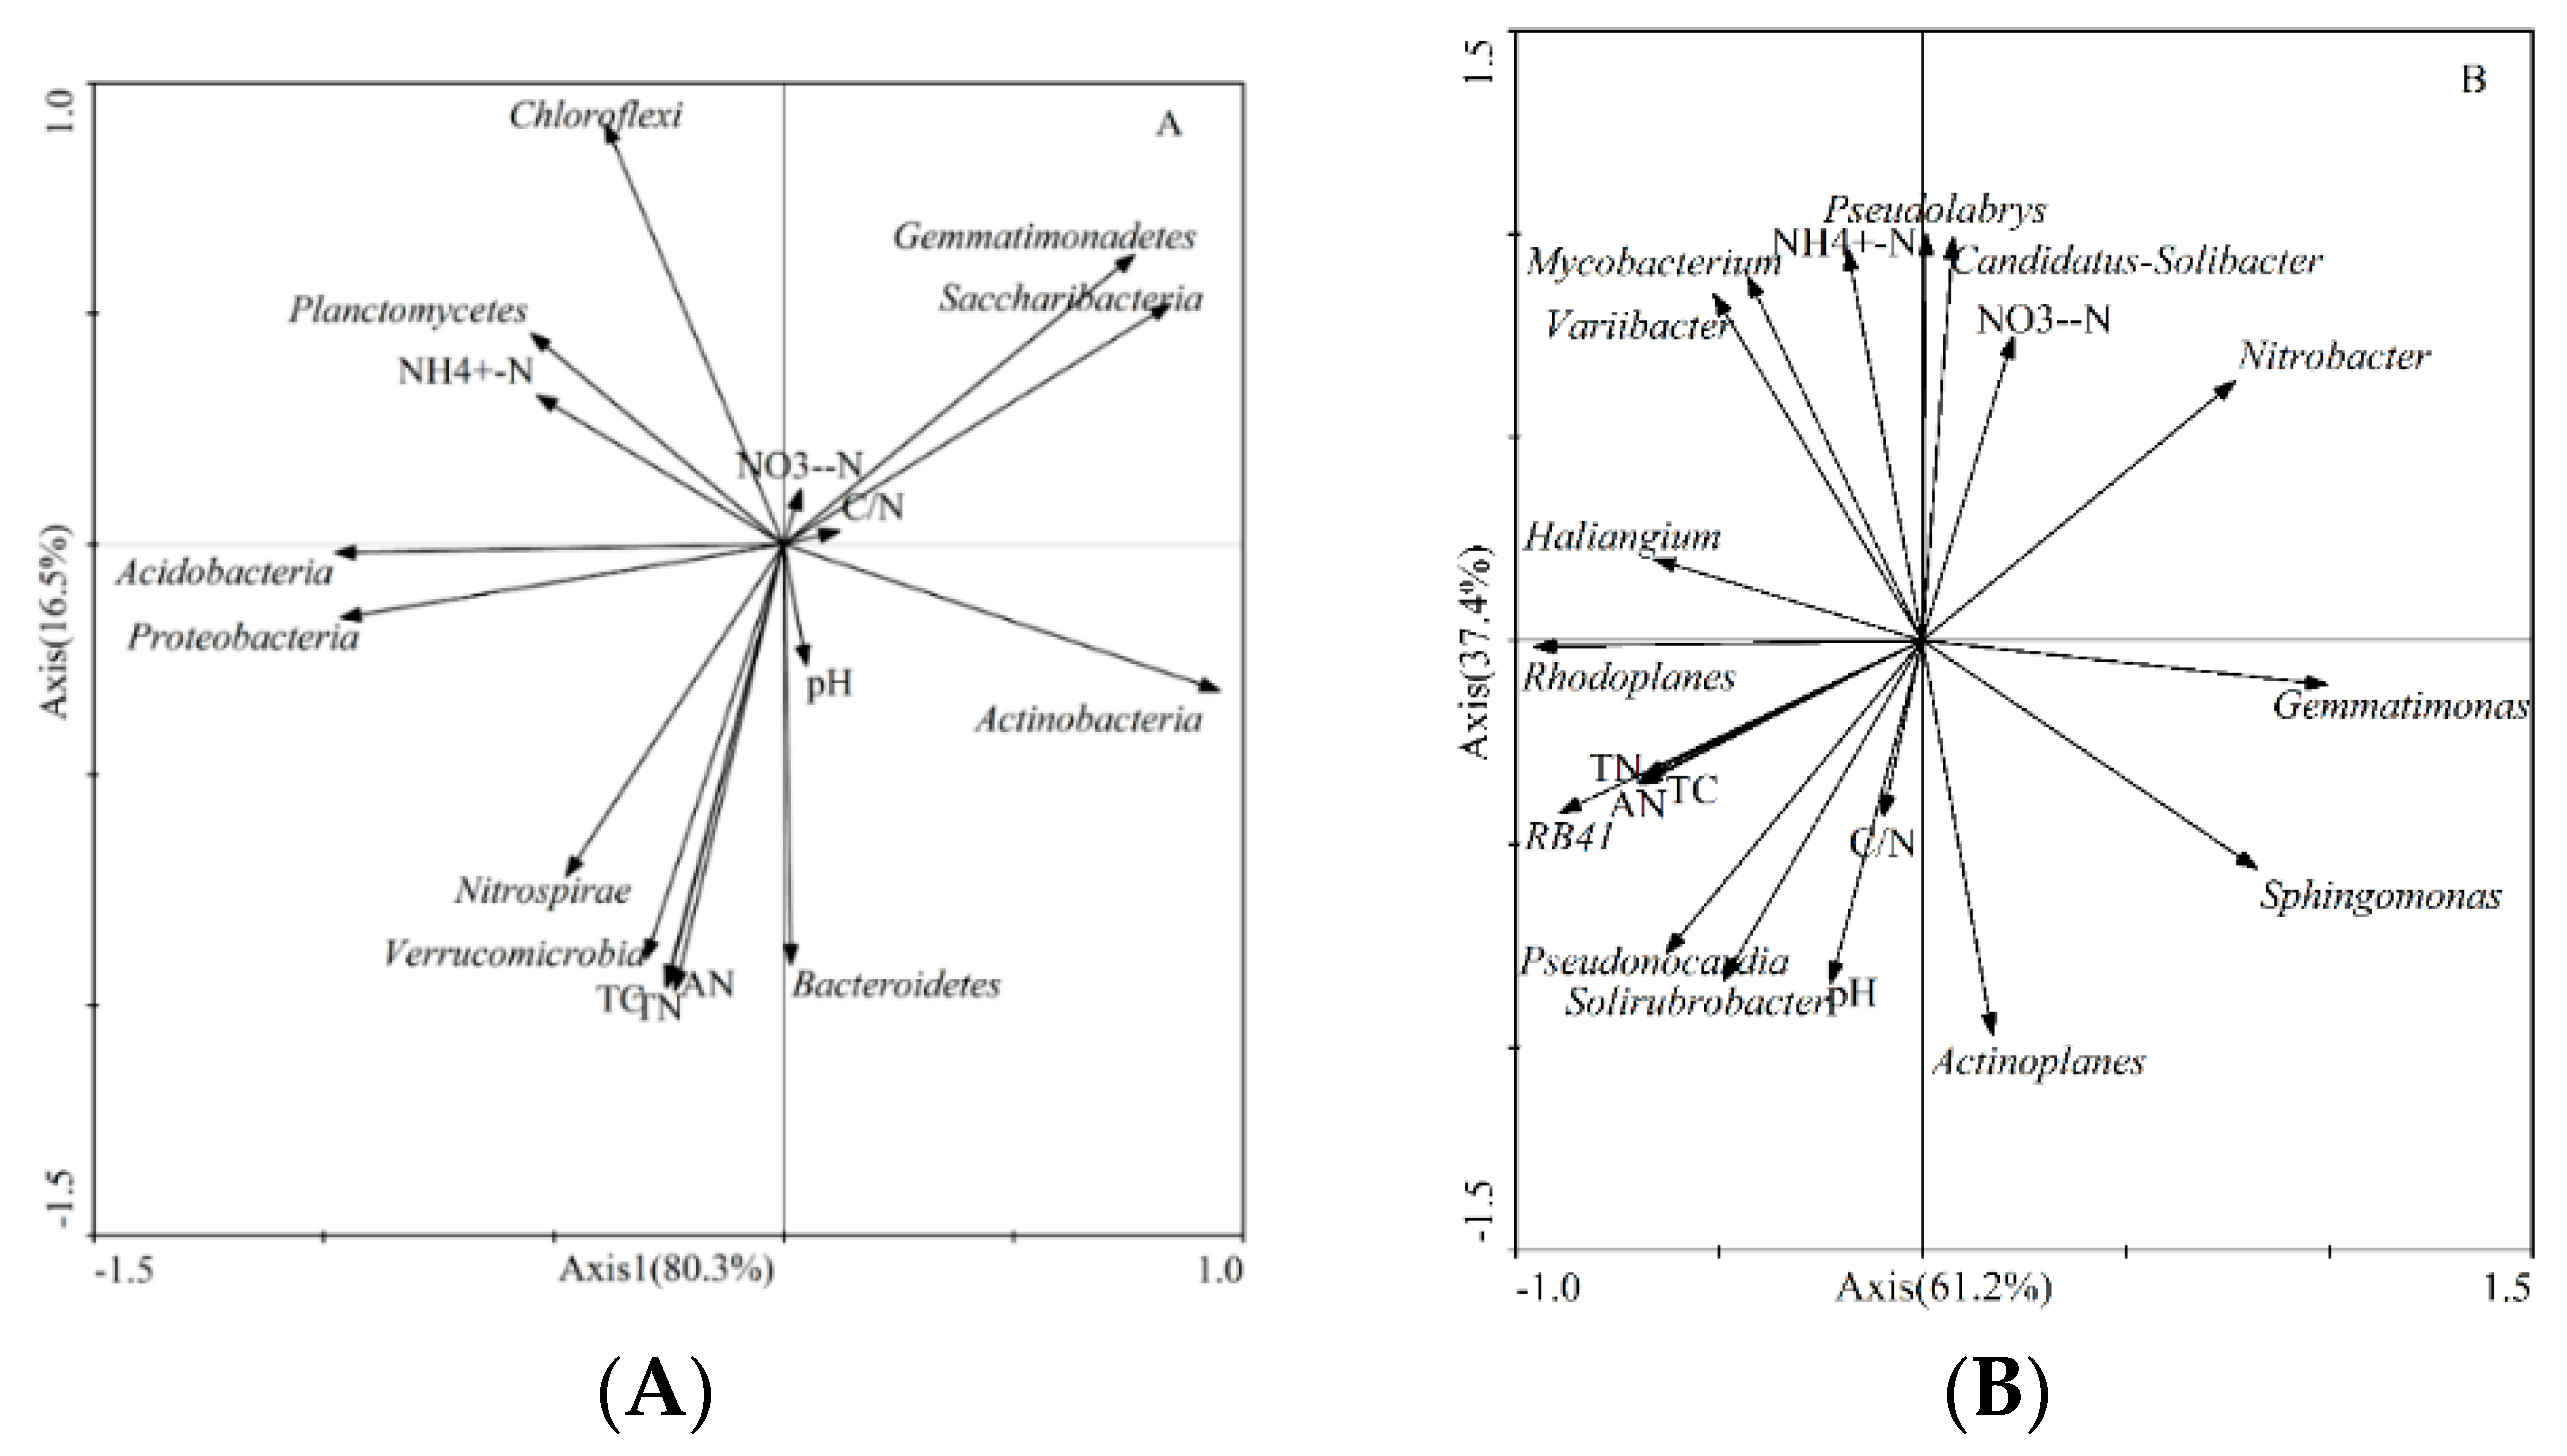
3.4. Relationships between the Microbial Community Composition and Soil Environmental Factors

A redundancy analysis (RDA) was conducted to evaluate the relationships between the compositions of the dominant bacterial phyla (or genera) and selected soil properties (soil pH, TC, TN, AN, NH4+–N, and NO3–N) with the results summarized in Figure 6. The RDA plots, based on the dominant phyla and genera, were nearly identical. The overall structures of the dominant phyla or genera under different land use types were significantly linked to selected soil properties. At the phylum level, the eigenvalues of the first axis and the second axis were 0.803 and 0.165, respectively. The axes explained 96.8% of the total microbial variance. The NH4+–N content (r = −0.54, p < 0.05) had a greater relationship with Axis1, and the TC (r = −0.96, p < 0.05), TN (r = −0.96, p < 0.05), and AN (r = −0.97, p < 0.05) had greater relationships with Axis2.
Pearson correlation analysis of the dominant bacterial groups and soil environmental factors indicated that the relative abundance of Proteobacteria was positively correlated with NH4+–N (r = 0.515, p < 0.05). Chloroflexi in the analyzed soils was negatively correlated with TN (r = −0.518, p < 0.05). The relative abundance of Gemmatimonadetes was negatively correlated with soil TC (r = −0.712, p < 0.01), TN (r = −0.714, p < 0.01), and AN (r = −0.680, p < 0.01), while Verrucomicrobia, Bacteroidetes, and Nitrospirae were positively correlated with the TC, TN, and AN contents (Table 5).
At the genus level, the eigenvalue of Axis1 was 0.612, and this axis had stronger relationships with soil TC (r = −0.6981), TN (r = −0.6879), and AN (r = −0.6912), which explained 61.2% of the total microbial variance. Soil pH (r = −0.8432), NH4+–N (r = 0.9622), and NO3–N (r = 0.7468) had greater relationships with Axis2, with the eigenvalue of Axis2 being 0.374. The axes explained 98.6% of the total microbial variance; thus, these findings confirmed that these two axes can reflect the influence of environmental factors on the structures of microbial communities in soils.
The relative abundances of Variibacter (r = −0.521, p < 0.05), Pseudolabrys (r = −0.739, p < 0.01), and Candidatus-Solibacter (r = −0.632, p < 0.05) were negatively correlated with soil pH, while RB41 (r = 0.522, p < 0.05), Actinoplanes (r = 0.643, p < 0.01), Solirubrobacter (r = 0.622, p < 0.05), and Pseudonocardia (r = 0.568, p < 0.05) were positively correlated with soil pH. The abundances of Rhodoplanes, Solirubrobacter, Pseudonocardia, RB41, and Haliangium had positively correlated relationships with AN (r = 0.514, p < 0.05; r = 0.537, p < 0.05; r = 0.559, p < 0.05; r = 0.526, p < 0.05; r = 0.532, p < 0.05, respectively); however, Gemmatimonas had a negative correlation with AN (r = −0.549, p < 0.05) (Table 5).
The populations of Nitrobacter, Variibacter, Pseudolabrys, Mycobacterium, and Candidatus-Solibacter exhibited highly significant positive correlations with NH4+–N (r = 0.806, p < 0.01; r = 0.800, p < 0.01; r = 0.807, p < 0.01; r = 0.670, p < 0.01; r = 0.722, p < 0.01, respectively), while Actinoplanes showed a highly significant negative correlation with NH4+–N (r = −0.723, p < 0.01). The soil TC and TN contents had strongly negative correlations with Gemmatimonas (r = −0.565, p < 0.05; r = −0.558, p < 0.05) and a robust positive correlation with RB41 (r = 0.527, p < 0.05; r = 0.521, p < 0.05) (Table 5).

4. Discussion

The microbial diversity of soil is the most critical factor that reflects its stability and quality [31] and has the capacity to regulate various non-biological indicators. Therefore, the investigation of soil microbial diversity and community structures in soil is vital for the assessment of its health and fertility. Using high-throughput DNA pyrosequencing, Roesch et al. [32] found that agricultural management could significantly influence the diversity of soil bacteria and archaea, and the microbial diversity of forested land was much higher than that of agricultural land at the phylum level. Thus, land use type is an important factor that impacts the diversity of bacterial communities in soils.
Bacteria comprise the most abundant and diverse group of microorganisms and play multiple key roles in soils. Any modifications to microbial communities caused by land use changes are likely to contribute to alterations in ecosystem functionality and the maintenance of soil quality [33]. To the best of our knowledge, this is the first study on soil high-throughput sequencing to analyze variations in bacterial structures among secondary forests, plantations and farmland in the montane region of Eastern Liaoning Province, China. Here, we report on the structural differences between bacterial communities in soils under five different land use types. Differences in land use were found to impact different microbial communities in the soil.
Ten dominant bacterial phyla, including Proteobacteria, Actinobacteria, and Acidobacteria, were identified in all five samples, and these dominant phyla are akin to those described in earlier investigations [34,35,36]; however, this was not in agreement with the results described by [37]. In this study, the dominant microorganisms at the phylum level in ZM were similar to those found in forest land, which is consistent with other studies [34,35,38]. The phylum Proteobacteria was dominant (average 35.25%) and presented a constant abundance in Quercus mongolica, shrubland, Larix gmelinii, and Pinus koraiensis land. Species from this phylum are considered to be the primary functional bacteria for the decomposition and transformation of litter, which aligns with previous research results [39,40]. However, the relative abundance of Proteobacteria in ZM was lower than that in forested land, which was consistent with results showing that the relative abundance of Proteobacteria increased significantly with higher organic matter content [41,42].
The other dominant phyla in our dataset were Actinobacteria (~28.18%) and Acidobacteria (~12.63%) (Figure 2). The relative abundances of representatives of these phyla varied between the different land use types, which suggests the influence of variable plant coverage. The ratio of Proteobacteria and Actinobacteria can reflect the chemical properties of soils. Several additional studies have indicated that lower ratios occurring in oligotrophic soils. Specifically, if this ratio is lower, the soil quality will be lower [36]. Our results further confirmed this and extended evidence for these ecological classifications for direct or indirect bacterial responses to the availability of soil nutrients.
In this study, the ratio of Proteobacteria to Actinobacteria was the lowest in ZM, which might have been due to the decreased soil quality caused by the conversion of forest to farmland. Bacteroidetes are composed of gram-negative bacteria that are widely distributed in soils and sediments, ranging from 0% to 18% (~5%) of soil bacterial communities [38]. Our results showed that the composition of Bacteroidetes in all the samples was higher than 1% except for PK. The abundance of Bacteroidetes in QM was significantly higher than that in LG and PK (Figure 2), and Bacteroidetes was revealed to be a key bacterium for decomposition in broadleaved forests [43]. These results assisted us in evaluating the effects of different qualities and quantities of litter and root exudates released by broadleaved and coniferous forests on the chemical properties of the soil, and the different microbial communities [44,45].
The structures of microbial communities were driven by both land use type and soil chemical properties. The importance of the chemical properties of soils toward shaping microbial communities has been established by several studies. Soil pH is a well-known factor for predicting bacterial diversity and structure [46]. Results from a study by Shen et al. [47] revealed that soil pH was a key factor in the determination of microbial diversity and community composition. The soil pH in this region was found to be less than 6.5, and the Simpson index was significantly positively correlated with the soil pH. Published studies have also revealed that, particularly in soils with a pH of less than 6.5, microbial diversity decreased with lower soil pH [48,49,50]. Other studies indicated that the Acidobacteria phylum is widely distributed across various soil environments [51,52], and its abundance has been significantly correlated with soil pH [48]. However, our study did not confirm this, which might be due to the narrow range of soil pH values found in this study. We found that the changes and distribution of bacterial communities were strongly correlated with soil carbon and nitrogen, and other chemical properties (Figure 6, Table 5). The results obtained in this study align well with a previous study, which revealed that several soil properties, including organic C and total N contents affect the composition of microbial communities in soils [53,54]. Variations in microbial communities are a comprehensive reflection of the impacts of these environmental factors. Compared with forest lands and shrubland, the ACE and Chao1 diversity indices in ZM land were the lowest, which is in agreement with previous studies [55,56]. This may be because forest lands and shrubland contain additional plant species, and their developed root systems provide a suitable habitat for soil microorganisms. Simultaneously, their root secretions can provide resources for microorganisms, which is more conducive for the survival of diverse microorganisms. In contrast, the long-term planting of ZM is a monoculture, which results in a lower diversity of root exudates. Microorganisms that have adapted to their environment are selected for, which results in a decrease in the diversity index.
These findings reconfirm that changes in bacterial community composition and diversity may be primarily attributed to different land use types. Based on the heatmap (Figure 4), the relative abundance of Nocardioides was observed to be much higher in the ZM soil than in forest lands and shrubland. Nocardioides was previously reported as belonging to the nitrite-oxidizing bacterial group, and the species in this genus are key nitrifiers in natural ecosystems [57,58]. Presumably, a large quantity of added nitrogen fertilizer and intensified anthropogenic activities in agricultural lands would lead to selective pressure for these species. Collectively, these results indicate that different land use types can greatly influence the diversity and structures of bacterial communities in soils.

5. Conclusions

In summary, this study clearly illustrated the bacterial community structures and their variety in a mountainous region of Northeast China, which revealed the influences of different land use types on bacterial diversity. Bacterial diversity was lower in ZM compared with that in forest lands and shrubland. Different land use types were found to not only directly determine the soil bacterial diversity and composition but also alter key soil attributes that impact soil bacterial communities. These findings significantly advance the elucidation of the effects and mechanisms of different land use types, which can modify the composition and diversity of bacterial communities in soils.

Supplementary Materials

The following are available online at https://www.mdpi.com/1999-4907/11/1/40/s1, Figure S1: Relative abundances of soil bacteria at the genus level under different land use types. Relative abundances are based on the proportional frequencies of bacterial DNA sequences that could be defined at the genus level. QM; Quercus mongolica; LG: Larix gmelinii; PK: Pinus koraiensis; SL: Shrubland; ZM: Zea mays, Figure S2: Venn diagrams of OTU richness. QM: Quercus mongolica; LG: Larix gmelinii; PK: Pinus koraiensis; SL: Shrubland; ZM: Zea mays.

Author Contributions

B.W. and L.J. conceived and designed the experiments; S.-J.W., J.-J.D., Y.Y., S.-J.Q. and W.-X.Z. performed the experiments; Y.-B.Z. and H.R. analyzed the data; S.-J.W. and J.-J.D. wrote the manuscript; and all co-authors edited numerous drafts. All authors have read and agreed to the published version of the manuscript.

Funding

This research was financially supported by the National Science and Technology Support Program of China (2015BAD07B30103), the Sub-project of the National Key Research and Development Program (2017YFC050410501) and the Special Fund for Forest Scientific Research in the Public Welfare (201304216).

Acknowledgments

The authors thank Xiaoming Zou for giving guidance in the aspect of data processing, Wangming Zhou for designing the experiment.

Conflicts of Interest

The authors declare no conflict of interest.

References

  1. Liu, D.; Keiblinger, K.M.; Leitner, S.; Wegner, U.; Zimmermann, M.; Fuchs, S.; Lassek, C.; Riedel, K.; Zechmeister-Boltenstern, S. Response of microbial communities and their metabolic functions to drying–rewetting stress in a temperate forest soil. Microorganisms 2019, 7, 129. [Google Scholar] [CrossRef] [PubMed] [Green Version]
  2. Angeloni, N.L.; Jankowski, K.J.; Tuchman, N.C.; Kelly, J.J. Effects of an invasive cattail species (Typha×glauca) on sediment nitrogen and microbial community composition in a freshwater wetland. FEMS Microbiol. Lett. 2006, 263, 86–92. [Google Scholar] [CrossRef] [PubMed] [Green Version]
  3. Averill, C.; Hawkes, C.V. Ectomycorrhizal fungi slow soil carbon cycling. Ecol. Lett. 2016, 19, 937–947. [Google Scholar] [CrossRef] [PubMed]
  4. Kogelknabner, I. The macromolecular organic composition of plant and microbial residues as inputs to soil organic matter. Soil Biol. Biochem. 2002, 34, 139–162. [Google Scholar] [CrossRef]
  5. Khan, K.S.; Mack, R.; Castillo, X.; Kaiser, M.; Joergensena, R.G. Microbial biomass, fungal and bacterial residues, and their relationships to the soil organic matter C/N/P/S ratios. Geoderma 2016, 271, 115–123. [Google Scholar] [CrossRef]
  6. Bastida, F.; Zsolnay, A.; Hernández, T.; García, C. Past, present and future of soil quality indices: A biological perspective. Geoderma 2008, 147, 159–171. [Google Scholar] [CrossRef]
  7. Gyaneshwar, P.; Kumar, G.N.; Parekh, L.J.; Poole, P.S. Role of soil microorganisms in improving P nutrition of plants. Plant Soil. 2002, 245, 83–93. [Google Scholar] [CrossRef]
  8. Cruz-Paredes, C.; Wallander, H.; Kjøller, R.; Rousk, J. Using community trait-distributions to assign microbial responses to pH changes and Cd in forest soils treated with wood ash. Soil Biol. Biochem. 2017, 112, 153–164. [Google Scholar] [CrossRef]
  9. Berg, G. Plant–microbe interactions promoting plant growth and health: Perspectives for controlled use of microorganisms in agriculture. Appl. Microbiol. Biotechnol. 2009, 84, 11–18. [Google Scholar] [CrossRef]
  10. Yin, C.; Jones, K.L.; Peterson, D.E.; Garrett, K.A.; Hulbert, S.H.; Paulitz, T.C. Members of soil bacterial communities sensitive to tillage and crop rotation. Soil Biol. Biochem. 2010, 42, 2111–2118. [Google Scholar] [CrossRef]
  11. Guo, X.; Chen, H.Y.H.; Meng, M.; Biswas, S.R.; Ye, L.; Zhang, J. Effects of land use change on the composition of soil microbial communities in a managed subtropical forest. For. Ecol. Manag. 2016, 373, 93–99. [Google Scholar] [CrossRef]
  12. Wang, Q.; He, T.; Wang, S.; Liu, L. Carbon input manipulation affects soil respiration and microbial community composition in a subtropical coniferous forest. Agric. For. Meteorol. 2013, 178, 152–160. [Google Scholar] [CrossRef]
  13. Rosenzweig, S.T.; Carson, M.A.; Baer, S.G.; Blair, J.M. Changes in soil properties, microbial biomass, and fluxes of C and N in soil following post-agricultural grassland restoration. Appl. Soil Ecol. 2016, 100, 186–194. [Google Scholar] [CrossRef]
  14. Jangid, K.; Williams, M.A.; Franzluebbers, A.J.; Schmidt, T.M.; Coleman, D.C.; Whitman, W.B. Land-use history has a stronger impact on soil microbial community composition than aboveground vegetation and soil properties. Soil Biol. Biochem. 2011, 43, 2184–2193. [Google Scholar] [CrossRef]
  15. Brant, J.B.; Myrold, D.D.; Sulzman, E.W. Root controls on soil microbial community composition in forest soils. Oecologia 2006, 148, 650–659. [Google Scholar] [CrossRef]
  16. Peng, M.; Jia, H.; Wang, Q. The Effect of Land Use on Bacterial Communities in Saline-Alkali Soil. Curr. Microbiol. 2017, 74, 325–333. [Google Scholar] [CrossRef]
  17. Ding, G.C.; Piceno, Y.M.; Heuer, H.; Weinert, N.; Dohrmann, A.B.; Carrillo, A.; Andersen, G.L.; Castellanos, T.; Tebbe, C.C.; Smalla, K. Changes of Soil Bacterial Diversity as a Consequence of Agricultural Land Use in a Semi-Arid Ecosystem. PLoS ONE 2013, 8, e59497. [Google Scholar] [CrossRef] [Green Version]
  18. Bissett, A.; Richardson, A.E.; Baker, G.; Thralla, P.H. Long-term land use effects on soil microbial community structure and function. Appl. Soil Ecol. 2011, 51, 66–78. [Google Scholar] [CrossRef]
  19. Acosta-Martínez, V.; Dowd, S.; Sun, Y.; Allen, V. Tag-encoded pyrosequencing analysis of bacterial diversity in a single soil type as affected by management and land use. Soil Biol. Biochem. 2008, 40, 2762–2770. [Google Scholar] [CrossRef]
  20. Da C Jesus, E.; Marsh, T.L.; Tiedje, J.M.; de S Moreira, F.M. Changes in land use alter the structure of bacterial communities in Western Amazon soils. ISME J. 2009, 3, 1004–1011. [Google Scholar] [CrossRef]
  21. Moscatelli, M.C.; Secondi, L.; Marabottini, R.; Papp, R.; Stazi, S.R.; Mania, E.; Marinari, S. Assessment of soil microbial functional diversity: Land use and soil properties affect CLPP-MicroResp and enzymes responses. Pedobiologia 2018, 66, 36–42. [Google Scholar] [CrossRef]
  22. Bossio, D.A.; Girvan, M.S.; Verchot, L.; Bullimore, J.; Borelli, T.; Albrecht, A.; Scow, K.M.; Ball, A.S.; Pretty, J.N.; Osborn, A.M. Soil Microbial Community Response to Land Use Change in an Agricultural Landscape of Western Kenya. Microb. Ecol. 2005, 49, 50–62. [Google Scholar] [CrossRef] [Green Version]
  23. Lagerlöf, J.; Adolfsson, L.; Börjesson, G.; Ehlers, K.; Vinyoles, G.P.; Sundh, I. Land-use intensification and agroforestry in the Kenyan highland: Impacts on soil microbial community composition and functional capacity. Appl. Soil Ecol. 2014, 82, 93–99. [Google Scholar] [CrossRef] [Green Version]
  24. Sun, R.; Zhang, X.X.; Guo, X.; Wang, D.; Chu, H. Bacterial diversity in soils subjected to long-term chemical fertilization can be more stably maintained with the addition of livestock manure than wheat straw. Soil Biol. Biochem. 2015, 88, 9–18. [Google Scholar] [CrossRef]
  25. Ramirez, K.S.; Lauber, C.L.; Knight, R.; Bradford, M.A.; Fierer, N. Consistent effects of nitrogen fertilization on soil bacterial communities in contrasting systems. Ecology 2010, 91, 3463–3470. [Google Scholar] [CrossRef] [PubMed]
  26. Coolon, J.D.; Jones, K.L.; Todd, T.C.; Blair, J.M.; Herman, M.A. Long-Term Nitrogen Amendment Alters the Diversity and Assemblage of Soil Bacterial Communities in Tallgrass Prairie. PLoS ONE 2013, 8, e67884. [Google Scholar] [CrossRef] [PubMed]
  27. Fan, A.; Liu, F. Seasonal variations of soil microbial biomass and its influence on soil microbial respiration in secondary forest communities in montane region of Eastern Liaoning Province. J. Northeast For. Univ. 2014, 42, 99–102. [Google Scholar]
  28. Qi, J.H. Contents of soil organic carbon and its relations with physicochemical properties of secondary natural oak forests in Eastern Mountain Area of Liaoning Province. J. Soil Water Conserv. 2017, 31, 135–140. [Google Scholar]
  29. Deng, J.J.; Yin, Y.; Luo, J.Y.; Zhu, W.X.; Zhou, Y.B. Different revegetation types alter soil physical-chemical characteristics and fungal community in the Baishilazi Nature Reserve. Peer J 2019, 6, e6251. [Google Scholar] [CrossRef] [Green Version]
  30. Deng, J.J.; Yin, Y.; Zhu, W.X.; Zhou, Y.B. Variations in soil bacterial community diversity and structures among different revegetation types. Front. Microbiol. 2018, 9, 2874. [Google Scholar] [CrossRef] [Green Version]
  31. Cassán, F.; Diaz-Zorita, M. Azospirillum sp. in current agriculture: From the laboratory to the field. Soil Biol. Biochem. 2016, 103, 117–130. [Google Scholar] [CrossRef]
  32. Roesch, L.F.; Fulthorpe, R.R.; Riva, A.; Casella, G.; Hadwin, A.K.; Kent, A.D.; Daroub, S.H.; Camargo, F.A.; Farmerie, W.G.; Triplett, E.W. Pyrosequencing enumerates and contrasts soil microbial diversity. ISME J. 2007, 1, 283–290. [Google Scholar] [CrossRef] [PubMed]
  33. Konopka, A. What is microbial community ecology? ISME J. 2009, 3, 1223–1230. [Google Scholar] [CrossRef] [PubMed] [Green Version]
  34. Fierer, N.; Jackson, R.B. The diversity and biogeography of soil bacterial communities. Proc. Natl. Acad. Sci. USA 2006, 103, 626–631. [Google Scholar] [CrossRef] [Green Version]
  35. Urbanová, M.; Šnajdr, J.; Baldrian, P. Composition of fungal and bacterial communities in forest litter and soil is largely determined by dominant trees. Soil Biol. Biochem. 2015, 84, 53–64. [Google Scholar] [CrossRef]
  36. Tian, Q.; Taniguchi, T.; Shi, W.Y.; Li, G.; Yamanaka, N.; Du, S. Land-use types and soil chemical properties influence soil microbial communities in the semiarid Loess Plateau region in China. Sci. Rep. 2017, 7, 45289. [Google Scholar] [CrossRef] [Green Version]
  37. Xiong, J.; Liu, Y.; Lin, X.; Zhang, H.; Zeng, J.; Hou, J.; Yang, Y.; Yao, T.; Knight, R.; Chu, H. Geographic distance and pH drive bacterial distribution in alkaline lake sediments across Tibetan Plateau. Environ. Microbiol. 2012, 14, 2457–2466. [Google Scholar] [CrossRef] [Green Version]
  38. Janssen, P.H. Identifying the dominant soil bacterial taxa in libraries of 16S rRNA and 16S rRNA genes. Appl. Environ. Microbiol. 2006, 72, 1719–1728. [Google Scholar] [CrossRef] [Green Version]
  39. Mander, C.; Wakelin, S.; Young, S.; Condron, L.; O’Callaghana, M. Incidence and diversity of phosphate-solubilising bacteria are linked to phosphorus status in grassland soils. Soil Biol. Biochem. 2012, 44, 93–101. [Google Scholar] [CrossRef]
  40. Huang, J.; Hu, B.; Qi, K.; Chen, W.; Pang, X.; Bao, W.; Tian, G. Effects of phosphorus addition on soil microbial biomass and community composition in a subalpine spruce plantation. Eur. J. Soil. Biol. 2016, 72, 35–41. [Google Scholar] [CrossRef]
  41. Navarrete, I.A.; Tsutsuki, K. Land-use impact on soil carbon, nitrogen, neutral sugar composition and related chemical properties in a degraded Ultisol in Leyte, Philippines. Soil Sci. Plant Nutr. 2008, 54, 321–331. [Google Scholar] [CrossRef] [Green Version]
  42. Zhang, J.; Wang, P.C.; Tian, H.M.; Xiao, Q.Q.; Jiang, H.K. Pyrosequencing-based assessment of soil microbial community structure and analysis of soil properties with vegetable planted at different years under greenhouse conditions. Soil Till. Res. 2019, 187, 1–10. [Google Scholar] [CrossRef]
  43. Sauvadet, M.; Chauvat, M.; Cluzeau, D.; Maron, P.A.; Villenave, C.; Bertrand, I. The dynamics of soil micro-food web structure and functions vary according to litter quality. Soil Biol. Biochem. 2016, 95, 262–274. [Google Scholar] [CrossRef]
  44. Ushio, M.; Wagai, R.; Balser, T.C.; Kitayama, K. Variations in the soil microbial community composition of a tropical montane forest ecosystem: Does tree species matter. Soil Biol. Biochem. 2008, 40, 2699–2702. [Google Scholar] [CrossRef]
  45. Sauheitl, L.; Glaser, B.; Dippold, M.; Leiber, K.; Weigelt, A. Amino acid fingerprint of a grassland soil reflects changes in plant species richness. Plant Soil. 2010, 334, 353–363. [Google Scholar] [CrossRef]
  46. Tripathi, B.M.; Kim, M.; Singh, D.; Lee-Cruz, L.; Lai-Hoe, A.; Ainuddin, A.N.; Go, R.; Rahim, R.A.; Husni, M.H.; Chun, J.; et al. Tropical soil bacterial communities in Malaysia: pH dominates in the equatorial tropics too. Microb. Ecol. 2012, 64, 474–484. [Google Scholar] [CrossRef] [PubMed]
  47. Shen, C.; Xiong, J.; Zhang, H.; Feng, Y.; Lin, X.; Li, X.; Liang, W.; Chu, H. Soil pH drives the spatial distribution of bacterial communities along elevation on Changbai Mountain. Soil Biol. Biochem. 2013, 57, 204–211. [Google Scholar] [CrossRef]
  48. Lauber, C.L.; Hamady, M.; Knight, R.; Fierer, N. Pyrosequencing-Based Assessment of Soil pH as a Predictor of Soil Bacterial Community Structure at the Continental Scale. Appl. Environ. Microbiol. 2009, 75, 51115120. [Google Scholar] [CrossRef] [Green Version]
  49. Hartman, W.H.; Richardson, C.J.; Vilgalys, R.; Bruland, G.L. Environmental and anthropogenic controls over bacterial communities in wetland soils. Proc. Natl. Acad. Sci. USA 2008, 105, 17842–17847. [Google Scholar] [CrossRef] [Green Version]
  50. Meng, H.; Li, K.; Nie, M.; Wan, J.R.; Quan, Z.X.; Fang, C.M.; Chen, J.K.; Gu, J.D.; Li, B. Responses of bacterial and fungal communities to an elevation gradient in a subtropical montane forest of China. Appl. Microbiol. Biotechnol. 2013, 97, 2219–2230. [Google Scholar] [CrossRef]
  51. Eichorst, S.A.; Trojan, D.; Roux, S.; Herbold, C.; Rattei, T.; Woebken, D. Genomic insights into the Acidobacteria reveal strategies for their success in terrestrial environments. Environ. Microbiol. 2018, 20, 1041–1063. [Google Scholar] [CrossRef] [PubMed] [Green Version]
  52. Araujo, J.F.; Castro, A.P.D.; Costa, M.M.; Togawa, R.C.; Júnior, G.J.; Quirino, B.F.; Bustamante, M.M.; Williamson, L.; Handelsman, J.; Krüger, R.H. Characterization of Soil Bacterial Assemblies in Brazilian Savanna-Like Vegetation Reveals Acidobacteria Dominance. Microb. Ecol. 2012, 64, 760–770. [Google Scholar] [CrossRef] [PubMed]
  53. Nemergut, D.R.; Cleveland, C.C.; Wieder, W.R.; Washenberger, C.L.; Townsendad, A.R. Plot-scale manipulations of organic matter inputs to soils correlate with shifts in microbial community composition in a lowland tropical rain forest. Soil Biol. Biochem. 2011, 42, 2153–2160. [Google Scholar] [CrossRef]
  54. Hogberg, M.; Hogberg, P.; Myrold, D. Is microbial community composition in boreal forest soils determined by pH, C-to-N ratio, the trees, or all three? Oecologia 2007, 150, 590–601. [Google Scholar] [CrossRef] [PubMed]
  55. Shen, W.S.; Lin, X.G.; Shi, W.M.; Min, J.; Gao, N.; Zhang, H.; Yin, R.; He, X. Higher rates of nitrogen fertilization decrease soil enzyme activities, microbial functional diversity and nitrification capacity in a Chinese polytunnel greenhouse vegetable land. Plant Soil. 2010, 337, 137–150. [Google Scholar] [CrossRef]
  56. Allison, S.D.; Hanson, C.A.; Treseder, K.K. Nitrogen fertilization reduces diversity and alters community structure of active fungi in boreal ecosystems. Soil Biol. Biochem. 2007, 39, 1878–1887. [Google Scholar] [CrossRef] [Green Version]
  57. Pester, M.; Maixner, F.; Berry, D.; Rattei, T.; Koch, H.; Lücker, S.; Nowka, B.; Richter, A.; Spieck, E.; Lebedeva, E.; et al. NxrB encoding the beta subunit of nitrite oxidoreductase as functional and phylogenetic marker for nitrite-oxidizing Nitrospira. Environ. Microbiol. 2014, 16, 3055–3071. [Google Scholar] [CrossRef] [Green Version]
  58. Gruberdorninger, C.; Pester, M.; Kitzinger, K.; Savio, D.F.; Loy, A.; Rattei, T.; Wagner, M.; Daims, H. Functionally relevant diversity of closely related Nitrospira in activated sludge. ISME J. 2015, 9, 643–655. [Google Scholar] [CrossRef]
Figure 1. Rarefaction curves of 16S rDNA for high throughput sequencing of bacteria from soils with different land use types. QM: Quercus mongolica; LG: Larix gmelinii; PK: Pinus koraiensis; SL: Shrubland; ZM: Zea mays.
Forests 11 00040 g001
Figure 2. Relative abundance of soil bacteria at the phylum level from soils with different land use types. Relative abundances are based on the proportional frequencies of bacterial DNA sequences that could be defined at the phylum level. QM; Quercus mongolica; LG: Larix gmelinii; PK: Pinus koraiensis; SL: Shrubland; ZM: Zea mays.
Forests 11 00040 g002
Figure 3. The LEfSe method was used to identify significant bacteria in soils with different land use types. The vertical coordinate is the taxonomic unit with significant differences between the groups, while the horizontal coordinate is a bar chart to visually show the linear discriminant analysis (LDA) displays the LDA score (log 10) of the corresponding taxonomy unit. Bar graph reports the group of samples with higher abundance corresponding to the taxonomy unit. QM; Quercus mongolica; LG: Larix gmelinii; PK: Pinus koraiensis; SL: Shrubland; ZM: Zea mays.
Forests 11 00040 g003
Figure 4. Heat map and hierarchical cluster analysis based on the relative abundances of the top 50 genera identified in the bacterial communities of the soils with different land use types. Different colors indicate the relative abundance of species in the individual samples. The samples are grouped according to their similarity, and the clustering results are arranged horizontally. Red represents the genus with higher abundance in the corresponding sample, whereas green represents the genus with lower abundance. QM; Quercus mongolica; LG: Larix gmelinii; PK: Pinus koraiensis; SL: Shrubland; ZM: Zea mays.
Forests 11 00040 g004
Figure 5. Principal component analysis (PCA) of soil microbial community composition. QM; Quercus mongolica; LG: Larix gmelinii; PK: Pinus koraiensis; SL: Shrubland; ZM: Zea mays.
Forests 11 00040 g005
Figure 6. Redundancy analysis (RDA) on soil dominant bacteria phyla (A) and soil dominant bacteria genera (B) constrained by soil variables. TC: total C; TN: total N; AN: available nitrogen.
Forests 11 00040 g006
Table 1. Information of different land use patterns.
Land Use PatternForest Age (Year)Slope (°)Stand Density (ind·hm−2)Crown DensityMean DBH (cm)Herb CoverageMain Herb Under the Forest
QM6132235790%20.1860%Vicia unijuga, Gueldenstaedtia verna, Atractylodes Lancea, Schisandra chinensis, Asparagus oligoclonos, Corylus mandshurica, Celastrus orbiculatus, Lespedeza bicolor
LG2836210080%12.6890%Rubus crataegifolius, Rubus idaeus, Asparagus oligoclonos, Schisandra chinensis, Athyrium brevifrons, Menispermum dauricum
PK6127180070%21.9430%Polygonatum odoratum, Vitis amurensis, Athyrium brevifrons, Menispermum dauricum, Vicia unijuga, Asparagus oligoclonos, Gueldenstaedtia verna, Atractylodes Lancea, Schisandra chinensis, Asparagus oligoclonos
SL 32 70% 60%Rubus crataegifolius, Schisandra chinensis, Rubus idaeus, Asparagus oligoclonos, Atractylodes lancea, Athyrium brevifrons, Menispermum dauricum
ZM 323333
Note: QM: Quercus mongolica, SL: shrubland, LG: Larix gmelinii, PK: Pinus koraiensis; ZM: Zea mays.
Table 2. Chemical soil characteristics under different land use patterns.
Land Use PatternpHTotal C (g·kg−1)Total N (g·kg−1)C/N RatioAN (mg·kg−1)NH4+−N (mg·kg−1)NO3N (mg·kg−1)
QM5.99 ± 0.15ab57.74 ± 15.68 a4.40 ± 1.11 a13.09 ± 0.39 a33.63 ± 7.19 a4.42 ± 0.50 b17.09 ± 3.69 ab
LG5.57 ± 0.24c52.24 ± 3.36 ab3.89 ± 0.27 a13.43 ± 0.20 a32.05 ± 3.61 a6.33 ± 1.44 a26.44 ± 9.88 a
PK5.54 ± 0.11c20.08 ± 4.01 c1.53 ± 0.32 c13.24 ± 1.88 a12.96 ± 2.56 c7.68 ± 1.45 a24.17 ± 2.81 a
SL6.29 ± 0.16a38.27 ± 5.49 b2.79 ± 0.42 b13.71 ± 0.31 a23.50 ± 5.87 b3.78 ± 0.15 b9.58 ± 0.68 b
ZM5.85 ± 0.16bc17.46 ± 2.33 c1.31 ± 0.20 c13.39 ± 0.28 a11.90 ± 1.33 c3.94 ± 0.77 b19.53 ± 6.47 ab
Note: Data are means ± standard error (n = 3). Different lowercase letters in each column indicate a significant difference at the p < 0.05 level. QM: Quercus mongolica; LG: Larix gmelinii, PK: Pinus koraiensis; SL: shrubland; ZM: Zea mays.
Table 3. Soil bacterial diversity indices of soils with different land use types.
Stand TypeNo. of SequencesOTU Number(P)Shannon IndexChao1 IndexACE IndexSimpson Index
QM60,77829409.37 ± 0.06 b2863.65 ± 187.86 b2958.54 ± 266.53 b0.9923 ± 0.0007 c
LG58,098277310.04 ± 0.13 a3321.32 ± 275.92 a3548.18 ± 311.62 a0.9964 ± 0.0008 ab
PK63,395241810.00 ± 0.09 a3288.14 ± 109.13 ab3495.91 ± 135.43 a0.9967 ± 0.0004 a
SL63,67128719.79 ± 0.19 a3172.18 ± 333.52 ab3385.38 ± 366.98 ab0.9953 ± 0.0007 ab
ZM57,09519659.37 ± 0.36 b2072.43 ± 265.19 c2114.55 ± 292.22 c0.9949 ± 0.0014 b
Note: Different lowercase letters within each column indicate a significant difference at p < 0.05. A 3% distance cutoff was used to define OTUs. QM: Quercus mongolica; LG: Larix gmelinii; PK: Pinus koraiensis; SL: Shrubland; ZM: Zea mays. Data are means ± standard error (n = 3).
Table 4. Pearson correlations between soil bacterial diversity indices and available edaphic factors.
pHTCTNC/NANNH4+−NNO3−N
Simpson0.688 **0.593 *0.583 *0.0710.585 *−0.723 **−0.484
Chao10.1400.686 **0.683 **0.0430.691 **0.147−0.229
ACE0.1420.710 **0.703 **0.1050.716 **0.139−0.224
Shannon0.5130.729 **0.724 **0.0510.727 **−0.316−0.386
Note: ** correlation significant at the 0.01 level (two-tailed); * correlation significant at the 0.05 level (two-tailed).
Table 5. Correlation coefficients between dominant bacteria groups and available edaphic factors.
Bacteria GrouppHTCTNANC/NNH4+–NNO3–N
Phylum
Proteobacteria−0.1710.3410.3520.299−0.1050.515 *0.016
Actinobacteria0.1200.0610.0590.1190.005−0.4710.075
Acidobacteria0.1080.2360.2420.198–0.1030.366−0.161
Chloroflexi−0.129−0.491−0.518 *−0.4420.3340.2960.137
Gemmatimonadetes−0.281−0.712 **−0.714 **−0.680 **0.0710.0200.199
Verrucomicrobia0.3350.612 *0.612 *0.590 *−0.063−0.1840.060
Bacteroidetes0.4010.676 **0.676 **0.622 **0.002−0.456−0.434
Planctomycetes0.221−0.180−0.142−0.276−0.486−0.106−0.318
Saccharibacteria−0.218−0.501−0.496−0.511−0.035−0.203−0.079
Nitrospirae0.4150.590 *0.548 *0.582 *0.473−0.174−0.033
Genus
Nitrobacter−0.4730.0190.0320.024–0.1240.806 **0.414
Gemmatimonas−0.196−0.565 *−0.558 *−0.549 *–0.041−0.1560.099
Sphingomonas0.176−0.420−0.416−0.433−0.019−0.493−0.276
Rhodoplanes0.2320.4910.4690.514 *0.2110.168−0.300
Variibacter−0.521 *0.0340.0410.048−0.0410.800 **0.341
RB410.522 *0.527 *0.521 *0.526 *0.064−0.213−0.506
Pseudolabrys−0.739 **−0.270−0.259−0.276−0.1210.807 **0.638 **
Mycobacterium−0.4860.0320.0320.053−0.0190.670 **0.431
Actinoplanes0.643 **0.0210.0140.0550.111−0.723 **−0.603 *
Solirubrobacter0.622 *0.5070.4990.537 *0.087−0.506−0.374
Haliangium−0.2370.5140.5110.532 *−0.0410.1890.213
Candidatus-Solibacter−0.632 *−0.394−0.356−0.409−0.4780.722 **0.481
Pseudonocardia0.568 *0.5110.4950.559 *0.138−0.490−0.460
Note: TC: total carbon; TN: total nitrogen; AN: available N. ** correlation significant at the 0.01 level (two-tailed); * correlation significant at the 0.05 level (two-tailed).

