Review

Kinetics of Water Vapor Sorption in Wood Cell Walls: State of the Art and Research Needs

by
Emil Engelund Thybring
1,*,
Samuel V. Glass
2 and
Samuel L. Zelinka
2
1
Department of Geosciences and Natural Resource Management, University of Copenhagen, DK 1958 Fredriksberg C, Denmark
2
Building and Fire Sciences, US Forest Service Forest Products Laboratory, Madison, WI 53726, USA
*
Author to whom correspondence should be addressed.
Forests 2019, 10(8), 704; https://doi.org/10.3390/f10080704
Submission received: 1 August 2019 / Revised: 12 August 2019 / Accepted: 15 August 2019 / Published: 20 August 2019
(This article belongs to the Special Issue Wood-Moisture Relations)

Abstract

:
Water vapor sorption is the most fundamental aspect of wood-moisture relations. It is directly or indirectly related to the physical properties of wood and the onset of wood-damage mechanisms. While sorption properties of cellulosic materials have been utilized since antiquity, the time-dependent transition from one moisture content to another (i.e., sorption kinetics) has received much less attention. In this critical review, we present the state-of-the-art of water vapor sorption kinetics in wood. We first examine different experimental methods that have been used to measure sorption kinetics, from the quartz helix vacuum balance beginning in earnest in the 1930s, to automated sorption balances used recently. We then give an overview of experimental observations and describe the physical phenomena that occur during the sorption process, which potentially govern the following kinetics: boundary layer mass transfer resistance, heat of sorption, cell wall diffusion, swelling, and polymer mobility. Finally, we evaluate theoretical models that have been proposed for describing sorption kinetics, considering both experimental data and the physical processes described in the previous section. It is clear that no previously developed model can phenomenologically describe the sorption process. Instead, new models are needed. We conclude that the development of new models will require more than simple gravimetric measurements. In addition to mass changes, complementary techniques are needed to probe other important physical quantities on multiple length scales.

1. Introduction

As a building material, wood is unique in that its strength and stiffness, and even its dimensions, are strongly dependent on moisture. This stems from the fact that wood is a natural material, and its cell walls consist primarily of hygroscopic polymers. While wood has been successfully used as a building material for millennia, understanding and tailoring its interactions with water are necessary for its utilization in high performance buildings being constructed today. For example, small dimensional changes caused by moisture are of little consequence in single story dwellings but have a much larger effect on high-rise mass timber buildings which have been constructed in the past decade [1,2,3].
While properly designing with wood requires a full understanding of many different aspects of the effects of moisture on wood’s properties, the most fundamental process upon which the other properties depend is water vapor sorption. Water exists in the following different states (or phases): solid (ice), liquid water, and water vapor. Water within a hygroscopic material such as wood can also exist in the sorbed state, where water molecules are energetically bound to wood polymers through hydrogen bonds or other intermolecular attractions. Throughout this paper, we use the term “moisture” to describe water in any of these states. The “moisture content” of the wood is calculated as the ratio of the total mass of moisture in the wood to the mass of the dry wood; it is not a weight fraction of moisture, and therefore moisture contents of over 100% are possible. “Sorption” refers to the change in phase of a water molecule from the vapor phase to a condensed phase in wood (or vice versa). The sorption process involves the creation or disruption of strong intermolecular attractions between the water molecule and wood polymer(s) or other water molecule(s). Given this definition of sorption, “absorption” is the process by which water molecules move from the vapor phase to water associated with the wood polymers and “desorption” is the process by which absorbed moisture moves into the vapor phase. It should be noted that in much of the wood science literature, the absorption of water vapor is often referred to as “adsorption”. However, given the IUPAC (International Union of Pure and Applied Chemistry) definitions for these terms, the sorption process in wood, whereby water molecules are taken up in the bulk of the cell walls and in the capillary structure, most closely resembles absorption, whereas, adsorption strictly refers to processes at an interface [4].
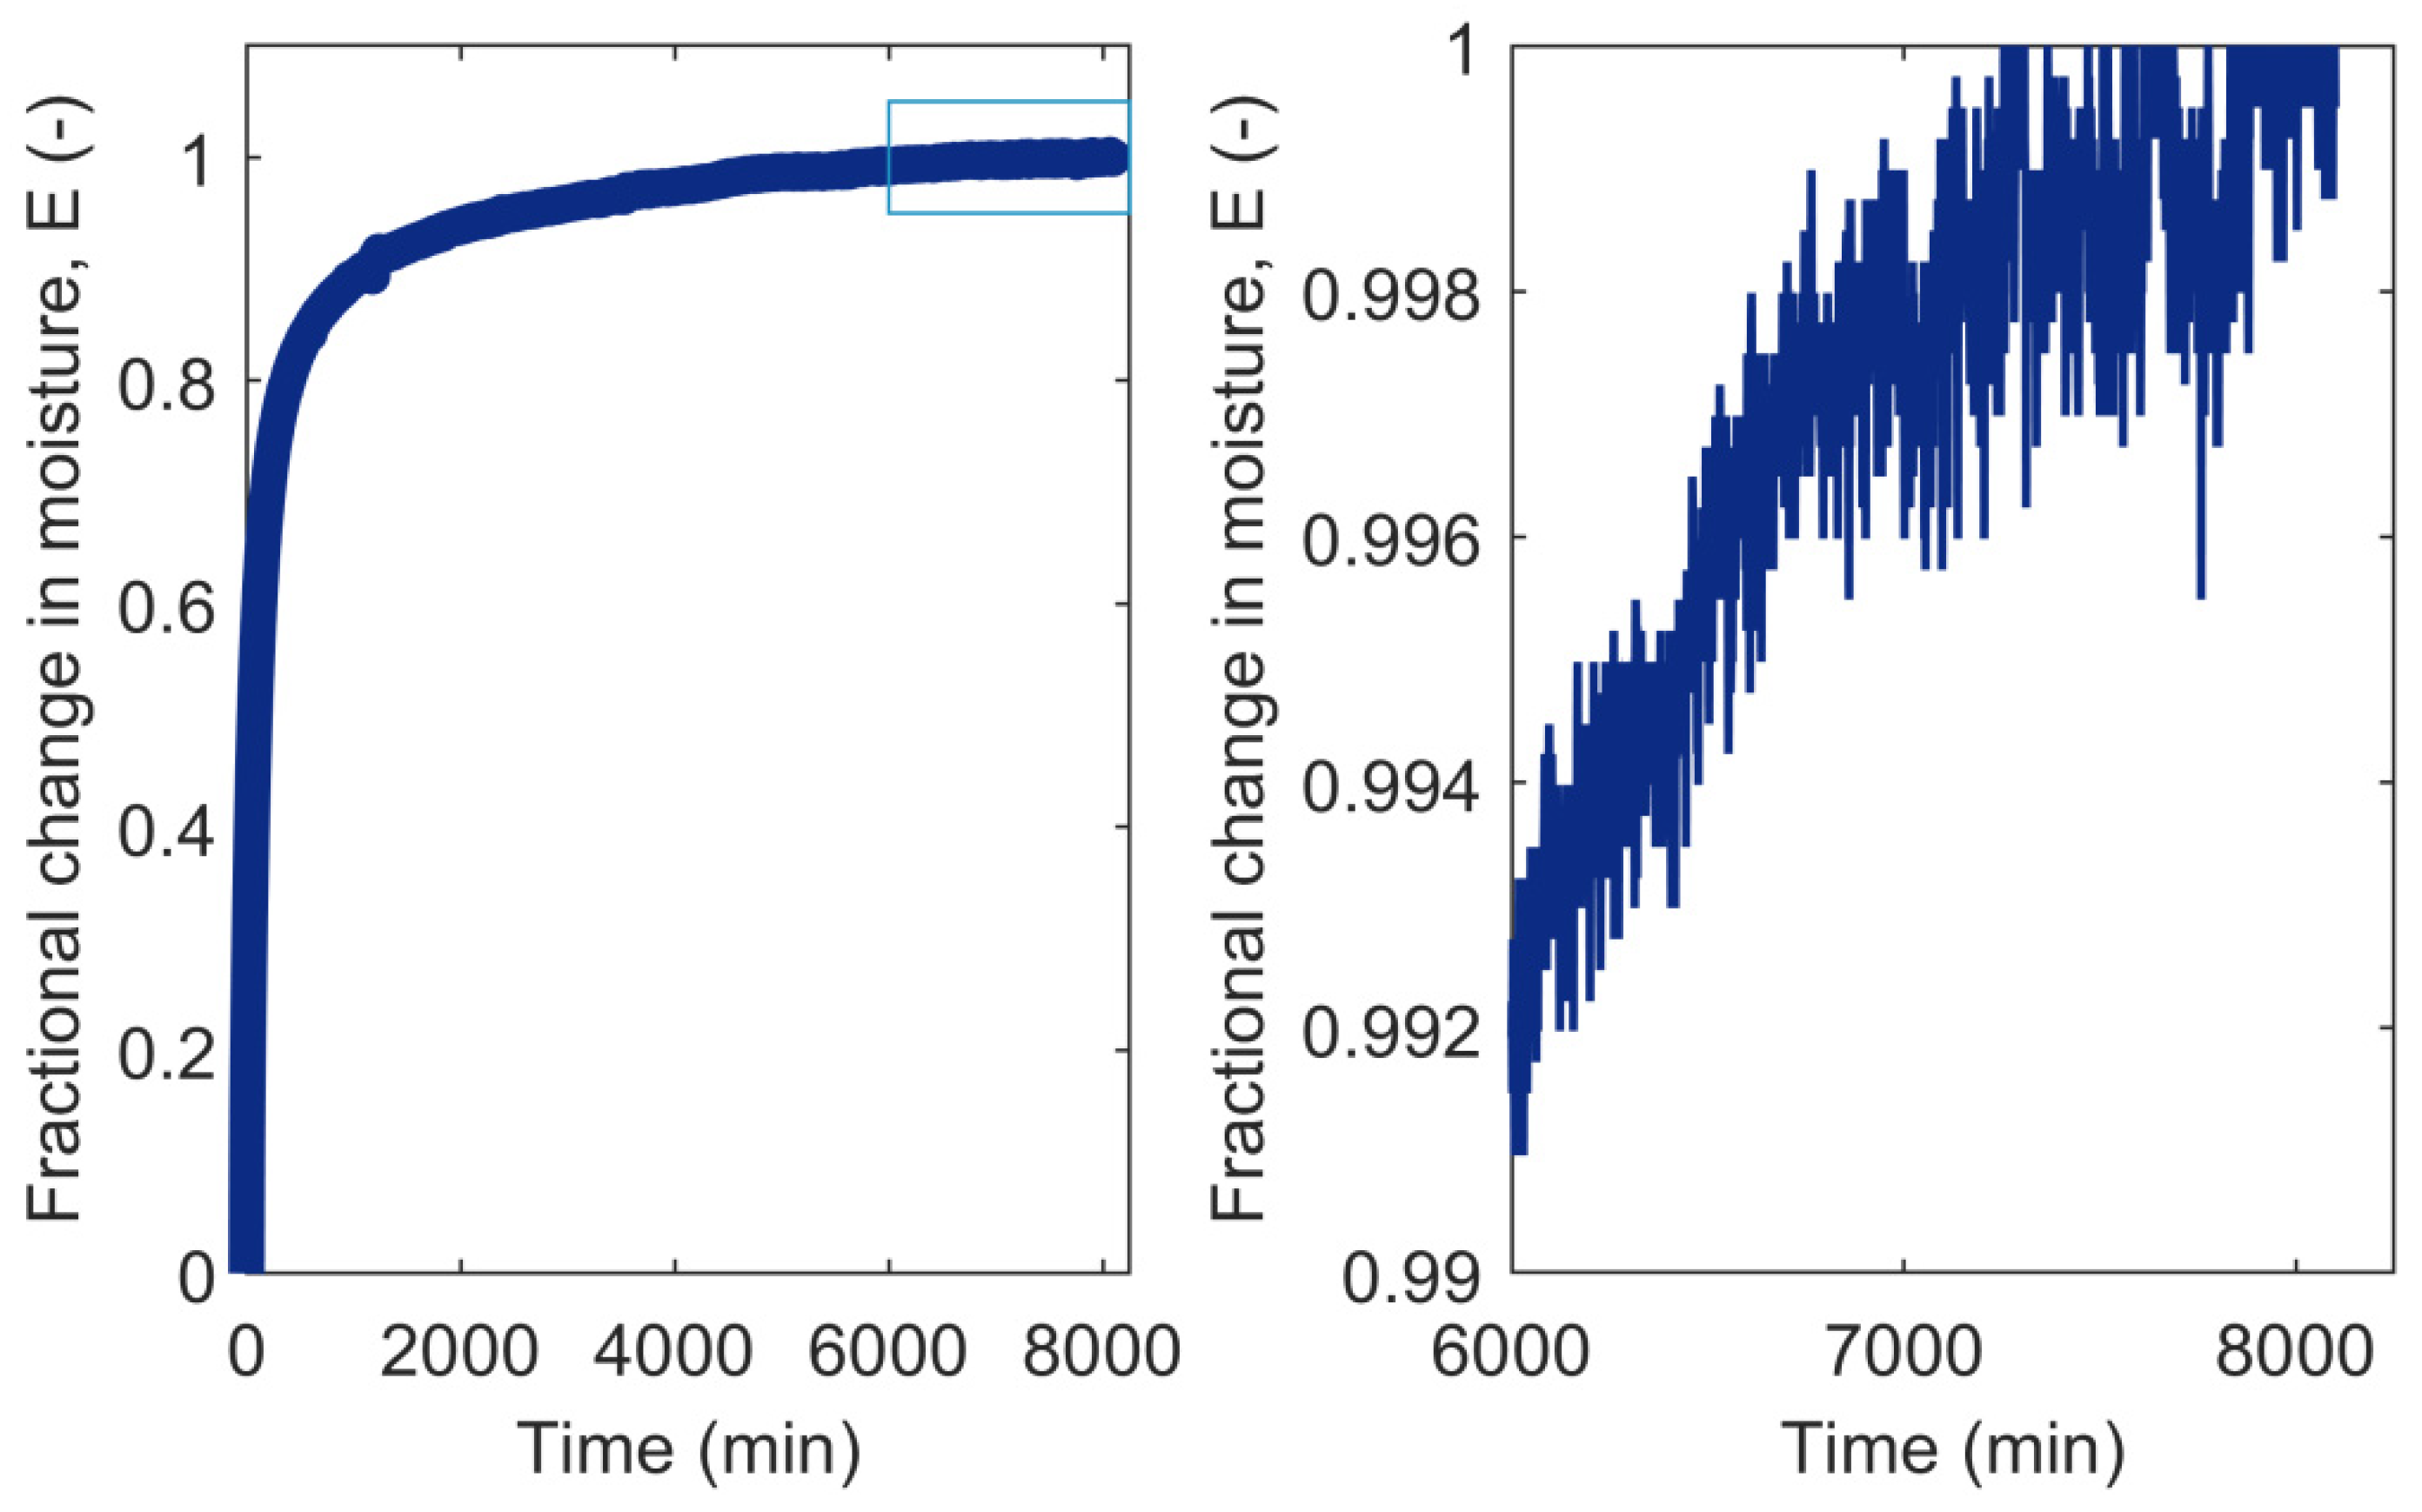
The “water vapor sorption isotherm” (or often simply “sorption isotherm” in this context) is the locus of points that describe the relationship between the relative humidity (RH) of the environment and the total amount of moisture in wood at equilibrium at constant temperature. For sorption isotherms, “equilibrium” can be thought of in reference to kinetic theory, where rates of absorption and desorption are identical and there is no net change in mass. This is not a true thermodynamic equilibrium because sorption isotherms are hysteretic, that is, at a given constant RH and temperature, the equilibrium moisture content (EMC) upon desorption from a higher moisture content is greater than the EMC upon absorption from a lower moisture content [5,6]. While the sorption isotherm describes the “equilibrium” relationship between wood moisture content and the environment, many different states are possible under nonequilibrium conditions during the absorption and desorption processes [7]. “Sorption kinetics” describes the change in moisture content over time in the approach to equilibrium. An example of absorption kinetics is shown in Figure 1, the mass (and thus moisture content) of a specimen is measured at a series of points in time before and after a change in RH of the surrounding atmosphere until equilibrium is reached.
A convenient way of expressing the rate of water vapor sorption is plotting the fraction of the total change in moisture content, E(t), as a function of time or the square root of time. E(t) is calculated as:
E ( t ) = M ( t ) M 0 M M 0
where, M(t) (g g−1) is the moisture content at time t (s), M0 (g g−1) is the initial moisture content at t = 0, and M (g g−1) is the moisture content at equilibrium. The correct values of E(t), therefore, require that equilibrium has in fact been reached. An example is shown in Figure 2.
This paper provides a state-of-the-art review of water vapor sorption kinetics in wood, highlights gaps in our understanding, and proposes directions for future research. The review is especially pertinent given the increasing number of papers on sorption kinetics that have arisen from the adoption of automated sorption balances worldwide. Furthermore, the seminal books on wood–moisture relations [9,10,11] address only Fickian diffusion models, which we later show are contradicted by experimental data. We begin this article with an overview of the different types of experimental methods and their advantages and limitations. Next, we review the major experimental observations on sorption kinetics in wood. Then, we discuss the physical phenomena responsible for limiting the rates of water vapor absorption and desorption. Finally, we evaluate existing models and highlight the complexities that need to be addressed in future research to improve the understanding of sorption kinetics in wood and lay the foundation for fruitful modeling.

2. Overview of Experimental Methods for Determining Sorption Kinetics

Sorption phenomena have been studied since antiquity [12]. Today, sorption measurements are most commonly done gravimetrically, as has been done for more than 500 years [12]. Gravimetric methods for water vapor sorption in wood have been broadly reviewed previously [4]. This article focuses on methods most relevant to sorption kinetics. While studies focusing on the equilibrium moisture content do not necessarily report kinetic data, the more informative kinetic measurements have monitored the full sorption process to equilibrium.
The experimental methods described in the following sections are classified primarily by the way the atmosphere is controlled, although the methods may also differ in other regards. For each type of experimental apparatus, we summarize advantages and limitations, such as weighing method and accuracy, whether weighing is manual or automated, whether it is done in situ or ex situ, the number of specimens that can be monitored concurrently, the method of RH control, and the stability of RH and temperature. Methods that report measured changes in specimen temperature during absorption or desorption are noted.

2.1. Conditioning Chamber

A variety of conditioning chambers have been used for the measurement of water vapor sorption in wood. This technique typically involves multiple specimens placed inside a chamber with a large volume of circulated air. Humidity is typically regulated by use of aqueous solutions, by mixing dry and vapor-saturated air, or by controlling the dew point temperature independently of the specimen temperature. Conditioning chambers have been used for the measurement of sorption isotherms since 1920 [13,14]. A number of studies have described conditioning chambers that allowed for in situ weighing of specimens and various additional features, but did not focus on sorption kinetics, e.g., [15,16,17,18].
Conventional conditioning chambers were used in many studies during the 1960s and 70s for investigating absorption or desorption rates. In many cases, specimens were weighed manually ex situ with an electronic balance [19]. In some cases, however, the chambers were configured for in situ weighing, e.g., [20,21,22]. Air velocity, which affects the external mass transfer coefficient, was reported to be between 1.9 m/s [22] and 3.4 m/s [21]. A limitation of the method is appreciable humidity oscillation. In one study where the chamber was modified for improved stability, the variation was reported as ±1% RH [19].
Several unconventional chambers designed for sorption kinetic measurements were reported in the 1990s. Two of these were based on RH control using saturated salt solutions. They could accommodate a large number of specimens that were manually weighed in situ with an electronic balance to ±1 mg [23,24]. The air in the chamber was circulated with fans. Temperature and RH stability were dependent on the chamber being located in a room maintained at constant temperature.
Two other chambers described in the 1990s featured automated in situ weighing of specimens [24,25]. The chamber described by Time [24] regulated the RH by flowing air through a saturation column at a certain temperature. The vapor-saturated air was then heated and directed into the chamber at a velocity of 0.1–0.3 m/s, where a single specimen was continuously weighed with a load cell. The temperature and RH stability were reportedly poor. The two-pressure apparatus described by Håkansson [25] regulated the RH by keeping the specimen chamber at atmospheric pressure while bleeding in vapor-saturated air from a separate chamber held at higher pressure and temperature. The air entering the chamber passed through a nozzle directed towards the specimen. This flow was diverted during weighing. Specimens were suspended from a thin wire connected to an electronic balance (0.1 mg precision) located above the chamber. The mass drift was estimated to be about 3 mg over a month, corresponding to a change of 0.04% moisture content.
Eitelberger and Svensson [26] developed a method whereby a thin transverse section of wood was mounted to the top of a stainless-steel cup, which was then placed inside a conditioning chamber. A data logger was placed inside the cup to measure temperature and RH to track transfer through the specimen. Periodic weighing within the conditioning chamber was done to track moisture uptake. The external mass transfer coefficient was measured in a separate experiment. Limitations of the method were the long time needed to establish a new RH level (1000–1500 s) and significant RH oscillations in the chamber (maximally ±1%).

2.2. Desiccator with Aqueous Solution

This technique uses a sealed desiccator (or jar) containing an aqueous solution that regulates the RH, with the specimen(s) held above the solution. The solution may be sulfuric acid or a saturated salt solution. The desiccator is placed in a temperature-controlled environment. This method was used as early as 1930 [27,28] with aqueous saturated salt solutions. The method typically involves removing specimens from the desiccator for periodic weighing. Several groups, however, have developed techniques for in situ weighing, e.g., [29,30,31].
A multitude of studies have used this method for measurements of equilibrium moisture content in wood, and it has been standardized for building materials in general (ASTM C1498-04a (2016), ISO 12571:2013). A wide range of RH levels can be attained using saturated salt solutions [32], and multiple specimens can be run simultaneously. However, considering the difficulty involved in separating the diffusion of water vapor through still air from the sorption process within the wood cell walls, this method has rarely been used for measurements of sorption kinetics. Another limitation is that the method is quite labor intensive.

2.3. Quartz Helix Vacuum Balance

Early vacuum balances were assembled with custom glassware connected to a vacuum pump [33]. Specimens were suspended from quartz helical springs inside glass tubes, and the mass was indicated by elongation of the spring. The apparatus was evacuated, the specimen dry mass was determined, the specimens were closed off from the vacuum pump, and water vapor was then introduced at a given pressure.
Pidgeon and Maass [34,35] were the first to publish sorption measurements for wood using an evacuated glass system. Three specimens could be weighed in situ concurrently. Vapor pressure was controlled by chilling a water flask, thus regulating the saturation vapor pressure, while independently maintaining the rest of the system at a constant temperature. A rapid change in vapor pressure was accomplished by closing the valve to the water flask, changing the temperature of the water bath, waiting for stability, and then opening the valve. The same principle of regulating water vapor pressure by separately controlling the temperature of a water flask was reported by Stamm and Woodruff [36], who increased the number of specimen tubes to six.
Subsequently, aqueous solutions were used to regulate water vapor pressure based on solute concentration. This allowed the aqueous solution to be maintained at the same temperature as the rest of the apparatus. A number of papers have reported on the use of sulfuric acid solutions [37,38,39,40,41], while several others used saturated salt solutions [42,43,44]. Measured changes in specimen temperature during the sorption process were reported by Christensen and Kelsey [38] and Kelly and Hart [43], Section 3.4 and Section 4.2.
Advantages of the vacuum sorption apparatus include the following: mass measurements are made in situ, so the specimen is not disturbed, and multiple specimens can be monitored in parallel; vapor pressure can be changed rapidly and then maintained at a stable value; vapor pressure stability is dependent on temperature stability, which has been reported to range from ±0.01 °C [34,35] to ±0.1 °C [43]; and the sorption process is not limited by external diffusion of water vapor through air because the system is evacuated. The main limitation is that the method is rather labor intensive. An additional limitation is mass resolution. A number of papers report measurement uncertainty of ±0.1% of dry mass [34,37,42,44]. Christensen [39], however, gives an equilibrium criterion of not more than ±0.02% moisture content change over 24 h. The mass resolution depends on the spring constant of the quartz helix and the accuracy with which elongation can be measured. Quartz helices are also sensitive to temperature fluctuations.

2.4. Automated Vacuum Balance

Automated vacuum balances were developed in the 1960s and 70s [45,46], and several papers in the 1980s describe computer-automated systems [47,48,49,50]. These systems used an electronic microbalance instead of a quartz helical spring, which allowed for automated data acquisition and greater accuracy. This technique thus overcomes the limitations discussed in Section 2.3. To date, however, only two studies have used an automated vacuum balance for moisture sorption in wood, and both reported apparent equilibrium moisture content but no kinetic data [51,52].

2.5. Automated Continuous-Flow Sorption Balance

Automated sorption balances were developed in the 1990s for measurements at atmospheric pressure using a continuous flow of vapor in an inert carrier gas [53,54,55]. This technique is commonly known as dynamic vapor sorption (DVS). Instruments of this type have been used extensively in wood research laboratories in the last decade, both for measuring sorption isotherms and for studying sorption kinetics.
A specimen with mass typically in the milligram range is suspended from a microbalance along with a reference (or counterweight). The specimen is located in a chamber maintained at constant temperature, and the RH is controlled by mixing dry and vapor-saturated streams of carrier gas (such as nitrogen) in the desired ratio using mass flow controllers. Advantages of this method are automated operation, in situ weighing with high sensitivity, stable temperature and humidity conditions, and the capability to rapidly change RH. One limitation is that many instruments of this type allow for monitoring of one specimen at a time, although some are capable of monitoring multiple specimens sequentially in the same instrument [56]. Another consideration is that the kinetics may be affected by the external mass transfer resistance in the gas phase around the specimen. Thorell and Wadsö [57] reported a gas velocity of about 2 mm/s in an instrument of this type and experimentally determined the external mass transfer resistance. They also measured an appreciable reduction in specimen temperature from evaporative cooling.
An important aspect of using automated sorption balances are the instrument settings used to define when the humidity should be changed. In many studies, the aim is to determine sorption isotherms which require that the moisture content of the specimen is in equilibrium with the various levels of RH. Automated operation, thus, depends on a definition of equilibrium by preset parameters in the electronic control system. Most often a mass stability criterion is used, meaning that the moisture content is assumed to be close enough to equilibrium when the mass change over a certain period of time falls below a specified threshold. Such a definition of equilibrium is commonly used in standardized methods for building materials. However, the mass stability threshold commonly defined in automated sorption balances of 20 µg g−1 min−1 over a period of 10 min has been shown [8] to result in moisture contents being farther away from the equilibrium value than often assumed. Thus, Glass et al. [8] found deviations greater than 1% moisture content and instead suggested a stricter mass stability criterion of 3 µg g−1 min−1 over a period of 2 h. Equilibrium was defined by Glass et al. as a mass change rate corresponding to the inherent mass stability of the instrument (2 µg over a period of 24 h).

3. Summary of Main Experimental Observations on Sorption Kinetics

Experimental results have often been reported in terms of the fractional change in moisture content, E(t) (see Equation (1) and Figure 2). In this section we summarize sorption kinetic measurements for different types of specimens (Section 3.1), different RH conditions (Section 3.2), and absorption versus desorption (Section 3.3). Temperature changes associated with the sorption process are discussed in Section 3.4. Section 3 focuses on the reported experimental observations, while the physical phenomena responsible for limiting the rate of sorption are discussed at length in Section 4.

3.1. Wood Species, Anatomy, and Specimen Geometry

Several studies using vacuum sorption balances have investigated the effects of sapwood versus heartwood, specimen thickness, and specimen orientation for various wood species. Pidgeon and Maass [34,35] used softwood specimens with a thickness of 1.5 mm in the longitudinal (L) direction, such that all axial tracheids were cut through at least once, and thus all cell wall surfaces were directly accessible to water vapor. At this thickness they found that the rate of sorption was the same (within sample variability) for spruce sapwood and heartwood specimens. Pidgeon and Maass [34,35] also mentioned that finely ground wood meal gave the same rate of sorption as 1.5 mm (L) thick specimens, though no supporting data was provided. Pidgeon and Maass [35] compared the rate of absorption from an initially dry condition to equilibrium at about 5% moisture content for sapwood and heartwood of spruce (Picea glauca (Moench) Voss) and pine (Pinus banksiana Lamb.) of different thickness in the longitudinal direction and found that the rate decreased as thickness increased (1.5 mm, 5 mm, 9 mm, and 14 mm). Specimens with a radial (R) dimension of 6.5 mm had considerably slower sorption than any of the longitudinal specimens, and sorption was slower in heartwood than in sapwood in the radial direction for spruce and pine.
Christensen [39] and Christensen and Kelsey [38] did not find appreciable differences in the rate of absorption for klinki pine (Araucaria klinkii Lauterb.) specimens with thicknesses of 1 mm in the tangential direction or 1 mm in the longitudinal direction using a vacuum sorption balance. Furthermore, the rate of sorption for 20 µm thick microtomed sections was only marginally faster than for the 1 mm thick specimens. Sorption rates were additionally found to be the same for microtomed sections of two different species with greatly different density and cell wall thickness, balsa (Ochroma sp.) (typically 1 µm cell wall) and satinbox (Nematolepis squamea Labill. Paul G. Wilson) (typically 4 µm cell wall) [58]. In contrast, Christensen [40] did observe differences in the rate of absorption for heartwood of mountain ash (Eucalyptus regnans F. Muell.) with varying tangential dimensions of 20 µm, 180 µm, 1 mm, and 3 mm (in all cases 10 mm in the R and L directions). Differences in the rate of absorption were considerable at low RH (about 100 times faster in 20 µm specimens than in 3 mm specimens) but differences in rate were not appreciable at high RH, indicating that diffusion through the wood structure limited the rate of sorption in thicker specimens at low RH but not at high RH.
Kelly and Hart [43] investigated the effect of specimen surface area for 1 mm (L) thick specimens of yellow poplar (Liriodendron tulipifera L.) sapwood and white oak (Quercus alba L.) heartwood with a vacuum sorption balance. Specimens were composed of multiple slices to give the desired total mass, and were either combined into one bundle, with adjacent slices in intimate contact (but not close enough to hinder movement of water molecules in the vapor phase), or into two bundles, which gave a higher surface area. They found that the two-bundle specimens had a faster initial rate of sorption in 13 out of 14 cases. They also measured temperature changes during absorption and desorption and found that for the same RH step the absolute value of the maximum temperature change was less for the two-bundle specimens than the one-bundle specimens. Temperature changes are discussed further in Section 3.4.
A number of studies have used conditioning chambers to investigate rates of sorption in wood specimens having dimensions large enough to prohibit direct access of water vapor to all cell wall surfaces. The effective diffusion coefficients determined from time-dependent sorption measurements have been found to be considerably smaller than those determined under steady-state conditions, e.g., [19,20,59]. These measurements, thus, support findings discussed above indicating that processes other than diffusion limit the rate of sorption under certain conditions.
In the following sections we focus on experimental findings for sorption rates within the cell wall. We thus include only those studies that used specimens cut to allow all cell wall surfaces direct access to water vapor.

3.2. RH Level, RH Step Size, and Conditioning Time

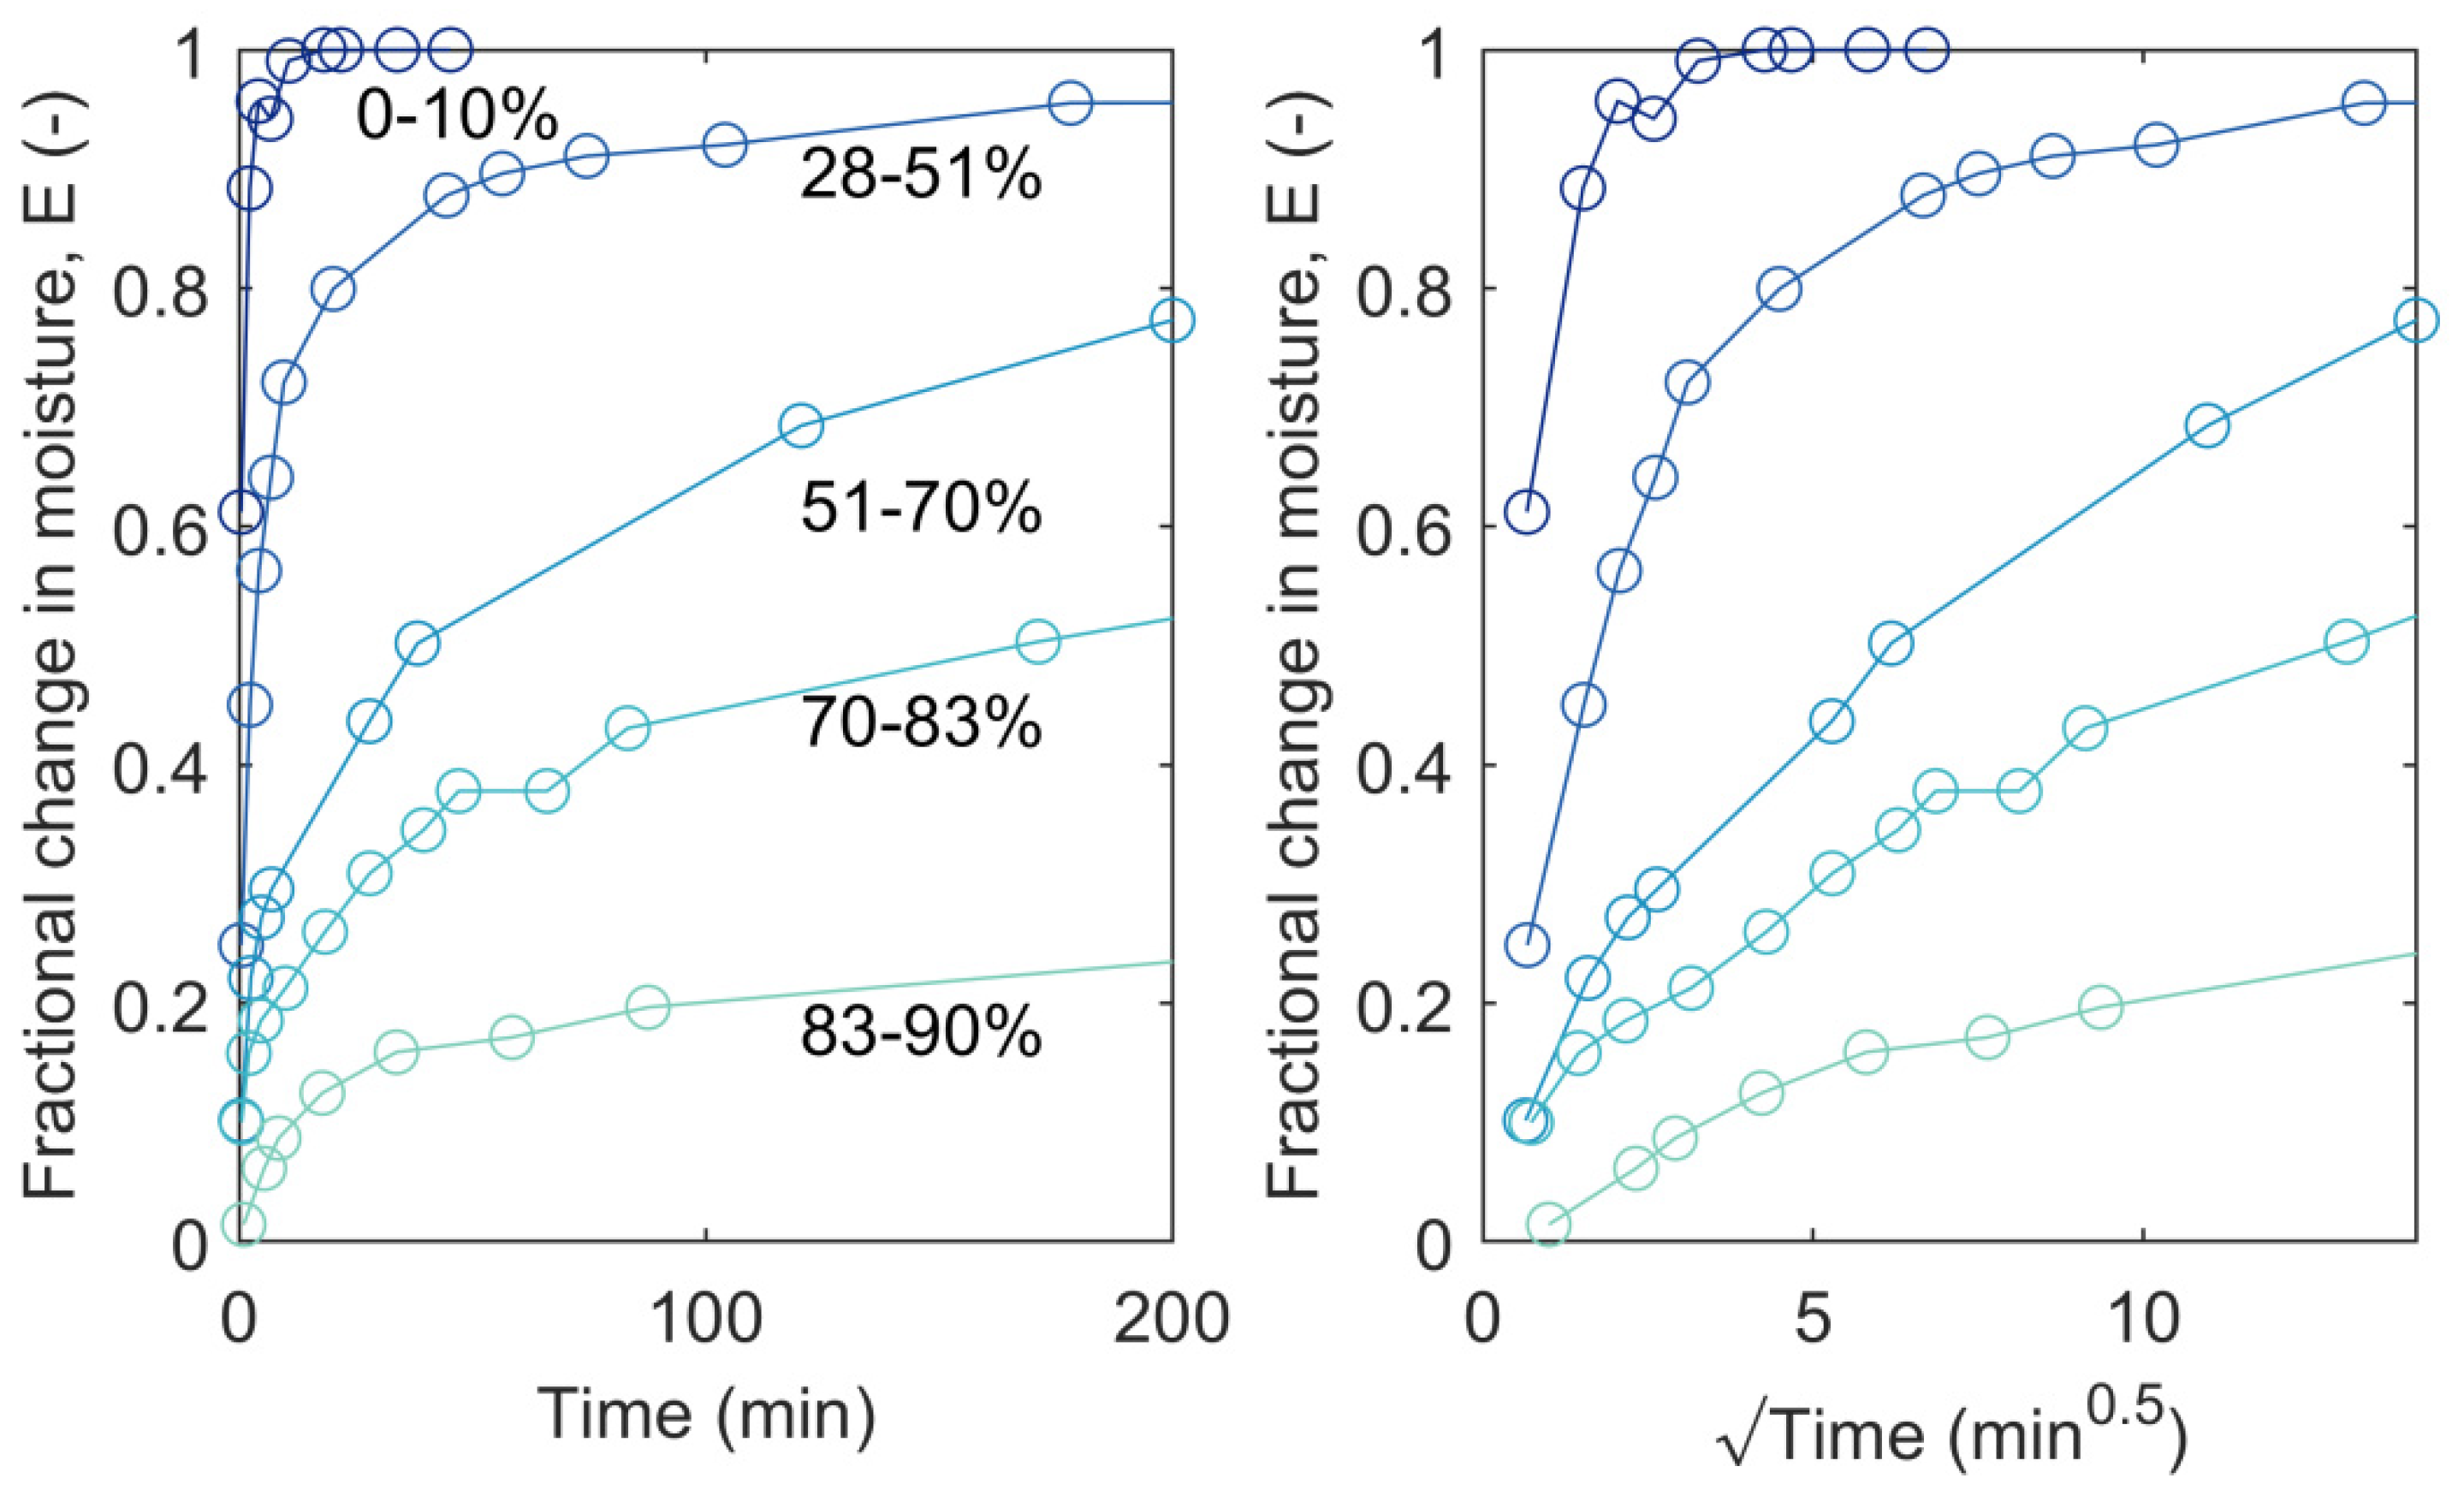
Sorption kinetics depends on the RH and time for conditioning prior to changing the RH as well as the RH increment. Christensen [38,39,40] found that the rate of absorption in klinki pine (Araucaria klinkii Lauterb.) was progressively slower for RH steps starting from increasing RH values, as shown in Figure 3. In other words, the rate of absorption for successive moisture increments over different ranges decreased as the value of the initial moisture content increased. In addition, starting from the dry condition, the rate of absorption was similar for small RH steps and large RH steps when comparing time to reach a certain E(t) value. However, for other starting RH values, the rate of absorption for a smaller RH increment was slower than for a larger RH increment.
The time of conditioning at 53% RH prior to changing the RH was found by Christensen and Hergt [60] to affect the rate of absorption. A longer conditioning time resulted in slower sorption kinetics when the RH was changed to either 69% RH or 80% RH.
Not only sorption kinetics but also the final equilibrium was found to depend on the RH increment, with a larger RH increment leading to a slightly higher equilibrium moisture content at the same final RH [39,40,43].

3.3. Absorption Versus Desorption

Surprisingly few studies report the rate of desorption of thin specimens of wood. While Christensen [39] mentioned that desorption experiments had been initiated, the results of these experiments appear not to have been published. Kelly and Hart [43] compared the rate of absorption and desorption and found that the latter process reached E = 0.5 faster for a given RH increment in 25 out of 30 cases; the other five differed only slightly. The difference between the rates of absorption and desorption was especially pronounced in RH steps above 54% RH and was generally quite small at a lower RH.

3.4. Temperature Changes During Sorption

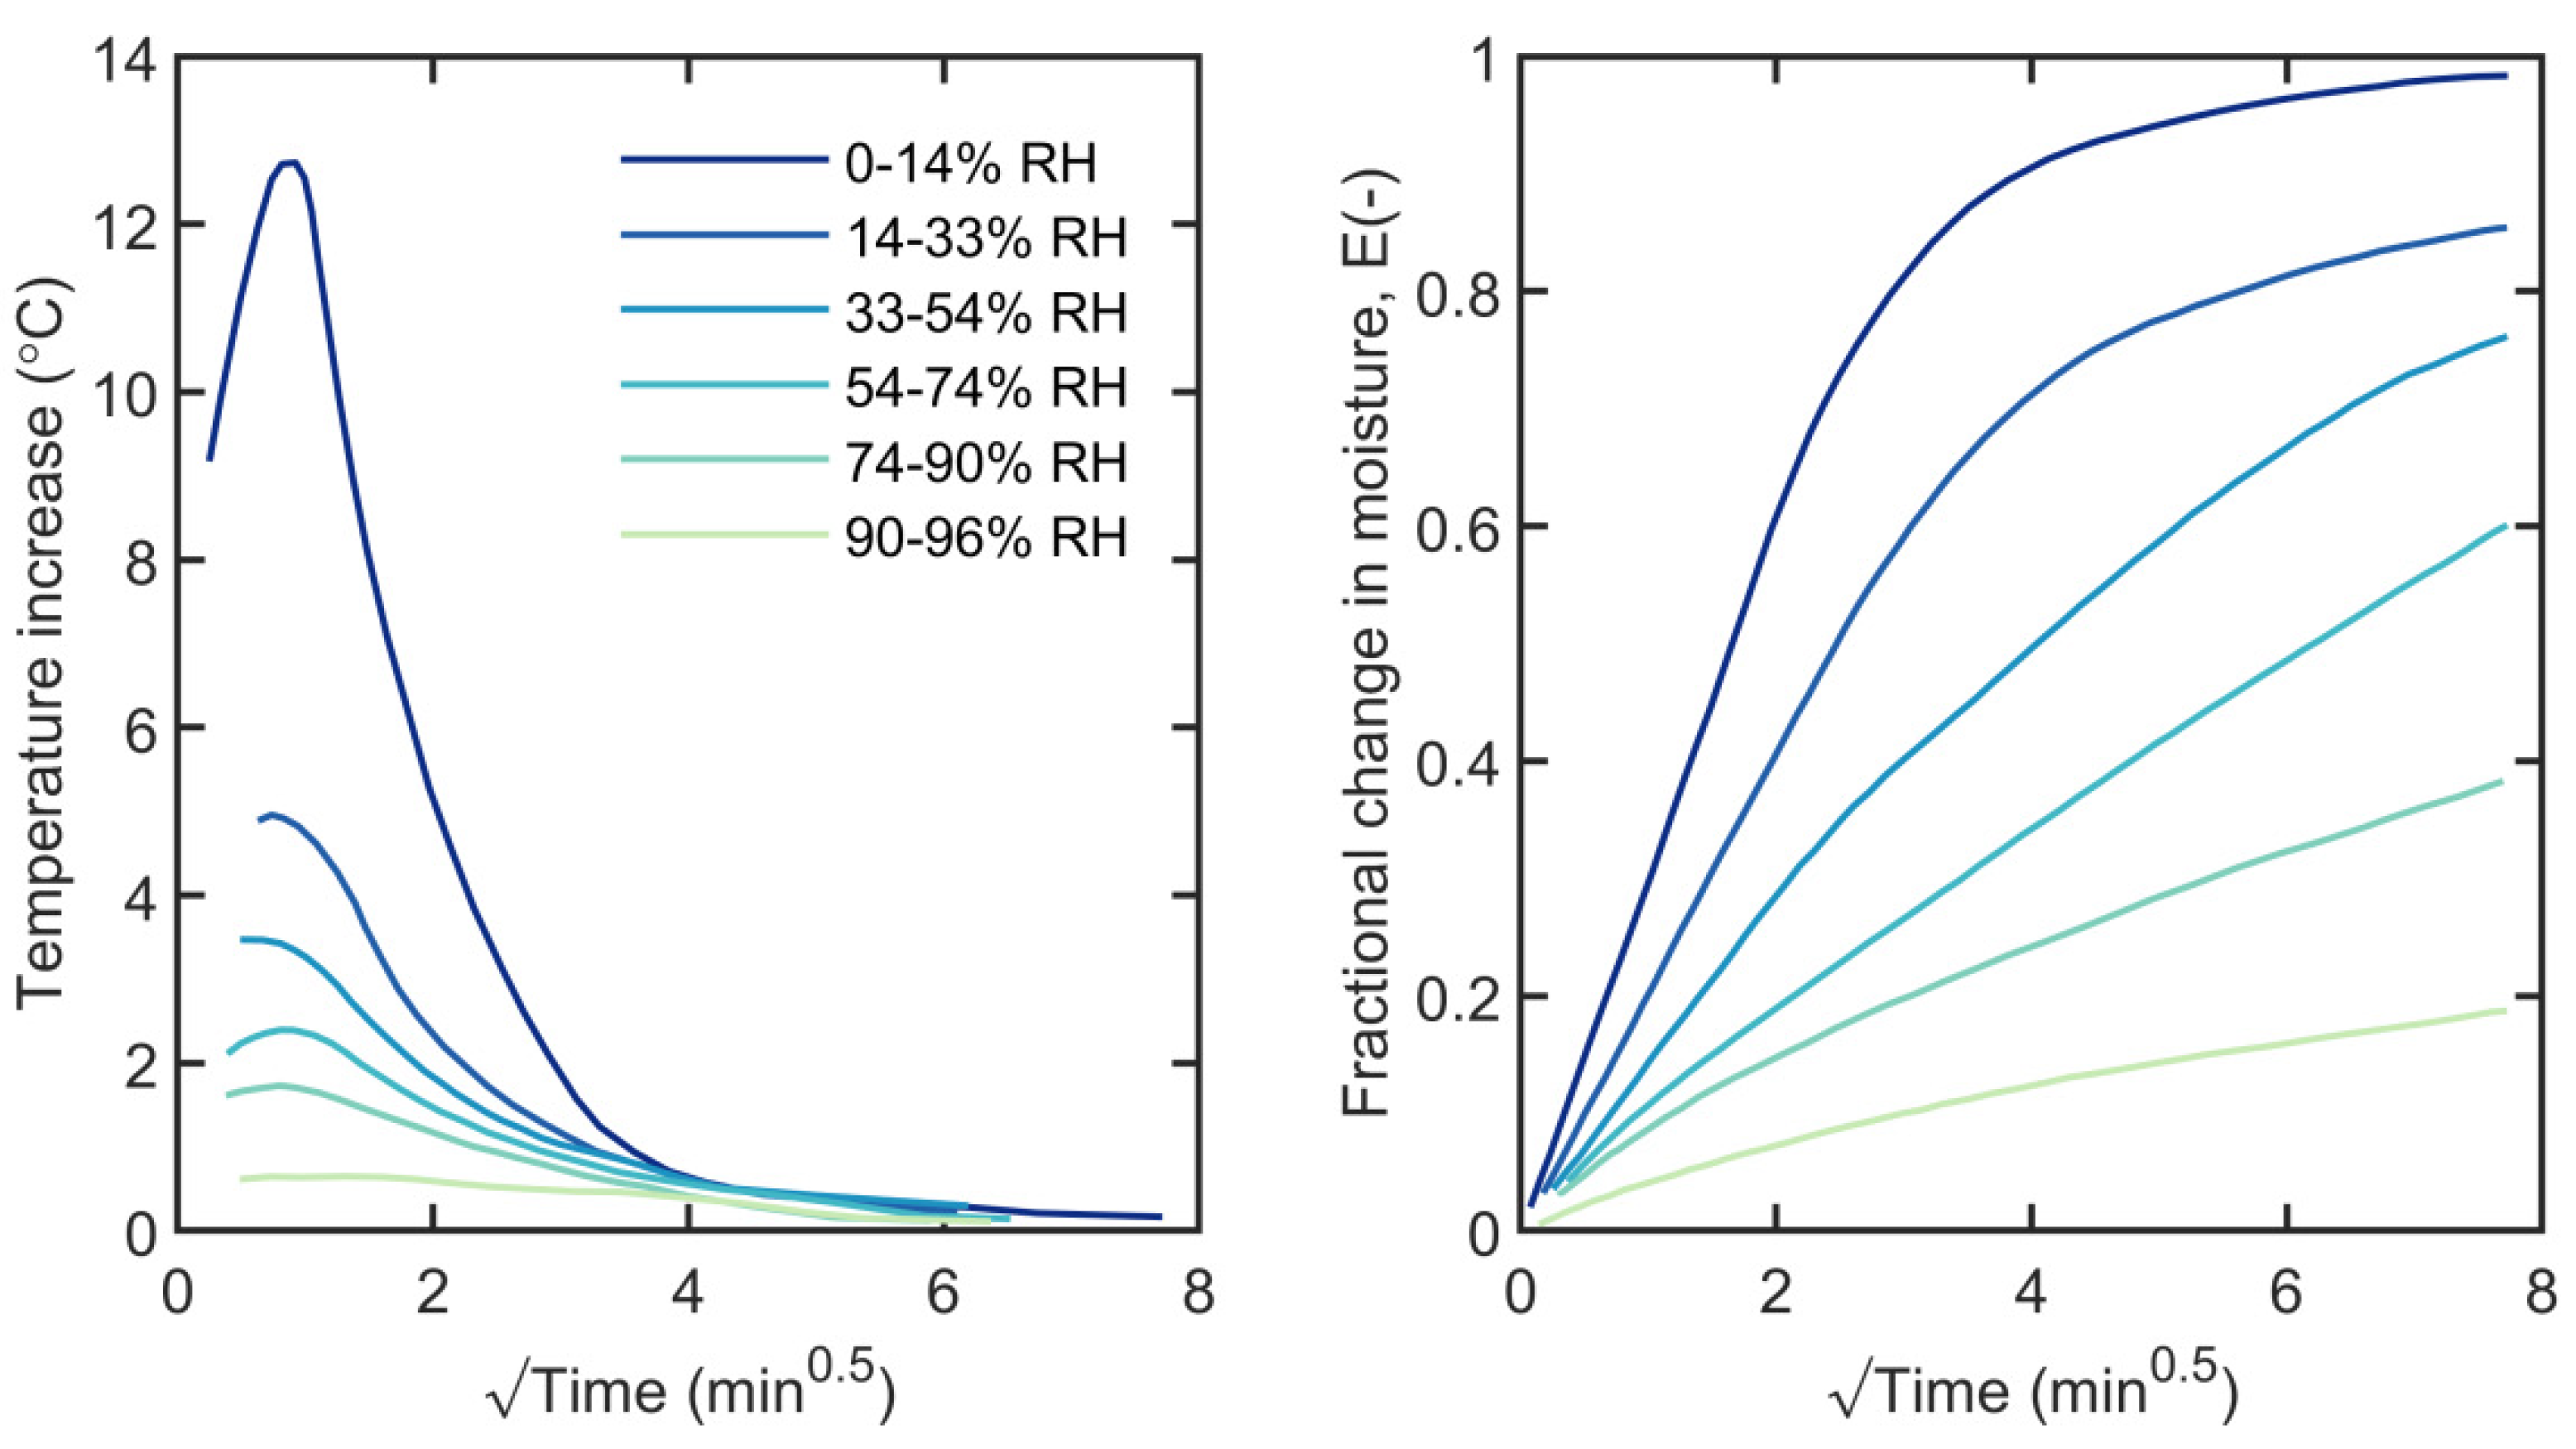
Heat transfer in vacuum sorption balances is limited compared with gravimetric measurements in moving air at atmospheric pressure. Two studies in vacuum [38,43] observed changes in temperature up to 13–15 °C for sorption in the lower RH range. As the initial moisture content was increased, the magnitude of the temperature change decreased. Temperature histories in absorption from Christensen and Kelsey [38] are shown in Figure 4, where it is clear that the temperature peaks for all sorption steps within the first minute. Within the first 10 min of every sorption step, the temperature decreases below 50% of the maximum temperature change, and within 1 h thermal equilibration is complete. Sorption equilibrium is, however, far from established in this time, in particular, sorption steps above 54% RH only reach values of E around 0.2–0.6 within 1 h.
Kelly and Hart [43] investigated both absorption and desorption processes and noted that the absolute changes in temperature were slightly smaller in absorption than in desorption. They investigated the timing of thermal equilibrium and moisture equilibrium and concluded that temperature was not the sole limiting factor in the sorption process.

4. Physical Phenomena Involved in the Sorption Process

Sorption of water vapor in wood causes a multitude of physical changes to the material besides a change in mass. This section reviews the primary physical phenomena that are coupled with vapor sorption and may thus affect the rate of sorption. Figure 5 provides an overview of physical changes occurring as a wood specimen is subjected to a change in RH, exemplified by an increased RH causing absorption.
As described in Section 3.1, using large wood specimens prohibits direct access of water vapor to all cell wall surfaces. In such specimens, the rate of water sorption is influenced by moisture transport occurring as combined water vapor diffusion within the wood void structure and bound water diffusion within the cell walls. However, this paper is only concerned with the sorption of water in cell walls themselves, and the following sections are, therefore, limited to the phenomena illustrated to the far right of Figure 5.

4.1. External Resistance to Vapor Transfer

For typical sorption measurements performed at atmospheric pressure, air is circulated by fans within a chamber or a continuous stream of carrier gas with a defined amount of water vapor is flowed across the specimen. Just above the specimen surface, a boundary layer of slower moving gas forms that impedes the transfer of water molecules from the gas stream to the specimen [57]. The thickness of this boundary layer will vary between the experimental setups for the sorption measurement, e.g., the type of sorption balance used as well as on the specimen geometry. For thin specimens, the resistance to moisture transfer of the boundary layer can have a significant effect on the kinetics of the sorption process [57], and therefore neglecting this resistance can lead to underestimations of the actual sorption kinetics of the specimen.
To estimate the effect of the external resistance of the boundary layer, it is necessary to investigate the gas flow patterns for the specific experimental setup or sorption balance instrument as described by Thorell and Wadsö [57]. On the basis of the obtained data, the effect of the boundary layer on the sorption kinetics can be estimated based on the Biot number (Bi) calculated as:
Bi = k c L D c
where, L (m) is the characteristic length of the specimen, kc (m s−1) is the specific mass transfer coefficient in the boundary layer, and Dc (m2 s−1) is the diffusivity of the specimen material. Index “c” denotes that the coefficients relate to moisture transfer with moisture concentration as the driving potential. The characteristic length of a film or a cuboid is half the thickness.
Since the boundary layer arises due to slow moving gas close to the surface, a vacuum sorption balance will have insignificant external resistance due to the low gas pressure.

4.2. Temperature Change

The phase change from the vapor phase to bound water in the cell wall (and vice versa) is associated with a significant amount of heat. Absorption of water molecules in wood is exothermic, causing the temperature of the wood to increase. Conversely, desorption of water from wood will result in the temperature decreasing. These temperature changes will diminish over time due to heat exchange between the wood and its surroundings. In vacuum sorption balances, the lower gas pressure is expected to limit the heat exchange with the surroundings as compared with sorption balances operating at atmospheric pressure.
The amount of energy released is given by the sum of the enthalpy of vaporization (ΔvapH) and the differential enthalpy of sorption (ΔsorpH). The former describes the phase change between liquid water and water vapor, while the latter describes the binding energy of water within cell walls relative to liquid water. This quantity is not constant; its magnitude decreases with increasing moisture content of the wood [61]. For further details about the state-of-the-art within this topic, please see the article “Measuring the heat of interaction between lignocellulosic materials and water” by Nopens et al. in this special issue.
The temperature change observed during sorption depends both on the change in enthalpy and the heat capacity of the material. Adding water molecules to the wood will increase the total heat capacity of the specimen as well as the specific heat capacity of the wood [62,63]. This will result in a lower temperature change at higher moisture contents for the same amount of energy released. At the same time the total enthalpy associated with a change in moisture content is decreasing in magnitude with increasing moisture content. It is, therefore, not surprising that the observed temperature changes during absorption or desorption are larger in the lower moisture content range [38,43], as depicted in Figure 4.
The change in temperature at the wood/air interface, where water molecules exchange between the vapor and bound phase, affects the local microenvironment. Absorption of water vapor increases the local temperature and this, in effect, increases the saturation vapor pressure and lowers the local water activity (or RH). As a result, the difference in chemical potential over the interface after the rise in temperature is less than the difference in chemical potential between water in wood and bulk air prior to the rise in temperature. Therefore, the driving potential for bulk transport of water molecules from the air to the wood is decreased locally. The effect of temperature changes during sorption has been suggested from several studies of sorption in various materials [64,65], where the approach to equilibrium was slower than predicted by a Fickian diffusion model, see Section 5.1. Moreover, the shape of the sorption curves did not correspond to the Fickian diffusion model. The experimental data could be explained by taking into account the increase in temperature during sorption and subsequent thermal equilibration [64,65,66]. Importantly, the sorption process was retarded by the temperature changes occurring but followed the thermal equilibration, meaning that equilibrium for both solvent uptake and temperature with the surrounding atmosphere was completed within the same timeframe. As seen in Figure 4, this is not the case for water vapor sorption in wood.

4.3. Diffusion of Bound Water within Cell Walls

Transport of moisture in wood occurs if a wood specimen in equilibrium with given climate conditions is subjected to another climate, see Figure 5. In addition, the sorption process, i.e., the local equilibration between vapor phase and bound water phase involves moisture transport. This occurs as diffusion of water molecules within the wood between the lumen/wall interface and the interior of the cell wall. Diffusion is perhaps the most widely invoked explanation of the rate of sorption in thin, solid substances as it involves only one mechanism that is known to take place, i.e., the diffusion of absorbed solvent through the solid material. For further details about state-of-the-art within moisture diffusion, please see “Effects of moisture on diffusion through unmodified wood cell walls: A phenomenological polymer science approach” by Jakes et al. in this special issue.
A series of experiments by Christensen [39,40] reported that diffusion might influence sorption kinetics in wood under certain conditions. In these experiments, the sorption kinetics of thin wood specimens of different thicknesses in the tangential direction was recorded in a vacuum sorption balance, thereby removing the external resistance to moisture transfer as discussed in Section 4.1. The experimental results show that when RH was around 60% or above, the sorption rate of the specimens did not depend on their thickness which varied between 20 µm and 3 mm [40]. This indicates that a mechanism other than diffusion controls sorption kinetics. However, at RH below 60%, the rate of sorption depends on specimen thickness, even for specimen thicknesses below 0.2 mm. This suggests that diffusion influences sorption kinetics in the low moisture range. However, it should be noted that the experiments were conducted in vacuum, and therefore temperature changes occurred during sorption (e.g., Figure 4).

4.4. Dimensional Changes and Associated Stresses

Wood cell walls are virtually nonporous when they are dry [67]. Therefore, absorption of water molecules within cell walls results in a significant increase in dimensions (swelling). Conversely, desorption causes the wood to contract (shrinkage). The dimensional changes can be observed both for the cell wall material [68], the cell geometry [69], the tissue [70], and the bulk material [71,72]. These changes have been found to be linearly correlated with moisture content on all scales [69,70,71,72,73].
The cell wall consists of a composite material with stiff, aggregated cellulose microfibrils embedded in a matrix of hemicelluloses and lignin [74]. Among these three main cell wall compounds, the cellulose molecule has the highest concentration of hydroxyls, which is thought to be the primary sorption site for water in wood [7]. However, water molecules are unable to penetrate the cellulose microfibrils [75,76], and therefore 64%–78% of cellulose hydroxyls are unable to interact with water [77]. Instead, of the three main constituents, the hemicelluloses attract the most water at given climatic conditions [78]. When water molecules are absorbed within the hemicelluloses or lignin, or on the surface of the cellulose microfibrils, the material expansion it causes will increase the distance between microfibrils [79].
Dimensional changes during sorption are accompanied by stresses arising within the material. During absorption of water, the swelling of wood can generate significant forces if the expansion is restricted in one or more directions [80,81]. Since wood is a porous material, some of the cell wall expansion occurring in such swelling-restricted wood will cause the cell lumina to shrink. This reduces the forces generated by the bulk wood and makes it difficult to assess the magnitude of internal swelling stresses. However, Tarkow and Turner [82] densified yellow birch wood to arrive at a total porosity around 4%. The swelling stresses generated when this material was restricted from swelling in the transverse directions amounted to 76 MPa, whereas the theoretical limit for the swelling pressure generated by the cell wall substance was estimated to be 172 MPa [82]. Even in freely-swelling wood, absorption of water will cause swelling stresses within cell walls arising from the mechanical constraint of the stiff cellulose microfibrils. Thus, if this constraint is decreased the wood cell walls will absorb slightly more moisture under the same environmental conditions [40,83].
The swelling stresses arising due to absorption will gradually decrease as a result of the viscoelastic mechanical properties of the material. Such viscoelastic behavior is thought to arise from cell wall polymers being able to move by breaking and reforming intermolecular hydrogen bonds [84,85]. On the macroscale, viscoelastic behavior is observed as an increase in deformation (creep) or decrease in stress (relaxation), when wood is subjected to an external load or deformation, respectively.
It has been realized that internal mechanical stresses affect the sorption of swelling solvents for various types of polymeric films [86,87,88]. Thus, a higher moisture uptake along with a faster rate of sorption has been found in polymeric films under tension [89,90,91] and a slower rate of sorption in films under compression [92]. Additionally, restricting the in-plane swelling has been seen to result in a longer time to equilibrium than in free-swelling films [86]. Another observation that illustrates how stress relaxation affects the sorption of swelling solvents is the change in concentration of absorbed solvent at the air/polymer interface. For sorption controlled by diffusion, equilibrium between solvent vapor pressure and absorbed solvent concentration at the surface is attained relatively fast. However, the surface concentration of swelling solvents in polymers has been observed to change only gradually with time, indicating that the equilibration depends on relaxation of swelling stresses [93,94,95].
The influence of stress relaxation during sorption has long been a suggested mechanism in polymer films exhibiting a marked two-stage sorption process [88,96,97,98,99], where the initial stage is thought to be related to diffusion into the film followed by a second, relaxation-controlled stage.
For water vapor sorption in wood, the process does not exhibit a marked two-stage behavior, although a number of studies have fitted the sorption curve with a model consisting of two exponentials (see Section 5.4). However, several studies described in Section 3.2 indicate that swelling stresses affect the water sorption process in wood. For instance, the rate of absorption has been shown to depend positively on the RH step size [39], which has been interpreted as larger swelling stresses facilitating a faster sorption. On the other hand, a prolonged conditioning time, and thus stress relaxation time, before a change in RH results in a slower sorption rate [60].

4.5. Polymer Mobility

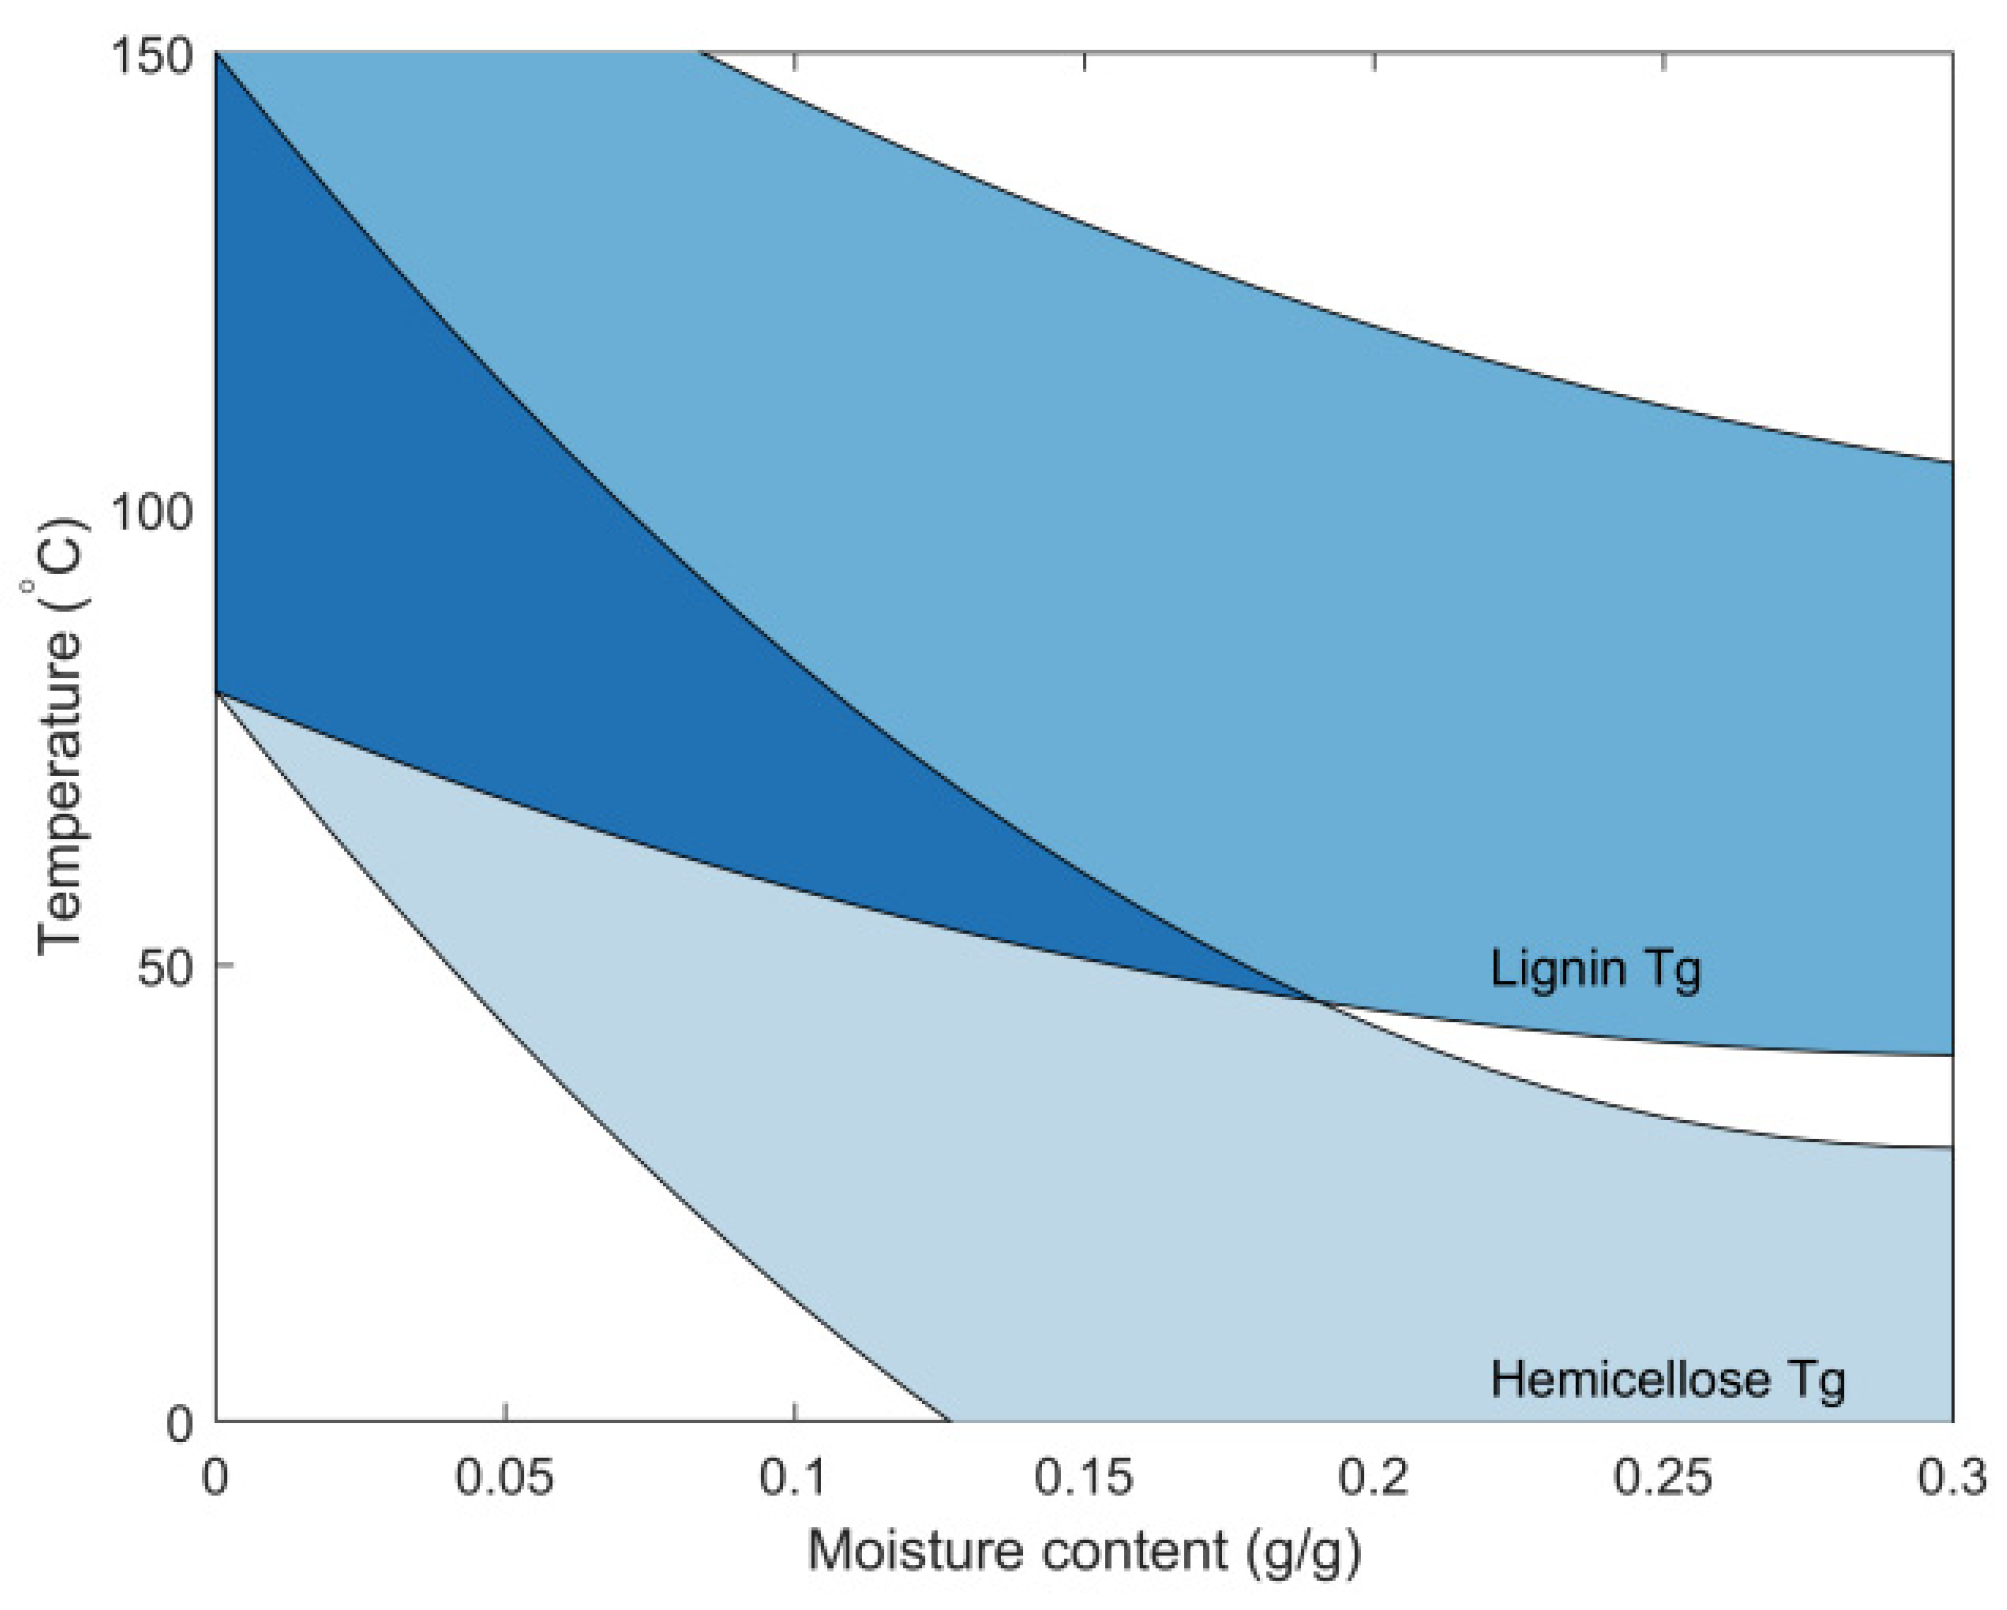
The physical behavior of amorphous polymers, such as hemicelluloses and lignin, is strongly dependent on the polymer mobility, i.e., the probability for translational motion of polymers or polymer segments. At low temperature, this probability is low resulting in the polymer behaving like a solid. This is called the “glassy state”. On the other hand, at a high temperature the probability for translational motion is much higher, resulting in a viscous polymer behavior referred to as the “rubbery state”. The intersection between these two states of amorphous polymers is called the “glass transition” or “softening point”. It is typically characterized by a dramatic change in elastic modulus of the polymer as it changes state between the glassy and rubbery states. Temperature heavily influences the state of amorphous polymers as it is a measure of the thermal energy available for translational motion. However, moisture within hydrophilic amorphous polymers decreases the thermal energy required for translational motion by breaking interpolymeric hydrogen bonds. Hereby, polymer mobility is increased, and the temperature associated with glass transition is lowered.
The glass transition temperature of the amorphous wood polymers depends heavily on the wood moisture content as seen in Figure 6. This illustrates how the transition temperature is above at least 80 °C at low moisture contents but decreases as the moisture content is increased. For the hemicelluloses, the transition temperature falls below 20 °C typically between about 55% RH and 90% RH, corresponding to around 10%–20% wood moisture content.
Sorption experiments are most often performed at a constant temperature, aside from the temperature changes resulting from the phase change of water during the sorption process (see Section 3.4 and Section 4.2). Glass transition of the amorphous wood polymers, therefore, arises from changes in polymer mobility, reflected in a change in transition temperature, as the moisture content changes during the sorption process.
Polymer mobility affects other physical phenomena discussed in this paper in relation to sorption kinetics. Diffusion is often enhanced significantly by increased polymer mobility, especially at the glass transition [106], see also “Effects of moisture on diffusion through unmodified wood cell walls: A phenomenological polymer science approach” by Jakes et al. in this special issue. Moreover, the rate of stress relaxation is increased by high polymer mobility [107]. Therefore, if diffusion or stress relaxation is controlling the rate of sorption, these will be affected by the polymer mobility of the hemicelluloses and lignin. However, while polymer mobility increases with increasing moisture content causing a faster diffusion and stress relaxation, the rate of sorption is observed to decrease with increasing moisture content, see Section 3.2.

5. Theoretical Models Describing Sorption Kinetics

Several theoretical, mathematical models have been developed in order to explain sorption kinetics in cellulosic and other polymeric materials. In this section, a handful of models are reviewed and discussed including both recent and popular models as well as theoretical models that are related to the physical phenomena discussed previously.

5.1. Fickian Diffusion Model

A classical way of explaining sorption kinetics in thin films is by describing it as governed by the transport of water molecules between the interior of the film and the interface with the surroundings. In the simple case, it can be assumed that the diffusion coefficient, i.e., the material parameter describing how fast molecules are diffusing at a given moisture gradient, is constant with respect to moisture content.
From this, the fractional change in moisture content (E) in the thin film as a function of time can be described by [108]:
E = M ( t ) M 0 M M 0 = 1 n = 0 8 ( 2 n + 1 ) 2 π 2 exp [ ( 2 n + 1 ) 2 π 2 4 L 2 D c t ]
where, M(t) (g g−1) is the moisture content at time t (s), M0 (g g−1) is the initial moisture content at t = 0, M (g g−1) is the moisture content at equilibrium, Dc (m2/s) is the diffusion coefficient with moisture concentration as driving potential, and L (m) is the distance from the center of the cell wall to the lumen surface. Most often, the diffusion coefficient increases with an increasing concentration of absorbant, e.g., moisture. In that case, Dc in Equation (3) represents a weighted average over the moisture content range of the specific sorption step [109].
From the assumption that sorption kinetics is governed by diffusion of absorbant into or out of the material, the diffusion coefficient can be derived by Equation (4) based on the time to complete half of the sorption process, i.e., E = 0.5 [110].
D c = π L 2 16 t ½
where, t½ (s) is the time it takes to reach E = 0.5. On the basis of Equation (4), the diffusion coefficient of thin films can be derived from sorption kinetic data, however, it can also be independently determined from steady-state transport experiments. In these experiments, a constant gradient in vapour pressure is maintained over the thickness of the film, and the diffusion coefficient is determined based on the observed moisture flux through the film.
Steady-state transport experiments are difficult to perform on wood cell walls due to their geometry. However, it is possible to get an idea of the diffusion coefficient of wood cell walls from steady-state measurements on close similar materials. Thus, the diffusion coefficient, with moisture concentration as the driving potential, has been found in the range 10−13–10−11 m2/s for thin films of wood derived polymers such as uncoated cellophane [111], xylan with nanofibrillated cellulose [112], and spruce galactoglucomannan plasticized by 5% glyoxal [113]. The diffusion coefficient increases with increasing moisture content [111,113].
An alternative method for obtaining the diffusion coefficient of wood cell walls was used by Stamm [114] who filled the wood void structure with a molten metal alloy. The idea was that the transport of water into the metal-filled wood would occur nearly exclusively within cell walls. The diffusion coefficient was thus derived from Equation (4) after determining the mass gain over time after dipping the wood specimens in liquid water [114]. The diffusion coefficient was found in the range 3.2–9.2 × 10⁻¹¹ m2/s, which is in the upper range of the diffusion coefficients found for thin films of wood-derived polymers. This could be explained by the high moisture content resulting from the use of liquid water. However, the experimental results must be regarded as uncertain due to incomplete filling of the void structure with metal (estimated to 65%–89% of the void volume) and the inevitable crack formation at wood/metal interfaces due to dimensional changes of the cell walls and lumens caused by swelling [69,115]. Both of these effects will provide easy transport pathways for liquid water into the specimens.
Examination of the sorption kinetics of water in wood cell walls makes it clear that the Fickian diffusion model cannot explain the observed behavior. As described in Section 3.1, the rate of sorption in thin wood specimens does not depend on thickness above 60% RH. This behaviour is also seen for thin cellulose films [58]. Moreover, the diffusion coefficient derived from thin wood specimens is significantly lower than those found for films of wood-derived polymers. Thus, Kelly and Hart [43] derived diffusion coefficients for bound water transport in the cell walls of oak (Quercus alba L.) and yellow poplar (Liriodendron tulipifera L.) based on sorption kinetics measured in a vacuum sorption balance. These diffusion coefficients decreased from around 4 × 10⁻¹⁴ m2/s at low moisture content to around 4 × 10⁻¹⁵ m2/s at high moisture content. Similarly, decreasing diffusion coefficients can be derived from the sorption kinetics data on mountain ash (Eucalyptus regnans F. Muell.) by Christensen [40]. The thinnest specimen in those experiments was 20 µm thick in the tangential direction, while the actual cell wall thickness was estimated to be around 3 µm [40]. If this thickness is used in Equation (4), the derived diffusion coefficient is 1.0 × 10⁻¹³ m2/s in the first sorption step from the dry condition to 9.6% RH, and it decreases in subsequent sorption steps. Using the bulk specimen thickness of 20 µm yields a diffusion coefficient in the first step of 4 × 10⁻¹² m2/s. However, these experiments were conducted in vacuum, and therefore temperature changes could have affected the rate of sorption, see Section 4.2.
By comparing the observed sorption kinetics in wood in Figure 3 with the predictions of the Fickian diffusion model in Figure 7, the discrepancy between experimental data and the model becomes apparent. Figure 3 shows the sorption kinetics in a vacuum sorption balance of 20 µm thin wood specimens for a sequence of sorption steps starting at 0% RH and ending at 90% RH. It is clear that the time to complete half the moisture change, i.e., time to reach E = 0.5, increases as the moisture content increases. This explains why the derived diffusion coefficient from Equation (4) decreases with increasing moisture content. On the other hand, the Fickian diffusion model, informed by steady-state diffusion measurements, would predict a faster approach to equilibrium at higher moisture content, see Figure 7. Only by assuming a very low diffusion coefficient, around 10−14–10−13 m2/s, is the Fickian diffusion model able to capture the observed sorption kinetics in the first couple of sorption steps in Figure 3.
Another experimental observation which is inconsistent with predictions from the Fickian diffusion model is the difference in the rate of sorption in absorption and desorption, described in Section 3.3. Kelly and Hart [43] found that for similar changes between two levels of RH, E = 0.5 was reached faster during desorption than absorption, especially for RH above 54%. On the basis of experimental data for wood-derived polymers [111,113], the diffusion coefficient of wood cell walls is expected to increase with increasing RH. Therefore, the diffusion coefficient is expected to increase during absorption and decrease during desorption. Simulations by Wadsö [116] show, however, that such changes in the diffusion coefficient result in a slower rate of desorption than absorption.
Moreover, in yet another test of the ability of the Fickian diffusion model to capture sorption kinetics in wood, Christensen [39] exposed thin specimens of klinki pine (Araucaria klinkii Lauterb.) to sorption steps starting from dryness, but with different step sizes. The step sizes ranged from 1.5% to 9% moisture content corresponding to different vapour pressure target values in the 3%–51% RH range. The observed time to reach half the moisture change, i.e., E = 0.5, was more or less constant for the different step sizes. This indicates that if Fickian diffusion is the controlling factor, the diffusion coefficient is relatively constant in the 0%–9% moisture content range.
As discussed in Section 4.3, moisture diffusion does not control the rate of sorption above 50% RH. Nonetheless, it is relevant to estimate the time scale for reaching moisture equilibrium after a change in RH. For instance, if the diffusion coefficient was 10−12 m2/s, then moisture equilibrium would be re-established within 2 min for cell walls as thick as 10 µm. In contrast, for a diffusion coefficient of 10−13 m2/s, moisture equilibrium would be reached within the first 40 min for the same cell walls. Of course, if these walls are thinner, the sorption process would be complete even faster. This clearly illustrates the failure of the Fickian diffusion model to explain sorption kinetics of water in wood cell walls in the range above 50% RH.

5.2. Swelling Stress Models

Several mathematical models have been suggested for explaining the sorption kinetics of polymer films that could not be modeled by Fickian diffusion models. Crank [88] derived a model with a diffusion coefficient dependent on the internal stresses arising from differences in swelling between neighboring regions with different concentrations of absorbant. Moreover, Newns [96] and Sanopoulou et al. [117] used two-stage models where the initial increase in vapor uptake generated internal stresses that governed the rate of sorption and hence the rate of swelling in the second stage. In order to use the models, the concentration defining the intersection between the first and second stage of the sorption process needs to be determined. This can be difficult if the sorption curve does not exhibit a marked two-stage behavior.
Alternatively, several models have been suggested that include contributions to the sorption kinetics from both diffusion and stress relaxation. Several models [118,119,120] have tried to include these phenomena by incorporating relaxation kinetics with Fickian diffusion in different ways, e.g., by implementing an internal state variable related to the degree of swelling [118]. However, in these models, stress relaxation is often described by simple empirical relations without meaningful physical parameters that can be independently determined. Interestingly, the model by Joshi and Astarita [118] considers three overlapping regimes for the coupling between stress relation and Fickian diffusion. At low concentrations of absorbed solvent, sorption kinetics is controlled by Fickian diffusion and gradients in concentrations are observed. At high concentrations, stress relaxation dominates due to considerably faster diffusion rates than stress relaxation rates, and therefore gradients are virtually absent. Between these extremes, sorption kinetics is not dominated by one of the processes.
For sorption of water in wood, several authors have described their measurements as indicating a sorption process consisting of two underlying processes [39,40,43,58,60]. However, analysis of more recent experimental data indicates that often more than two component processes are needed to mathematically describe the actual shape of the sorption curve, see Section 5.4. Even though the mathematical analysis may be complex, sorption in wood appears to cover the entire range from diffusion-controlled sorption at low moisture contents to relaxation-controlled sorption at high moisture content (see Section 4.3 and Section 4.4). A much-needed tool for understanding water vapor sorption kinetics in wood would, therefore, be a micromechanical model that is based on fundamental visco-elastic mechanical properties of the wood constituents as a function of moisture content and the structure, e.g., orientation of cellulose microfibrils in different cell wall layers. Sorption of moisture induces important effects on the physical properties of cell walls that need to be incorporated in a micromechanical model, including elastic properties (stiffness) [121], visco-elastic properties (creep/relaxation rate) [121,122], volume [68], as well as coupled effects of mechanics and sorption, i.e., mechano-sorption [123].

5.3. Thermally Limited Moisture Transport Model

A recent model for explaining sorption kinetics in wood is the thermally limited moisture transfer (TLMT) model developed by Willems [124]. This model includes effects on the sorption kinetics from both external mass transfer and temperature increase/decrease from sorption at the wood surface, similar to other previously developed theoretical models [64,65,66]. In the TLMT model, the sorption process is described by two components, see Equation (5), which both relate to coupled moisture and heat transfer between a wood specimen and its surroundings.
E = M ( t ) M 0 M M 0 = 1 + b 2 b 1 b 2 ( 1 e x p ( t τ 1 ) ) + 1 + b 1 b 1 b 2 ( 1 e x p ( t τ 2 ) )
where, b1 and b2 are model parameters, and τ1 and τ2 (s) are the characteristic time constants of the two coupled moisture and thermal processes. By rearrangement of Equation (5), the similarity in mathematical form with the Fickian diffusion model is clear, see Equation (6). Although the TLMT model only has two components, these are less constrained than the infinite series in the Fickian diffusion model. The form is also similar to other sorption models that include both heat and mass transfer [66].
E = M ( t ) M 0 M M 0 = 1 [ 1 b 2 b 1 b 2 e x p ( t τ 1 ) + 1 + b 1 b 1 b 2 e x p ( t τ 2 ) ]
The fundamental idea of the TLMT model is that sorption changes the surface temperature, which causes the local RH near the surface to deviate from that of the bulk surroundings. During absorption, the surface temperature increases caused by the latent heat from water molecules going from the vapor phase to the bound phase. The higher surface temperature causes a local decrease in RH due to a higher water vapor saturation pressure with increased temperature. Since absorption follows from an increase in RH of the surrounding air, the decrease in local RH will reduce the driving potential for the transfer at the surface from vapor to bound water. Conversely, desorption follows from a decrease in surrounding RH, and it causes a lower surface temperature which increases the local RH, and thereby reduces the driving potential.
The decrease in driving potential is more pronounced for a given temperature change at high RH [124]. This arises since the difference in RH due to a temperature change scales with RH itself. Moreover, the sorption isotherms of wood are steeper at high RH, and a decrease in local RH at the surface, therefore, lowers the moisture content in equilibrium with the local RH and temperature conditions. As a result, the TLMT model predicts a more pronounced effect on the sorption kinetics at high RH than at low RH, even though the temperature change observed during absorption is highest at low moisture content [38]. The latter is caused by the latent heat per amount of bound water decreasing with increasing moisture content [61].
The TLMT model has been applied to sorption kinetic data from automated sorption balance measurements and has been used for explaining time constants derived by the parallel exponential kinetics (PEK) model. This model has recently been shown to be inadequate in explaining sorption kinetics (see Section 5.4). However, there are also inherent problems with the TLMT model itself. Most importantly, the time constant of the two moisture sorption components both scale with the ratio of dry mass to surface area. This means that larger surface area per specimen mass results in shorter time components and thus faster sorption. As described in Section 3.2, experimental results with a vacuum sorption balance by Christensen [40] show that at 60% RH and above, the rate of sorption is independent of specimen thickness below 3 mm. Thin specimens have a larger surface area per dry mass and are, therefore, expected by the TLMT model to exhibit a faster rate of sorption, contrary to experimental evidence. Below 60% RH, the thin microtomed specimens in the experiments by Christensen did exhibit a faster rate of sorption than thicker specimens as predicted by the TLMT model. However, in the lower RH range, the TLMT model does not predict significant effects from the change in surface temperature as described above. Thus, the time constants of the model in this range depend predominantly on an overall moisture transfer coefficient independent of RH and an overall heat transfer coefficient independent of temperature. The TLMT model, therefore, fails to account for the experimental data in the RH range where the physical phenomenon suggested controlling sorption kinetics is most pronounced.

5.4. Parallel Exponential Kinetics (PEK) Model

The widespread adoption of automated sorption balances in wood laboratories during the last decade has seen an increase in the studies of sorption kinetics of wood. Much of this work on sorption kinetics has used the parallel exponential kinetics (PEK) model to analyze data. This model was first suggested by Kohler et al. [125] and later attributed to Hill et al. [126]. The model is a linear combination of simple exponential kinetic processes and can be described by Equation (7) with n = 2:
M ( t ) = M o + i = 1 n Δ M i ( 1 exp ( t τ i ) )
where, ΔMi (g g−1) is the moisture content change related to the ith process, and τi (s) is the characteristic time constant of that process. By rearrangement of Equation (7), the similarity in mathematical form with the Fickian diffusion and the TLMT models is clear, see Equation (8). Although the PEK model only has two components, these are less constrained than the infinite series in the Fickian diffusion model. Therefore, it fits with the indications from experimental measurements that sorption kinetics is a result of two underlying processes [39,40,43,58,60].
E = M ( t ) M 0 M M 0 = i = 1 n Δ M i M M 0 i = 1 n Δ M i M M 0 exp ( t τ i ) = 1 i = 1 n Δ M i M M 0 exp ( t τ i )
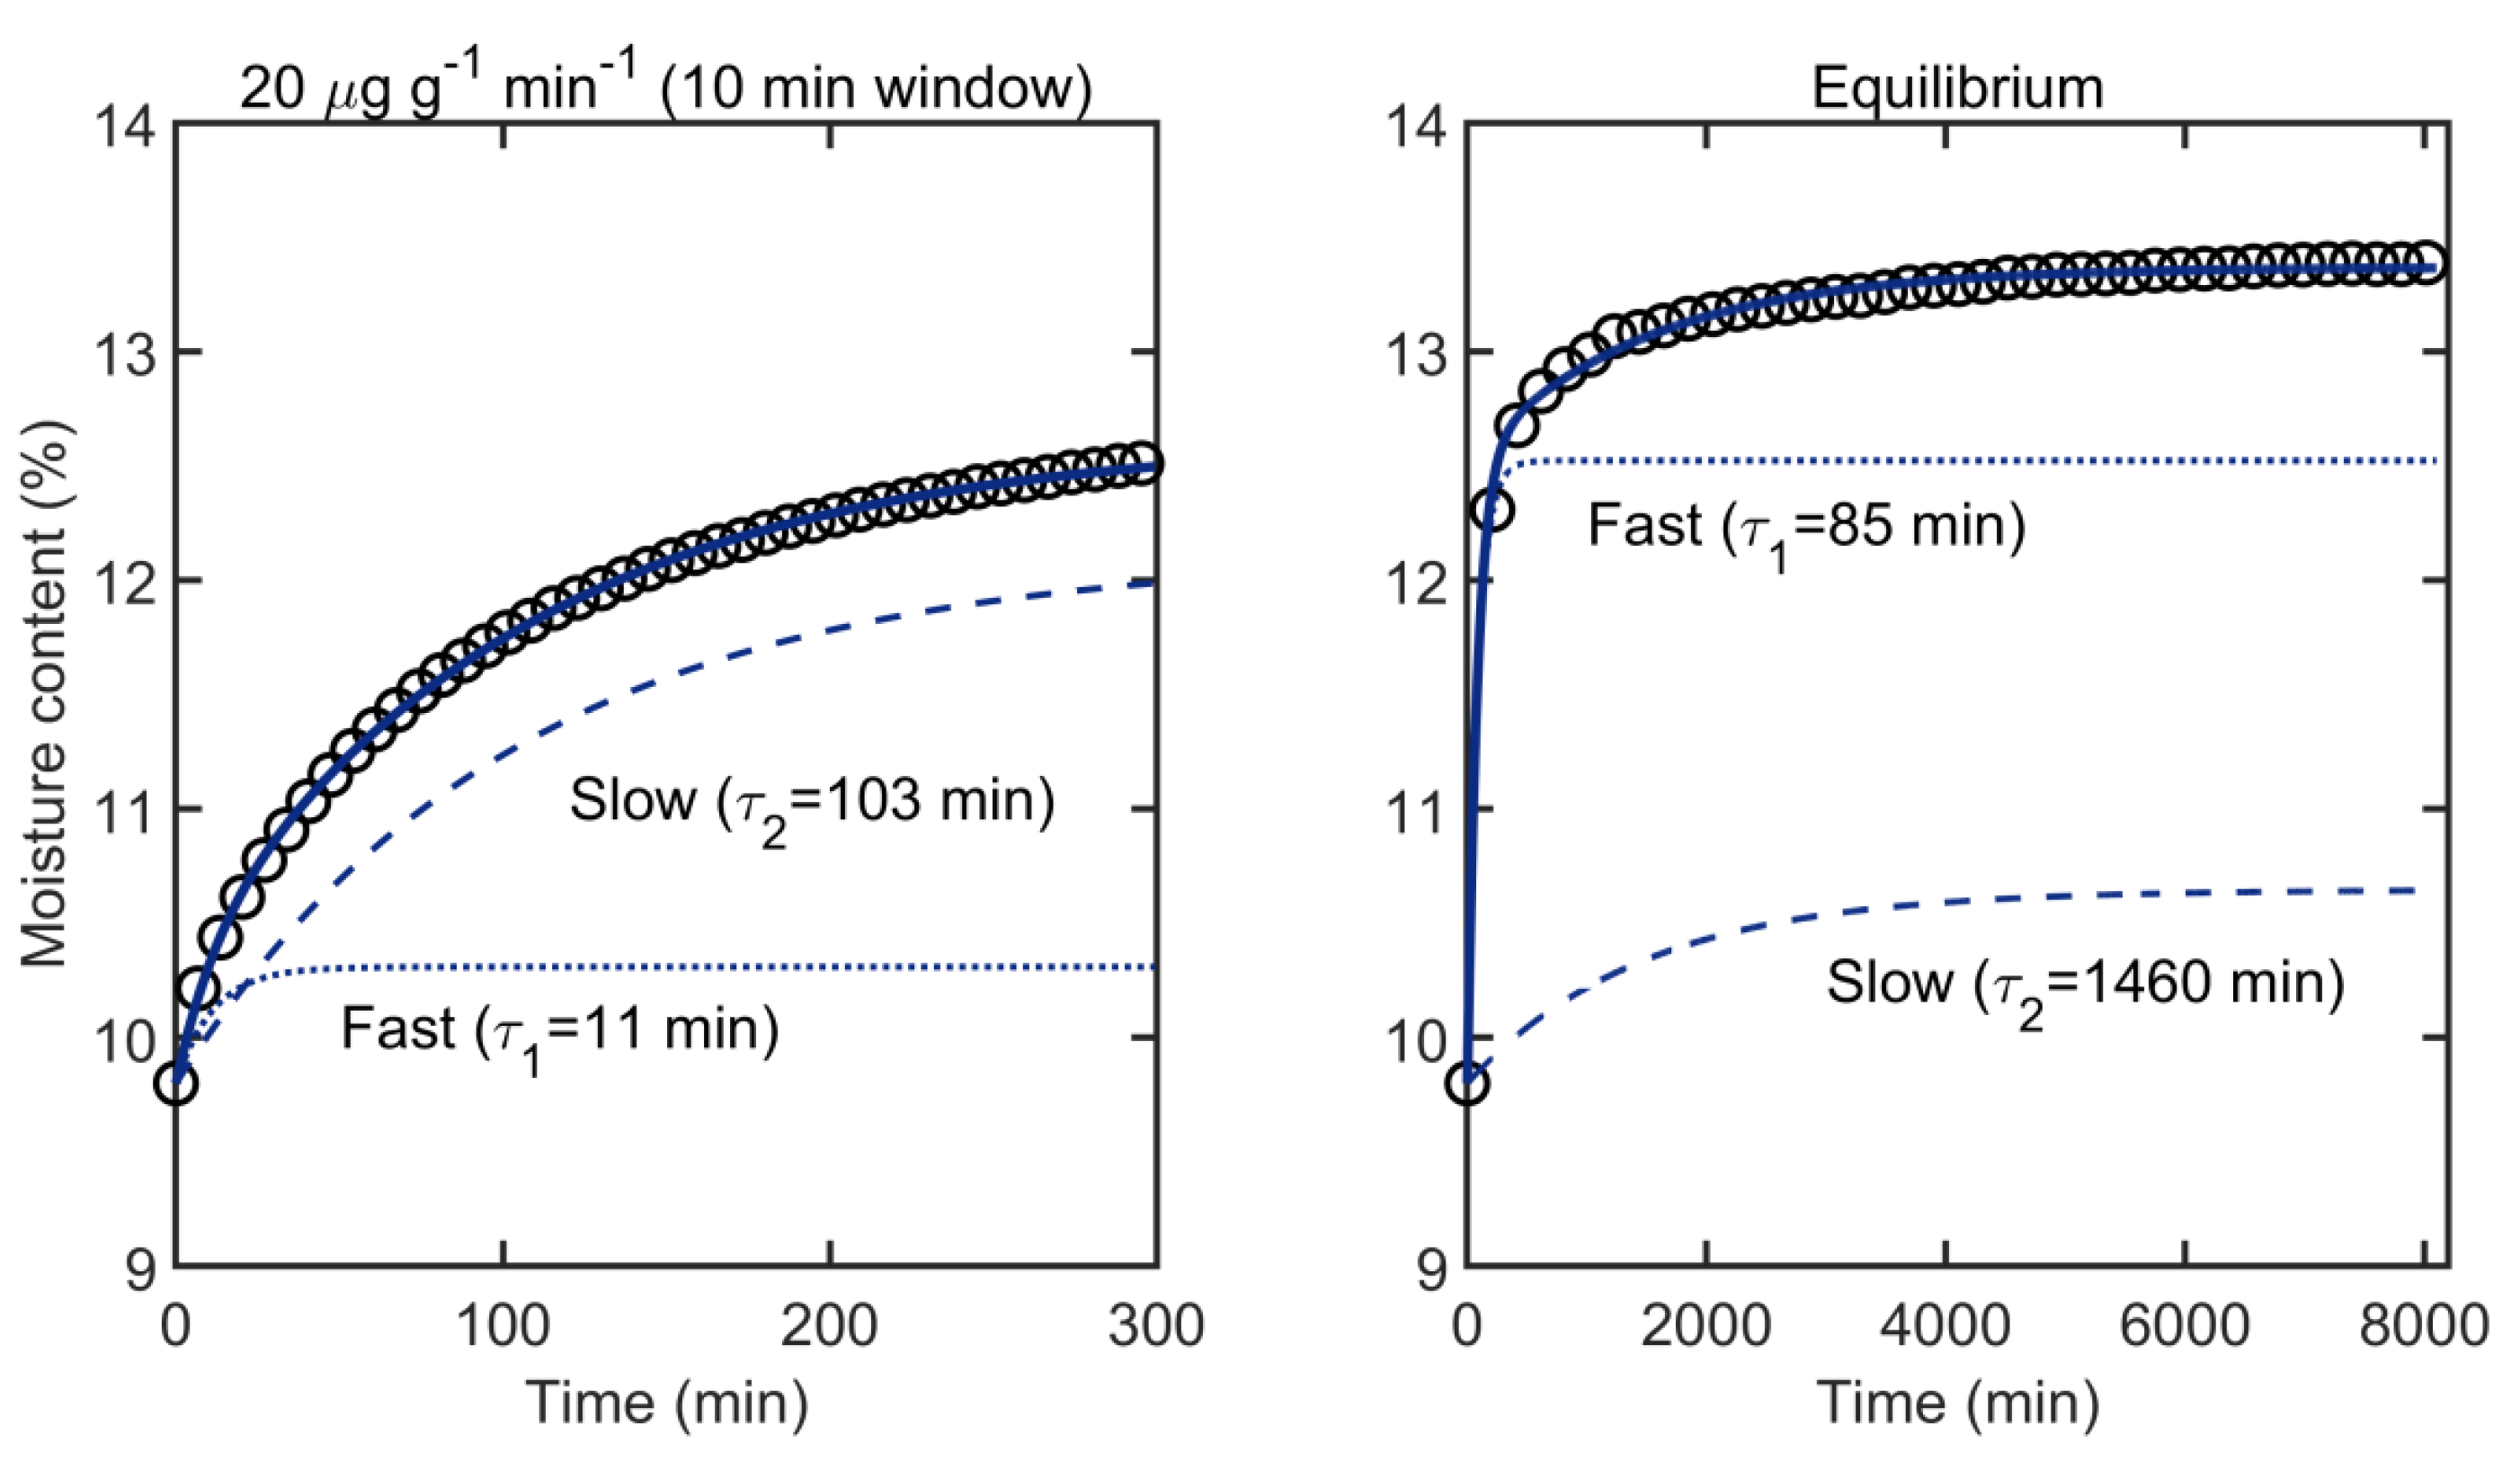
In practice, fitting Equation (7) to data collected with automated sorption balances yields two time constants which are referred to as “fast” and “slow” sorption processes, see Figure 8. Several potential physical explanations for these sorption processes have been proposed, the most common being that these two processes represented different sorption sites [125,126,127,128,129,130,131,132,133,134,135,136,137,138].
Despite the widespread adoption of the PEK model over the past decade, Thybring et al. [139] have recently shown that the PEK model parameters cannot be physically meaningful. While the model appears to fit data collected from automated sorption balances well, Thybring et al. [139] have shown that this apparent agreement is an artifact of interrupting the measurements prior to equilibrium. Glass et al. [140] demonstrated that the common automated sorption balance equilibrium criterion of d M / d t = 20 µg g−1 min−1 (or 0.002% min−1) over a 10 min window can result in large errors in the apparent EMC. When the data collection period is extended, the model parameters change considerably, the residuals exhibit non-random patterns, and the fitting statistics get worse [139]. This is illustrated in Figure 8 for data collection until the change in mass is equal to the inherent mass stability of the instrument (i.e., equilibrium).
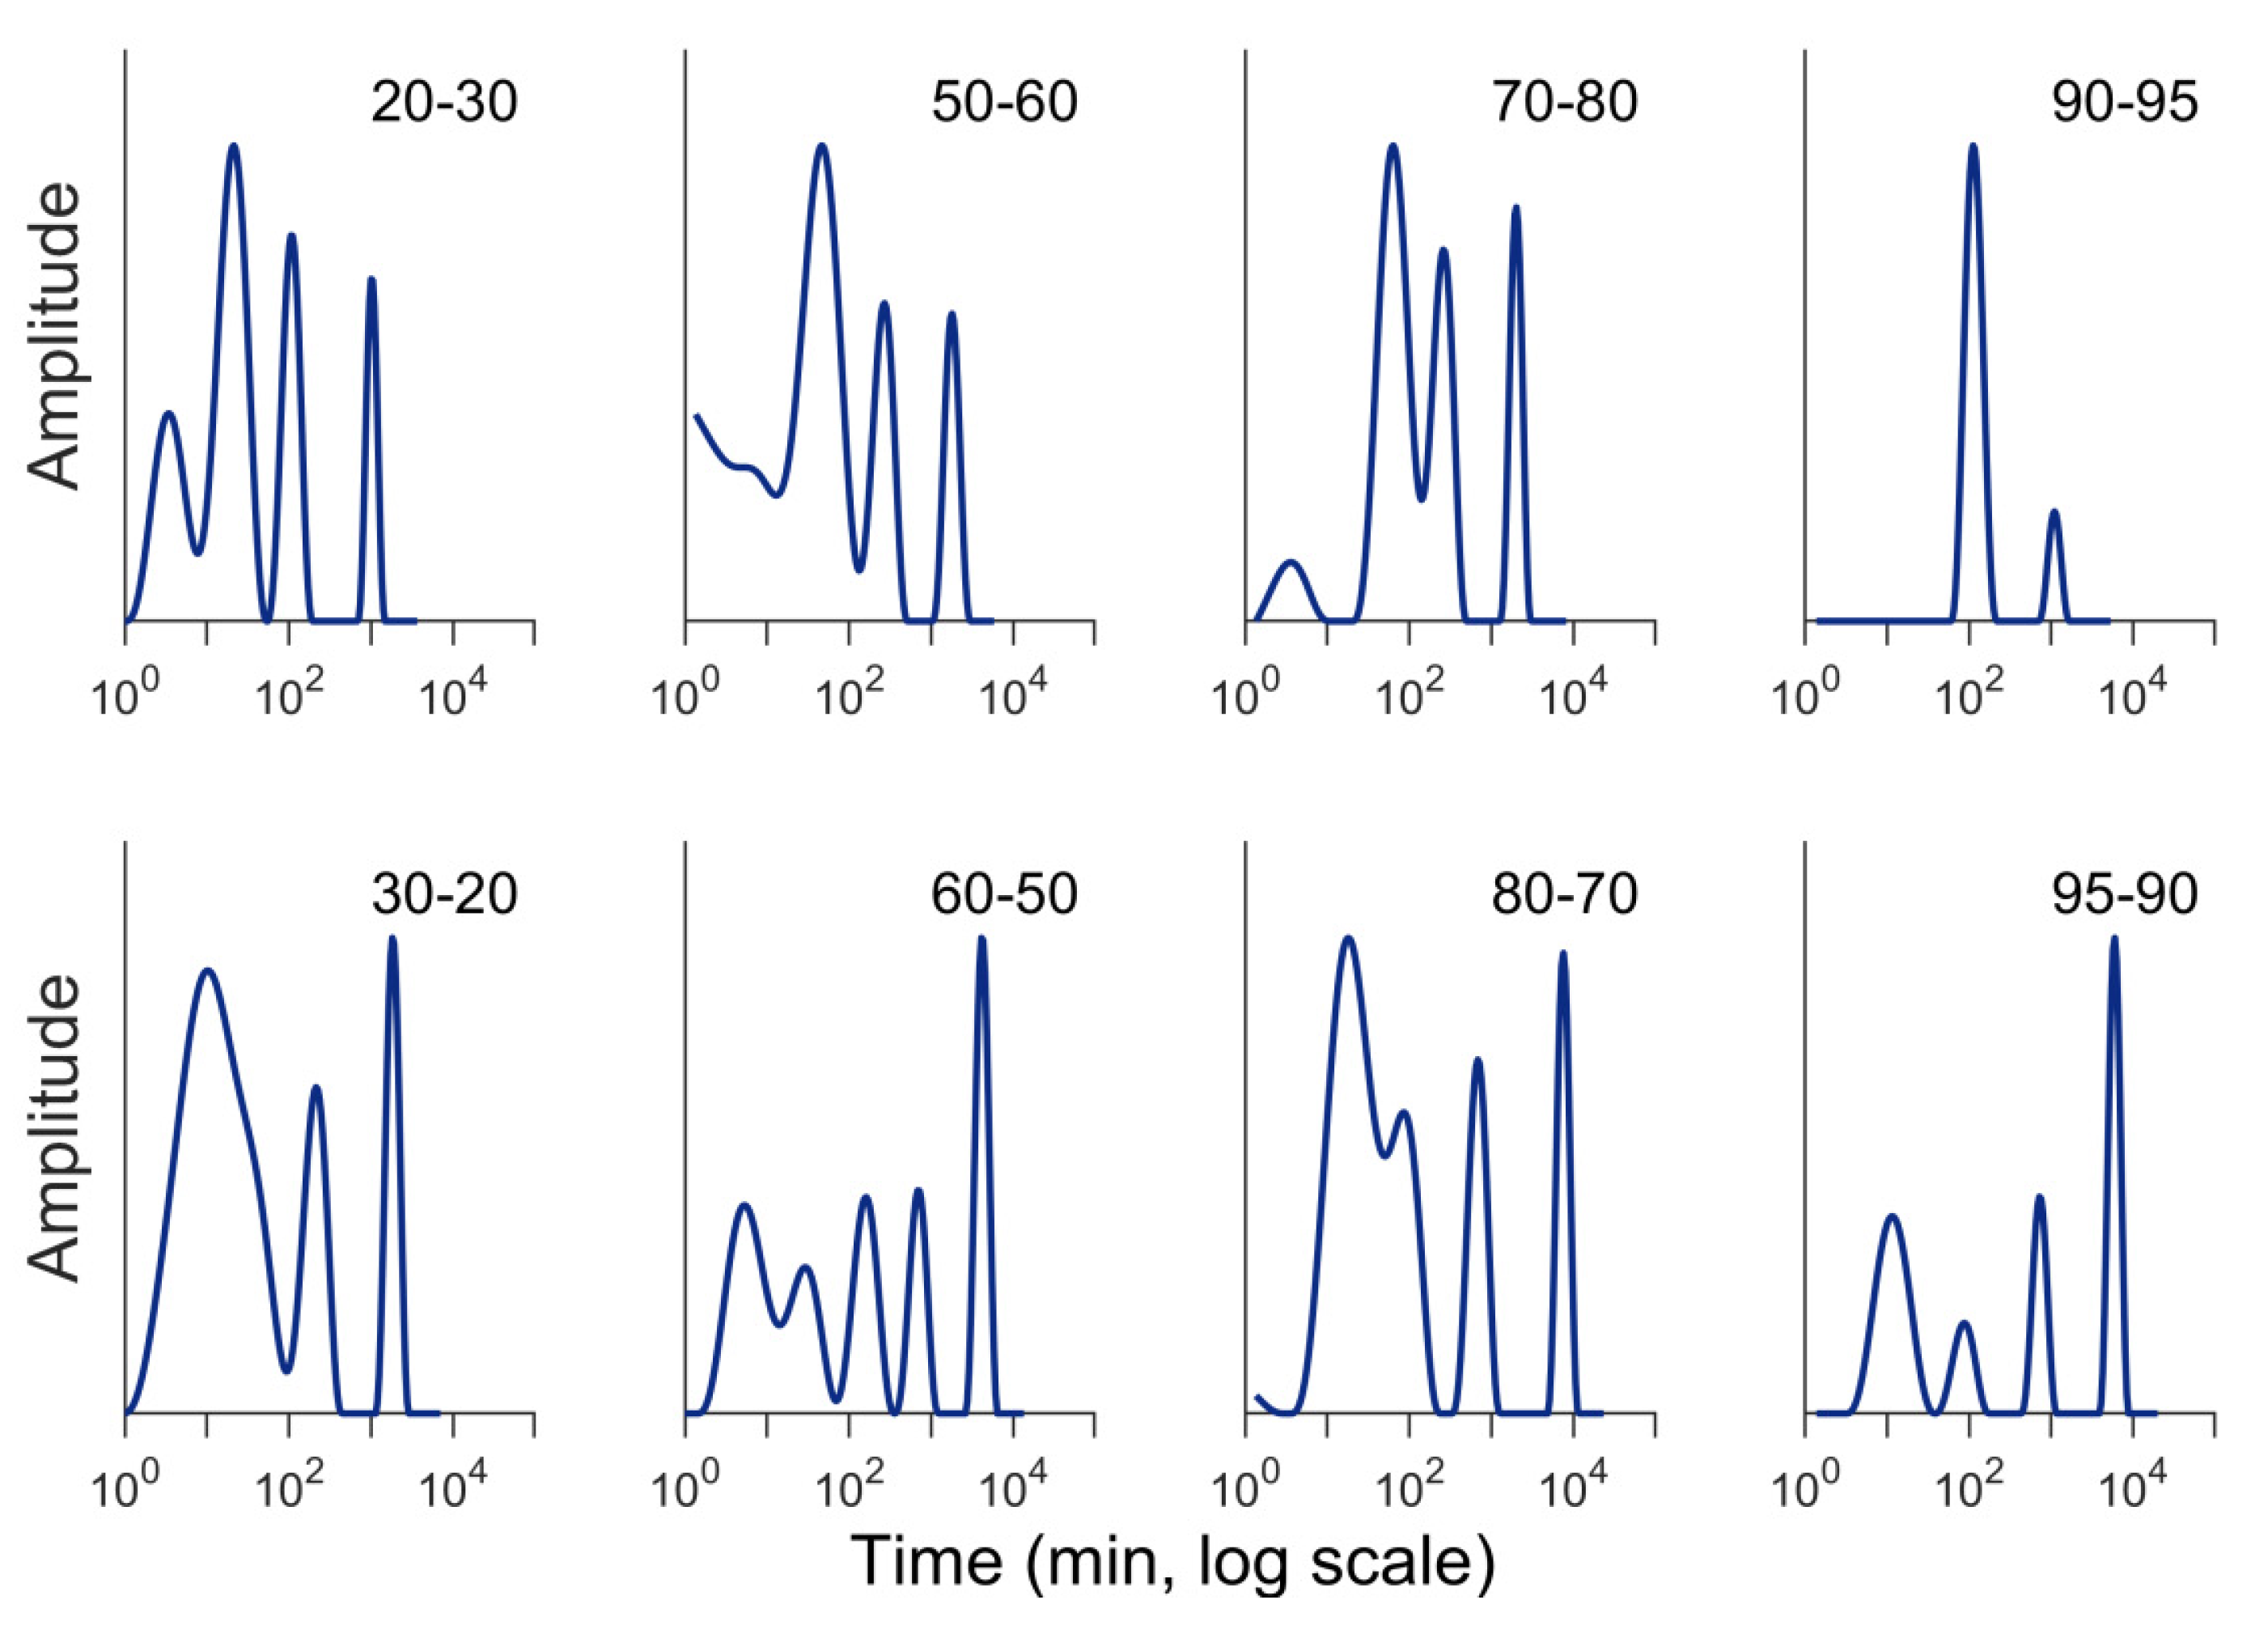
Thybring et al. [139] introduced a new data-driven approach for the analysis of sorption kinetic data, known as multi-exponential decay analysis (MEDEA). This approach yields spectra indicating the number of characteristic time constants for kinetic data collected to equilibrium after a given RH step, as shown in Figure 9. In every case, except for one, three, or more, time constants were observed. This analysis explains why the PEK model parameters change depending on data collection time. The variation in the number of time constants (Figure 9) also suggests that simply increasing the number of exponential components (n in Equation (7)) would not give a model that is generally suitable.

6. Conclusions and Perspective on Research Needs

This paper summarizes the current state of knowledge of water vapor sorption kinetics. Despite previous research efforts in this area, it is clear that fundamental information about the governing physical phenomena behind the observed sorption kinetics is still lacking. While several theoretical models exist for describing sorption kinetics, they cannot fully describe the sorption process phenomenologically. Some of the models are contradicted by published experimental data, and other models lack experimental evidence supporting their physical parameters.
Simple sorption kinetic measurements, where only the mass is monitored as a function of time, are insufficient for building and testing sorption kinetic models because the sorption process is so complex. Models may need to account for temperature changes, dimensional changes, or changes in polymer mobility. Therefore, it is necessary to design experiments that measure as many of these changes as possible during the sorption process itself. This would require introducing new experimental techniques to the wood science field either by adapting existing techniques from other research fields or through development of novel techniques.
There are several possibilities for obtaining data to improve our understanding of sorption kinetics. In general, these can be explored by varying one of the parameters in Section 4 along with a measurement of the sorption kinetics. For example, the effect of dimensional changes, surface diffusion, and internal stresses could be examined by probing much smaller in specimen size, potentially by using a quartz crystal microbalance. Another possibility for testing the effect of structure would be to examine wood species or cell types with especially thick or thin cell walls. Finally, a localized measurement of surface temperature or surface concentration would be an ideal tool to build and verify sorption kinetic models.
In short, new, complex experimental techniques will need to be introduced to this research topic to fully understand the kinetics of sorption. However, just as automated sorption balances have gone from becoming an exotic to common scientific instrument, the future decade(s) may see the advent of a host of new, low-cost surface measurement techniques that make these seemingly large obstacles obtainable. Therefore, it is hoped that this review has summarized the types of measurements that will advance our understanding of sorption kinetics even further.

Author Contributions

Conceptualization, E.E.T., S.V.G., and S.L.Z.; formal analysis, E.E.T., S.V.G., and S.L.Z.; investigation, E.E.T., S.V.G., and S.L.Z.; writing—original draft preparation, E.E.T., S.V.G., and S.L.Z.; writing—review and editing, E.E.T., S.V.G., and S.L.Z.; visualization, E.E.T., S.V.G., and S.L.Z.

Funding

Funding was provided by the U.S. Forest Service.

Acknowledgments

The authors thank Kiefer and Robens for reminding us how central the study of sorption has been to humankind for millennia. The authors recognize Cynthia Brewer and the team behind ColorBrewer2.org for inspiration regarding colors in diagrams.

Conflicts of Interest

The authors declare no conflict of interest.

References

  1. Green, M.C.; Karsh, J.E. The Case for Tall Wood Buildings—How Mass Timber Offers a Safe, Economical, and Environmental Friendly Alternative for Tall Building Structures; MGB Architecture + Design: Vancouver, BC, Canada, 2012; pp. 1–237. [Google Scholar]
  2. Iqbal, A. Recent developments in tall wood buildings. In Proceedings of the 1st International Conference on New Horizons in Green Civil Engineering, Victoria, BC, Canada, 25–27 April 2018; pp. 111–116. [Google Scholar]
  3. Jakes, J.E.; Arzola, X.; Bergman, R.; Ciesielski, P.; Hunt, C.G.; Rahbar, N.; Tshabalala, M.; Wiedenhoeft, A.C.; Zelinka, S.L. Not Just Lumber—Using Wood in the Sustainable Future of Materials, Chemicals, and Fuels. JOM 2016, 68, 2395–2404. [Google Scholar] [CrossRef]
  4. Thybring, E.E.; Kymäläinen, M.; Rautkari, L. Experimental techniques for characterising water in wood covering the range from dry to fully water-saturated. Wood Sci. Technol. 2018, 52, 297–329. [Google Scholar] [CrossRef]
  5. Fredriksson, M.; Thybring, E.E. Scanning or desorption isotherms? Characterising sorption hysteresis of wood. Cellulose 2018, 25, 4477–4485. [Google Scholar] [CrossRef] [Green Version]
  6. Hoffmeyer, P.; Engelund, E.T.; Thygesen, L.G. Equilibrium moisture content (EMC) in Norway spruce during the first and second desorptions. Holzforschung 2011, 65, 875–882. [Google Scholar] [CrossRef]
  7. Engelund, E.T.; Thygesen, L.G.; Svensson, S.; Hill, C.A.S. A critical discussion of the physics of wood-water interactions. Wood Sci. Technol. 2013, 47, 141–161. [Google Scholar] [CrossRef]
  8. Glass, S.V.; Boardman, C.R.; Thybring, E.E.; Zelinka, S.L. Quantifying and reducing errors in equilibrium moisture content measurements with dynamic vapor sorption (DVS) experiments. Wood Sci. Technol. 2018, 52, 909–927. [Google Scholar] [CrossRef] [Green Version]
  9. Stamm, A.J. Wood and Cellulose Science; The Ronald Press Company: New York, NY, USA, 1964. [Google Scholar]
  10. Skaar, C. Wood-Water Relations; Springer: New York, NY, USA, 1988. [Google Scholar]
  11. Siau, J.F. Wood: Influence of Moisture on Physical Properties; Department of Wood Science and Forest Products, Virginia Polytechnic Institute and State University: Blacksburg, VA, USA, 1995. [Google Scholar]
  12. Kiefer, S.; Robens, E. Some intriguing items in the history of volumetric and gravimetric adsorption measurements. J. Therm. Anal. Calorim. 2008, 94, 613–618. [Google Scholar] [CrossRef]
  13. Zeller, S.M. Humidity in Relation to Moisture Imbibition by Wood and to Spore Germination on Wood. Ann. Mo. Bot. Gard. 1920, 7, 51. [Google Scholar] [CrossRef]
  14. Glass, S.V.; Zelinka, S.L.; Johnson, J.A. Investigation of Historic Equilibrium Moisture Content Data from the Forest Products Laboratory; FPL-GTR-229; US Department of Agriculture, Forest Service, Forest Products Laboratory: Madison, WI, USA, 2014. [CrossRef]
  15. Hedlin, C.P. Sorption isotherms of twelve woods at subfreezing temperatures. For. Prod. J. 1968, 17, 43–48. [Google Scholar]
  16. Strømdahl, K. Water Sorption in Wood and Plant Fibres. Ph.D. Thesis, Technical University of Denmark, Lyngby, Denmark, 2000. [Google Scholar]
  17. Perre, P. Experimental device for the accurate determination of wood-water relations on micro-samples. Holzforschung 2007, 61, 419–429. [Google Scholar] [CrossRef]
  18. Zelinka, S.L.; Bourne, K.J.; Glass, S.V.; Boardman, C.R.; Lorenz, L.; Thybring, E.E. Apparatus for gravimetric measurement of moisture sorption isotherms for 1-100 g samples in parallel. Wood Fiber Sci. 2018, 50, 244–253. [Google Scholar] [CrossRef]
  19. Skaar, C.; Prichananda, C.; Davidson, R.W. Some aspects of moisture sorption dynamics in wood. Wood Sci. 1970, 2, 179–185. [Google Scholar]
  20. Comstock, G.L. Moisture diffusion coefficients in wood as calculated from adsorption, desorption, and steady state data. For. Prod. J. 1963, 13, 97–103. [Google Scholar]
  21. Choong, E.T.; Fogg, P.J. Moisture movement in six wood species. For. Prod. J. 1968, 18, 66–70. [Google Scholar]
  22. McNamara, W.S.; Hart, C.A. An analysis of interval and average diffusion coefficients for unsteady-state movement of moisture in wood. Wood Sci. 1971, 4, 37–45. [Google Scholar]
  23. Wadsö, L. Measurements of water vapour sorption in Wood Part 1. Instrumentation. Wood Sci. Technol. 1993, 27, 396–400. [Google Scholar] [CrossRef]
  24. Time, B. Hygroscopic Moisture Transport in Wood. Ph.D. Thesis, Norwegian University of Science and Technology, Trondheim, Norway, 1998. [Google Scholar]
  25. Håkansson, H. Retarded Sorption in Wood—Experimental Study, Analysis and Modelling. Ph.D. Thesis, Lund University, Lund, Sweden, 1998. [Google Scholar]
  26. Eitelberger, J.; Svensson, S. The sorption behavior of wood studied by means of an improved cup method. Transp. Porous Med. 2012, 92, 321–335. [Google Scholar] [CrossRef]
  27. Larian, M.; Lavine, I.; Mann, C.A.; Gauger, A.W. II—Sorption of water vapor by lignite, peat, and wood. Ind. Eng. Chem. 1930, 22, 1231–1234. [Google Scholar] [CrossRef]
  28. Lavine, I.; Gauger, A.W. Studies in the development of Dakota lignite. Ind. Eng. Chem. 1930, 22, 1226–1231. [Google Scholar] [CrossRef]
  29. Wadsö, L.; Svennberg, K.; Dueck, A. An experimentally simple method for measuring sorption isotherms. Dry. Technol. 2004, 22, 2427–2440. [Google Scholar] [CrossRef]
  30. Suchsland, O. Determination of sorption isotherms in minidesiccators. Wood Sci. 1980, 12, 214–217. [Google Scholar]
  31. Goulet, M. Phénomènes DE Second Ordre DE La Sorption D’Humidité Dans Le Bois AU Terme D’Un Conditionnement DE Trois Mois à Température Normale; Université Laval: Quebec City, QC, Canada, 1968; pp. 1–30. [Google Scholar]
  32. Greenspan, L. Humidity fixed points of binary saturated aqueous solutions. J. Res. Natl. Bur. Stand. Sect. A Phys. Chem. 1977, 81, 89. [Google Scholar] [CrossRef]
  33. McBain, J.W.; Bakr, A.M. A New Sorption Balance 1. J. Am. Chem. Soc. 1926, 48, 690–695. [Google Scholar] [CrossRef]
  34. Pidgeon, L.M.; Maass, O. The adsorption of water by wood. J. Am. Chem. Soc. 1930, 52, 1053–1069. [Google Scholar] [CrossRef]
  35. Pidgeon, L.M.; Maass, O. The penetration of water vapor into wood. Can. J. Res. 1930, 2, 318–326. [Google Scholar] [CrossRef]
  36. Stamm, A.J.; Woodruff, S.A. A convenient six-tube vapor sorption apparatus. Ind. Eng. Chem. 1941, 13, 0836–0838. [Google Scholar] [CrossRef]
  37. Kelsey, K.E. The sorption of water vapour by wood. Aust. J. Appl. Sci. 1957, 8, 42–54. [Google Scholar]
  38. Christensen, G.N.; Kelsey, K.E. The rate of sorption of water vapor by wood. Holz Roh Werkst 1959, 17, 178–188. [Google Scholar] [CrossRef]
  39. Christensen, G.N. The rate of sorption of water vapour by wood and pulp. Appita J. 1959, 13, 112–123. [Google Scholar]
  40. Christensen, G.N. Kinetics of sorption of water vapour by wood. Aust. J. Appl. Sci. 1960, 11, 295–304. [Google Scholar]
  41. Weichert, L. Investigations on sorption and swelling of spruce, beech and compressed beech wood at temperatures between 20 °C and 100 °C. Holz Roh Werkst 1963, 21, 290–300. [Google Scholar] [CrossRef]
  42. Spalt, H.A. The fundamentals of water sorption by wood. For. Prod. J. 1958, 8, 288–295. [Google Scholar]
  43. Kelly, M.W.; Hart, C.A. Water vapor sorption rates by wood cell walls. Wood Fiber Sci. 1970, 1, 270–282. [Google Scholar]
  44. Spalt, H.A. The sorption of water vapor by domestic and tropical woods. For. Prod. J. 1957, 7, 331–335. [Google Scholar]
  45. Sandstede, G.; Robens, E. Automatisierte Apparatur zur gravimetrischen Messung der Gassorption, insbesondere für die Bestimmung der spezifischen Oberfläche und der Porengröße. Chem. Ing. Tech. 1962, 34, 708–713. [Google Scholar] [CrossRef]
  46. Czanderna, A.; Vasofsky, R. Surface studies with the vacuum microbalance. Prog. Surf. Sci. 1979, 9, 45–82. [Google Scholar] [CrossRef]
  47. Rasmussen, M.D. Microcomputer-controlled gravimetric adsorption apparatus. Rev. Sci. Instrum. 1983, 54, 1558. [Google Scholar] [CrossRef]
  48. Buckton, G.; Beezer, A.E.; Newton, J.M. A vacuum microbalance technique for studies on the wettability of powders. J. Pharm. Pharmacol. 1986, 38, 713–720. [Google Scholar] [CrossRef]
  49. Astill, D.M.; Hall, P.L.; McConnell, J.D.C. An automated vacuum microbalance for measurement of adsorption isotherms. J. Phys. E Sci. Instrum. 1987, 20, 19–21. [Google Scholar] [CrossRef]
  50. Benham, M.J.; Ross, D.K. Experimental determination of absorption-desorption isotherms by computer-controlled gravimetric analysis. Z. Phys. Chem. 1989, 163, 25. [Google Scholar] [CrossRef]
  51. Jakieła, S.; Bratasz, Ł.; Kozłowski, R. Numerical modelling of moisture movement and related stress field in lime wood subjected to changing climate conditions. Wood Sci. Technol. 2008, 42, 21–37. [Google Scholar] [CrossRef]
  52. Bratasz, Ł.; Kozłowska, A.; Kozłowski, R. Analysis of water adsorption by wood using the Guggenheim-Anderson-de Boer equation. Holz Roh Werkst 2012, 70, 445–451. [Google Scholar] [CrossRef]
  53. Bergren, M.S. An automated controlled atmosphere microbalance for the measurement of moisture sorption. Int. J. Pharm. 1994, 103, 103–114. [Google Scholar] [CrossRef]
  54. Marshall, P.V.; Cook, P.A.; Williams, D.R. A new analytical technique for characterising the water vapour sorption properties of powders. In Proceedings of the International Symposium on Solid Oral Dosage Forms, Swedish Academy of Pharmaceutical Sciences, Stockholm, Sweden, 7–9 February 1994; p. 19A. [Google Scholar]
  55. Williams, D.R. The characterisation of powders by gravimetric water vapour sorption. Int. Labmate 1995, 20, 40–42. [Google Scholar]
  56. Murr, A.; Lackner, R. Analysis on the influence of grain size and grain layer thickness on the sorption kinetics of grained wood at low relative humidity with the use of water vapour sorption experiments. Wood Sci. Technol. 2018, 52, 753–776. [Google Scholar] [CrossRef] [Green Version]
  57. Thorell, A.; Wadsö, L. Determination of external mass transfer coefficients in dynamic sorption (DVS) measurements. Dry. Technol. 2018, 36, 332–340. [Google Scholar] [CrossRef]
  58. Christensen, G.N. The rate of sorption of water vapor by thin materials. In Volume Four: Principles and Methods of Measuring Moisture in Liquids and Solids, 1st ed.; Winn, P.N., Ed.; Reinhold Publishing Corporation: New York, NY, USA, 1965; pp. 279–293. [Google Scholar]
  59. Wadsö, L. Measurements of water-vapor sorption in wood. Part 2. Results. Wood Sci. Technol. 1993, 28, 59–65. [Google Scholar] [CrossRef]
  60. Christensen, G.N.; Hergt, H.F.A. Effect of previous history on kinetics of sorption by wood cell walls. J. Polym. Sci. Part A1 Polym. Chem. 1969, 7, 2427–2430. [Google Scholar] [CrossRef]
  61. Kelsey, K.E.; Clarke, L.N. The heat of sorption of water by wood. Aust. J. Appl. Sci. 1956, 7, 160–175. [Google Scholar]
  62. Hearmon, R.F.S.; Burcham, J.N. Specific heat and heat of wetting of wood. Nature 1955, 176, 978. [Google Scholar] [CrossRef]
  63. Kühlmann, G. Untersuchung der thermischen Eigenschaften von Holz und Spanplatten in Abhängigkeit von Feuchtigkeit und Temperatur im hygroskopischen Bereich. Holz Roh Werkst 1962, 20, 259–270. [Google Scholar] [CrossRef]
  64. Lee, L.-K.; Ruthven, D.M. Analysis of thermal effects in adsorption rate measurements. J. Chem. Soc. Faraday Trans. 1 Phys. Chem. Condens. Phases 1979, 75, 2406–2422. [Google Scholar] [CrossRef]
  65. Wang, P.; Meldon, J.H.; Sung, N. Heat effects in sorption of organic vapors in rubbery polymers. J. Appl. Polym. Sci. 1996, 59, 937–944. [Google Scholar] [CrossRef]
  66. Chihara, K.; Suzuki, M.; Kawazoe, K. Effect of heat generation on measurement of adsorption rate by gravimetric method. Chem. Eng. Sci. 1976, 31, 505–507. [Google Scholar] [CrossRef]
  67. Papadopoulos, A.N.; Hill, C.A.S.; Gkaraveli, A. Determination of surface area and pore volume of holocellulose and chemically modified wood flour using the nitrogen adsorption technique. Holz Roh Werkst 2003, 61, 453–456. [Google Scholar] [CrossRef]
  68. Rafsanjani, A.; Stiefel, M.; Jefimovs, K.; Mokso, R.; Derome, D.; Carmeliet, J. Hygroscopic swelling and shrinkage of latewood cell wall micropillars reveal ultrastructural anisotropy. J. R. Soc. Interface 2014, 11. [Google Scholar] [CrossRef]
  69. Murata, K.; Masuda, M. Microscopic observation of transverse swelling of latewood tracheid: Effect of macroscopic/mesoscopic structure. J. Wood. Sci. 2006, 52, 283–289. [Google Scholar] [CrossRef]
  70. Patera, A.; Van den Bulcke, J.; Boone, M.N.; Derome, D.; Carmeliet, J. Swelling interactions of earlywood and latewood across a growth ring: Global and local deformations. Wood Sci. Technol. 2018, 52, 91–114. [Google Scholar] [CrossRef]
  71. Seifert, J. Sorption and swelling of wood and wood base materials.2. Swelling behavior of wood and wood base materials. Holz Roh Werkst 1972, 30, 294–303. [Google Scholar] [CrossRef]
  72. Hartley, I.D.; Avramidis, S. Static dimensional changes of Sitka spruce and Western hemlock influenced by sorption conditions. J. Inst. Wood Sci. 1996, 14, 83–88. [Google Scholar]
  73. Ma, Q.; Rudolph, V. Dimensional change behavior of Carribean pine using an environmental scanning electron microscope. Dry. Technol. 2006, 24, 1397–1403. [Google Scholar] [CrossRef]
  74. Salmén, L.; Burgert, I. Cell wall features with regard to mechanical performance. A review COST Action E35 2004-2008: Wood machining—Micromechanics and fracture. Holzforschung 2009, 63, 121–129. [Google Scholar] [CrossRef]
  75. Salmén, L.; Bergström, E. Cellulose structural arrangement in relation to spectral changes in tensile loading FTIR. Cellulose 2009, 16, 975–982. [Google Scholar] [CrossRef]
  76. Matthews, J.F.; Skopec, C.E.; Mason, P.E.; Zuccato, P.; Torget, R.W.; Sugiyama, J.; Himmel, M.E.; Brady, J.W. Computer simulation studies of microcrystalline cellulose Iβ. Carbohydr. Res. 2006, 341, 138–152. [Google Scholar] [CrossRef] [PubMed]
  77. Thybring, E.E.; Thygesen, L.G.; Burgert, I. Hydroxyl accessibility in wood cell walls as affected by drying and re-wetting procedures. Cellulose 2017, 24, 2375–2384. [Google Scholar] [CrossRef] [Green Version]
  78. Christensen, G.N.; Kelsey, K.E. The sorption of water vapor by the constituents of wood. Holz Roh Werkst 1959, 17, 189–203. [Google Scholar] [CrossRef]
  79. Fernandes, A.N.; Thomas, L.H.; Altaner, C.M.; Callow, P.; Forsyth, V.T.; Apperley, D.C.; Kennedy, C.J.; Jarvis, M.C. Nanostructure of cellulose microfibrils in spruce wood. Proc. Natl. Acad. Sci. USA 2011, 108, E1195–E1203. [Google Scholar] [CrossRef]
  80. Blomberg, J.; Persson, B. Swelling pressure of semi-isostatically densified wood under different mechanical restraints. Wood Sci. Technol. 2007, 41, 401–415. [Google Scholar] [CrossRef]
  81. Mazzanti, P.; Colmars, J.; Gril, J.; Hunt, D.; Uzielli, L. A hygro-mechanical analysis of poplar wood along the tangential direction by restrained swelling test. Wood Sci. Technol. 2014, 48, 673–687. [Google Scholar] [CrossRef] [Green Version]
  82. Tarkow, H.; Turner, H.D. The swelling pressure of wood. For. Prod. J. 1958, 8, 193–197. [Google Scholar]
  83. Plaza, N.Z.; Pingali, S.V.; Qian, S.; Heller, W.T.; Jakes, J.E. Informing the improvement of forest products durability using small angle neutron scattering. Cellulose 2016, 23, 1593–1607. [Google Scholar] [CrossRef]
  84. Chen, W.; Lickfield, G.C.; Yang, C.Q. Molecular modeling of cellulose in amorphous state. Part I: Model building and plastic deformation study. Polymer 2004, 45, 1063–1071. [Google Scholar] [CrossRef]
  85. Bonfield, P.W.; Mundy, J.; Robson, D.J.; Dinwoodie, J.M. The modelling of time-dependant deformation in wood using chemical kinetics. Wood Sci. Technol. 1996, 30, 105–115. [Google Scholar] [CrossRef]
  86. Yoon, J.; Cai, S.; Suo, Z.; Hayward, R.C. Poroelastic swelling kinetics of thin hydrogel layers: Comparison of theory and experiment. Soft Matter 2010, 6, 6004. [Google Scholar] [CrossRef]
  87. Petropoulos, J.H.; Sanopoulou, M.; Papadokostaki, K.G. Physically insightful modeling of non-Fickian kinetic regimes encountered in fundamental studies of isothermal sorption of swelling agents in polymeric media. Eur. Polym. J. 2011, 47, 2053–2062. [Google Scholar] [CrossRef]
  88. Crank, J. A theoretical investigation of the influence of molecular relaxation and internal stress on diffusion in polymers. J. Polym. Sci. 1953, 11, 151–168. [Google Scholar] [CrossRef]
  89. Neumann, S.; Marom, G. Prediction of moisture diffusion parameters in composite materials under stress. J. Compos. Mater. 1987, 21, 68–80. [Google Scholar] [CrossRef]
  90. Neumann, S.; Marom, G. Free-volume dependent moisture diffusion under stress in composite materials. J. Mater. Sci. 1986, 21, 26–30. [Google Scholar] [CrossRef]
  91. Roy, S.; Vengadassalam, K.; Wang, Y.; Park, S.; Liechti, K.M. Characterization and modeling of strain assisted diffusion in an epoxy adhesive layer. Int. J. Solids Struct. 2006, 43, 27–52. [Google Scholar] [CrossRef] [Green Version]
  92. Yaniv, G.; Ishai, O. Coupling between stresses and moisture diffusion in polymeric adhesives. Polym. Eng. Sci. 1987, 27, 731–739. [Google Scholar] [CrossRef]
  93. Hui, C.Y.; Wu, K.C.; Lasky, R.C.; Kramer, E.J. Case II diffusion in polymers.1. Transient swelling. J. Appl. Phys. 1987, 61, 5129–5136. [Google Scholar] [CrossRef]
  94. Long, F.A.; Richman, D. Concentration gradients for diffusion of vapors in glassy polymers and their relation to time dependent diffusion phenomena. J. Am. Chem. Soc. 1960, 82, 513–519. [Google Scholar] [CrossRef]
  95. Long, F.A.; Watt, I. Concentration gradients during sorption of vapor into polymers in the glassy state. J. Polym. Sci. 1956, 21, 554–557. [Google Scholar] [CrossRef]
  96. Newns, A.C. The sorption and desorption kinetics of water in a regenerated cellulose. Trans. Faraday Soc. 1956, 52, 1533–1545. [Google Scholar] [CrossRef]
  97. Crank, J.; Park, G.S. Diffusion in high polymers: Some anomalies and their significance. Trans. Faraday Soc. 1951, 47, 1072–1084. [Google Scholar] [CrossRef]
  98. Bagley, E.; Long, F.A. Two-stage sorption and desorption of organic vapors in cellulose acetate. J. Am. Chem. Soc. 1955, 77, 2172–2178. [Google Scholar] [CrossRef]
  99. Sadoh, T.; Christensen, G.N. Rate of sorption of water vapour by hemicellulose. Aust. J. Appl. Sci. 1964, 15, 297–308. [Google Scholar]
  100. Irvine, G.M. The glass transitions of lignin and hemicellulose and their measurement by differential thermal-analysis. Tappi J. 1984, 67, 118–121. [Google Scholar]
  101. Kelley, S.S.; Rials, T.G.; Glasser, W.G. Relaxation behavior of the amorphous components of wood. J. Mater. Sci. Lett. 1987, 22, 617–624. [Google Scholar] [CrossRef]
  102. Olsson, A.M.; Salmén, L. The softening behavior of hemicelluloses related to moisture. ACS Symp. Ser. 2004, 864, 184–197. [Google Scholar] [CrossRef]
  103. Paes, S.S.; Sun, S.M.; MacNaughtan, W.; Ibbett, R.; Ganster, J.; Foster, T.J.; Mitchell, J.R. The glass transition and crystallization of ball milled cellulose. Cellulose 2010, 17, 693–709. [Google Scholar] [CrossRef]
  104. Szcześniak, L.; Rachocki, A.; Tritt-Goc, J. Glass transition temperature and thermal decomposition of cellulose powder. Cellulose 2008, 15, 445–451. [Google Scholar] [CrossRef]
  105. Zelinka, S.L.; Glass, S.V.; Jakes, J.E.; Stone, D.S. A solution thermodynamics definition of the fiber saturation point and the derivation of a wood–water phase (state) diagram. Wood Sci. Technol. 2016, 50, 443–462. [Google Scholar] [CrossRef]
  106. Duda, J.L.; Vrentas, J.S.; Ju, S.T.; Liu, H.T. Prediction of diffusion coefficients for polymer-solvent systems. AIChE J. 1982, 28, 279–285. [Google Scholar] [CrossRef]
  107. Matsuoka, S.; Bair, H.E.; Bearder, S.S.; Kern, H.E.; Ryan, J.T. Analysis of non-linear stress relaxation in polymeric glasses. Polym. Eng. Sci. 1978, 18, 1073–1080. [Google Scholar] [CrossRef]
  108. Crank, J. The Mathematics of Diffusion, 2nd ed.; Clarendon Press: Oxford, UK, 1975. [Google Scholar]
  109. Frisch, H.L.; Stern, S.A. Diffusion of small molecules in polymers. Crit. Rev. Solid State Mater. Sci. 1983, 11, 123–187. [Google Scholar] [CrossRef]
  110. Crank, J. Some methods of deducing the diffusion coefficient and its concentration dependence from sorption experiments. Trans. Faraday Soc. 1955, 51, 1632. [Google Scholar] [CrossRef]
  111. Stamm, A.J. Diffusion of water into uncoated cellophane.2. From steady-state diffusion measurements. J. Phys. Chem. 1956, 60, 83–86. [Google Scholar] [CrossRef]
  112. Hansen, N.M.L.; Blomfeldt, T.O.J.; Hedenqvist, M.S.; Plackett, D.V. Properties of plasticized composite films prepared from nanofibrillated cellulose and birch wood xylan. Cellulose 2012, 19, 2015–2031. [Google Scholar] [CrossRef]
  113. Heikkilä, M.I.; Willför, S.M.; Mikkonen, K.S.; Tenkanen, M. Films from Glyoxal-Crosslinked Spruce Galactoglucomannans Plasticized with Sorbitol. Int. J. Polym. Sci. 2012, 2012, 1–8. [Google Scholar] [CrossRef] [Green Version]
  114. Stamm, A.J. Bound water diffusion into wood in the fiber direction. For. Prod. J. 1959, 9, 27–32. [Google Scholar]
  115. Taguchi, A.; Murata, K.; Nakano, T. Observation of cell shapes in wood cross-sections during water adsorption by confocal laser-scanning microscopy (CLSM). Holzforschung 2010, 64, 627–631. [Google Scholar] [CrossRef] [Green Version]
  116. Wadsö, L. A test of different methods to evaluate the diffusivity from unsteady-state sorption measurements. Dry. Technol. 1994, 12, 1863–1876. [Google Scholar] [CrossRef]
  117. Sanopoulou, M.; Roussis, P.P.; Petropoulos, J.H. A detailed study of the viscoelastic nature of vapor sorption and transport in a cellulosic polymer. I. Origin and physical implications of deviations from Fickian sorption kinetics. J. Polym. Sci. Part B Polym. Phys. 1995, 33, 993–1005. [Google Scholar] [CrossRef]
  118. Joshi, S.; Astarita, G. Diffusion-relaxation coupling in polymers which show two-stage sorption phenomena. Polymer 1979, 20, 455–458. [Google Scholar] [CrossRef]
  119. Berens, A.R.; Hopfenberg, H.B. Diffusion and relaxation in glassy polymer powders: 2. Separation of diffusion and relaxation parameters. Polymer 1978, 19, 489–496. [Google Scholar] [CrossRef] [Green Version]
  120. Camera-Roda, G.; Sarti, G.C. Mass transport with relaxation in polymers. AIChE J. 1990, 36, 851–860. [Google Scholar] [CrossRef]
  121. Meng, Y.; Xia, Y.; Young, T.M.; Cai, Z.; Wang, S. Viscoelasticity of wood cell walls with different moisture content as measured by nanoindentation. RSC Adv. 2015, 5, 47538–47547. [Google Scholar] [CrossRef]
  122. Kojima, Y.; Yamamoto, H. Effect of moisture content on the longitudinal tensile creep behavior of wood. J. Wood Sci. 2005, 51, 462–467. [Google Scholar] [CrossRef]
  123. Olsson, A.M.; Salmén, L.; Eder, M.; Burgert, I. Mechano-sorptive creep in wood fibres. Wood Sci. Technol. 2007, 41, 59–67. [Google Scholar] [CrossRef]
  124. Willems, W. Thermally limited wood moisture changes: Relevance for dynamic vapour sorption experiments. Wood Sci. Technol. 2017, 51, 751–770. [Google Scholar] [CrossRef]
  125. Kohler, R.; Dück, R.; Ausperger, B.; Alex, R. A numeric model for the kinetics of water vapor sorption on cellulosic reinforcement fibers. Compos. Interface 2003, 10, 255–276. [Google Scholar] [CrossRef]
  126. Hill, C.A.S.; Norton, A.; Newman, G. Analysis of the water vapour sorption behaviour of Sitka spruce [Picea sitchensis (Bongard) Carr.] based on the parallel exponential kinetics model. Holzforschung 2010, 64, 469–473. [Google Scholar] [CrossRef]
  127. Kohler, R.; Alex, R.; Brielmann, R.; Ausperger, B. A New Kinetic Model for Water Sorption Isotherms of Cellulosic Materials. Macromol. Symp. 2006, 244, 89–96. [Google Scholar] [CrossRef]
  128. Kachrimanis, K.; Noisternig, M.F.; Griesser, U.J.; Malamataris, S. Dynamic moisture sorption and desorption of standard and silicified microcrystalline cellulose. Eur. J. Pharm. Biopharm. 2006, 64, 307–315. [Google Scholar] [CrossRef] [PubMed]
  129. Okubayashi, S.; Griesser, U.; Bechtold, T. A kinetic study of moisture sorption and desorption on lyocell fibers. Carbohydr. Polym. 2004, 58, 293–299. [Google Scholar] [CrossRef]
  130. Okubayashi, S.; Griesser, U.J.; Bechtold, T. Moisture sorption/desorption behavior of various manmade cellulosic fibers. J. Appl. Polym. Sci. 2005, 97, 1621–1625. [Google Scholar] [CrossRef]
  131. Zaihan, J.; Hill, C.A.S.; Curling, S.; Hashim, W.S.; Hamdan, H. The kinetics of water vapour sorption: Analysis using parallel exponential kinetics model on six Malaysian hardwoods. J. Trop. For. Sci. 2010, 22, 107–117. [Google Scholar]
  132. Belbekhouche, S.; Bras, J.; Siqueira, G.; Chappey, C.; Lebrun, L.; Khelifi, B.; Marais, S.; Dufresne, A. Water sorption behavior and gas barrier properties of cellulose whiskers and microfibrils films. Carbohydr. Polym. 2011, 83, 1740–1748. [Google Scholar] [CrossRef]
  133. Cordin, M.; Griesser, U.J.; Bechtold, T. Analysis of moisture sorption in lyocell-polypropylene composites. Cellulose 2017, 24, 1837–1847. [Google Scholar] [CrossRef]
  134. Guo, X.; Wu, Y.; Xie, X. Water vapor sorption properties of cellulose nanocrystals and nanofibers using dynamic vapor sorption apparatus. Sci. Rep. 2017, 7, 14207. [Google Scholar] [CrossRef] [PubMed]
  135. Xie, Y.J.; Hill, C.A.S.; Xiao, Z.F.; Jalaludin, Z.; Militz, H.; Mai, C. Water vapor sorption kinetics of wood modified with glutaraldehyde. J. Appl. Polym. Sci. 2010, 117, 1674–1682. [Google Scholar] [CrossRef]
  136. Hill, C.A.S.; Norton, A.; Newman, G. The water vapor sorption behavior of flax fibers-analysis using the parallel exponential kinetics model and determination of the activation energies of sorption. J. Appl. Polym. Sci. 2010, 116, 2166–2173. [Google Scholar] [CrossRef]
  137. Lundahl, M.J.; Cunha, A.G.; Rojo, E.; Papageorgiou, A.C.; Rautkari, L.; Arboleda, J.C.; Rojas, O.J. Strength and water interactions of cellulose I filaments wet-spun from cellulose nanofibril hydrogels. Sci. Rep. 2016, 6, 30695. [Google Scholar] [CrossRef] [PubMed]
  138. Mutungi, C.; Schuldt, S.; Onyango, C.; Schneider, Y.; Jaros, D.; Rohm, H. Dynamic moisture sorption characteristics of enzyme-resistant recrystallized cassava starch. Biomacromolecules 2011, 12, 660–671. [Google Scholar] [CrossRef] [PubMed]
  139. Thybring, E.E.; Boardman, C.R.; Glass, S.V.; Zelinka, S.L. The parallel exponential kinetics model is unfit to characterize moisture sorption kinetics in cellulosic materials. Cellulose 2019, 26, 723–735. [Google Scholar] [CrossRef]
  140. Glass, S.V.; Boardman, C.R.; Zelinka, S.L. Short hold times in dynamic vapor sorption measurements mischaracterize the equilibrium moisture content of wood. Wood Sci. Technol. 2017, 51, 243–260. [Google Scholar] [CrossRef]
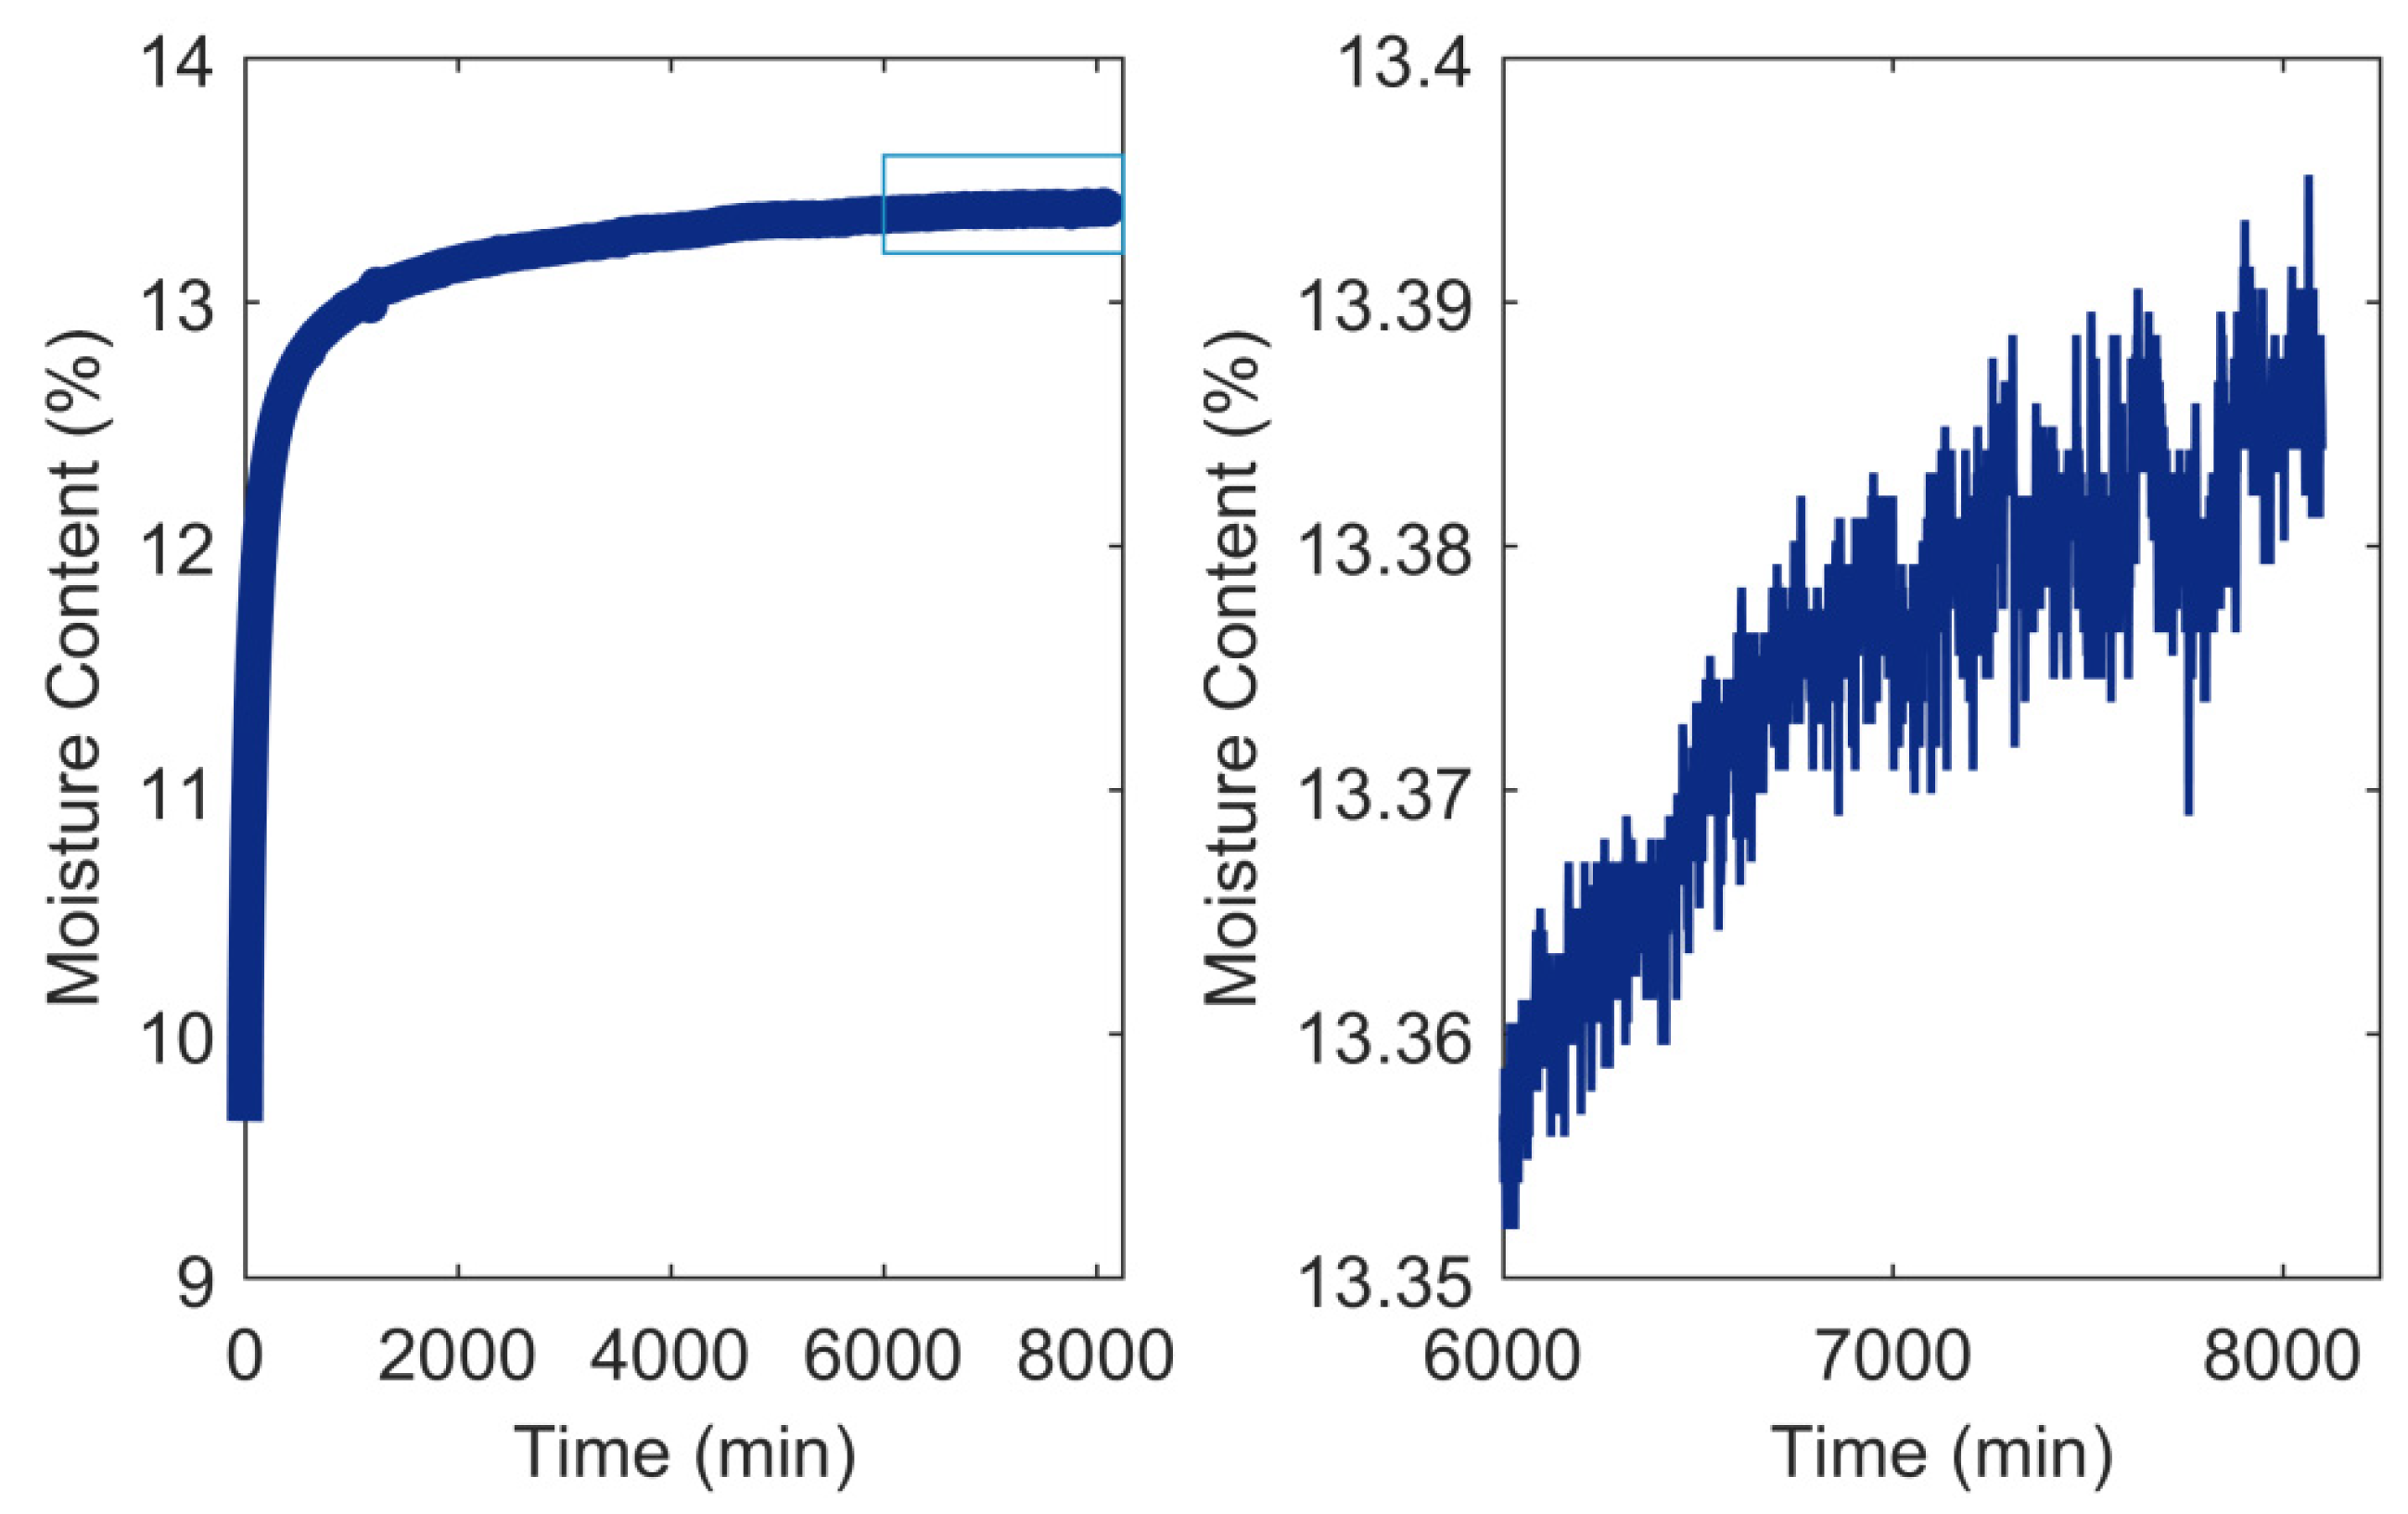
Figure 1. Example of sorption kinetic data for loblolly pine (Pinus taeda L.) after a change in relative humidity (RH) from 70% to 80% (data from [8]). The rectangle in the left figure is expanded in the right figure, revealing small but nonzero changes in moisture content that occur over long periods of time until equilibrium is achieved, which is defined as a mass change on the scale of the inherent mass stability of the instrument (less than 2 µg over 24 h).
Forests 10 00704 g001
Figure 2. Fractional change in moisture content, E(t), calculated from the absorption data for loblolly pine (Pinus taeda L.) from Figure 1. The rectangle in the left figure is expanded in the right figure.
Forests 10 00704 g002
Figure 3. Absorption curves measured with a vacuum sorption balance for 20 µm tangential microtomed specimens of mountain ash (Eucalyptus regnans F. Muell.) at different steps in relative humidity (RH) [40].
Forests 10 00704 g003
Figure 4. Temperature changes of klinki pine (Araucaria klinkii Lauterb.) wood in a vacuum sorption balance during successive absorption processes from 0% to 22.5% moisture content [38].
Forests 10 00704 g004
Figure 5. Overview of the physical phenomena occurring during moisture sorption in wood.
Forests 10 00704 g005
Figure 6. Glass transition temperature of hemicelluloses and lignin as a function of wood moisture content, based on [100,101,102,103,104,105].
Forests 10 00704 g006
Figure 7. Sorption curves as predicted by Fickian diffusion into wood cell walls for L = 10 µm (upper panels) and L = 3 µm (lower panels).
Forests 10 00704 g007
Figure 8. Parallel exponential kinetics (PEK) model fitted to sorption curve of Figure 1. The model partitions the moisture change into “fast” and “slow” moisture components, each with a characteristic time constant. Sorption data and model fits are shown for interrupted sorption (left) based on the common mass stability criterion of 20 µg g−1 min−1 and for sorption until equilibrium (right). For clarity, the left plot shows only every 5th data point and the right plot only every 150th data point. Data from [139].
Forests 10 00704 g008
Figure 9. Spectra of characteristic time constants found by multi-exponential decay analysis (MEDEA) on absorption and desorption data until equilibrium for loblolly pine (Pinus taeda L.) using an automated sorption balance [139]. The numbers above each spectrum indicates the RH step, e.g., “20–30” denotes the step from 20% RH to 30% RH.
Forests 10 00704 g009