Article

Measuring the Heat of Interaction between Lignocellulosic Materials and Water

1
Department of Wood Science and Technology, University Hamburg, 21031 Hamburg, Germany
2
Building Materials, Lund University, 223 63 Lund, Sweden
3
TA Instruments, 65760 Eschborn, Germany
4
Institute of Inorganic and Applied Chemistry, University Hamburg, 20146 Hamburg, Germany
*
Author to whom correspondence should be addressed.
Forests 2019, 10(8), 674; https://doi.org/10.3390/f10080674
Submission received: 15 July 2019 / Revised: 2 August 2019 / Accepted: 6 August 2019 / Published: 9 August 2019
(This article belongs to the Special Issue Wood-Moisture Relations)

Abstract

:
Research Highlights: When investigating the sorption of water on lignocellulosic materials, the sorption or mixing enthalpy is an interesting parameter that, together with the sorption isotherms commonly measured, can be used to characterize and understand the sorption process. We have compared different methods to assess these enthalpies. Additionally, we propose a sorption nomenclature. Background and Objectives: Sorption enthalpies are non-trivial to measure. We have, for the first time, measured sorption enthalpies on the same materials with four different methods, to be able to compare the method’s strengths and weaknesses. Materials and Methods: The following four methods were used on beech and Scots pine wood: isosteric heat, solution calorimetry, sorption calorimetry, and RH perfusion calorimetry. Results: The results for beech and pine were similar, and were in general agreement with the literature. We do not recommend one of the methods over the others, as they are quite different, and they can therefore be used to elucidate different aspects of the interactions between water and, for example, novel biobased materials (modified woods, cellulose derivatives, and regenerated cellulose).

1. Introduction

1.1. Wood-Water Interactions

Lignocellulosic materials, like wood, are greatly influenced by the moisture content, and water absorption leads to swelling and changes in all material properties, e.g., mechanical strength, thermal and electric conductivity, and the susceptibility to decay by fungi. Therefore, wood-water interactions have been studied for more than century (see, for example, references Volbehr (1896) [1] and Zelinka, Glass and Johnson [2], which leads to a variety of different perspectives within this field [3].
Wood will take up or release water, depending on the ambient relative humidity (RH), which leads to a complex varying moisture content under natural conditions. Most wood properties show a strong influence of moisture contents from dry conditions up to the fiber saturation point (FSP, usually defined as the moisture content at which the cell wall is saturated with water, but the lumen are empty). Above the FSP, where added water is held in cell lumina, and therefore not contributing to changes in the cell wall, only properties that are directly influenced by the water content will change, e.g., electrical properties.
As the moisture content is highly influencing the properties, and therefore the usability of wood in general, the state of water in wood has been intensely discussed. Most commonly, water in wood is divided into bound and free water [4], but more divisions can also be made, for example, was the water in cellulose classified as free water, freezing bound water or non-freezing bound water by Berthold et al. [5]. This classification assumed that the non-freezing bound water is directly bound to the cellulose by hydrogen bonds, while the freezing bound water is indirectly bound to the sorption sites [6]. More recently, it has been assumed that only non-freezing bound water is present in wood below the FSP [7]. In the past, several explanations for the accessibility of hydroxyl groups and the number of water molecules that were connected to each OH-group have been proposed [8].
To distinguish and calculate the quantity of water molecules that are connected to the hydroxyl groups within the wood matrix, the energy at which the absorbed water bonds to the wood structure is of interest. The most common energy-measurable is the enthalpy change, i.e., the heat exchange at constant pressure. Enthalpies of the wood-water interaction have been determined in several studies in the past, see, for example, Volbehr (1896) [1], Stamm and Loughborough (1935) [9], Weichert (1963) [10], Simpson (1973) [11] (these references are discussed in Skaar [3]), and its meaning and importance was also discussed, for example by Skaar (1988) [3]; Rees (1960) [12] thorough review on heat of sorption of moisture in textiles should also be mentioned.
In this paper, we give a detailed overview of the available methods for determining the enthalpy of interaction between water and wood and other bio-based materials. The general advantages and disadvantages for all methods are presented and discussed. As we have found that it is difficult (or in some cases impossible) to compare the published enthalpy results for wood-water interaction, as methods, definitions, and units are not always clear; we start by introducing the nomenclature and definitions that we use. Although it is the aim of this study to give an overview of methods to quantify the heats associated with wood-water interactions, we also note that the main use of the discussed methods in the future will not be to measure on wood, as such, wetting, sorption, and mixing enthalpies are known, but to assess the properties of new bio-based materials, including modified wood and cellulose derivatives.

1.2. Nomenclature

Table 1 gives a summary of the nomenclature that we use in the present paper. As much as possible, we follow the recommendations of the International Union of Pure and applied Chemistry (IUPAC) [13]. Although the main focus of this paper is on the interaction between lignocellulosic materials and water, we also give the nomenclature in general terms here, i.e., of the sorption of any vapor in/on any solid. The approach that is presented does not have any limitations from the specific mode of interaction between the vapor and the solid; it can be adsorption (on surfaces), capillary condensation in a pore system, or the taking up of vapor or liquid molecules in a swelling material.
In the present paper, we use an extended definition of the term RH for both the state of water vapor in the air and the state of water absorbed in a material. The RH of a material is then equal to the RH of a gas phase in equilibrium with it. Thus, we use RH as the term water activity is used in other fields. Note that at temperature and pressure conditions close to NTP (normal temperature and pressure, 20 °C, and 1 atm) that we have, for example, in the measurements in the present paper, the numerical values of RH, and water activity at equilibrium are very similar [14].

1.3. Perspective on Sorption

Sorption thermodynamics is complicated by the fact that the sorption enthalpy, for example, for a wood-water system, is a function of the moisture content (or the RH). We will illustrate this by first discussing the parallel, but in some ways simpler, case of non-covalent binding that is found when small molecules (often called ligands, typically drug molecules) bind to proteins in aqueous environments. For the common case, where there is only one binding site (1:1 binding), classical chemistry gives the chemical process and its binding enthalpy, and the equilibrium constant according to the law of mass action:
P   +   L PL , bind H
K bind = [ P L ] [ P ] [ L ]
The two constants Kbind and ∆bindH are all that is needed to describe the 1:1 binding process, as every binding event will produce the same heat and bind with the same strength. The binding enthalpy is conveniently expressed in units of J mol−1, and the moles can refer to either the protein or the ligand, as it is a 1:1 binding (we can recommend references [15] for those who are interested in ligand-protein binding).
A sorption process is similar to the above binding process, as a small vapor molecule binds to a larger entity. However, there are also several differences:
  • The larger entity does not have a defined molecular mass, at least not if it is a material, like wood, so we need to work with specific units (J g−1) when the denominator refers to the material.
  • The enthalpy when a vapor molecule binds to a solid is not a constant, but it depends on how many molecules have previously been sorbed on the solid, i.e., the moisture content. Chemically, the sorption process may be similar to the ligand-protein binding process (both are typically hydrogen bonding), but while all the protein molecules and their binding sites are identical, vapor can be bound in accessible porous materials in many different ways.
  • Chemical thermodynamics states that processes spontaneously take place when they result in a decrease in the Gibbs energy. This “driving force” has contributions from two terms: enthalpy and entropy. The enthalpic contributions reflect the strength of the binding. For ligand-protein binding processes in an aqueous environment, there can also be large entropical contributions, from the loss of conformational degrees of freedom in the molecules involved and that water molecules are expelled from the binding site [16]. Such phenomena can also take place during sorption on, for example, bio-molecules. Some sorption processes can then be said to be entropy driven, see, for example, reference [15]. This phenomenon is limited for vapor sorption on relatively rigid solids, like wood.

1.4. Sorption Isotherms

Figure 1a shows a schematic sorption isotherm, a description of how much vapor is sorbed by a solid as a function of the relative vapor pressure of the vapor. This diagram and our analysis are valid at isothermal equilibrium conditions, and in the absence of sorption hysteresis (we either look at only absorption or only desorption).
The slope of the sorption isotherm is a measure of how much is taken up by the solid when the RH is increased. This is often called the sorption capacity and it has a similar function as Kbind for the binding process.

1.5. Sorption and Mixing

The heat of sorption is a general term often used in wood science for the heat production that is associated with the sorption processes. However, we will use the term enthalpy; an enthalpy change is the heat exchange with the environment associated with processes at constant pressure (the most common situation in sorption applications). The enthalpy change (∆h) during any process is seen as the production (∆h < 0) or consumption (∆h > 0) of heat (the sign convention in chemical thermodynamics dictates that processes are seen from the point of view of the system that undergoes a process). We can measure enthalpy changes that are associated with sorption processes, but there is no natural zero point for the enthalpy of for example water. By convention, the physical state at 25 °C and 0.1 MPa is often taken as the reference state, so for water, h = 0 for the liquid state (do not confuse this with formation enthalpies used for chemical reactions).
As illustrated in Figure 1b, sorption is when a solid takes up vapor, and mixing is when a solid takes up liquid. The enthalpy that is associated with the transfer of one unit mass of vapor to a sample is the sorption enthalpy ∆sorph and it is the sum of the condensation enthalpy ∆condh and a mixing enthalpy ∆mixh [1] (all have units of J gwater−1):
Δ sorp h ( c ) = Δ cond h + Δ mix h ( c )
The sorption enthalpy and the mixing enthalpy are functions of the moisture content at which the sorption/mixing takes place, while the condensation enthalpy is constant at isothermal conditions.
We prefer to work with mixing enthalpies that only contain information about the small (vapor) molecule’s interactions with the solid, not the condensation of the vapor itself, as sorption enthalpies include the high condensation enthalpy. As it is difficult to realize the mixing of liquid water and a solid in practice, the mixing enthalpy is evaluated by subtracting the condensation enthalpy from a measured sorption enthalpy as is shown in Figure 1b.
The reason that it is difficult to directly measure mixing enthalpy is that it is difficult to add a liquid to a solid without getting large hysteresis effects. The place where the liquid first meets the solid will get high concentrations (absorption), but later dry (desorption), as the liquid will be redistributed to other parts of the sample. Thus, the state of the whole sample will never be homogeneous. Despite this, the mixing enthalpy is the most sensitive measure of the interaction between a vapor molecule and an accessible porous solid, and, as mentioned above, it can be calculated from other measures.
The mixing enthalpy can be seen as an “excess enthalpy”, which shows how much more heat that a sorption process produces than when the same mass of vapor condenses. Also note that we use the thermodynamic sign convention (for example, in Figure 1b), so that if heat is lost by the system to the surroundings (heat is produced) the enthalpy is negative. Enthalpies of sorption and condensation are therefore always negative; enthalpies of mixing are negative except in cases where mainly driven by entropy effects [17].
The mixing enthalpy has units of J gwater−1. It is the heat that is produced when a gram of liquid water is absorbed by an infinite mass of the solid at constant moisture content. This heat is often only attributed to the change of state of the water molecules that are sorbed, but it is actually the response of the whole system that includes the wood, the previously sorbed water, and the water that is sorbed into the wood substance.

1.6. Wetting

As discussed above, the direct addition of a small amount of liquid to a porous solid results in conditions that are not well defined. However, there is one measurement with liquid addition that has well defined start and end points, and that is when the whole sample absorbs water until saturated. Such a process is called heat of wetting and it is related to measurements of heats of solution (see for example reference [18]).
The main variable that can be changed is its initial moisture content when making heat of wetting measurements on a solid. The heat produced during wetting is highest for a dry solid (without any sorbed molecules), decreases as the moisture content increases, and then becomes zero for an already wetted (saturated) solid. Figure 1c shows how the wetting enthalpy is a function of the initial moisture content.
When a wetting measurement is made, a certain amount of heat Qwet (J) is produced. If this heat is divided by the dry mass of the solid, m0 (g), we will get the wetting enthalpy ∆weth (J gsolid−1):
Δ wet h = Q wet m 0
There is a relation between the mixing enthalpy and the wetting enthalpy, as is illustrated in Figure 1b,c. The wetting enthalpy at moisture content ci is integral to the mixing enthalpy from c1 to infinity (saturation):
Δ wet h ( c i ) = c = c i Δ mix h   d c
The converse equation is when the mixing enthalpy is calculated as the derivative of the wetting enthalpy as a function of moisture content:
Δ mix h ( c i ) = Δ wet h ( c i ) d c
but it is difficult to use this in practice, as it is difficult to measure heat of wetting well enough to take an accurate derivative of the curve (the derivation is therefore often made on a curve fit of the measured data). The integration of Equation (3) is mathematically much more benign.
It should be noted that the mixing enthalpy and the wetting enthalpy have different units: mixing enthalpy is in joules per gram vapor (or liquid), while wetting enthalpy is in joules per gram (dry) solid.

1.7. Clausius-Clapeyron Equation

A commonly used method to determine sorption enthalpies is the application of the Clausius–Clapeyron equation on sorption isotherms. This method is still rather common—probably because it does not require any heat measurements and isosteric heats for wood are regularly published, see for example [19].
With this method, the so called isosteric heat is calculated; the name refers to that the calculation requires the knowledge of how the RH changes with temperature at constant moisture content (isosteric = at constant coverage; the term refers to the case of adsorption). In practice, the isosteric heat equals the sorption or the mixing enthalpy (depending on how the equation is formulated). The Clausius–Clapeyron equation with the mixing enthalpy is [20]:
d ln ( φ ) d ( 1 / T ) c = Δ mix h R
Here, T is temperature (K) and R is the gas constant (8.314 J mol−1 K−1).
The isosteric method is usually applied on a set of sorption isotherms measured at different temperatures. The Clausius–Clapeyron equation can then only be used if one can interpolate between the curves. In literature, the sorption isotherms are usually fitted to an isotherm equation, for example, GAB, Dent [21], or Hailwood–Horrobin [22]. The curve fitting will give smooth curves that are easy to apply Equation (5) on, but the shape that is induced by the isotherm models may influence the result. An alternative way to generate data for the isosteric method is to use a sorption instrument that can simultaneously change the temperature and keep the moisture content constant; such instruments do exist, but it is not clear if they can measure good enough data for isosteric calculations.
Although the Clausius–Clapeyron equation is thermodynamically valid, its application is not trivial as sorption isotherm data is often not good enough to permit the determination of precise mixing enthalpies. Three reasons for this are [12]:
  • The sorption isosteres (ln(φ) as a function of 1/T) should be linear. In practice they are often more or less non-linear, possibly because of measurement errors or the use of non-optimal fitting equations.
  • The enthalpy is assumed to be constant with temperature, which it strictly is not.
  • The Clausius–Clapeyron assumes that the sorption is reversible, which it probably is not because of hysteresis.
Similar problems with the related van’t Hoff equation have been noted for the determination of other types of enthalpies, see, for example, the discussion in reference [23]. A value from a direct measurement of an enthalpy should in most cases be preferred to a value that is calculated by Clausius–Clapeyron or van’t Hoff equations (Skaar 1988) [3].

1.8. Literature Data

The literature contains several studies with results of isosteric calculations and heat of wetting measurements; we will only show results from one study here, as an example. It is common to curve fit the results of the sorption, mixing and wetting measurements to exponential functions. Skaar [3] gives equations that represent the results of Stamm and Loughborough [9] (isosteric method, sitka spruce, 50 °C), as:
Δ mix h = 1180 exp ( 14 c )
This equation can be integrated (Equation (3)) to:
Δ wet h = 84 exp ( 14 c )
Δ mix h ( t ) = Δ vap h P sorp ( t ) P cond ( t ) 1
These enthalpies have an apparent accuracy that is doubtful, as it is assumed that the enthalpies are related to moisture content by exponential functions, which is something that is only probably approximate. The data on which Equations (6) and (7) are based have also been criticized for not being of the quality that is needed for, e.g., sorption enthalpy calculations [2]. However, we have still used these two equations as examples against which we discuss our results.
The mixing enthalpy of the first absorbed water molecules (at zero moisture content) has been noted in several studies to be similar for different types of organic materials and substances. Rees (1960) [12] noted that, for different textile materials, “all the evidence points to a finite value [...] at zero regain of about 290 cal/g” and Skaar [3] gives similar values for wood (this value is about 1200 J gwater−1). Kocherbitov [24], who has made sorption calorimetry measurements on a range of biochemical substances, found that the mixing enthalpy at zero moisture content was close to −18 kJ mol−1 (1000 J gwater−1) [25]. These values are close to the enthalpy of hydrogen bonds between O-H and O [26].
Some studies give somewhat different values of mixing and wetting enthalpy for wood than the values that are given above, but it is doubtful that this is because different woods have different values of these parameters; it can also be caused by experimental deficiencies.

2. Materials

Commercial kiln-dried beech (Fagus sylvatica L.) and Scots pine (Pinus sylvestris L.) milled with a Retsch mill SM1 to a particle size lower than 4 mm in length and 1 mm in diameter was used for all the calorimetric measurements. Wood samples from the same sources with a sample size of 20 mm (length) × 20 mm (width) and 1.5 mm in height (longitudinal direction) were used to measure the sorption isotherm for both the isosteric calculations and for the evaluation of the RH perfusion calorimetry results. Tris (hydroxymethyl) aminomethane (TRIS) from Serva (research grade) and hydrochloric acid (0.1 mol/L, for laboratory use) from Chemsolute were used for the calibration of the solution calorimeter. Deionized water was used for all solution calorimetry measurements.

3. Methods

We have used four methods to assess the enthalpies of wood-water interactions on beech and pine wood: the isosteric method, solution calorimetry, sorption calorimetry, and RH perfusion calorimetry. All, except for the first method, involve direct measurements of heat. The first two methods (isosteric heat and solution calorimetry) have been frequently used to study the water-wood interactions, while sorption calorimetry and RH perfusion calorimetry are used for the first time for wood in this work. Here, we describe the four methods briefly; Table 2, which gives an overview of the methods.

3.1. Isosteric Method

We used a commercial balance SPSx-1µ-High-Load (ProUmid, Germany) for measuring the gravimetric sorption isotherms at 20, 30, and 40 °C. The samples were at first and in between every step equilibrated at the isotherm temperature and 0% RH for 48 h. The sorption measurements were performed in absorption at 0-5-10-20-30-40-50-60-70-80% RH with 12 h at each level, which resulted in final mass change rates between 0.0007 and 0.0018% min.−1.
For each temperature, the moisture content was calculated based on the mass that was measured at the end of the initial drying step at 0% RH. As these 0% RH masses differed slightly, we made the isosteric calculations both on the data as measured with different dry mass reference points at different temperatures and while using a dry mass measured at 50 °C for all temperatures.
The isosteric heat of sorption was calculated in two steps. The first step was either curve fitting while using the Hailwood–Horrobin model or linear interpolation between the measurement points. In the second step, Equation (5) was used to assess the sorption/mixing enthalpy. The derivative of Equation (5) was calculated from a linear curve fit of three data points at each moisture content.

3.2. Solution Calorimetry

Another common technique for studying wood-water interactions is solution calorimetry, in which the heat production is measured when a specimen is placed in water, so that its moisture content increases up to saturation. The name of the instrument comes from that its most common use is to measure heats of solution of compounds in water, but such instruments can also be used to measure heats of reaction, mixing, dilution, and wetting. The principle of the technique is to condition water and a solid sample separately in a calorimeter, and then determine the heat that is produced when the two are brought in contact with each other. Most such instruments are semi-adiabatic calorimeters, in which the temperature that is increase brought about by the process of interest is measured. There are commercial solution calorimeters from several manufacturers on the market.
The wetting enthalpy ∆weth (J gwood−1) is calculated from the measured heat and the dry mass of the sample (Equation (2)). The measurements can be made with different initial moisture contents. The highest wetting enthalpy is found when the dry samples are measured; as the moisture content of samples increase, the wetting enthalpy will decrease. For samples that are already wet (saturated), the wetting enthalpy is zero. By making measurements on samples with different moisture contents, the moisture content dependence of the wetting enthalpy can be found, and this can be used to calculate the mixing enthalpies as a function of the moisture content. One usually needs to fit the results to an equation to do this without getting excessive noise. When we did this—while using an exponential equation (cf. Equation (7))—we both used the same weighing factors on all data points, and applied high weighing factors on the data at zero moisture content to make the curve pass closer to these data points.
In our measurements, the wood samples were preconditioned via absorption at different RHs in climate chambers for at least three days to different set initial moisture contents. The dry samples were prepared by storing the wood at 103 °C in a drying oven for at least 24 h. We used a 1455 Solution Calorimeter from Parr Instrument Company (Moline, IL, USA) to determine the wetting enthalpy. All of the equipment was stored at stable temperature prior to the measurements. The sample and 100 mL deionized water were placed in the measuring cell of the calorimeter, while using an initial measurement time for stable baseline prior to the initiation of the wetting of at least 15 min. Subsequently, injection was performed. Afterwards an additional baseline time of at least 15 min. was used. Data evaluation was performed with Origin Version 9.1. Two linear curve fits were calculated to determine baseline parts before and after reaction. The difference between these two temperature lines was used as temperature increase ∆T to determine the heat of wetting:
Q wet = C a × Δ T
The apparent heat capacity of the instrument Ca (J K−1) was determined while using TRIS and hydrochloric acid.

3.3. Sorption Calorimetry

The sorption calorimeter that we have used is a specialized instrument for solid-vapor interaction studies. In the instrument, two isothermal heat conduction calorimeters (a double twin calorimeter) [27] simultaneously and separately measure the heat production rate (thermal power) of the vaporization of water from a vapor source and of the absorption of the same vapor in a sample. During a measurement, water is vaporized at the source, diffuses down a tube that determines the mass increase rate of the sample, and is then absorbed by the sample.
The thermal power of vaporization Pvap (W) and the thermal power of sorption Psorp (W) are continuously measured. Counting both of these as positive for exothermal processes, Psorp is positive and Pvap is negative. From these two thermal powers, it is possible to evaluate how a triplet of information changes throughout the measurement: sample relative humidity φ, moisture content c (gwater gwood−1), and mixing enthalpy ∆mixh (J gwater−1) [28]:
φ ( t ) = 1 P vap ( t ) P max
c ( t ) = c 0 + 1 m 0 Δ vap h τ = 0 t P vap ( τ )    d τ
Δ mix h ( t ) = Δ vap h P sorp ( t ) P cond ( t ) 1
Here, Pmax (W) is the maximal thermal power of vaporization in the device, i.e., when a measurement is made with a drying agent that keeps the water activity at zero in the sample position; c0 (gwater gdry sample−1) is the initial moisture content of the sample (usually zero); m0 (g) is the dry mass of the sample; and, ∆condh (J gvapor−1) is the condensation enthalpy of water. Equations (9)–(11) are based on Fick’s law of diffusion (Equation (9)), a mass balance (Equation (10)), and a thermal power balance (Equation (11)). Thus, the method is only based on a few fundamental physical principles, and can be regarded as robust in this respect.
A new and unpublished prototype sorption calorimeter was used. It is based on the same measurement principles as the sorption calorimeters that were described in references [28], but in the new instrument all parts except a vaporization cup (for the water) and a sorption cup (for the sample) are fixed in the calorimeter. The sample masses were 21–46 mg, the samples were dried for about 24 h at 100 °C and vacuum, and the measurements were made at 25 °C.
In this prototype, the sample cup was smaller when compared to previous instruments and the wood powders therefore formed a plug of about 5 mm height. There is some uncertainty on how close to equilibrium the measurements were made because of internal diffusion resistances in the plug (see Section 5.3).
The evaluation procedure is described in reference [28]. The calorimeter was calibrated with electrical heaters and the maximal output signal (about 800 μW) was measured with drying agents (molecular sieves). The Tian correction was applied to remove the effect of the thermal inertia of the calorimeter [29]. An initial correction [28] was made, but no diffusion time-lag correction was used (it does not improve the result of a measurement on wood). As the accuracy of the enthalpy results deteriorates at higher RHs, no mixing enthalpies above 80% RH are reported.

3.4. RH Perfusion Calorimetry

A fourth method to directly measure heats that are associated with wood-water interactions is by flowing gas with step-wise increasing or decreasing RH over samples in an isothermal calorimeter, which is an instrument that measures the thermal power. This technique has been available for some years, but it is mainly used for quantifying amorphicity in pharmaceutical powders, for polymorphism studies, and for changing the RH inside the calorimetric vials for stability and compatibility studies [30]. We have used the instrument to step up and step down the RH of the nitrogen gas flowing through the calorimetric vial with the wood sample. When the RH is increased, water vapor will be absorbed, so that the wood can reach a new equilibrium state, and the calorimeter will measure the heat that is associated with that event. The sorption/mixing enthalpy can be calculated if this heat is combined with the change in moisture content from a separate isotherm measurement.
The primary result from the calorimeter is the thermal power P (W) as a function of time. The thermal power result for each RH-step can be integrated to give heats Q (J). From the sorption isotherm that was measured in a separate measurement, we can calculate the change in moisture content, ∆c. If we divide the heat by the dry mass and the moisture content change, we get the sorption enthalpy:
Δ sorp h = Q m 0 Δ c
which has units of J gwater−1. This is the mean sorption enthalpy in the moisture content region of the RH-step.
The measurements were made in a nanocalorimeter in a TAM IV thermostat (TA Instruments, New Castle, DE, USA) and the RH of the atmosphere in the calorimeter was controlled by a Gas Flow Control Kit (TA Instruments, New Castle, DE, USA). Samples of about 12 mg of wood particles were weighed, placed in the calorimeter ampoule, and dry nitrogen was then purged over the sample until the thermal power signal from the calorimeter became stable (stability criterion: 300 nW/h drift, 100 nW standard deviation). The flow rate was set to 200 mL/h, which is the highest flow rate recommended to allow for the gas to equilibrate to the measuring temperature. The next RH-step was made 1 h after stability was reached. The following RHs were used: 0-5-10-20-50-80-90-95-100% and the same RH-levels back to 0% RH. It should be noted that other types of calorimetric instruments, in which the vapor is delivered to the sample in other ways, can also be used for similar measurements, see, for example, reference [31].
In the evaluation, each thermal power peak was integrated and the resulting heat was divided by the dry mass. We adjusted the measured mass, assuming that the sample moisture content was 8%, as the sample masses were determined in as-is conditions before the drying in the calorimeter. We then divided by the assumed moisture content change to calculate the sorption enthalpies, calculating this from the 20 °C isotherms that are seen in Figure 2 (below). Finally, the condensation enthalpy was subtracted to give the mixing enthalpy.

4. Results

4.1. Isosteric Method

Figure 2 shows isotherms for pine measured at 20, 30, and 40 °C, and calculated the mixing enthalpies by the isosteric method. The top isotherm moisture content values are based on RH 0%, whereas to bottom isotherms are set to 0% moisture content as the starting value for all curves. Values at moisture contents above 15% moisture content could not be calculated due to the limited isotherm data in that range. The results were similar for beech.

4.2. Heat of Wetting

Figure 3a shows the combined results from the heat of wetting measurements on beech and pine. It is seen that the results are similar for the two species. Four pine measurements (crosses) were judged to be outliers; possibly water vapor had leaked into the sample chamber before the measurement started. The wetting enthalpy results were fitted to two functions (see figure caption), which were differentiated to provide the mixing enthalpies that are seen in Figure 3b. The measured values for beech and pine at zero moisture content are in the range of 55 to 70 J gwood−1, and at 20% moisture content the wetting enthalpy is close to zero for both species.

4.3. Sorption Calorimetry

Figure 4 shows the result of six measurements with the sorption calorimeter. Sorption isotherms and mixing enthalpies are both measured in the same measurement. The sorption isotherms are similar to the isotherms that are given in Figure 2, but they are not sigmoidal because they lack the initial sharp rise in the isotherm; this odd behavior is discussed in the Discussion. The mixing enthalpy curves are only shown up to a moisture content corresponding to 80% RH. The absolute mixing enthalpy at 0% RH is in the range 700–900 J gwater−1.

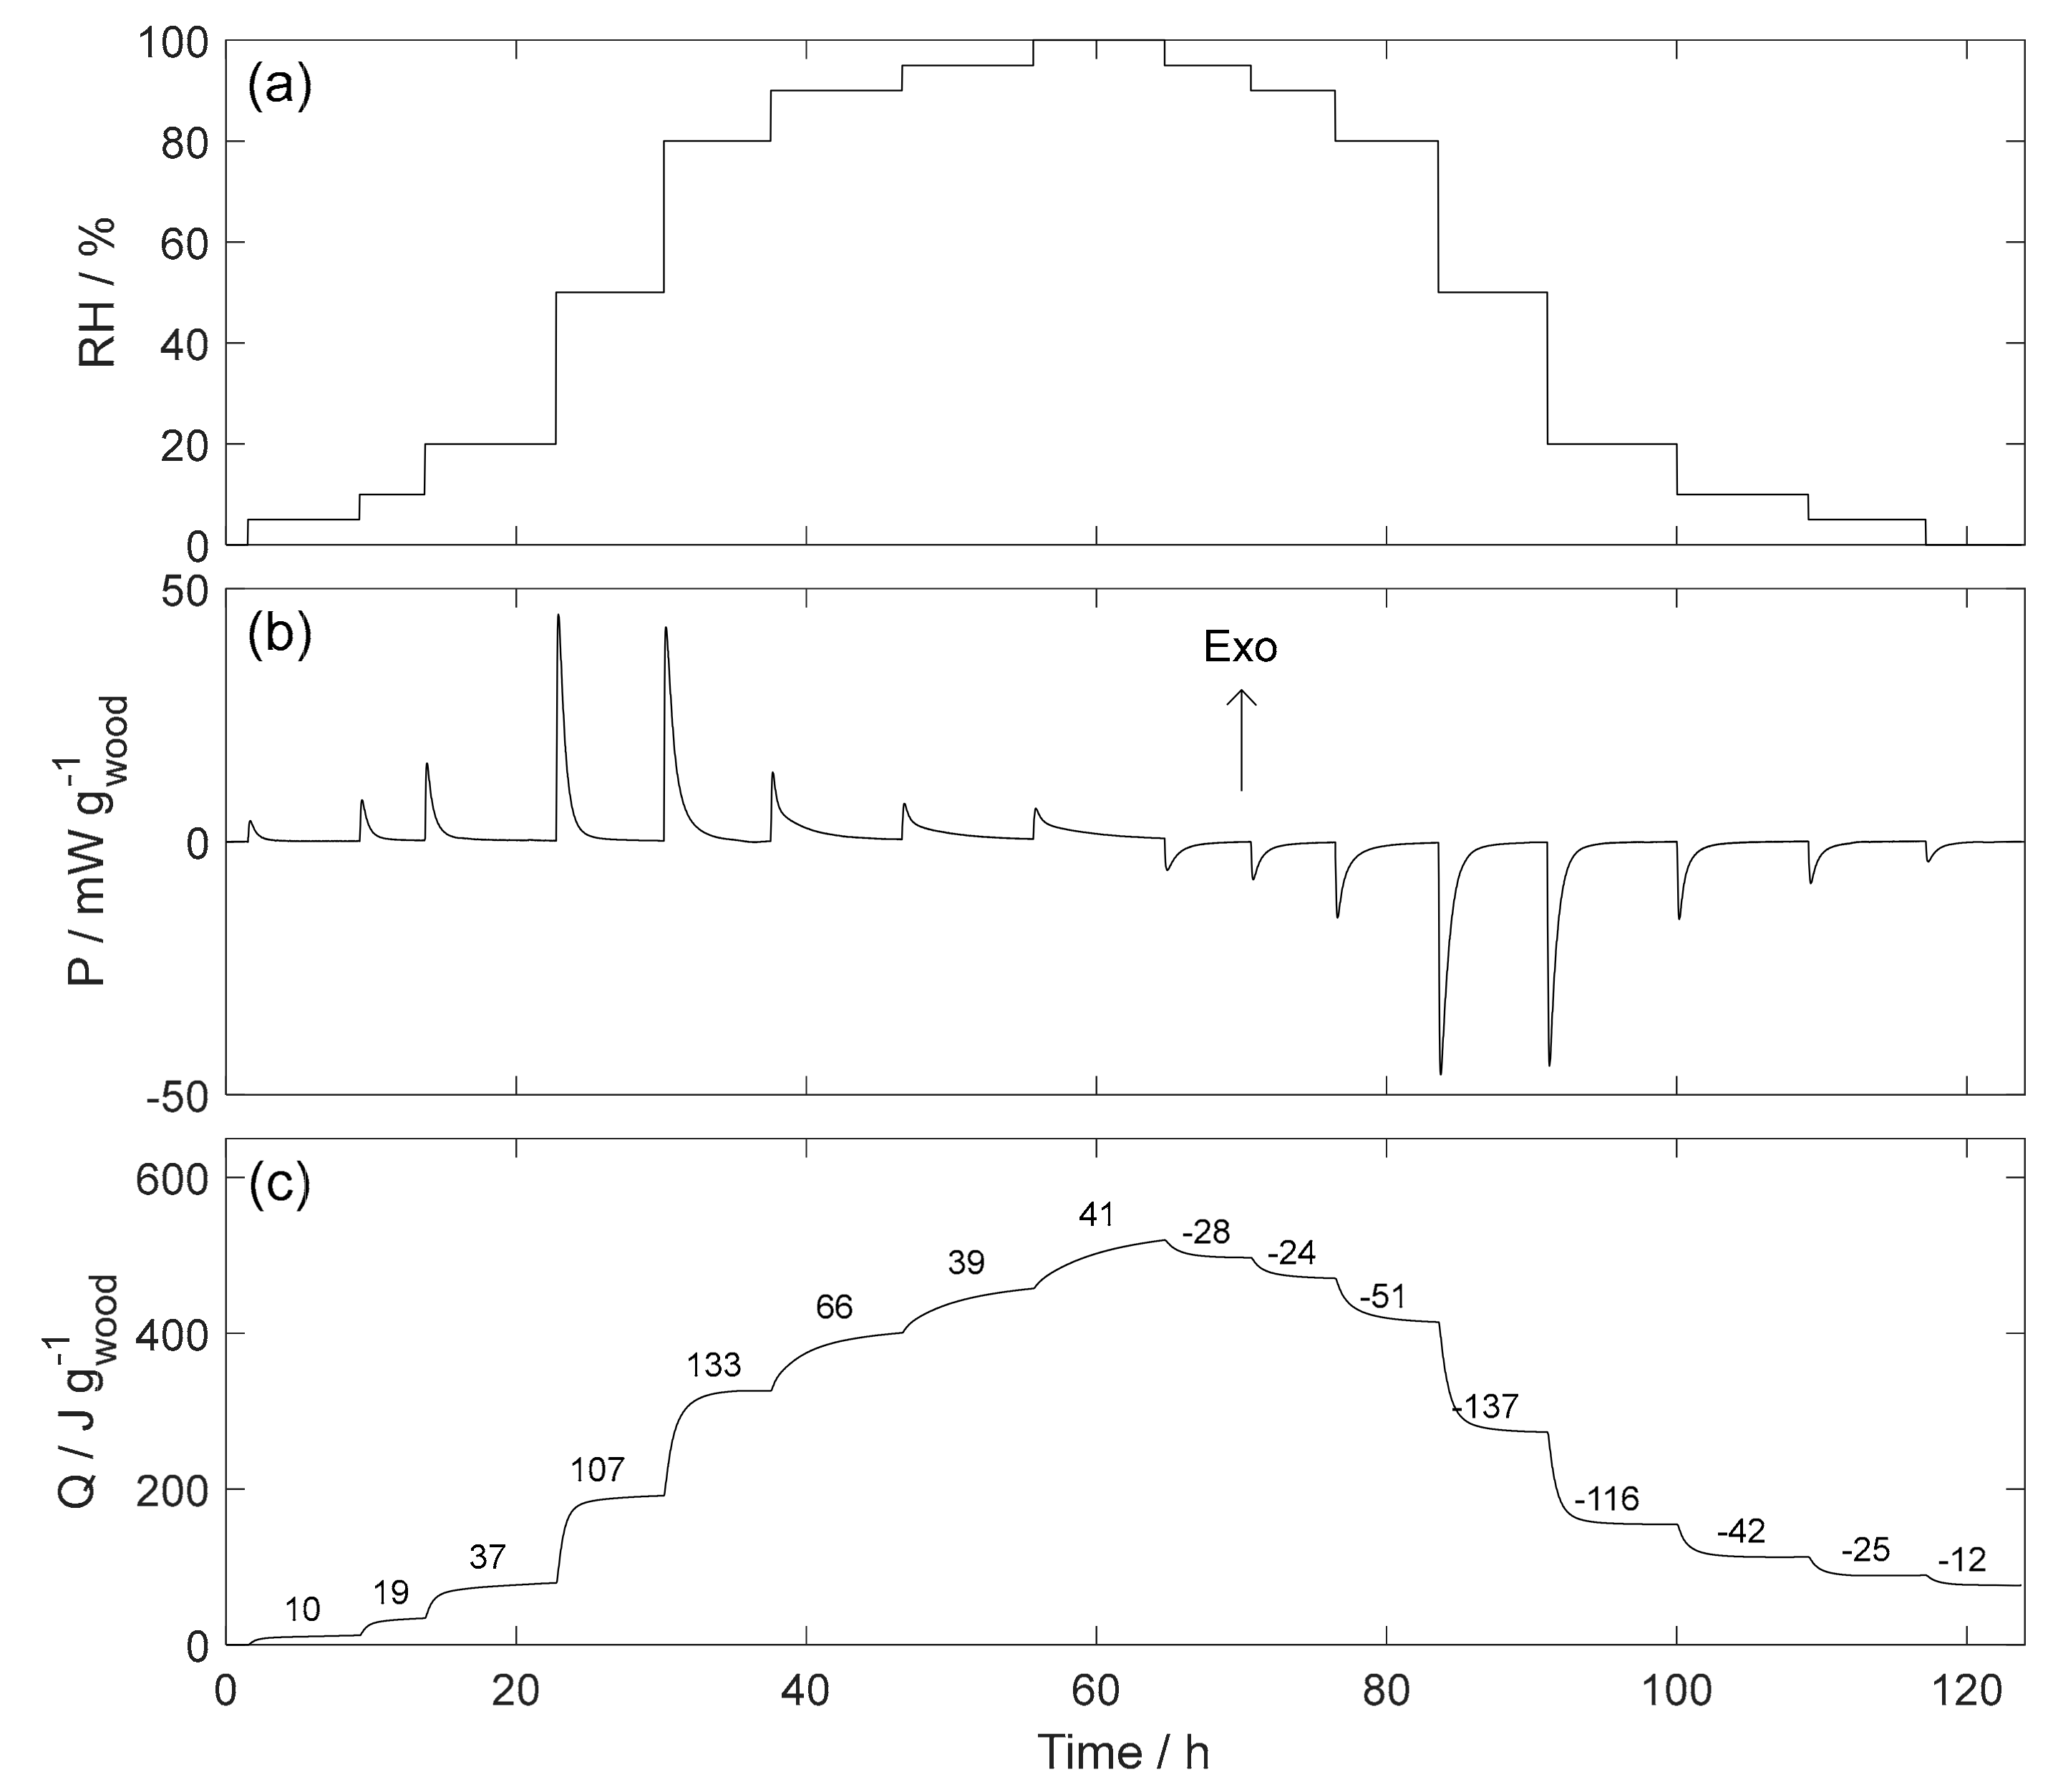
4.4. RH Perfusion Calorimetry

Figure 5a,b shows the RH and the thermal power from a measurement with a 12 mg sample of pine. It is clearly seen that each change in RH results in heat being released (absorption) or taken up (desorption). We need to divide the heat (Figure 5c) with the change in moisture content to calculate the sorption enthalpy for the RH-range of a peak (Equation (12)) As this was only a test measurement, we have only made the mixing enthalpy calculation for the two largest absorption steps for pine, as shown in Table 3. The differences seen between the calculated results and the literature values are most probably explained by the uncertainties of this test measurement, see Section 5.4.

5. Discussion

5.1. Isosteric Method

As measured isotherms contain random errors, it may be difficult to directly use them to do the isosteric evaluation with Equation (5). Therefore, it is common to use a sorption isotherm fitting function for creating smooth sorption isotherms. This will give smooth results, but the curve fitting may introduce errors, as the used equations may, to some extent, dictate the shape of the isotherms. Linear interpolation (as we also used) does not introduce the bias of an assumed fitting function, but will lead to a noisier result. Our use of linear interpolation or the Hailwood–Horrobin model show similar mixing enthalpies at moisture contents that are above 3%, but large deviations are noticeable at lower moisture contents.
The two versions of the isotherms gave quite different mixing enthalpies at 0% RH, indicating that the isosteric heat method is sensitive to the quality of the isotherm data. While using the Hailwood–Horrobin curve fit, the maximum absolute mixing enthalpy at dry conditions is approximately 1000 1 and 300 J gwater −1, respectively, for the two versions of the isotherms. As 1000 J gwater−1 is close to the literature value (Equation (3)), it seems that the curve fitted original data from the sorption balance was appropriate for use with the isosteric method, even if the 0% RH moisture contents were not correct. A reason for this is that the curve fit is not influenced at all by the moisture content value at 0% RH, as the Hailwood–Horrobin isotherm equation always passes through the origin (see Figure 2a). In contrast, the linear interpolation—which gives similar values above 3% moisture content—does not work at all at lower moisture content.
Here, it should be mentioned that our use of the Hailwood–Horrobin sorption isotherm equation is rather arbitrary and does not indicate that the physical interpretation of sorption that the authors of this equation made are correct for the wood-water case. As many of the equations used to fit wood sorption data have the same mathematical form—which fits wood isotherms well—we could instead have used the mathematical equation without the physical interpretations that come along with the name. Such an approach, called the ABC-isotherm, has been proposed by Zelinka et al. [32]
The correction of the isotherms to a common dry moisture content were not successful, as it resulted in much lower absolute mixing enthalpies than that found in literature, especially at low moisture contents. We repeat that this highlights that the use of the Clausius–Clapeyron equation demands very good isotherm data.
The application of the isosteric method to sorption on complex materials, like wood, has been questioned in literature for a long time. The main criticism is based on the derivation of the Clausius–Clapeyron equation being made under simplified/ideal conditions. An example is the condition of reversibility, which does not seem to be present in the wood-water system, in which strong hysteresis/scanning effects are present. Reversibility may be observed for absorption on inorganic crystal surfaces, but it does not exist for organic materials with bulk sorption [12]. Another problem with the application of the Clausius–Clapeyron equation to the wood-water system is that wood has significant swelling/shrinkage [33]. A third problem is that the isosteric method needs equilibrium isotherms [34], and it is known that the result of an isotherm measurement is influenced by how the RH is changed (for example, how long time that is spent at each RH level).
Glass et al. [35] recommend the use of 0.0003% min.−1 as equilibrium moisture content (EMC) criterium for measuring sorption isotherms. Our values (0.0007 to 0.0018% min−1) are above that threshold and this could be an explanation for the seen deviations in the isosteric results. Even if some of our results are in agreement with the literature, the dependence of curve fitting and dry mass should be further investigated; applying the isosteric method to swelling organic materials is possible, but its limitations should be further investigated [35,36].
In summary, the isosteric method is a classical method that has yielded some of the most used enthalpy results in literature for the wood-water system. It is convenient for those who can measure sorption isotherms, but that do not have appropriate calorimeters. However, the method is sensitive to small errors in the measured isotherms, so great care must be taken during measurements, and the wood-water system does not fulfill the theoretical foundations of the Clausius–Clapeyron equation.

5.2. Solution Calorimetry

Our wetting enthalpy for dry beech and pine (66 J gwood−1) corresponds rather well with the literature. Hearmon and Burcham [37] found about 62 J gwood−1 for dry Douglas fir. Dieste et al. [22] found about 48 J gwood−1 for dry beech wood when using the same calorimeter as in our investigations. 75–87 J gwood−1 were reported for dry pine wood by Kelsey [38]. In general, the wetting enthalpy seems to be independent of the species [39], so the differences between the above studies could be caused by experimental non-idealities. Additionally, the degree of grinding has influence on the absolute value of the wetting enthalpy [37].
It should be noted that the wetting enthalpy of dry materials is mainly a function of their hygroscopicity. This is, for example, clearly seen in the compilation that is given by Rees [12], in which the wetting enthalpies of dry viscose and cotton are approx. 110 and 45 J gsolid−1. This is in good agreement with that the moisture content of viscose is about twice that of cotton throughout the whole RH-range [40].
At least for the evaluation of mixing enthalpies from wetting enthalpies, the data has to be fitted to an equation. Most commonly, an exponentially decaying function is used, but such a function will, of course, also put some constraints on the results. With the application of curve fitting, also values close to 0% RH—which are difficult to experimentally assess with solution calorimetry—can be determined.
It should be noted that the individual data points might need to have different weighing factors in a curve fit to obtain an optimal shape of the curve. We needed to apply higher weighing factors to the data points at dry conditions, otherwise the curve gave a seemingly too high value for dry conditions.
Solution calorimetry is a robust method, but needs a good sample preconditioning at different climates. The method is also time consuming as many measurements have to be made to collect enough data to construct the wetting enthalpy vs. moisture content relationship.

5.3. Sorption Calorimetry

The sorption calorimetric results agreed rather well with the literature data, but the absolute mixing enthalpy at zero moisture content was slightly lower than most literature results, and there was a lack of a sharp rise in the isotherm at low RHs (cf. Figure 2). This type of problem can be caused by that the sample is not dry at the start of the measurement, but this is probably not the case here, as it was dried for 24 h in vacuum at 100 °C, and not exposed to the ambient conditions for more than a few seconds during the charging. Possibly, it was the internal diffusion resistance in the sample that was responsible for these deviations; the small sample holder was filled with a 5 mm plug of the sample particles and the internal diffusion resistance in such a sample is not accounted for by the evaluation equations.
The present measurements were made on samples with masses in the range 21–45 mg. The rate of sorption was such that the RH increased from 0 to 25, 50, and 75% RH in 2, 5, and 11 h, respectively, for the largest sample, and about twice as fast for the smallest sample. These are rather high mass change rates for sorption calorimetry and the results may therefore not be equilibrium results (cf. discussion above). However, there was no correlation between the sample size and the results, and this is normally an indication that the measurements were made close to equilibrium.
Sorption calorimetry is an interesting technique, as it measures both the sorption isotherm and the mixing enthalpy in one measurement, which typically takes only two days. The continuous curves both isotherm and enthalpy will also show discrete phenomena like stoichiometric hydrate formation [41] and, although such phenomena do not take place in wood, it may be of interest for studies on other bio-based materials.
Note that the rate of diffusion is controlled by the difference in RH between the water source and the sample (and the size of the tube through which the diffusion takes place). Thus, the rate of change of RH (the scanning rate) is controlled by the sample. When the sample has taken up water to increase its RH, the rate of diffusion will decrease to accommodate the fact that the vapor pressure difference between top and bottom has changed.
Of the three parameters measured (RH, moisture content, mixing enthalpy), the RH is the parameter that is most easily disturbed by kinetic effects, such as internal diffusion resistances in the sample. The moisture content and the mixing enthalpy should therefore be seen as the main measurables. It should be noted that a similar situation often exists in other types of sorption measurements: water uptake is easily measured by a balance, but it is often more difficult to know whether the corresponding (equilibrium) RH has been reached.

5.4. RH Perfusion Calorimetry

RH perfusion calorimetry is an interesting method for studying solid-vapor relations. The experimental approach is quite straight forward, only small (mg) samples are needed, and it is easy to start an experiment, which automatically runs and only takes about a week.
The results that are presented in Figure 5 are the first measurements of this type to be made. It is seen that the thermal power peaks and the heats of each peak look good, but the evaluated results did not agree well with literature data, as seen in Table 2 (the results were similar for beech). We believe that this type of measurement can be used to measure the mixing enthalpies, but to do so the method needs to be optimized and possibly improved in several respects:
  • In this type of measurement, the results of a blank run (without sample) should be subtracted from the sample result, as there will also be sorption and the corresponding heats on the internal surfaces of the vial (this was not done in the present measurements).
  • This method should probably not be used with small steps in RH, like the 0-5-10% RH that we used, as this generates small peaks and small moisture content changes, and large uncertainties in the results.
  • The RH that is generated by the equipment needs to be calibrated over the whole RH range, especially at low RHs, where the mass flow controllers that the RH generation is based on can be less reliable. We made a one-point calibration at 75% RH (that gave 0.9% RH higher value, which is good).
  • The drying of the samplse may need to be improved; it is not clear what the initial state of the sample was after the initial drying at a set value of 0% RH at 25 °C. Possibly, the sample should be externally dried, for example, in a vacuum oven, and then quickly transferred to the calorimetric vial.
Some of the thermal power peaks show significant tailing, which indicates that the samples were not at equilibrium with the RH of the gas at the end of an RH-step. This is similar to what is often seen with, for example, wood in sorption balances. Two possible sources of the seen tailing are that the gas flow rate in the calorimeter is low (200 mL/h), cf. reference [42], and that wood can take an unexpectedly long time to come close to equilibrium, because of internal constraints on water absorption and desorption [43].
As the sorption isotherm is needed in the evaluation, the calorimetric results have to be combined with a sorption isotherm that is measured by some other technique. As isotherms can look slightly different, depending on how they were measured, it may be necessary to find an isotherm technique that has similar mass change characteristics as the calorimetric method. We used the isotherms at 20 °C that were measured for the isosteric calculations. The second calculation in Table 2—that gave a mixing enthalpy with the wrong sign-used a moisture content difference of 0.063; if this difference would have been 0.050 instead, the calculation would have given the literature value. The reason for this sensitivity is that we are interested in the mixing enthalpy, and this is calculated by subtracting the vaporization enthalpy from the sorption enthalpy; a small difference between two large numbers has relatively high uncertainty.
We believe that RH perfusion calorimetry should be further investigated as a tool for studying the interaction between lignocellulosic materials and water.

5.5. General

Figure 6 shows a comparison of the results from the four methods and literature data. It is seen that there is a fair agreement, but also differences. For the isosteric method, only one curve is shown in Fig. 6, as we believe that one of the methods that we used to determine the used isotherms was not good. As the difference between the two methods is only a minor dry mass correction, our results indicate that the isosteric method needs very good isotherm data. The solution calorimetric result agrees well with literature, but both our results and the literature results are based on the same exponential curve fit, which may introduce bias into the calculation of mixing enthalpies. The sorption calorimetry gave six measurements within a ±100 J gwater−1 band, which is good, but both the initial parts of the sorption isotherms and the enthalpy values at 0% RH indicate that the method does not measure the initial part of the isotherm well. The RH perfusion calorimetry result that is shown agrees well with the other methods, but the second result in Table 2 was on the wrong side of zero enthalpy (not shown in Figure 6), so this method needs to be further investigated.
It is not clear to us why we get larger discrepancies between our different measurements than Volbehr (1986) [1] and Stamm and Loughborough (1935) [9], who did their measurements about 100 years ago, even though we used modern state-of-the-art equipment. However, at least partly, this can be the result of that Stamm and Loughborough’s compilation of data was made on interpolated (not measured) values [2].
Beech and pine gave similar results in all four methods, also in the RH perfusion calorimetry. This shows that these two woods, one softwood and one hardwood, have similar sorption behavior. It also indicates that the differences between the methods are, to a large part, caused by systematic errors and not by random errors, so there is a need for further investigations and improvements of the experimental procedures.
The mixing enthalpy at 0% RH is an interesting parameter that is difficult to assess. The isosteric calculations are difficult to make close to 0% RH, as the measured isotherms are not good enough there. For example, will small changes in the dry masses at 0% RH significantly influence this enthalpy. For solution calorimetry, the 0% RH mixing enthalpy can, in principle, be calculated from the heat of wetting values for dry samples and samples with a low RH, but this is difficult to do, as there is a relatively large scatter in the results. The sorption calorimetry can, in principle, measure the 0% RH mixing enthalpy, but the method has to be improved to make measurements closer to equilibrium (larger sample, slower sorption rate, less internal diffusion resistance). The RH perfusion calorimeter had difficulties in measuring the 0% RH mixing enthalpy, as it cannot make small accurate steps in RH close to 0% RH. It seems that all four methods have their problems when it comes to assessing the 0% RH mixing enthalpy, but that the simultaneous use of more than one method will lead to more certain values.
The sorption enthalpy is the sum of the condensation enthalpy and the mixing enthalpy, and the mixing enthalpy is the sum of the enthalpies of all different processes that take place when liquid water is taken up by the wood. One way to look at this is to divide the mixing enthalpy into three parts that are related to the changes that take place for the absorbed water, the already absorbed water, and the wood. Often, these components are defined in other ways, for example as heat of swelling. Still, it should be remembered that the methods discussed in this paper could only assess the result of the sum of all the processes taking place during sorption.
The four methods are different when it comes to the study of the effect of hysteresis and scanning on the mixing enthalpy. Most straight-forward is RH perfusion calorimetry, as it is possible to make steps in both absorption and desorption with this method. Solution calorimetry can also be used for this by conditioning samples to different RHs by absorption and desorption before a measurement [37]. Sorption calorimetry is normally only made in absorption, but there is one study showing that it is possible to also undertake desorption measurements in limited RH ranges [44]. For isosteric calculations, both absorption and desorption (and scanning) data can, in principle, be used, but it seems that this violates the assumptions (reversibility, equilibrium) of the Clausius–Clapeyron equation.
A problem for those interested in sorption thermodynamics is that it is often difficult to understand what other scientists mean in their papers. Five problems are most common:
  • Different terminology is used. For example, are the terms differential heat and integral heat [3] sometimes used for what we have called mixing enthalpy and wetting enthalpy, respectively; differential heat of swelling [9] is our mixing enthalpy; and, the term isosteric heat is typically the same as our mixing enthalpy, but used if the isosteric method has been used.
  • Different symbols are used; for example are Q, H, ∆H, and ∆h used for enthalpy change. We prefer to use Q for a measured heat and ∆h for a calculated specific enthalpy change.
  • Different sign conventions are used. We have followed the thermochemical convention that looks at processes from the standpoint of the system, so heat production (loss of heat by the system) gives negative enthalpy. However, it is common to instead show, e.g., mixing enthalpies as positive.
  • A minor issue is the use of calories in the older literature, but as long as the units are written out, the multiplication by 4.184 J cal−1 converts heats and enthalpies from calories to joules (the SI-unit).
  • All of the sorption and mixing enthalpies can be based either on gram or on mole, as it is the water that they refer to; wetting enthalpies for wood can only be given per mass of wood, as wood has no molar mass. If an enthalpy has units of J g−1, it is thus not possible to know whether it is J gwood−1 (a wetting enthalpy) or J gwater−1 (a mixing or sorption enthalpy), so we encourage the use of sub-indices to indicate this.
Because of the above problems, it is important to clearly state what nomenclature that is used.

6. Conclusions

The mixing enthalpy is a robust measure that can be used for the characterization of the interaction between lignocellulosic materials and water. For the first time, a comparison of four different methods for determining sorption enthalpy on one material (wood) was made. The results were similar for the two woods investigated, and they are in general accordance with the literature, but there is a significant scatter in the result. The four methods all have their advantages and disadvantages, and it is good to use more than one method in parallel. The isosteric method—which is based on the temperature dependence of sorption isotherms—should be used with some caution.

Author Contributions

Conceptualization, M.N., L.W., M.F. and A.K.; methodology, M.N. and L.W.; measurements, M.N., L.W. and C.O.; writing—original draft preparation, L.W., M.N..; writing—review and editing, L.W., M.N., C.O, M.F. and A.K., visualization, L.W.

Funding

L.W. was supported by Calmetrix and C.O. was supported by TA Instruments.

Acknowledgments

We would like thank Frederik Schüler (University Hamburg) for the heat of wetting measurements.

Conflicts of Interest

The authors declare no conflict of interest, except that C.O. (TA Instruments) and L.W. (also at Calmetrix) work for companies that manufacture calorimetric instruments.

References

  1. Volbehr, B. Untersuchungen über die Quellung der Holzfaser; Druck von Schmidt and Klaunig: Kiel, Germany, 1896. [Google Scholar]
  2. Glass, S.V.; Zelinka, S.L.; Johnson, J.A. Investigation of Historic Equilibrium Moisture Content Data from the Forest Products Laboratory; FPL-GTR-229; USDA Forest Service: Washington, DC, USA, 2014; p. 37. [Google Scholar]
  3. Skaar, C. Wood-Water Relations; Springer: Berlin/Heidelberg, Germany; New York, NY, USA, 1988; ISBN 3642736858. [Google Scholar]
  4. Engelund, E.T.; Thygesen, L.G.; Svensson, S.; Hill, C.S. A critical discussion of the physics of wood–water interactions. Wood Sci. Technol. 2013, 47, 141–161. [Google Scholar] [CrossRef]
  5. Berthold, J.; Desbrières, J.; Rinaudo, M.; Salmén, L. Types of adsorbed water in relation to the ionic groups and their counter-ions for some cellulose derivatives. Polymer 1994, 35, 5729–5736. [Google Scholar] [CrossRef]
  6. Ping, Z.H.; Nguyen, Q.T.; Chen, S.M.; Zhou, J.Q.; Ding, Y.D. States of water in different hydrophilic polymers—DSC and FTIR studies. Polymer 2001, 42, 8461–8467. [Google Scholar] [CrossRef]
  7. Thygesen, L.G.; Engelund, E.T.; Hoffmeyer, P. Water sorption in wood and modified wood at high values of relative humidity. Part I: Results for untreated, acetylated, and furfurylated Norway spruce. Holzforschung 2010, 64, 315–323. [Google Scholar] [CrossRef]
  8. Rautkari, L.; Hill, C.; Curling, S.; Jalaludin, Z.; Ormondroyd, G. What is the role of the accessibility of wood hydroxyl groups in controlling moisture content? J. Mater. Sci. 2013, 48, 6352–6356. [Google Scholar] [CrossRef]
  9. Stamm, A.J.; Loghborough, K.W. Thermodynamics of the Swelling of Wood. J. Phys. Chem. C 1935, 39, 121–132. [Google Scholar] [CrossRef]
  10. Weichert, L. Untersuchungen über das Sorption-und Quellungsverhalten von Fichte, Buche und Buchen-Preßvollholz bei Temperaturen zwischen 20° und 100°C. Eur. J. Wood Wood Prod. 1963, 21, 290–300. [Google Scholar] [CrossRef]
  11. Simpson, W.T. Predicting Equilibrium Moisture Content of Wood by Mathematical Models. Wood Fiber Sci. 1973, 5, 41–49. [Google Scholar]
  12. Rees, W.H.; Hearle, J.W.S. Moisture in Textiles. Heat of Absorption; Textile Institute: Manchester, UK; Butterworths Scientific Publications: London, UK, 1960. [Google Scholar]
  13. Cohen, E.R.; Cvitas, T.; Frey, J.; Holmstrom, B.; Kuchitsu, K.; Marquardt, R.; Mills, I.; Pavese, F.; Quack, M.; Stohner, J.; et al. Quantities, Units and Symbols in Physical Chemistry, 3rd ed.; IUPAC and RSC Publishing: Cambridge, UK, 2007; ISBN 978-0-85404-433-7. [Google Scholar]
  14. Gál, S. Über die Ausdrucksweisen der Konzentration des Wasserdampfes bei Wasserdampf-Sorptionsmessungen. HCA 1972, 55, 1752–1757. [Google Scholar] [CrossRef]
  15. Vuignier, K.; Schappler, J.; Veuthey, J.-L.; Carrupt, P.-A.; Martel, S. Drug-protein binding: A critical review of analytical tools. Anal. Bioanal. Chem. 2010, 398, 53–66. [Google Scholar] [CrossRef]
  16. Freire, E. Isothermal titration calorimetry: Controlling binding forces in lead optimization. Drug Discov. Today Technol. 2004, 1, 295–299. [Google Scholar] [CrossRef] [PubMed]
  17. Markova, N.; Sparr, E.; Wadsö, L.; Wennerström, H. A Calorimetric Study of Phospholipid Hydration. Simultaneous Monitoring of Enthalpy and Free Energy. J. Phys. Chem. B 2000, 104, 8053–8060. [Google Scholar] [CrossRef]
  18. Marabi, A.; Mayor, G.; Raemy, A.; Bauwens, I.; Claude, J.; Burbidge, A.; Wallach, R.; Saguy, I.S. Solution calorimetry: A novel perspective into the dissolution process of food powders. Food Res. Int. 2007, 40, 1286–1298. [Google Scholar] [CrossRef]
  19. Simon, C.; Esteban, L.; Palacios, P.D.; Garcia Fernández, F.; García-Iruela, A. Thermodynamic properties of the water sorption isotherms of wood of limba (Terminalia superba Engl. and Diels), obeche (Triplochiton scleroxylon K. Schum.), radiata pine (Pinus radiata D. Don) and chestnut (Castanea sativa Mill.). Ind. Crop. Prod. 2016, 94, 122–131. [Google Scholar] [CrossRef]
  20. Sirota, N. Certain Problems of Polymorphism (II) Generalized Clausius-Clapeyron Equation and Ostwald’s Step Rule. Cryst. Res. Technol. 1987, 22, 1343–1381. [Google Scholar] [CrossRef]
  21. Bahar, R.; Azzouz, S.; Remond, R.; Ouertani, S.; Elaieb, M.T.; El Cafci, M.A. Moisture sorption isotherms and thermodynamic properties of Oak wood (Quercus robur and Quercus canariensis): Optimization of the processing parameters. Heat Mass Transf. 2016, 46, 304. [Google Scholar] [CrossRef]
  22. Dieste, A.; Krause, A.; Militz, H. Modification of Fagus sylvatica (L.) with 1, 3-dimethylol-4, 5-dihydroxyethylene urea (DMDHEU): Part 1. Estimation of heat adsorption by the isosteric method (Hailwood-Horrobin model) and by solution calorimetry. Holzforschung 2008, 62, 577. [Google Scholar] [CrossRef]
  23. Mizoue, L.S.; Tellinghuisen, J. Calorimetric vs. van’t Hoff binding enthalpies from isothermal titration calorimetry: Ba2+-crown ether complexation. Biophys. Chem. 2004, 110, 15–24. [Google Scholar] [CrossRef]
  24. Kocherbitov, V. Salt-saturated salt solution as a standard system for sorption calorimetry. Thermochim. Acta 2004, 421, 105–110. [Google Scholar] [CrossRef]
  25. Albèr, C.; Engblom, J.; Falkman, P.; Kocherbitov, V. Hydration of hyaluronan: Effects on structural and thermodynamic properties. J. Phys. Chem. B 2015, 119, 4211–4219. [Google Scholar] [CrossRef]
  26. Benson, S.W. Some Observations on the Structures of Liquid Alcohols and Their Heats of Vaporization. J. Am. Chem. Soc. 1996, 118, 10645–10649. [Google Scholar] [CrossRef]
  27. Wadsö, L.; Markova, N. A double twin isothermal microcalorimeter. Thermochim. Acta 2000, 360, 101–107. [Google Scholar] [CrossRef]
  28. Wadsö, L.; Markova, N. A method to simultaneously determine sorption isotherms and sorption enthalpies with a double twin microcalorimeter. Rev. Sci. Instrum. 2002, 73, 2743. [Google Scholar] [CrossRef]
  29. Wadso, L. Operational issues in isothermal calorimetry. Cem. Concr. Res. 2010, 40, 1129–1137. [Google Scholar] [CrossRef]
  30. Miller, D.P.; Lechuga-Ballesteros, D. Rapid Assessment of the Structural Relaxation Behavior of Amorphous Pharmaceutical Solids: Effect of Residual Water on Molecular Mobility. Pharm. Res. 2006, 23, 2291–2305. [Google Scholar] [CrossRef] [PubMed]
  31. Ostrovskii, V.E.; Gostev, B.V. Heat effects and rates and molecular mechanisms of water sorption by perfluorinated polymer materials bearing functional groups. J. Therm. Anal. 1996, 46, 397–416. [Google Scholar] [CrossRef]
  32. Zelinka, S.L.; Glass, S.V.; Thybring, E.E. Myth versus reality: Do parabolic sorption isotherm models reflect actual wood–water thermodynamics? Wood Sci. Technol. 2018, 52, 1701–1706. [Google Scholar] [CrossRef]
  33. Willems, W. Equilibrium thermodynamics of wood moisture revisited: Presentation of a simplified theory. Holzforschung 2016, 70, 963–970. [Google Scholar] [CrossRef]
  34. Willems, W. Hydrostatic pressure and temperature dependence of wood moisture sorption isotherms. Wood Sci. Technol. 2014, 48, 483–498. [Google Scholar] [CrossRef]
  35. Glass, S.V.; Boardman, C.R.; Thybring, E.E.; Zelinka, S.L. Quantifying and reducing errors in equilibrium moisture content measurements with dynamic vapor sorption (DVS) experiments. Wood Sci. Technol. 2018, 52, 909–927. [Google Scholar] [CrossRef] [Green Version]
  36. Glass, S.V.; Boardman, C.R.; Zelinka, S.L. Short hold times in dynamic vapor sorption measurements mischaracterize the equilibrium moisture content of wood. Wood Sci. Technol. 2016, 51, 243–260. [Google Scholar] [CrossRef]
  37. Kajita, H. Heat of wetting of wood in water. I. Kyoto Pref. Univ. Bull. 1977, 20, 49–61. [Google Scholar]
  38. Kelsey, K.E.; Clarke, L.N. the heat of sorption of water in wood. Aust. J. Appl. Sci. 1955, 7, 161–175. [Google Scholar]
  39. Hearmon, R.F.S.; Burcham, J.N. Specific Heat and Heat of Wetting of Wood. Nature 1955, 176, 978. [Google Scholar] [CrossRef]
  40. Kajita, H. Heat of Wetting of the Constituents of Wood in Water. J. Soc. Mat. Sei. Jpn. 1977, 26, 417–423. [Google Scholar] [CrossRef]
  41. Hearle, J.W.S.; Peters, R.H. Moisture in Textiles; Textile Institute: Manchester, UK; Butterworths Scientific Publications: London, UK, 1960. [Google Scholar]
  42. Wadsö, L. Principles of a microcalorimetric technique for the study of mould activity as a function of relative humidity. J. Therm. Anal. 1997, 49, 1053–1060. [Google Scholar] [CrossRef]
  43. Wadsö, L. Describing non-Fickian water-vapour sorption in wood. J. Mater. Sci. 1994, 29, 2367–2372. [Google Scholar] [CrossRef]
  44. Kocherbitov, V.; Wadsö, L. A desorption calorimetric method for use at high water activities. Thermochim. Acta 2004, 411, 31–36. [Google Scholar] [CrossRef]
Figure 1. Graphical description of the terms used in the paper. (a) A sorption isotherm. (b) Enthalpies related to solid-vapor interactions (figure based on [3]). (c) Wetting enthalpy.
Forests 10 00674 g001
Figure 2. Evaluation of isosteric heats for the pine measurements. (a) Sorption isotherms, raw data with different moisture contents at zero relative humidity (RH) for different temperatures. Lines are curve fits to the Hailwood-Horrobin equation. (b) Mixing enthalpies calculated with the isotherms in Figure 2a using linear interpolation and the Hailwood-Horrobin curve fit. (c) Same as Figure 2a, but the isotherms have been shifted in the y-direction using the 0% RH mass at 50 °C as dry mass for all temperatures. (d) Same as Figure 2b, but using the isotherms in Figure 2c.
Forests 10 00674 g002
Figure 3. Results from heat of wetting measurements. (a) Measured wetting enthalpy of beech (open circles) and pine (filled triangles) as a function of initial moisture content. Crosses are considered to be outliers and are not included in the evaluation. Two curve fittings are shown; the solid curve is the least square curve fit to the exponential function; the dashed line has been forced to go through a mean value of the points at zero moisture content. (b) Calculated mixing enthalpy.
Forests 10 00674 g003
Figure 4. Results from six measurements using a sorption calorimeter: (a) Sorption isotherms. (b) Mixing enthalpies. In both plots, black curves are beech and gray curves are pine.
Forests 10 00674 g004
Figure 5. Results from vapor flow method for a 12 mg sample of pine. (a) The RH program. (b) The resulting thermal power peaks (the arrow shows the exothermal direction, heat production). (c) The total heat (integrated thermal power); the numbers are the heats (J gwood−1) determined for each step.
Forests 10 00674 g005
Figure 6. A comparison of results from literature and the methods used in the present study. Literature data is from Stamm and Loughborough [9] and includes solution calorimetric results from Volbehr [1] (pine wood fibers) at 0 °C and isosteric results from Stamm and Loughborough [9] (Sitka spruce) at 54, 71 and 88 °C (from lowest to highest curve). Isosteric method with the Hailwood–Horrobin curve fits of the uncorrected data (Figure 2a,b, Scots pine); solution calorimetry (exponential curve fit that passed through the data at zero moisture content, Figure 3, Scots pine and beech); sorption calorimetry (the minimum and maximum values in Figure 4b, Scots pine and beech); the top RH perfusion calorimetry result in Table 2 (Scots pine).
Forests 10 00674 g006
Table 1. Symbols and nomenclature (cf. Figure 1 below). Relative vapor pressure (and relative humidity) is commonly defined as the ratio of the vapor pressure to the saturation vapor pressure. Note that relative humidity and moisture content are often expressed as per cent (%), and gwood and gsolid refers to the mass of dry material in this paper.
SymbolGeneral PropertyWater Related PropertyUnits
cVapor contentMoisture contentgvapor gsolid−1, gwater gwood−1
condhCondensation enthalpyJ gvapor−1, J gwater−1
mixhMixing enthalpyJ gvapor−1, J gwater−1
sorphSorption enthalpyJ gvapor−1, J gwater−1
wethWetting enthalpyJ gsolid−1, J gwood−1
vaphVaporization enthalpyJ gvapor−1, J gwater−1
mMassg
φRelative vapor pressureRelative humidityPa Pa−1
WordMeaning
AbsorptionUptake of vapor or liquid by a solid
AdsorptionSorption of vapor on a surface
CondensationPhase change from vapor to liquid
DesorptionLoss of vapor by a solid
MixingUptake of liquid by a solid
SorptionExchange of vapor between solid and gas phases
VaporizationPhase change from liquid to vapor
WettingUptake of liquid by a solid until saturation
Table 2. An overview of the discussed and used methods.
Isosteric MethodSolution CalorimetrySorption CalorimetryRH Perfusion Calorimetry
What is measured?Sorption isotherms at different temperaturesThe temperature difference when a sample is wettedThe thermal powers of vaporization and sorption when a sample is humidifiedThe heats produced when the RH around a sample is changed
Calculation procedureThe Clausius-Clapeyron equation (Equation (5))The heat produced when wood is wetted (saturated) with water (Equation (2))Three equations (Equations (9)–(11)) are usedIntegration of each peak and combination with moisture content change from isotherm (Equation (12))
What enthalpy is calculated?Sorption/mixing enthalpyWetting enthalpySorption/mixing enthalpySorption/mixing enthalpy
EquipmentSorption balanceSolution calorimeterSorption calorimeterIsothermal calorimeter and RH-perfusion cell
AdvantagesSorption balances are rather common instrumentsSolution calorimeters are rather common instrumentsRather quick measurement (1–2 days); gives both isotherm and enthalpyCan be used for any RH-step; can be used in both absorption and desorption
DisadvantagesIt is not clear if the theoretical assumptions are fulfilled; the isotherm data needs to be of high quality; measurements takes a long time (month)Results need to be differentiated to give mixing enthalpy; many samples need to be measuredVery uncommon instrument; some uncertainties about the interpretation of the resultsRather common instrument, but the RH perfusion system is not common; relatively large uncertainties in several input factors
Table 3. Evaluation of two absorption steps for the RH perfusion calorimetry measurement on pine. The literature values are calculated from Equation (6). Note that the lower measured mixing enthalpy value has the wrong sign (see Section 5.4).
RH-Stepc/gwater gwood−1Q J gwood−1sorph/J gwater−1mixh/J gwater−1
InitialFinalDifferenceCalc.Lit.
20→50%0.0420.0850.043121−2800−360−490
50→80%0.0850.1480.063135−2150300−240

