Article

3-D Reconstruction of an Urban Landscape to Assess the Influence of Vegetation in the Radiative Budget

by
Maria Angela Dissegna
1,
Tiangang Yin
2,*,
Shanshan Wei
3,
Dan Richards
1 and
Adrienne Grêt-Regamey
4
1
Future Cities Laboratory, Singapore ETH Center, 1 CREATE way, Singapore 138602, Singapore
2
Earth System Science Interdisciplinary Center, University of Maryland, College Park, MD 20740, USA
3
Singapore–MIT alliance for Research and Technology, Singapore 138602, Singapore
4
Chair of Planning of Landscape and Urban Systems, ETH Zurich, 8093 Zurich, Switzerland
*
Author to whom correspondence should be addressed.
Forests 2019, 10(8), 700; https://doi.org/10.3390/f10080700
Submission received: 15 July 2019 / Revised: 13 August 2019 / Accepted: 15 August 2019 / Published: 19 August 2019
(This article belongs to the Special Issue Forestry Applications of DART Model)

Abstract

:
Increased urbanization and climate change have resulted in the intensification of the urban heat island (UHI) effect, particularly in tropical cities. One of the main causes of UHI is the man-made urban surfaces influencing the radiation budget by absorbing, reflecting, and emitting radiation at various wavelengths. The radiative budget of a city is directly influenced by the urban geometry, surface materials, direct solar radiation and incident angle, and atmospheric diffuse radiation. Vegetation cover, in contrast, can decrease UHI by intercepting radiation and through the process of photosynthesis. Better understanding the effect of urban vegetation on the radiative budget can thus contribute towards the mitigation of the UHI effect and ultimately the development of climate resilient urban spaces. To analyze the contribution of vegetation to the radiative budget of a city, a detailed simulation of the complex interaction between the built environment and the vegetation is required. This study proposes an approach for analyzing the 3-D structure of both vegetation and built environment to quantify the contribution of vegetation to the radiative budget of an urban landscape. In a first step, a detailed 3-D model of Singapore including buildings and vegetation was reconstructed using a combination of free and commercial Earth Observation data. Then, the 3-D Discrete Anisotropic Radiative Transfer (DART) model was repurposed to estimate the radiation absorbed by the urban surfaces accounting for the presence of vegetation cover with changing Leaf Area Density (LAD) conditions. The presence of trees in the scene accounted for a significant reduction of the absorbed radiation by buildings and ground. For example, in the case of a residential low-building neighborhood, although having low tree cover, the reduction of the absorbed radiation by buildings and ground was up to 15.5% for a LAD =1. The field validation shows good agreement (R2 = 0.9633, RMSE = 10.8830 and Bias = −1.3826) between the DART-simulated shortwave exitance and upwelling shortwave measurements obtained from a net radiometer mounted on a local flux tower in the urban area of Singapore, over the studied period. Our approach can be used for neighborhood-scale analysis, at any desired location of a city, to allow test scenarios with varying surface materials and vegetation properties.

1. Introduction

Tropical cities are experiencing more frequent temperature extremes due to climate change and the UHI effect [1]. The length, frequency and intensity of heat waves is expected to rise in the future, exacerbating the already poor air quality of densely populated cities, increasing health risks of vulnerable population groups, affecting the thermal comfort of urban residents and increasing the demand for energy for cooling systems [1,2,3,4]. Two of the key factors that contribute to the UHI effect are the radiative interaction between complex urban surfaces and the reduced vegetation cover [5]. To inform planning, a detailed understanding of the influence of the complex interactions between radiation and the urban surfaces is required at local, neighborhood and city scales [6].
The radiative budget is a key parameter in urban energy balance and climate models. It summarizes the interaction between radiation and the urban surfaces. Its study in urban environments has gained attention in recent years as an essential part of the global energy budget of big cities [7]. The radiative budget of a city varies temporally and spatially, where urban surfaces and vegetation interact, absorbing, reflecting, or emitting radiative energy at various wave-lengths. As a result, the radiative budget is directly influenced by the urban geometry, surface materials, solar incident angle, and atmospheric diffuse radiation. Urban greenery, such as trees and other types of vegetation provide local cooling via shading, evapotranspiration and photosynthetic activity [8,9]. Therefore, examining the effect of urban vegetation on the radiative budget of a city is essential to guide the development of livable urban environments.
Different radiative transfer models and simulators with various levels of detail exist. Depending on the scope, some models can be applied from city scale to detailed micro-scale urban analysis. A review on modeling approaches of radiative exchange in urban areas is presented by the authors of [10]. Some of the limitations of existing radiation simulation software, such as those used in ENVIMET [11], VTUF-3D (TEB) [6], and SOLWEIG [12], are found in their characterization of vegetation, their modeling of radiative fluxes, and/or their capability for large-scale 3-D analysis. Lacking the physical bases, some of these models account for vegetation in a simplistic way and/or use a simplified parameterization of the vegetation properties in terms of shade of an opaque object. Such an approach does not capture the biophysical complexity of vegetation, which allows some radiation to pass through the canopy through gaps of various sizes. To improve this simple treatment of vegetation, biophysical parameters of the tree canopy (e.g., Leaf Area Index (LAI) and Leave Area Density (LAD)) can be incorporated. Furthermore, existing modeling packages treat radiation in an approximated way with optical properties relying only on a few simplified parameters like albedo and emissivity. As a result, the detailed properties of radiation ranging over the shortwave and long-wave spectrum are not properly simulated. Finally, multiple scattering interactions between vegetation and buildings are not accounted for, which can result in non-negligible bias to both the shortwave and the long-wave (gray body) radiative budget.
Physically-based radiation transfer models used in the field of remote sensing were developed to compute radiation precisely in either narrow or broad spectral domains [13,14,15,16]. Such precision is highly important in order to invert and evaluate existing data and for the preparation of future satellite missions [17]. To accurately model radiative fluxes in 3-D urban scenes, we use such a physically-based radiation transfer model, the Discrete Anisotropic Radiative Transfer (DART) model, to assess the influence of vegetation in the radiative budget of an urban area. The DART model [17,18,19] is one of the most comprehensive physically based 3-D radiation transfer models from ultraviolet to thermal infrared spectral domain [20,21]. There are several functions in DART that makes it a relevant tool to be used in our study:
(a)
DART spectral domain extends from ultraviolet to thermal infrared, simulating shortwave broadband as weighted integration of narrow bands. Since the solar radiation and optical properties of objects vary dramatically over the spectral domain, the use of DART can provide more accurate results compared to simulation software in which radiation is only assessed in terms of short-wave and long-wave radiation (2 values) and the optical property is only defined by albedo and emissivity of broadband.
(b)
DART considers all types of surface optical properties, including isotropic property (Lambertian) or anisotropic property (specular, or predefined bidirectional reflectance distribution function), which extends the applications to all different materials.
(c)
DART models multiple scatterings between simulated scene elements in 3-D. This generates more accurate results for scene elements with high reflectance in the short-wave domain, and it permits modeling the gray body (emissivity less than 1) in the long-wave domain.
(d)
DART uses a discrete-ordinate forward ray tracing approach, which facilitates an efficient generation of the 3-D radiative budget as opposed to models using backward ray tracing or radiosity approach.
(e)
DART can simulate a cluster of leaves as a turbid medium defined by leaf area density, leaf angle distribution, and clumping function. By doing so, it saves the computer memory in storing every single leaf and provides results with high accuracy.
The objective of this study is thus to present a method to derive a 3-D model of a city using satellite data, which enables to quantify the influence of vegetation in the radiative budget of any existing urban area. We illustrate the approach in Singapore, a tropical city experiencing high UHI effect [22,23]. We (1) developed a method for the creation of a 3-D scene of a city from satellite data; (2) conducted a sensitivity analysis of the radiative budget to changing LAD values; (3) illustrated the DART application in several 3-D scenes corresponding to important urban typologies found across the city to illustrate the effect of changing built environment configurations and ground surface materials; and finally, (4) validated the simulated radiative budget against net radiometer data from a local flux tower.

2. Materials and Methods

The study has two main components; first, the creation of a realistic 3-D model of the city, including buildings and vegetation; and second, the quantification of the influence of vegetation in the radiative budget of urban landscapes. The urban scenes consist of subsets of common urban typologies found in the city of Singapore. Those subsets were taken from the generated 3-D city model within Bedok planning area. This planning area was chosen due to the proximity to the radiometer measurements. In the following, we present the workflow used to quantify the influence of vegetation on the radiative budget of various urban types in Singapore. The data used in this study are either open or commercially available, which allows replication in other cities. Additional details on the 3-D scene generation and the parameters used in the DART model can be found in Appendix A and Appendix B.

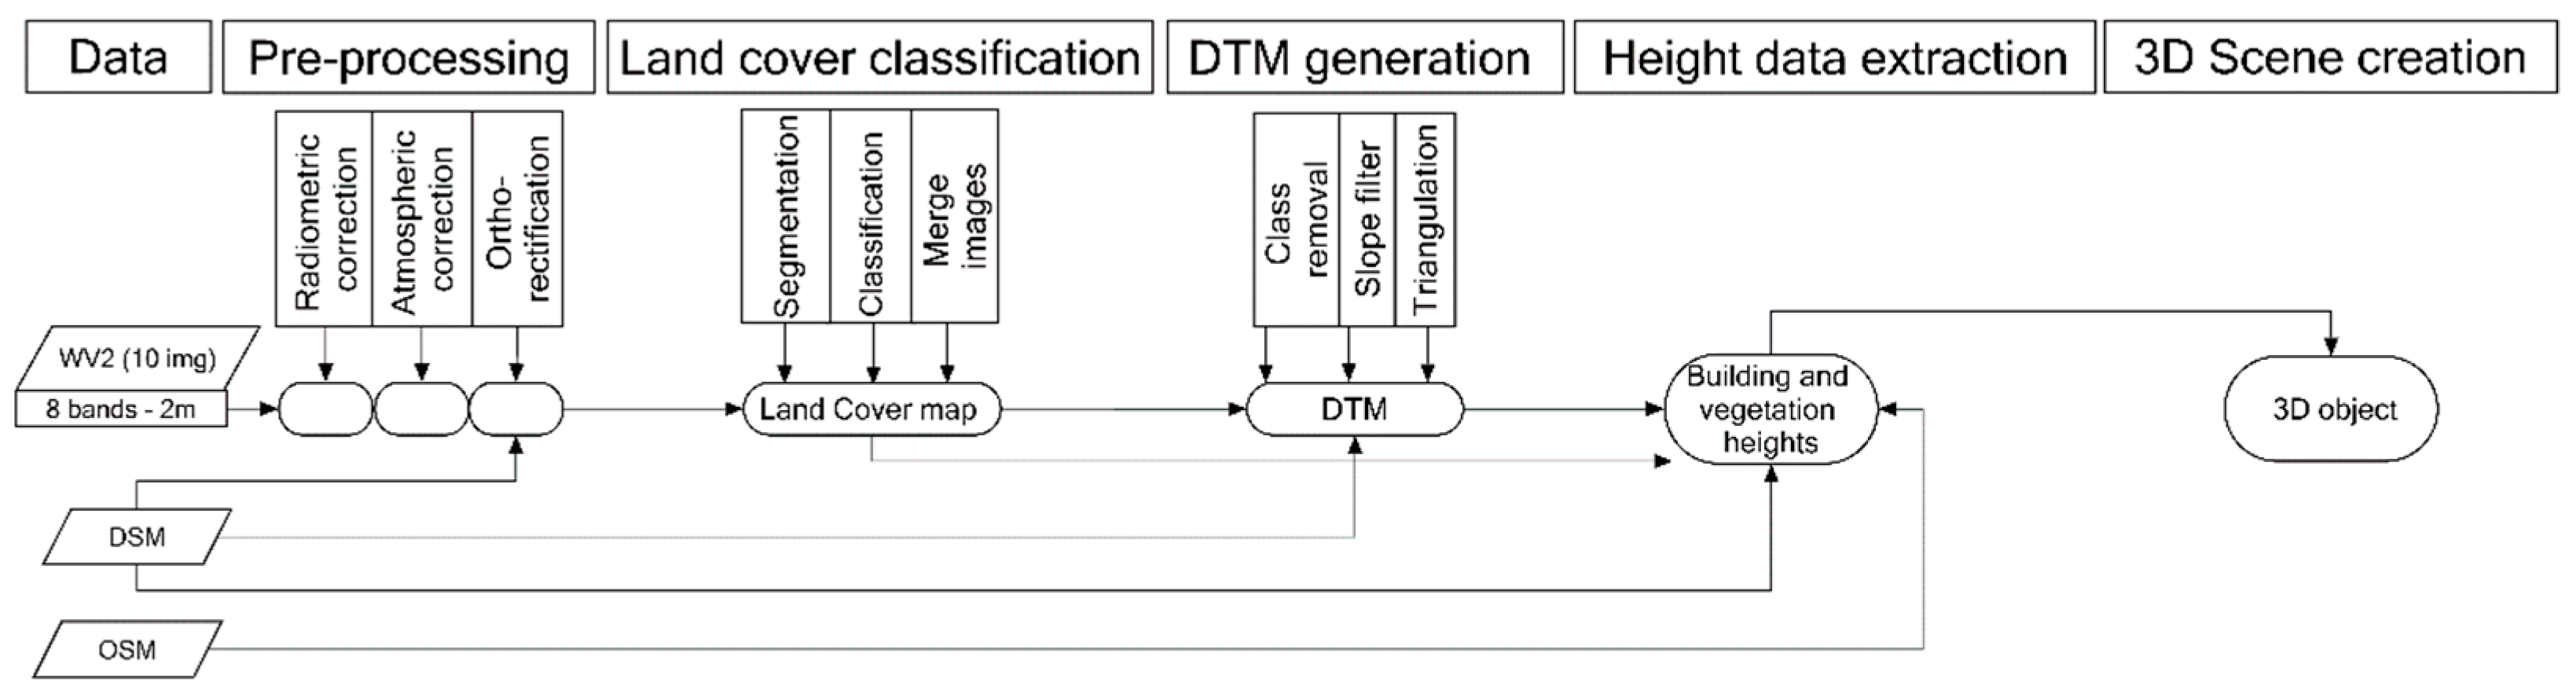
2.1. Generating 3-D Model of a City Using Open or Commerically Available Data

The workflow for creating the 3-D urban scenes consists of five steps presented in Figure 1 and elaborated further down. It should be noted that the resources for creating a 3D scenario in this work are either open or commercial data set. Thus, our approach can be expected to work for most of the cities in the world without involving airborne laser scan, which is either unavailable or security-sensitive in the data distribution.

2.1.1. Pre-processing

Ten high-resolution WorldView2 (WV2) satellite images (8-band, 2m pixel size) were used to map the land cover and vegetation types across Singapore. The preprocessing tasks were carried out using ENVI software and included three steps namely WV2 Radiometric calibration [24], FLAASH atmospheric correction [25], and SPEAR Orthorectification [26]. The FLAASH module requires information on the atmospheric conditions at the time of acquisition of each image, the parameters used are listed in the Appendix A and were obtained for Singapore from the NASA-Aeronet site.

2.1.2. Land Cover Classification

The preprocessed images were analyzed using multiresolution image segmentation and classification using the eCognition software.Due to the high occurrence of cloud cover and shadow effects, manual reclassification was required in the areas with low quality data. Two additional Quickbird images were analyzed and resampled to 2 m to fill up the remaining gaps towards the full data coverage over the city of Singapore. The classification resulted in twelve images classified into trees, grass, shrub, bare, built and water. The classified outputs were merged prioritizing the images with latest acquisition date. An image of the land cover map for Singapore can be found in Appendix C.

2.1.3. Digital Terrain Model

A digital surface model (DSM) derived from photogrammetric reconstruction of Digital Globe stereo satellite images (AW3D) was used to derive a digital terrain model (DTM), buildings and vegetation heights. The nominal resolution of the DSM dataset is 1m for the urban areas and 5m for the densely vegetated areas. The relevant tiles for the study area were merged and resampled to 1m. The DTM was generated in three steps. First, a 10 m buffer was created around Openstreetmap building footprint data, then, the areas corresponding to buildings, their buffer and vegetated areas were removed. The resulting areas were used as “bare earth points”. To avoid errors due to the effect of tall buildings or misclassifications in the land cover map, the second step was to use the DTM slope-based filter [27], with the search radius and slope parameters set between 30–50 and 10–15 respectively. Finally, the terrain model was reconstructed using the module multilevel B-spline Interpolation [28] and smoothed using a Gaussian filter.

2.1.4. Height Data Extraction

Building and vegetation heights were obtained by cross-referencing the DSM and the DTM with building location data and the vegetation layers of the land cover map. In the case of the buildings, the 90th percentile of the DSM values was used to indicate the roof, and the average of the DTM values for the same area was subtracted to it to obtain the effective building height. Vegetation height values were obtained by subtracting the DTM from DSM over the corresponding vegetated areas. Adjustments to the tree height layer were made to avoid clearly erroneous values, such as vegetation getting height values from the buildings in close proximity or densely vegetated showing low values due to the inability to collect ground points in such areas during the DTM generation. With the aim of realistically representing the tree height for simulation, abnormal values were therefore modified by randomly assigning a value ranging between 5 and 16 m.

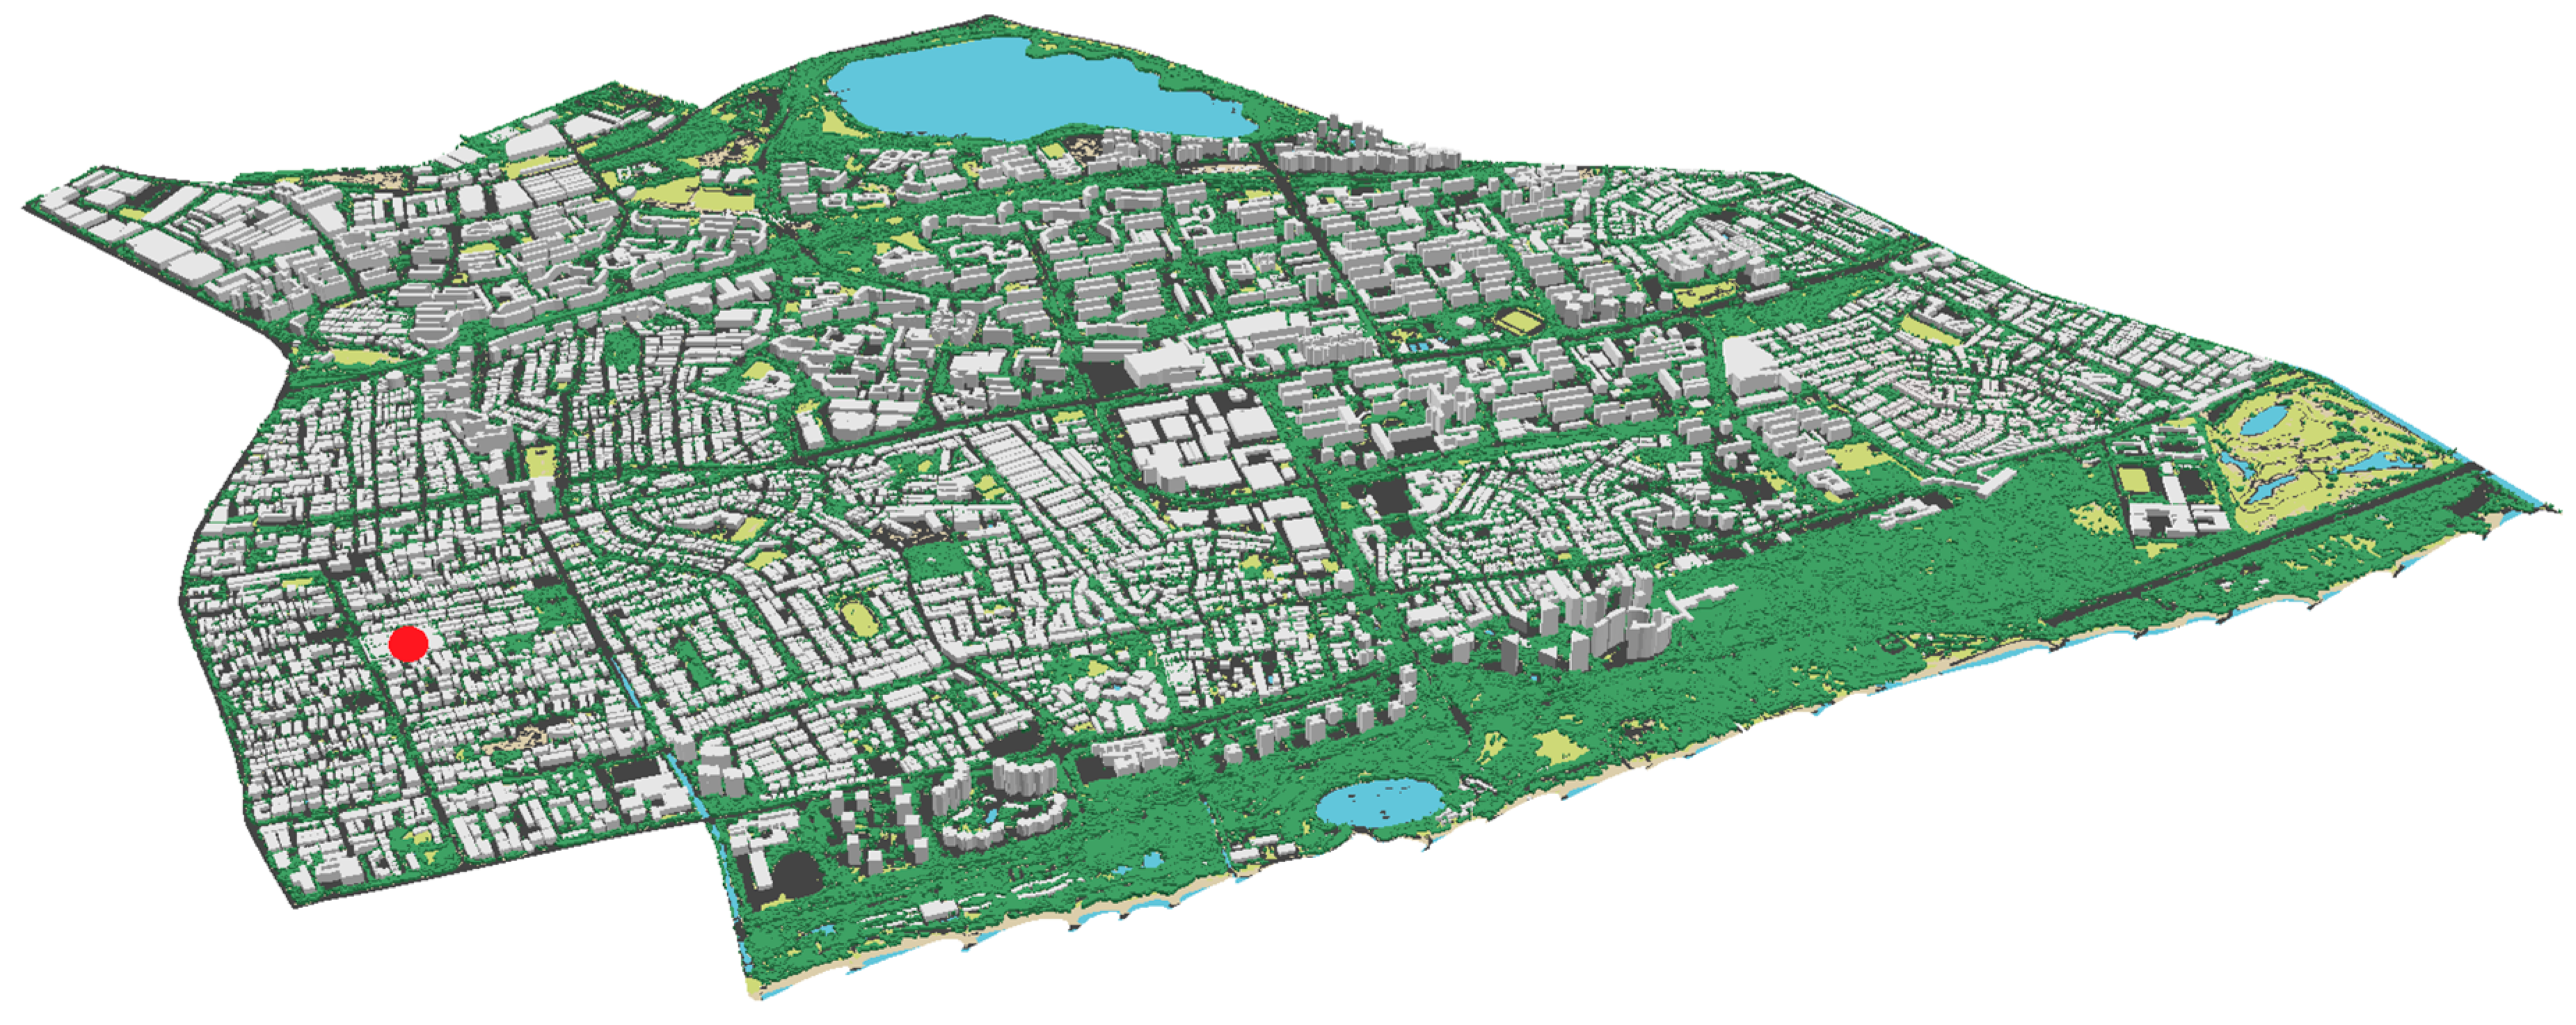
2.1.5. 3-D Scene Creation

A 3-D model of the city was reconstructed with the elements of the scene grouped into trees, buildings, and ground with varying land cover type. Figure 2 shows a sample of the 3-D scene over the study area. There are different ways to incorporate the information layers in a way that can be read by DART. One option is to create a scene in. obj format, in which the elements are grouped by type. In this case, the scene was created using ESRI Arcscene software. The first step is to convert the information layers into shape file format. Then, the “building” shape files are extruded according to their height attribute. The land cover classes, i.e., grass, bare soil, water, and paved are extruded 10cm, in order to be merged with the rest of the scene components. The next step is to export the scene into. wrl format. Finally, the scene was exported into. obj format, keeping the elements of the scene grouped by type. This final task was done using 3DsMax software. The second option is to convert the scene information into ‘DART plots text files’. This method is of relevance specially when creating ‘turbid’ vegetation plots for a given scene. The use of ‘DART plots text files’ enables a higher level of detail describing the elements of the scene and providing a more realistic representation of the tree canopy. Therefore, this method was used to input the trees into DART.

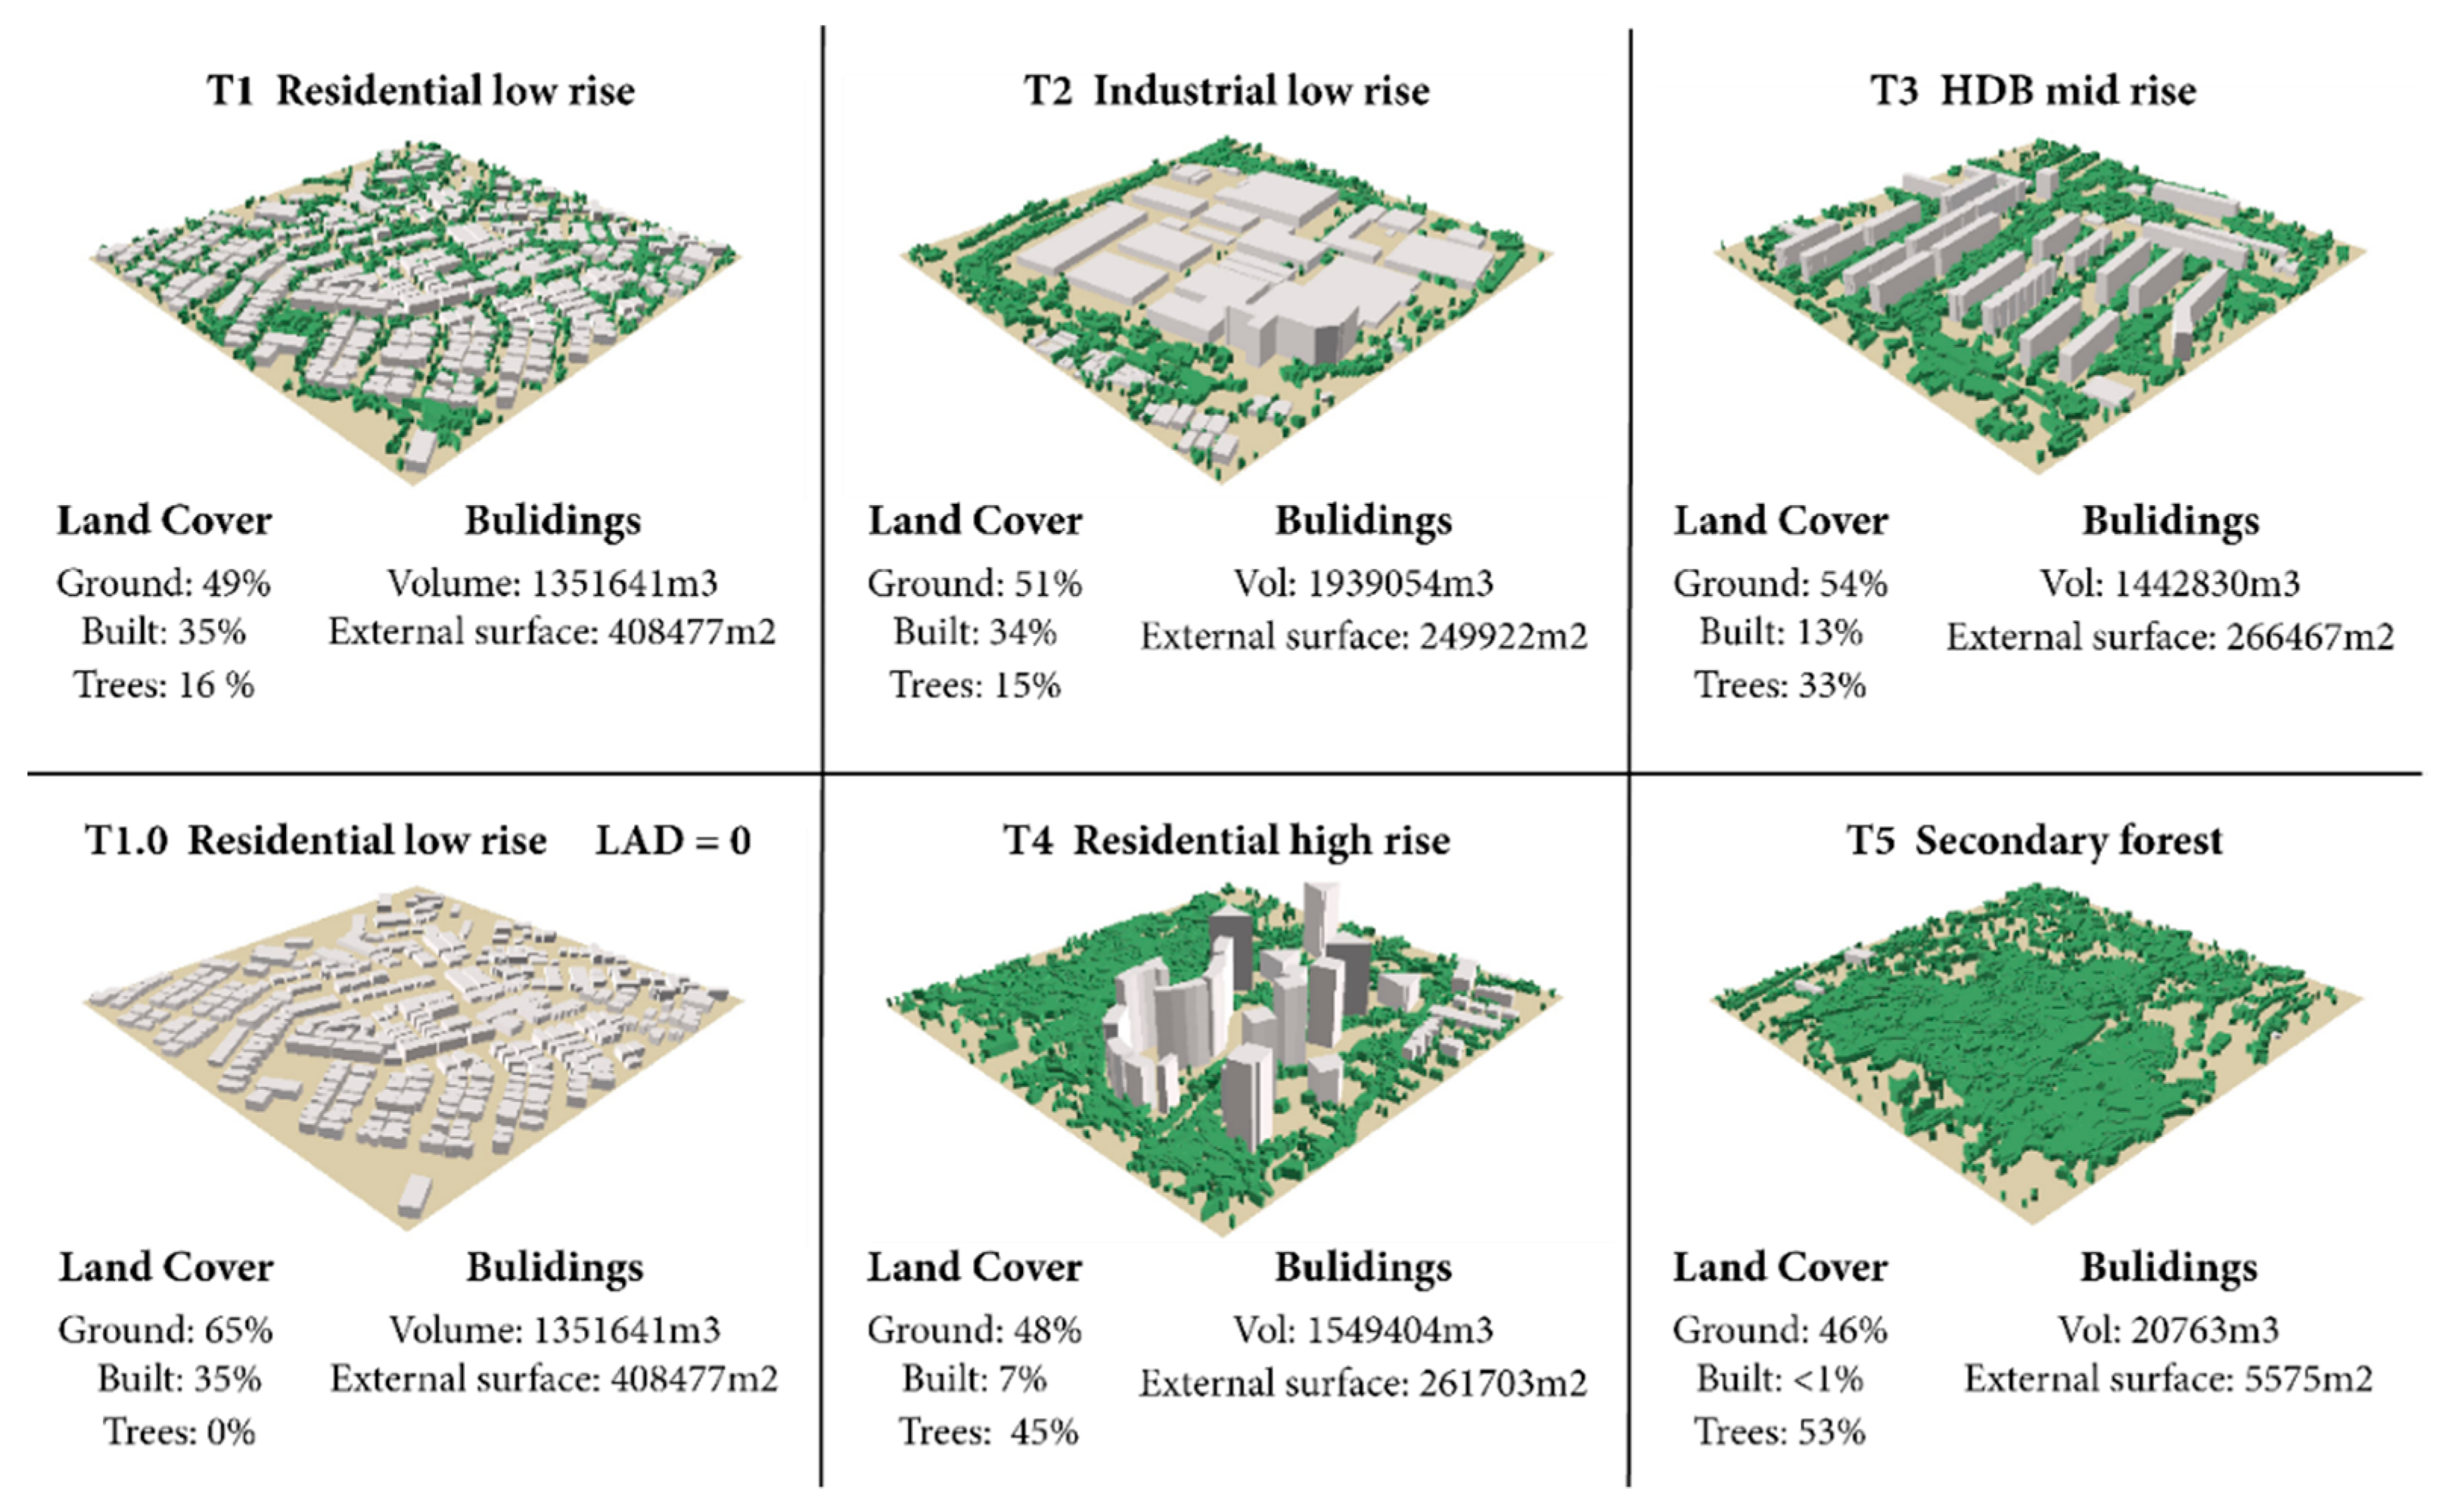
2.1.6. Urban Typologies Selection

Urban plots (620 m × 612 m) were selected and extracted from the 3-D model of Bedok planning area, Singapore. These plots correspond to homogeneous patches representing common urban typologies found in Singapore. Figure 3 summarizes the properties of each scene.

2.2. Quantification of the Influence of Vegetation on the Radiative Budget of 3-D Urban Scenes

2.2.1. Field Measurements of Leaf Area Density

Terrestrial LiDAR scanning (TLS) measurements are increasingly being used to describe the 3-D spatial variability in canopy structure and to retrieve biophysical properties such as LAI and LAD [29,30]. This project uses TLS measurements to estimate the LAD, a property used to quantify canopy foliage as one-side area density within a given volume (m2/m3). TLS measurements of common urban trees were collected at various locations in Singapore. Similarly, additional samples were collected on continuous vegetated patches in urban parks. LAD was computed using VoxLAD, a parametric model which uses computational geometry to estimate LAD at the voxel scale on the basis of TLS point cloud data [31]. The obtained LAD values ranged from 0.2 to 1.

2.2.2. Radiative Transfer Simulations Using DART

The DART model was used to compute the radiative budget of the 3-D scenes considering the influence of vegetation. The Absorbed Photosynthetically Active Radiation (APAR) represents the amount of incoming solar radiation in the Photosynthetically Active Radiation spectral region that is absorbed by a photosynthetic organism, typically describing the light absorption across an integrated plant canopy. This biophysical variable is directly related to the primary productivity of photosynthesis [32]. In the context of radiative budget and energy balance, APAR relates directly to the amount of energy which will be out of the system. Therefore, to obtain the magnitude of the influence of vegetation, this study conducted series of broadband simulations in the shortwave domain (0.2–3 μm) and in the PAR domain (0.4 to 0.7 μm).
The selected urban plots were imported into DART in. obj format. Optical properties were assigned to the materials accordingly. Similarly, vegetation properties including LAD were assigned to the vegetation groups. The simulations were carried out for the day 23-March-2014, assuming clear sky. The atmosphere was included in the simulation using the database corresponding to a “Tropical-Urban” setting. The aerosol optical depth (AOD) for Singapore was retrieved from the NASA- Aeronet site for the simulation date. The radiative budget was computed at 2 m cell size, at diverse time steps between 7:30 and 19:30. A detailed list of the simulation parameters is shown in Appendix B.

2.2.3. Field Validation

Net radiometer data (CNR1) was obtained from the flux tower measurements at Telok Kurau site in Singapore [33] on date 23-March-2014 for the purpose of field validation. Series of hourly shortwave upwelling radiation simulations were run assuming a clear sky for the same date. The small (200 m × 200 m) 3-D model corresponding to the area of the flux tower footprint was generated. The location of the flux tower is marked with a red dot in Figure 2.

3. Results

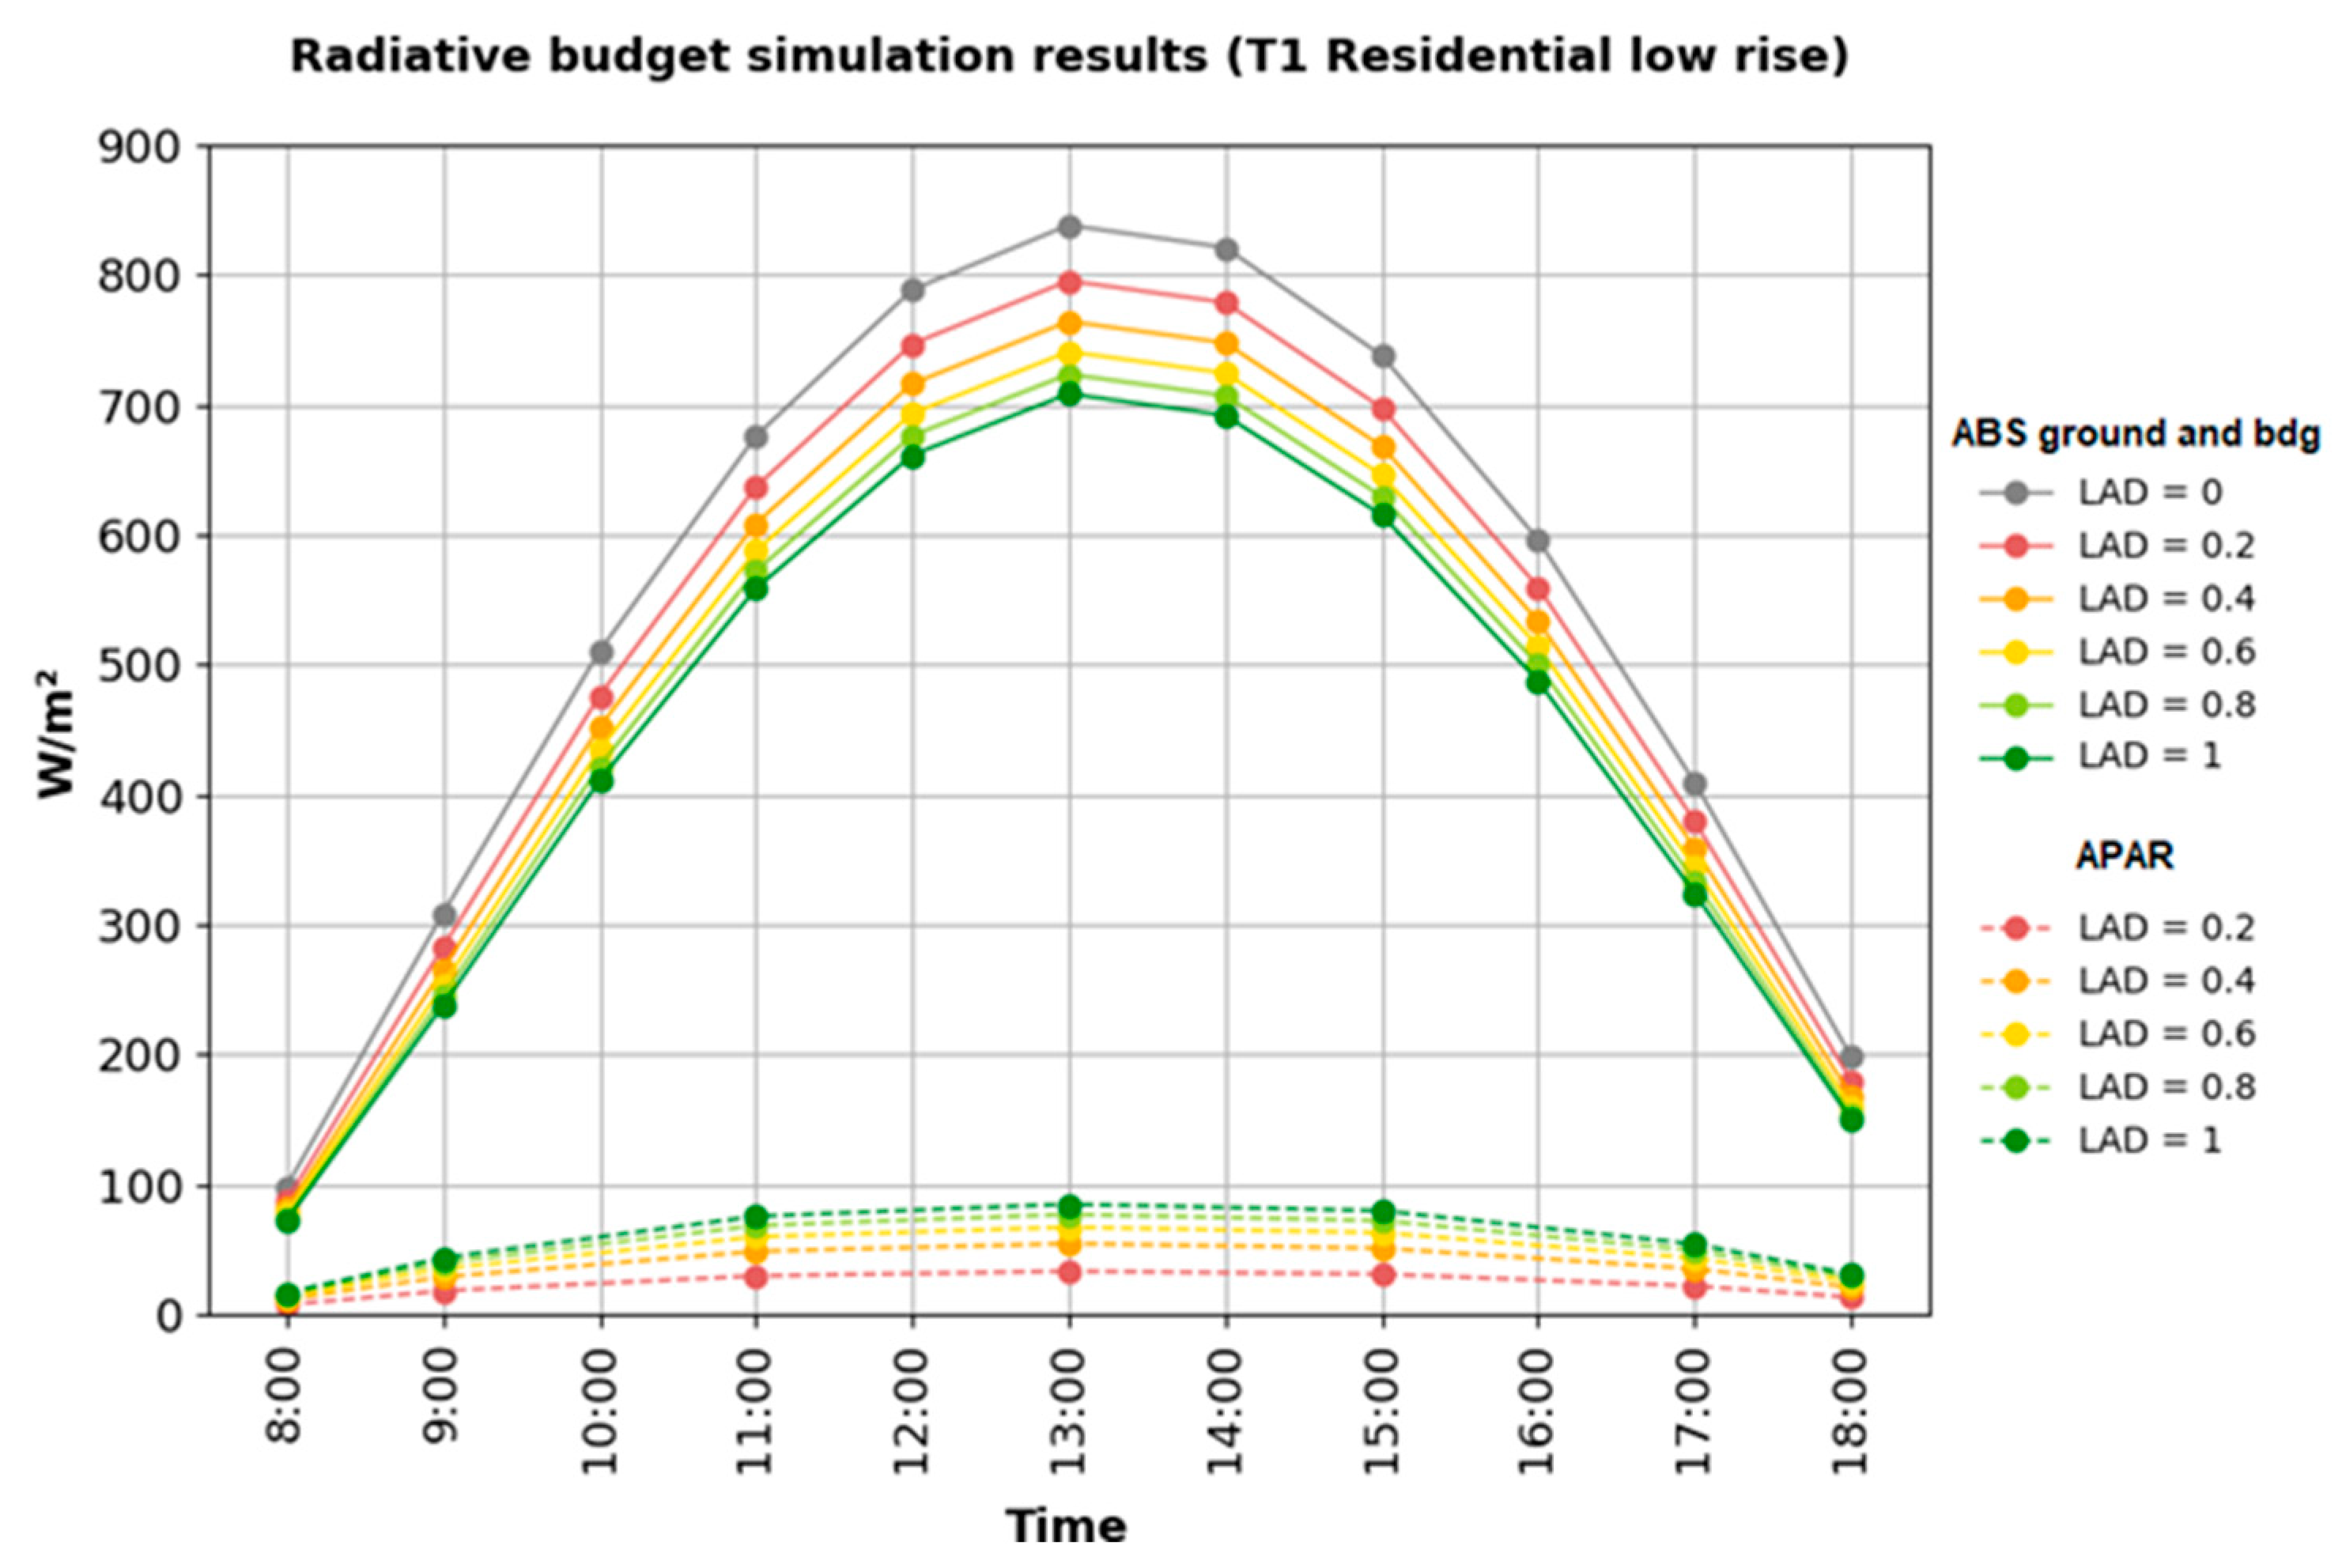
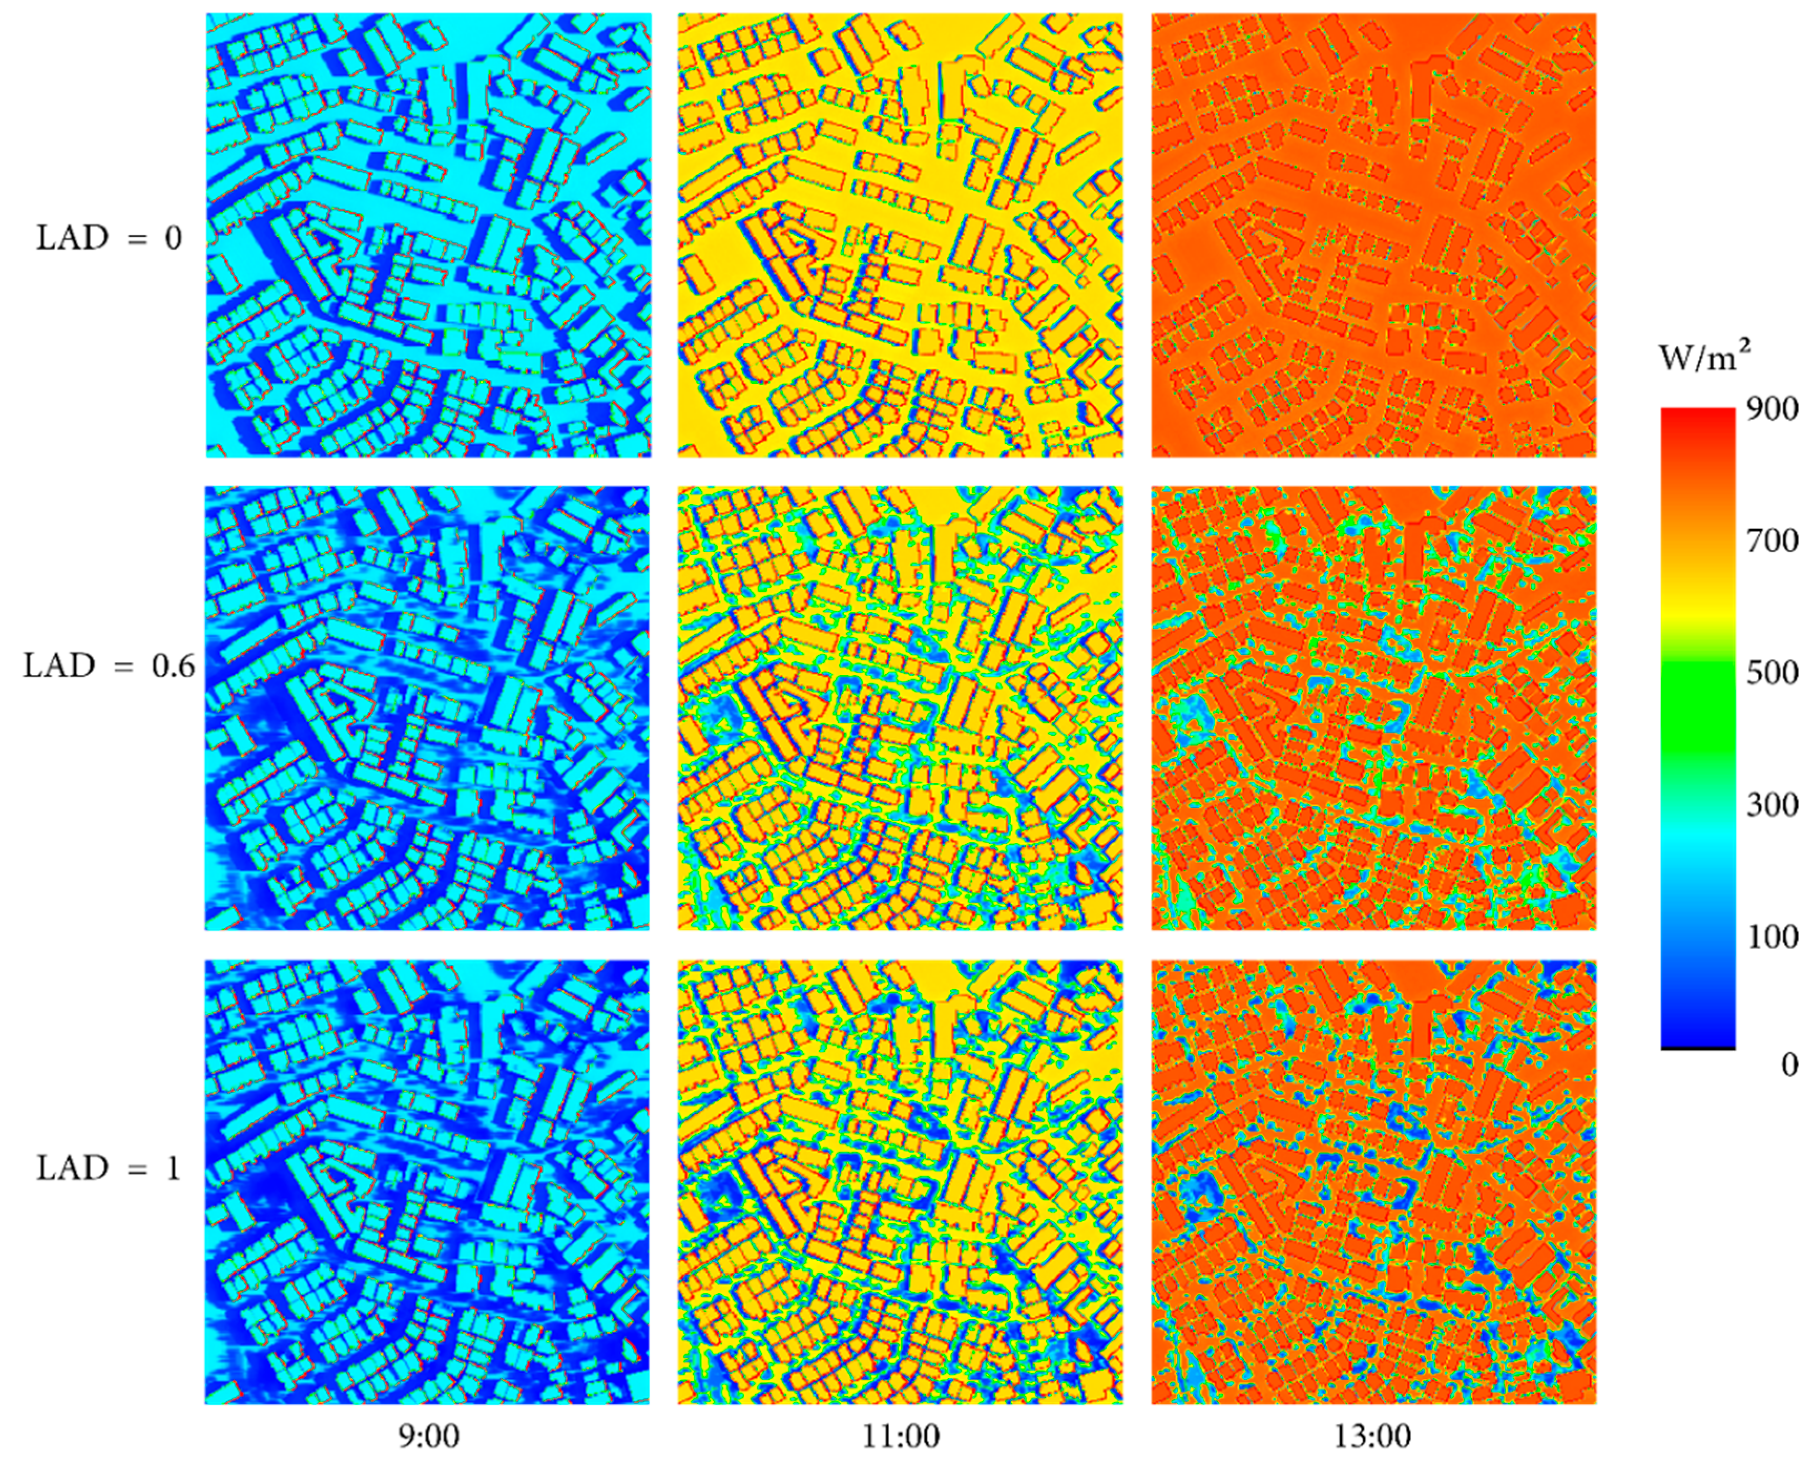
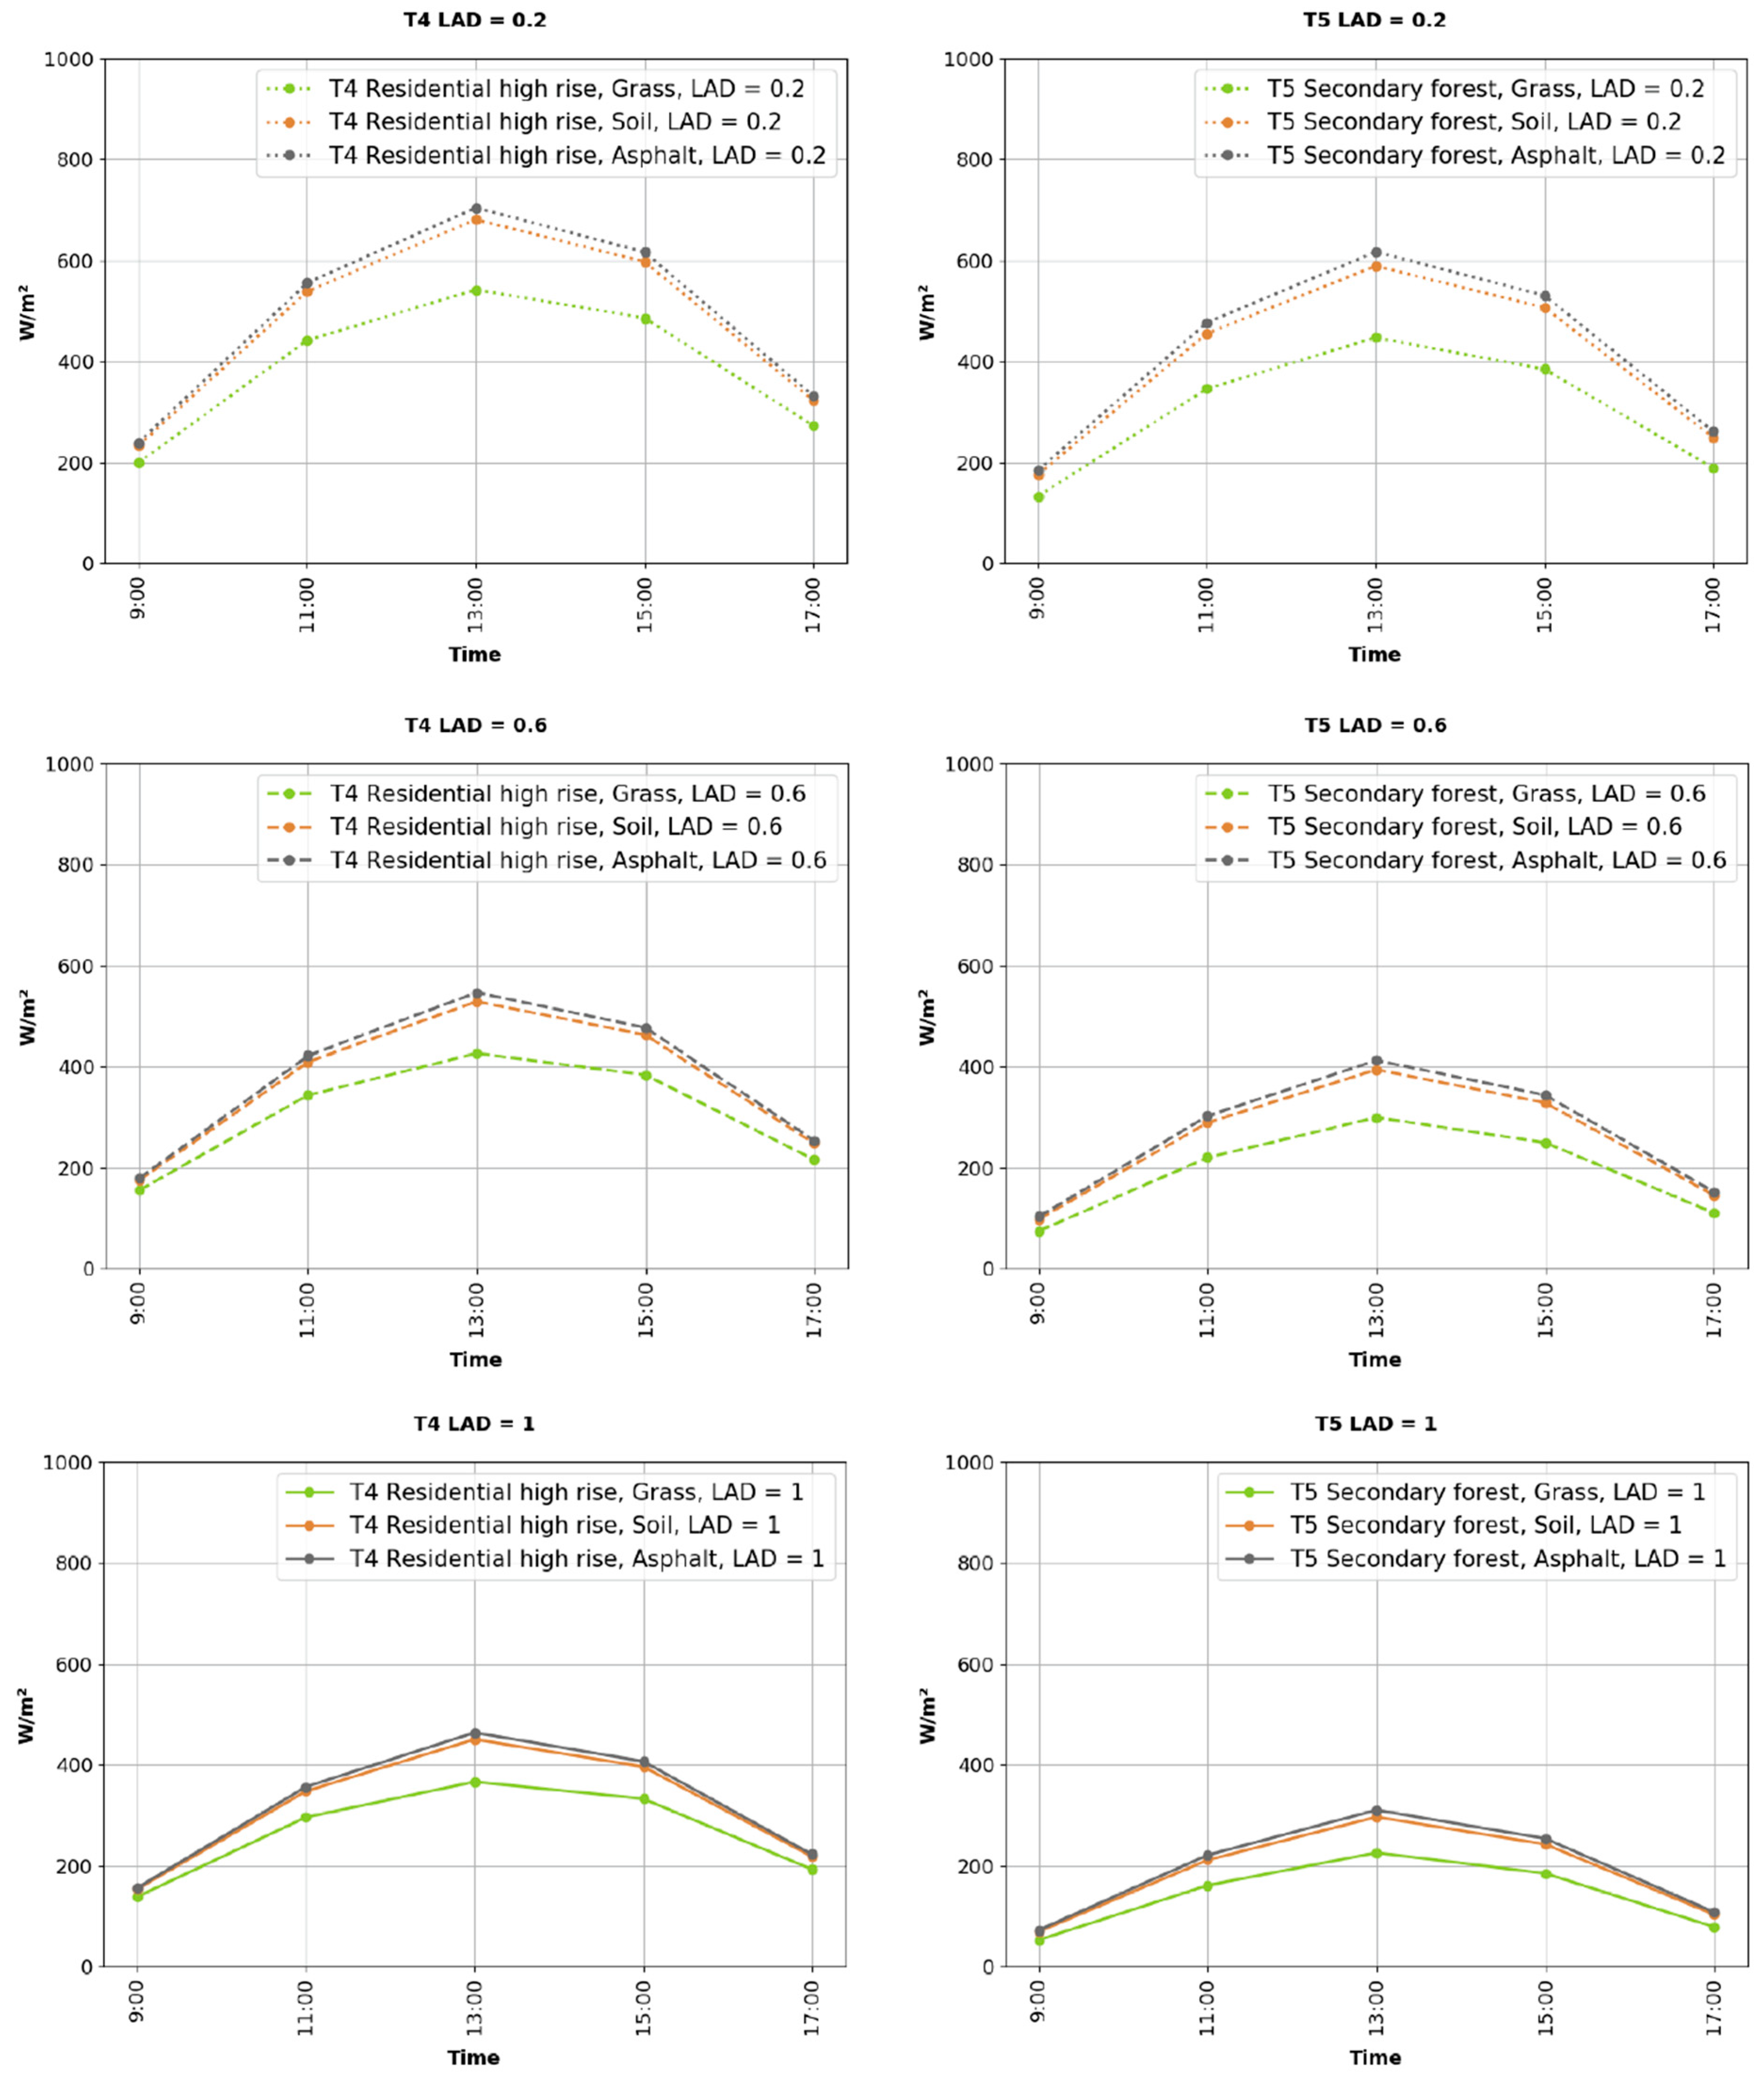
3.1. Sensitivity of the Model to Leaf Area Density

Simulations in the shortwave and Photosynthetically Active Radiation (PAR) domain were run varying the LAD value between LAD = 0 (no trees) to LAD = 1 for the “residential low rise” typology (Figure 4). The results comprise the effect of varying LAD in the amount of shortwave radiation absorbed by ground and buildings and the absorbed photosynthetic active radiation (APAR). The graph correspond to the average of the values of a determined cell type, in this case absorbed radiation by cells corresponding to buildings and cells corresponding to ground. At 13:00, the amount of radiation absorbed by ground and buildings varies in the order of magnitude of 838.2 W/m2 for a scene without trees, and of 708.4 W/m2 for a scene with trees with LAD = 1. The maximum rate of absorption occurs between LAD = 0 and LAD = 0.2. Then, equal increments of LAD, produce a decrease in rate of absorption by ground and buildings. The amount of radiation absorbed by plants for photosynthesis is in the order of 33.0 W/m2 for LAD = 0.2 and 84.7 W/m2 for LAD = 1. Additionally a decrease in the rate APAR is observed toward higher LAD values. A visualization of the localized effect of increasing LAD values per time step is shown in Figure 5. The first row corresponds to simulations with no trees, therefore the shade is casted only by buildings. The third column corresponds to time step 13:00, where we can best see that the higher the LAD value the lower the absorbed radiation by ground and buildings.

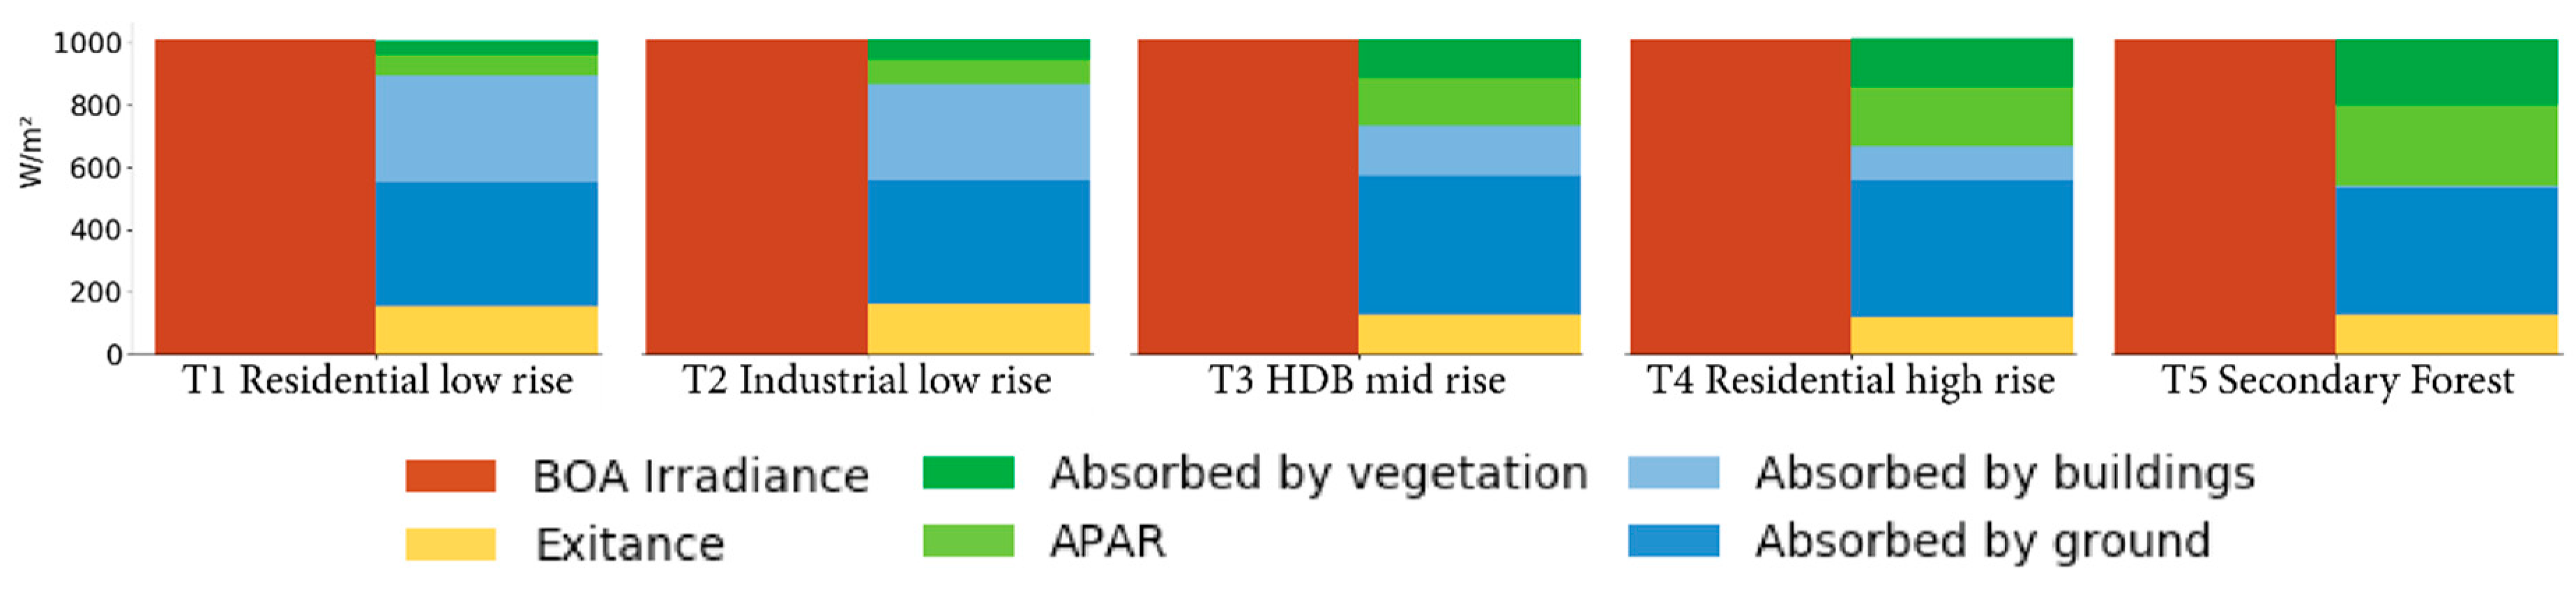
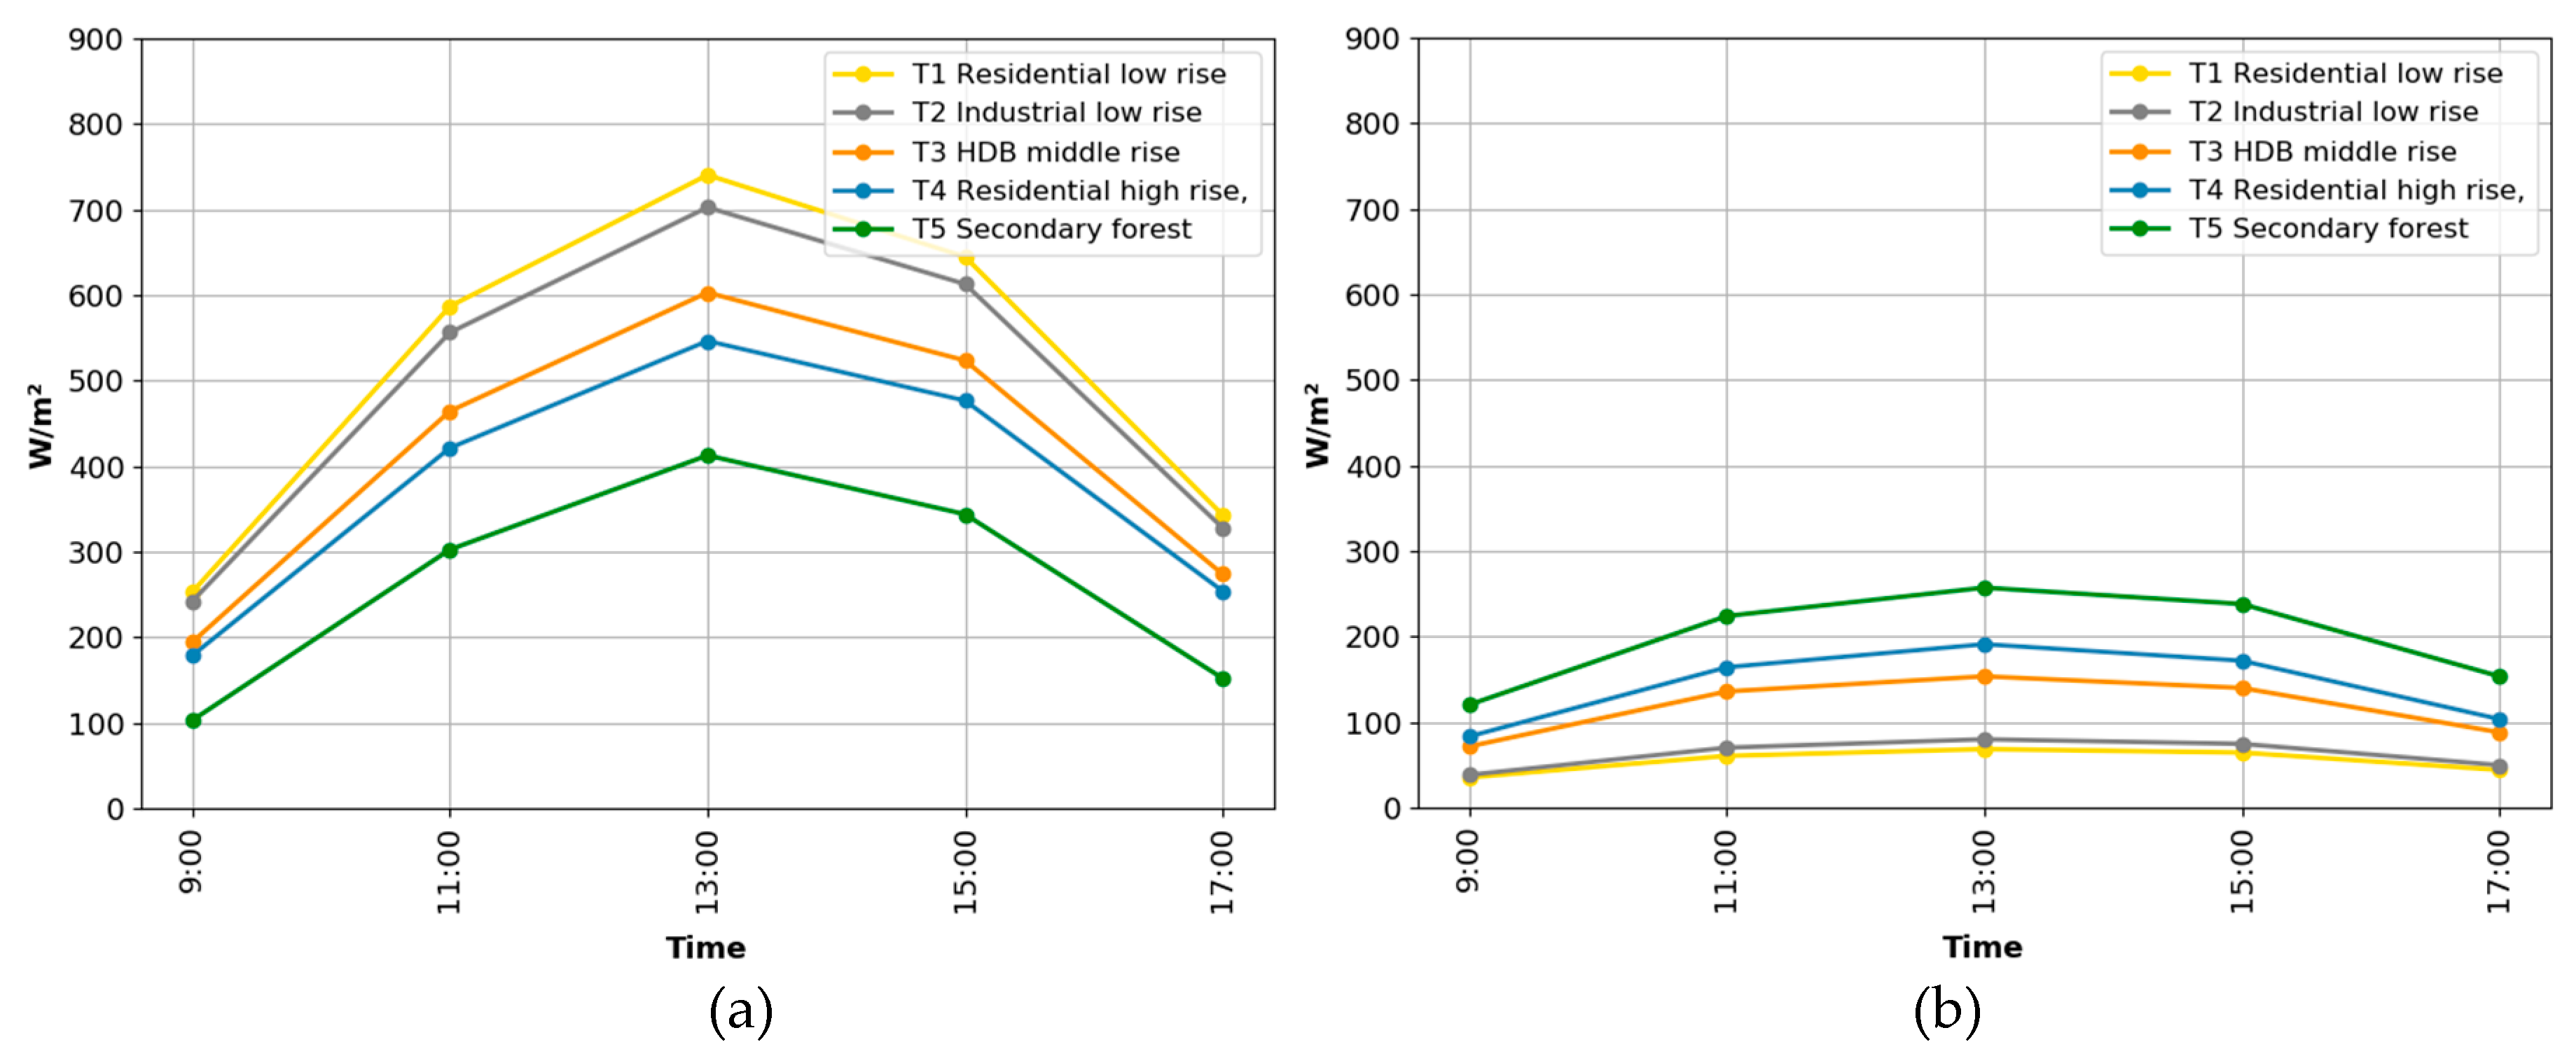
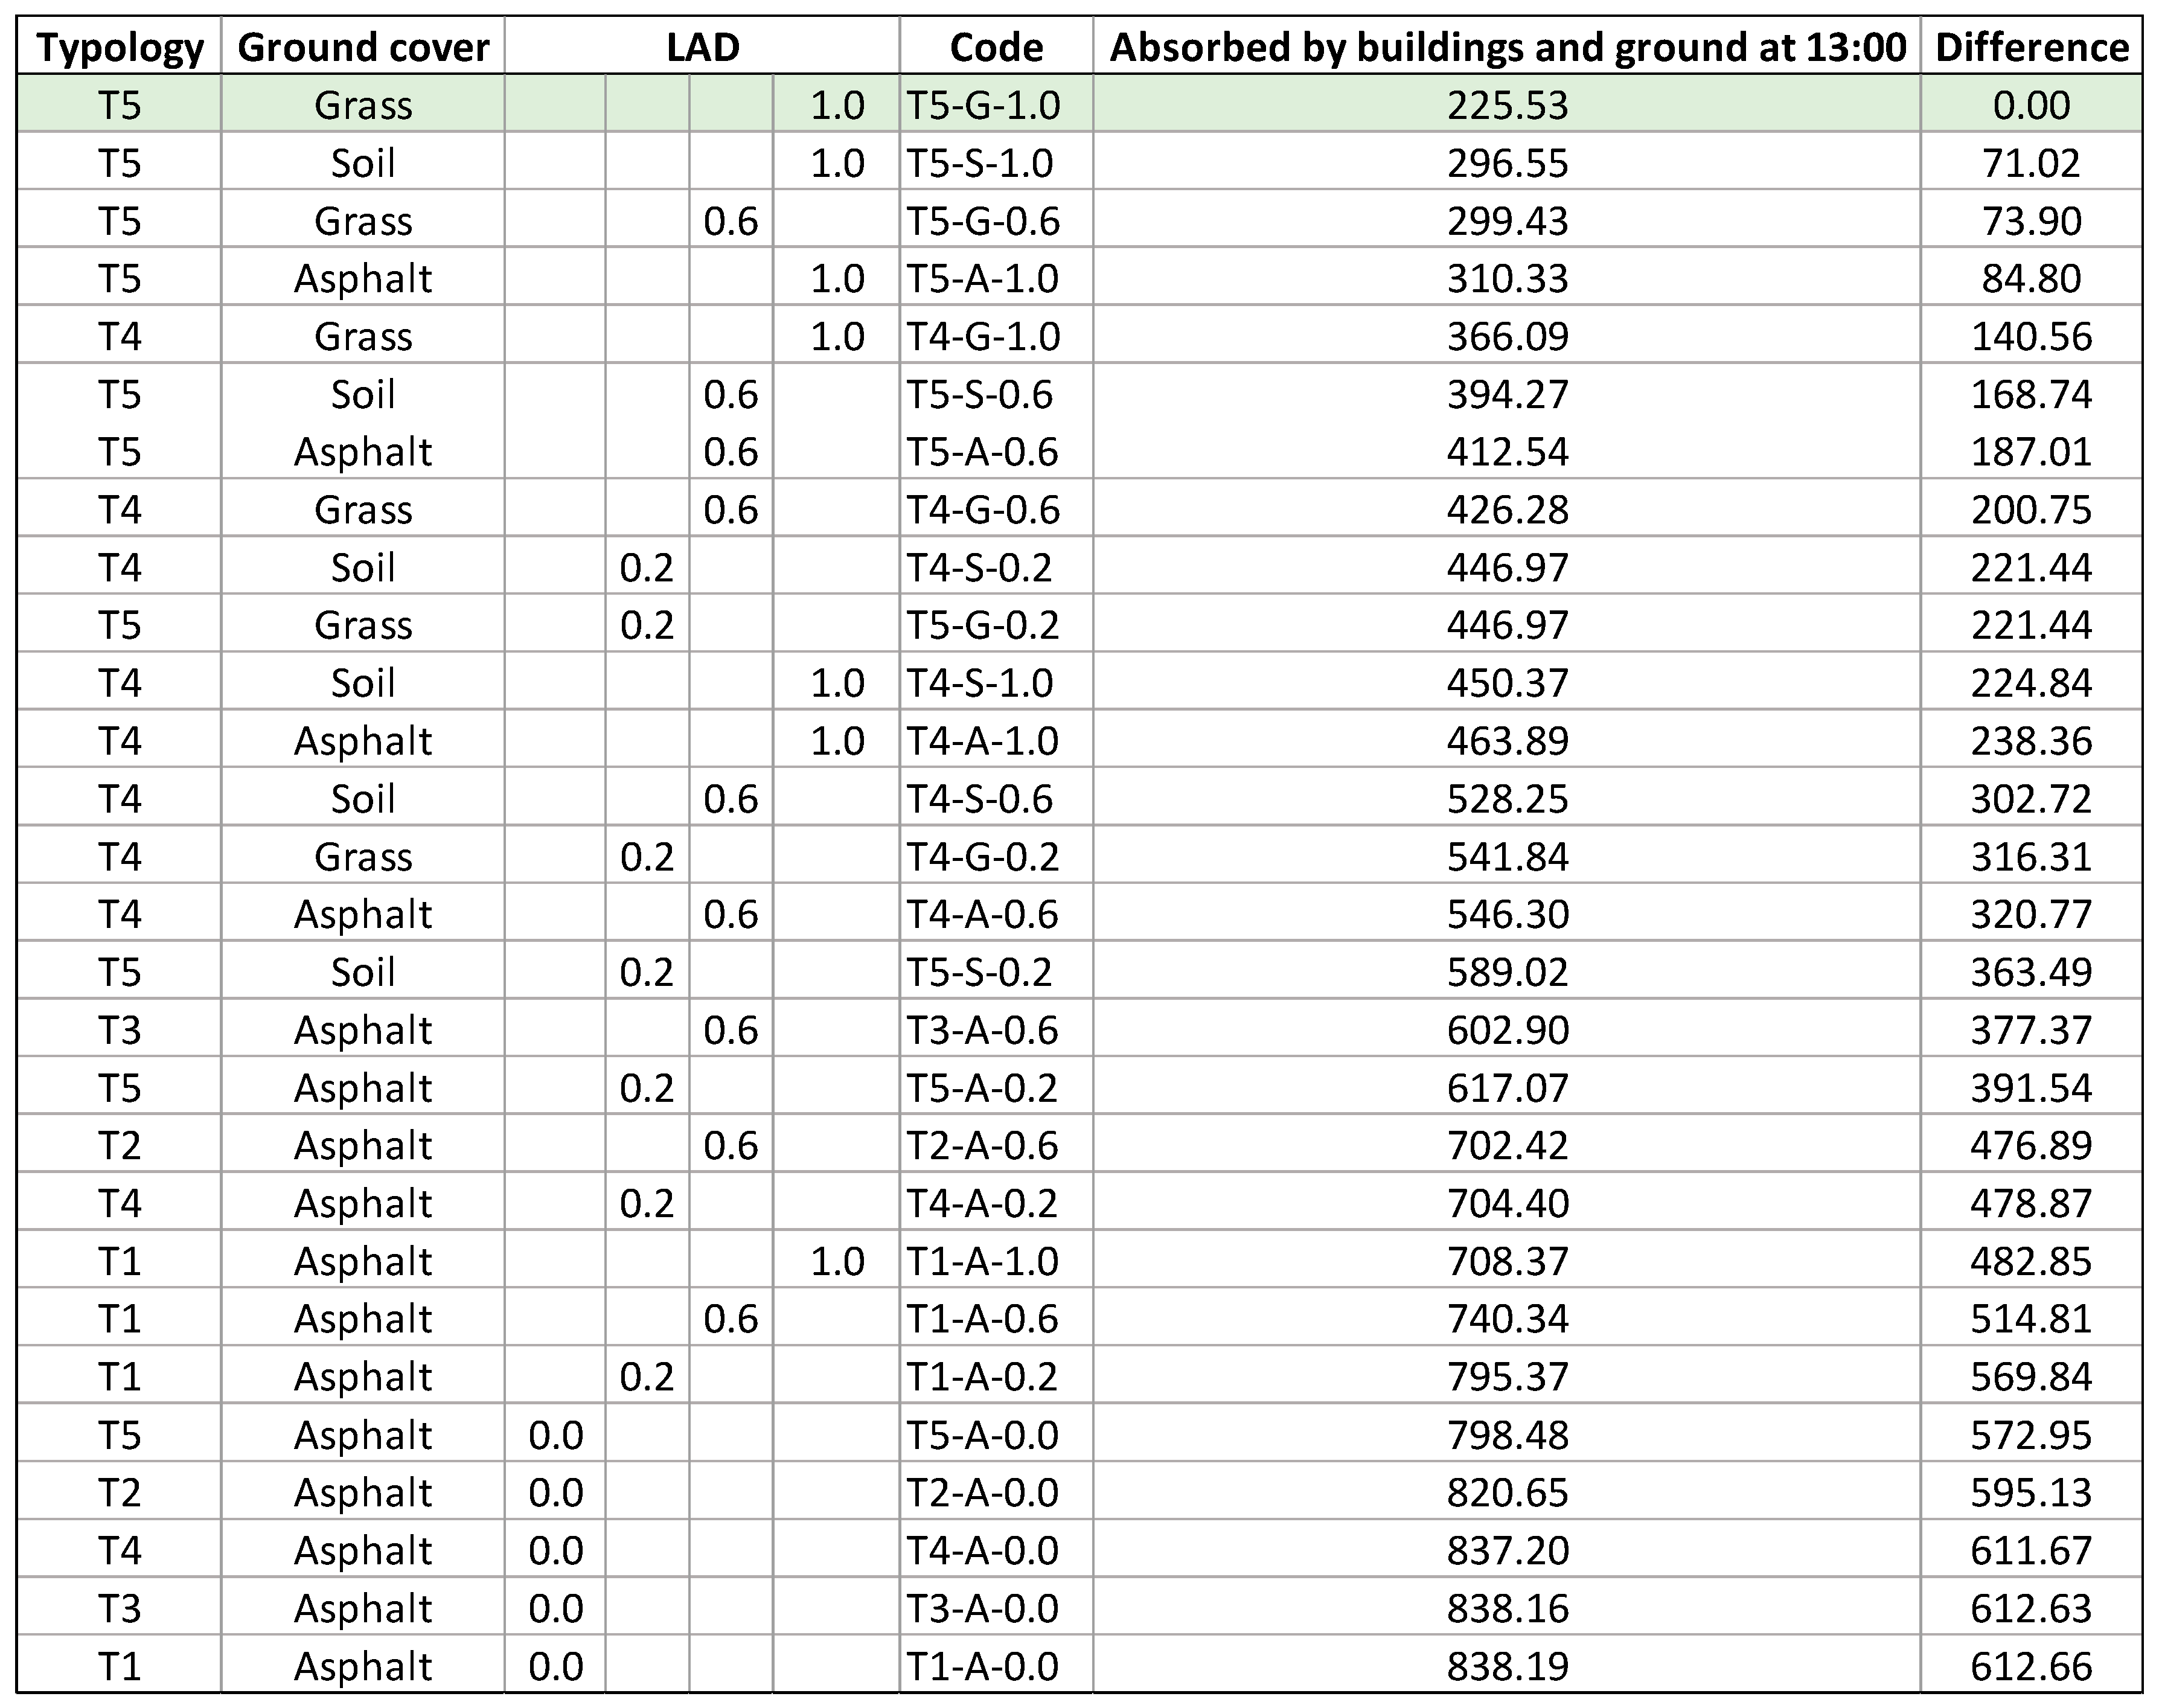
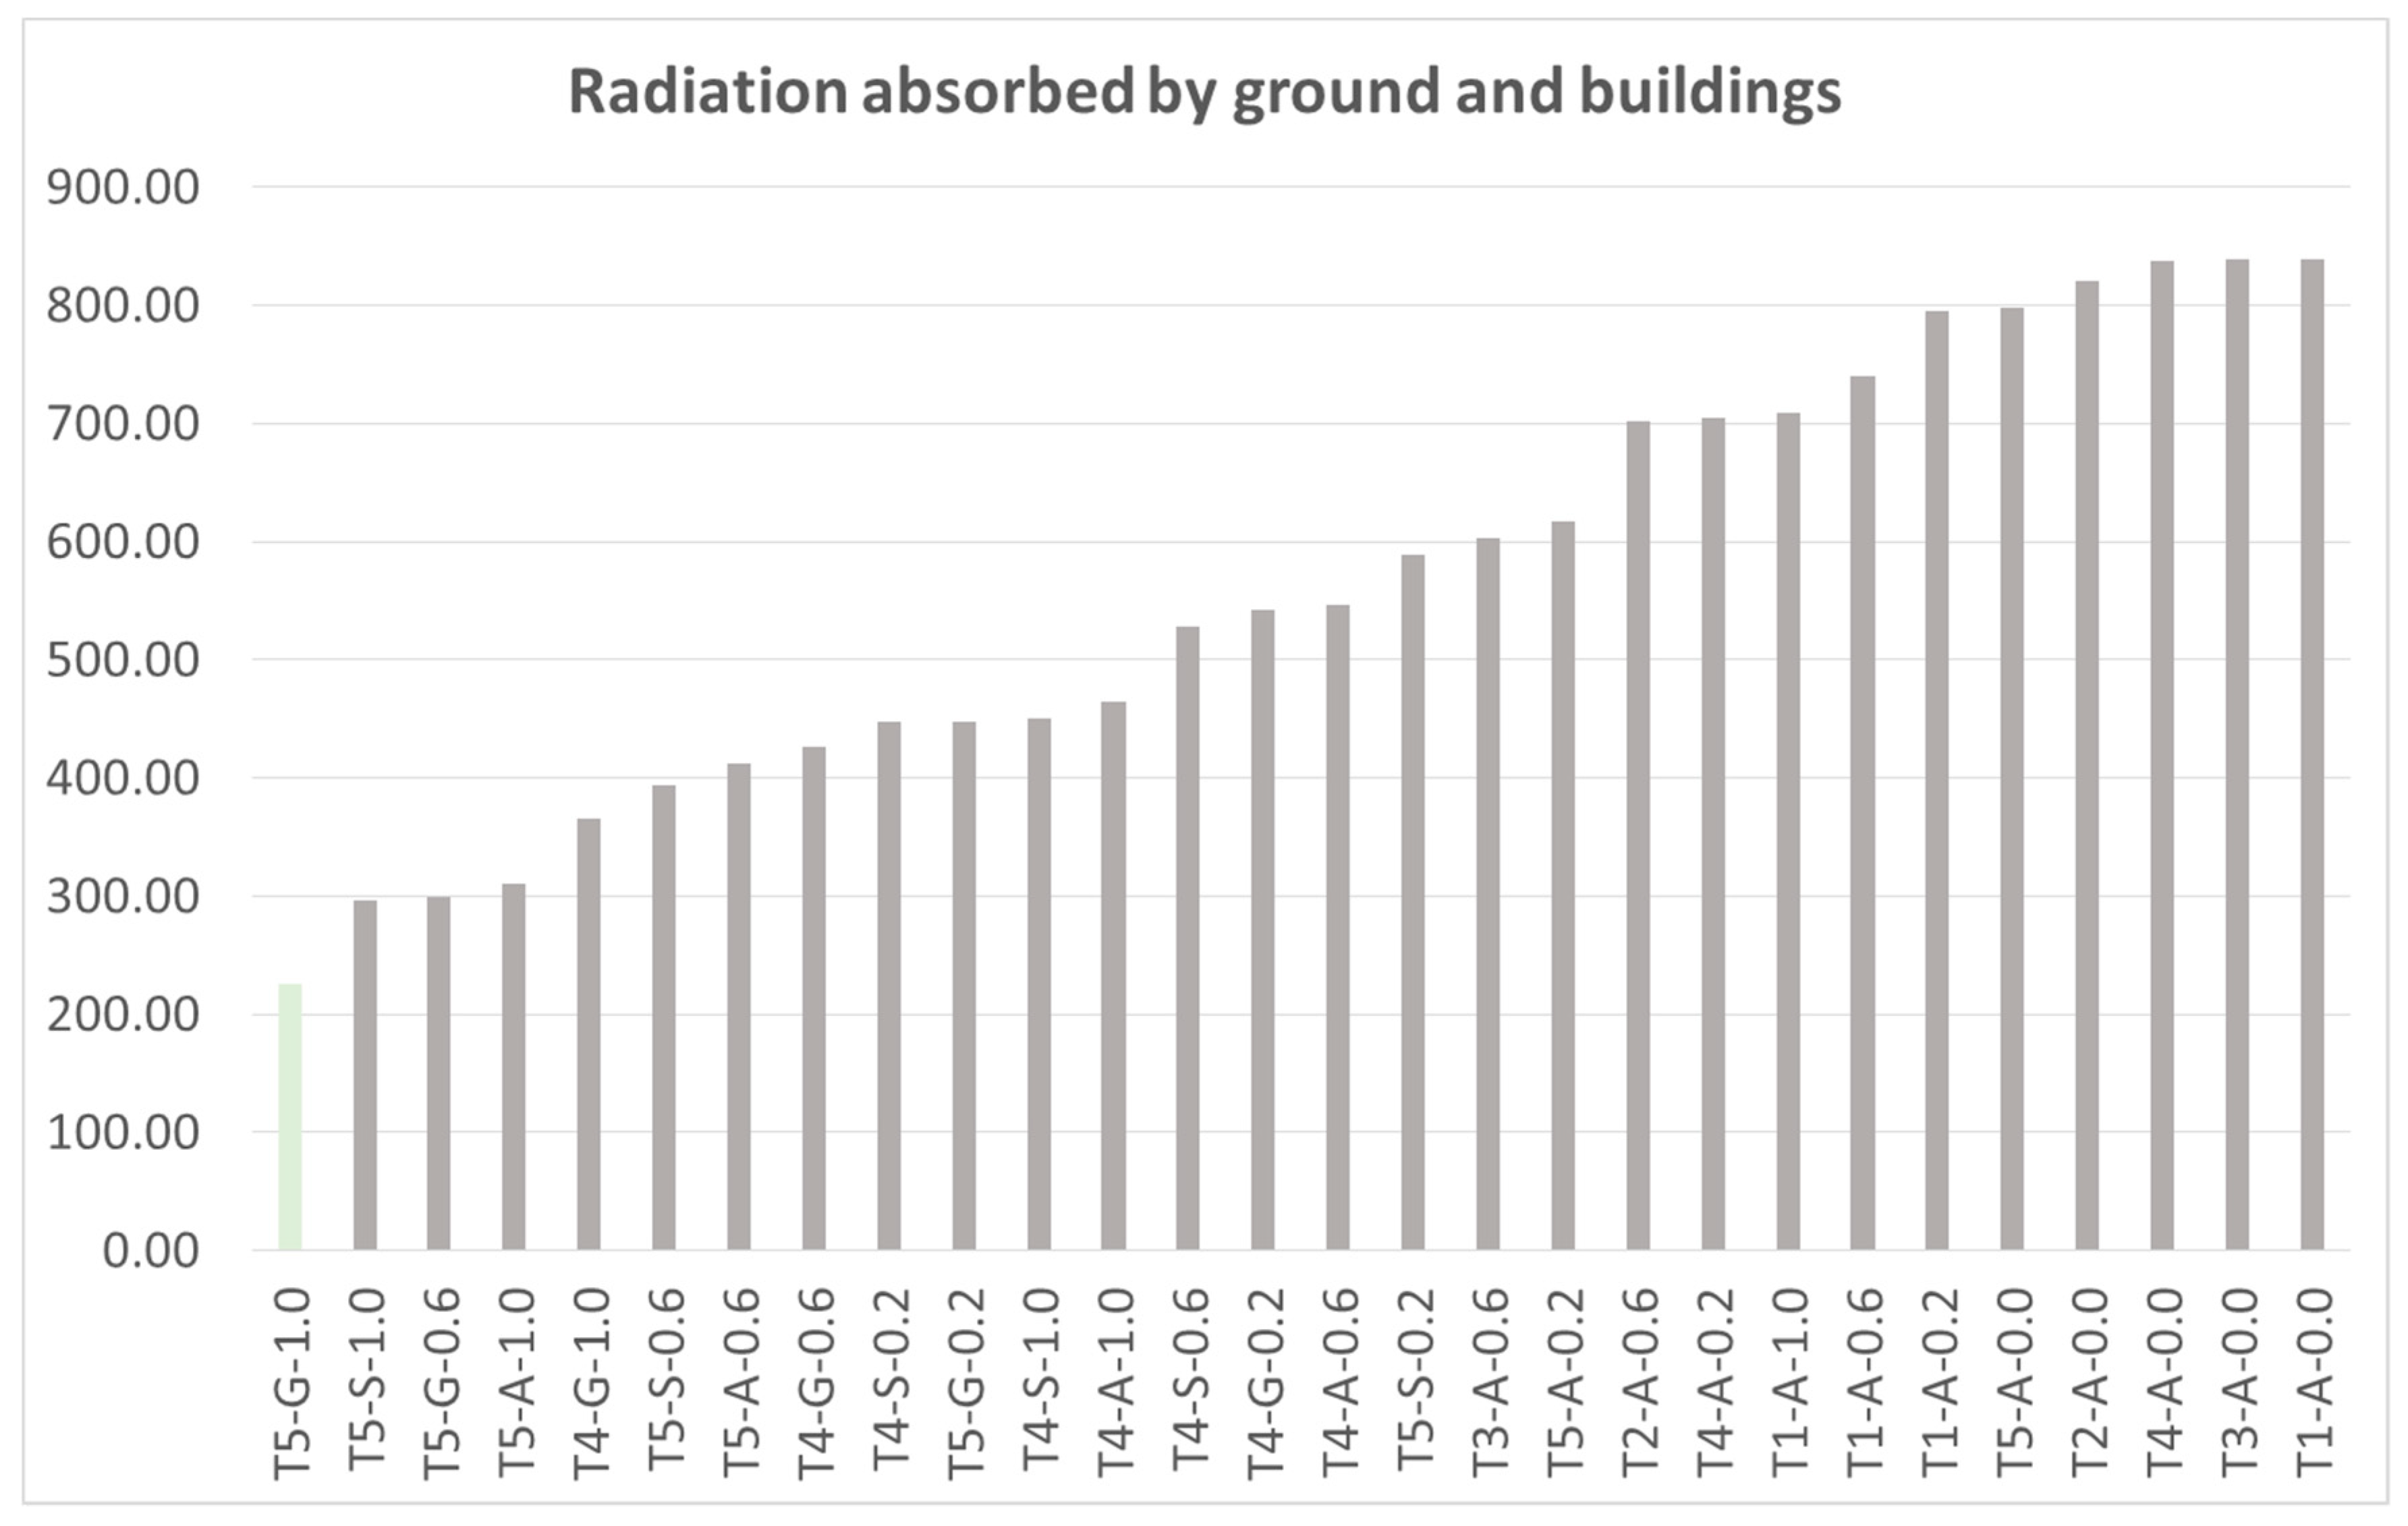
3.2. Comparing the Radiative Budget of Different Urban Typologies

To compare the different urban typologies commonly found in Singapore, a set of simulations was carried out with LAD value fixed to (0.6). The results comprise Bottom of Atmosphere (BOA) irradiance, exitance, and absorbed radiation per object type. These are expressed in series of (W/m2) at each time step between 9:00 and 17:00. Figure 6 summarizes the computed radiative budget for each of the scenes at time 13:00.
When comparing the five typologies in terms of absorbed radiation by ground and buildings (Figure 7a), we observe that “T1 Residential low rise” has the maximum values, decreasing in the order “T2 Industrial low rise”, “T3 HDB medium rise”, “T4 Residential high rise”, and “T5 Secondary forest”, respectively. In this case, the magnitude of absorbed radiation is mainly determined by the external surface area of buildings. Comparing “T1 Residential low rise” against “T4 Residential high rise”, we observe a difference of 194.0 W/m2 at 13:00. In terms of absorbed photosynthetic active radiation APAR (Figure 7b) we can observe that the quantities vary in relation to the amount of vegetation found in each typology. In a “secondary forest” (T5) setting, the magnitude of APAR was estimated to 257.0 W/m2 at 13:00. For the case of “residential low rise” (T1) and “industrial low rise” (T2) APAR at 13:00 is as little as 68.4 W/m2 and 79.9 W/m2, respectively. A 2-D visualization of absorbed radiation by ground and buildings for each typology in five time steps is shown in Figure 8.

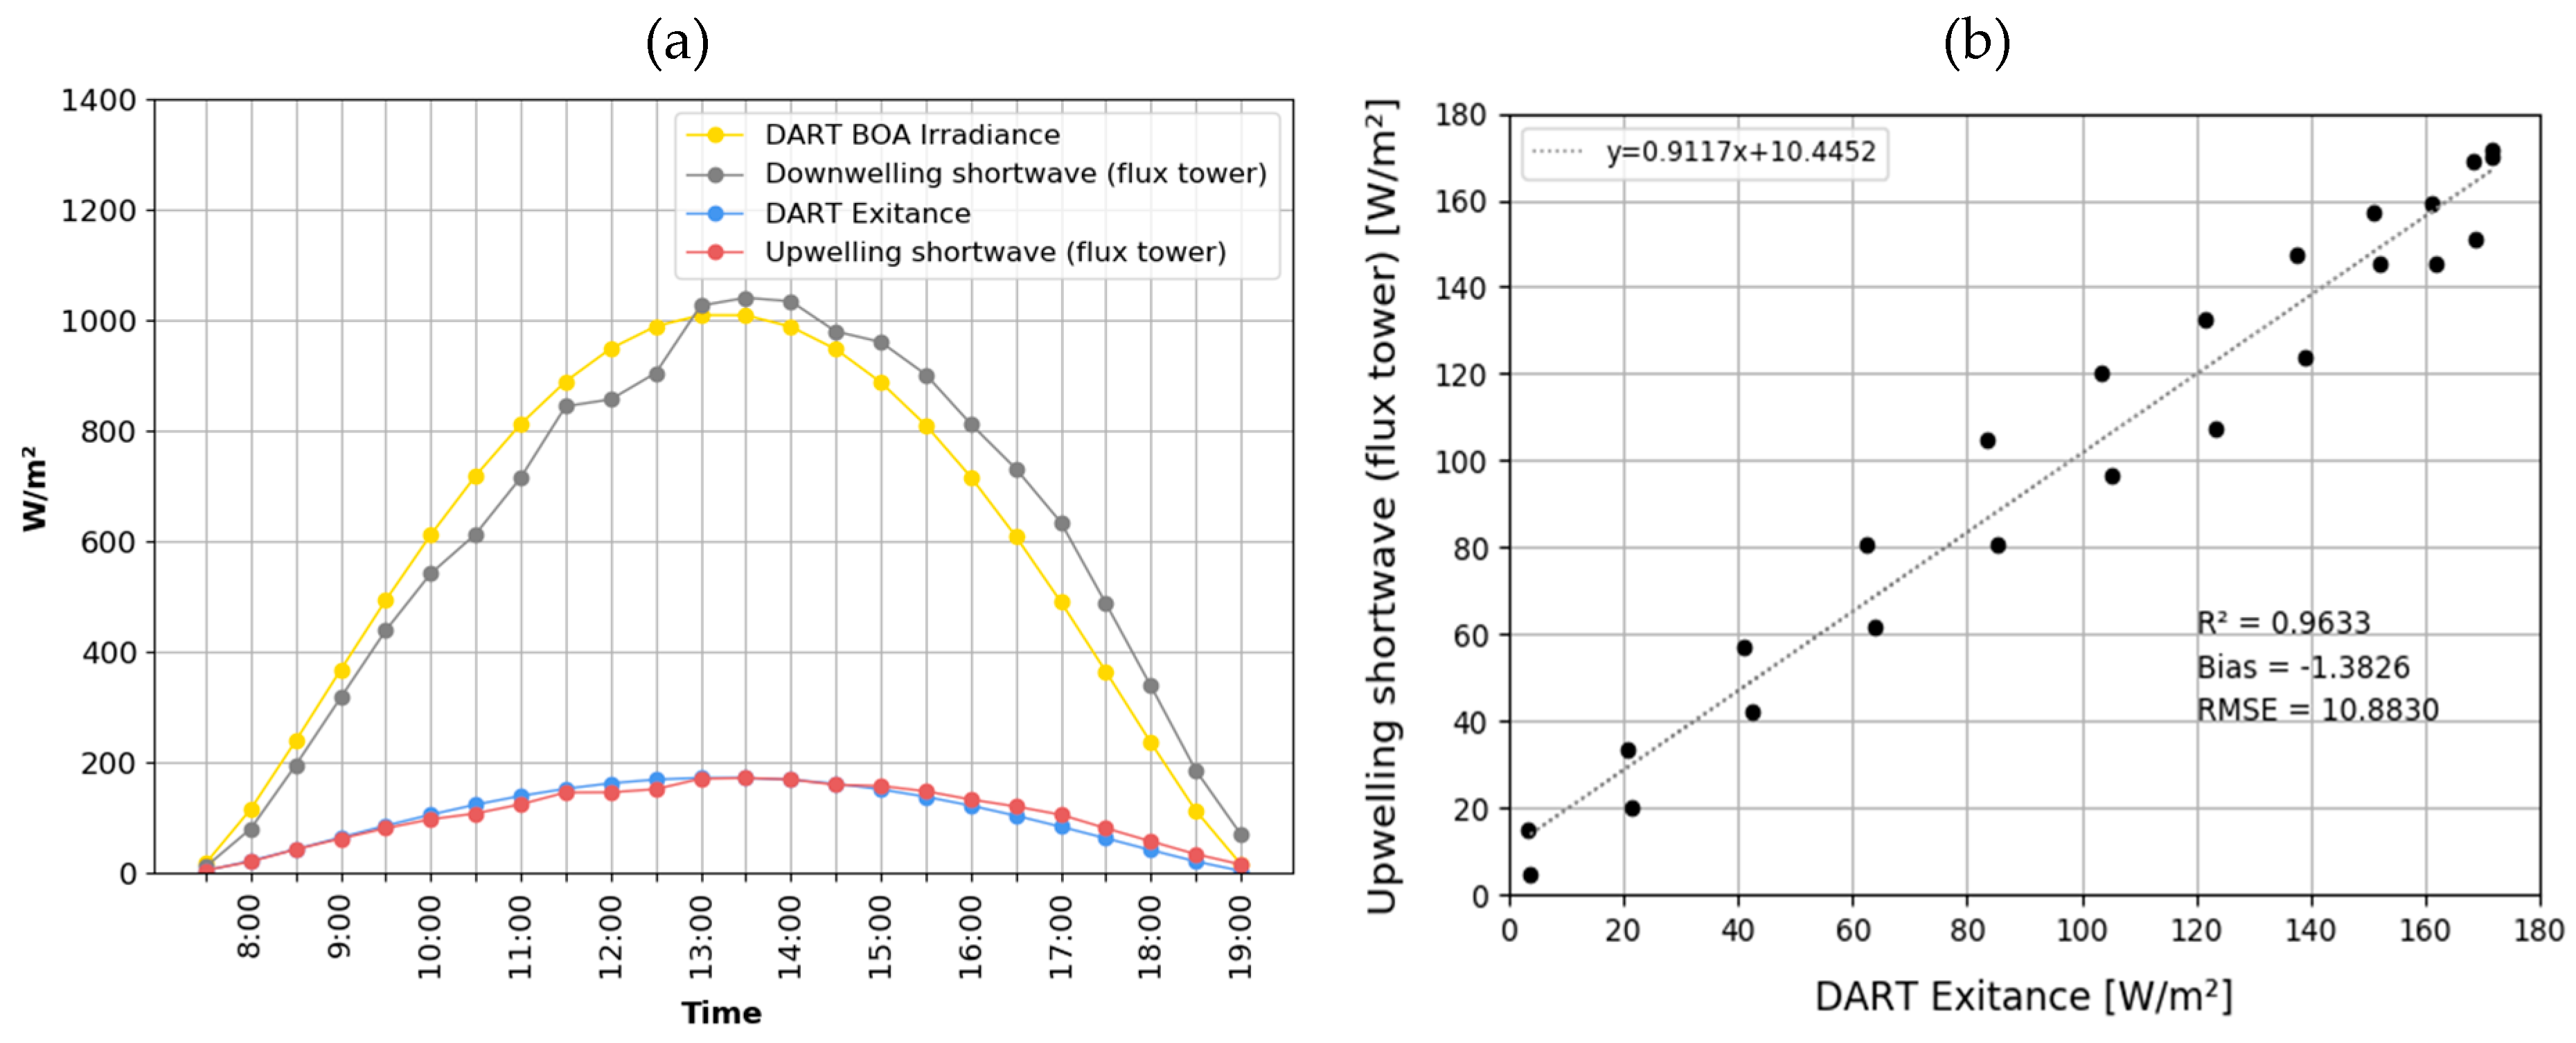
3.3. Shortwave Exitance Simulation and Field Validation

The simulation outputs were plotted against the shortwave net radiometer field measurements as shown in Figure 9b. The site level comparison between shortwave exitance simulations and net radiometer data on 23 March 2014 indicate good agreement (R2 = 0.9633; RMSE = 10.8830; Bias = −1.3826) for the study period over Telok Kurau flux tower. This date corresponds to the day with lowest cloud cover reported. Our simulation results therefore, represent the maximum attainable values over a day with clear sky. Notice there is a slight delay of observed value comparing with the simulated value (15–30 min). There are several possible reasons: (1) the net radiometer integrates the radiant flux within a hemispherical field of view (FOV) at the sensor location. On the other hand, DART models the exact upwelling radiation of the scene that exit through all the upward direction. They are not exactly the same quantity, but they are expected to be consistent. (2) Due to the FOV of the net radiometer, the iron frame of flux tower itself has an influence on the measurements. For example, an obvious sink can be observed for downwelling shortwave radiation due to the shadow projection onto the radiometer; (3) here might be a slightly offset between the net radiometer and the nadir direction.

4. Discussion

3-D computer-based city models have become the base for a variety of tasks related to urban microclimate studies. However, the availability of data for generating such models remains often challenging due to policy or simply lack of spatial information. This work used commercial satellite optical imagery to generate a 3-D model of urban form and vegetation across the entire city of Singapore, providing the data source to run radiative transfer simulations and modeling tasks at any desired location in the city. Such data has also been used in recent work on wind flow simulation and on a study of the urban climate of Singapore [34,35]. The accuracy of deriving tree height from satellite optical data remains low (3.5 m in this case). Ideally, Aerial Laser Scanning (ALS) would be the best data source for this purpose. However, access to such data remains restricted not only in Singapore, but also in many countries due to the high cost or security reasons. Additionally, this work has repurposed the DART model to perform an analysis of the effects of urban form and vegetation in the radiative budget. By using DART, a spatially explicit 3-D radiation budget can be simulated for any urban or natural landscape at different scales. Our results show good agreement between DART-simulated shortwave exitance and radiometer observations. However, the area corresponding to the footprint of the net radiometer is characterized by a grass field, few buildings and reduced tree cover. Ideally, additional validation sites would be useful to assess the robustness of our method over different vegetation and urban settings. Another advantage of using DART is the possibility to simulate the atmosphere considering real observations of the Aerosol Optical Depth (AOD), for a determined date and location. The adjustment of this parameter took an important role in increasing the accuracy of our simulations when comparing it with real observations. We suggest special attention to adjust this parameter using real observations of AOD for the specific simulation date and time.
One of the limitations of our approach is the simplification in terms of surface material designation. This simplification was made due to the interest in using directly information obtained from a dataset generated using satellite imagery (overall shape, location of the objects, and few land cover classes). This level of detail can be useful for large scale analysis; but is not optimal for analysis at finer scales. Approaches to retrieve optical properties from satellite data exist, for example, in the paper by the authors of [7] surface optical properties were retrieved through an iterative approach based on the 3D urban landscape and the use of DART. This however was not included in our current study. To add more variation, the user could modify the properties of buildings in a generalized way, taking into account the context (i.e., in downtown areas assume facades to be glass dominated, etc.). Our proposed methodology for the creation of a 3-D model of a city includes four ground cover classes (grass, bare soil, paved, and water). These distinct groups can be used to test different properties according to the user’s interest. The within-scene variation of ground cover material was not considered in our current simulations; however, our methodology includes the generation of scenes with variation in ground cover.
The optical properties of surface materials have a dominant effect on the radiative budget; therefore, special attention on the selection of materials is crucial, as this may lead to erroneous simulations and wrong conclusions of the study. The magnitude of the effect of different surface materials on the radiative budget can be inferred by looking at their spectral signature. A graph showing the reflectance of some of the mineral materials within DART database can be found on image (a) of Appendix D. Similarly, graph (b) shows the reflectance curves for few types of trees and grass. Spectral information of local materials/vegetation of interest can be added into the database and used to produce more realistic simulations. To provide an idea of the effect of ground material on the overall radiative budget of a scene, additional simulations testing grass, soil and asphalt as ground cover were run over the typologies T4 “High rise residential” and T5 “Secondary forest”. The complete set of simulation results were compared to a base scenario (T5 Secondary forest; LAD = 1; ground cover = grass) and sorted in terms of the difference in radiation absorbed per scene. The comparative table can be found in Appendix E.
Biophysical and biochemical properties of vegetation such as LAI, LAD, canopy spread, reflectance, etc. are required to obtain realistic radiative transfer simulations, especially at finer scales. In our study, vegetation voxels were created in the regions of the land cover map that correspond to “trees class” and were placed at the upper two-thirds of the total tree height. Then, a unique LAD value was assigned to all the vegetation voxels in the scene. If local LAD data becomes available at larger extents, this information could be added to increase the accuracy of the simulations. Other factors such as leaf clumping coefficient and leaf angle distribution could be considered for simulation; however, they are difficult to measure in the field and to further specify their distribution over individual trees in an urban scene. Therefore, we made the assumption of keeping the same LAD value without clumping. Our methodology proposes using satellite data to produce a 3-D model to perform simulation tasks over an existing situation. If the user would be interested in testing scenarios with changing the percentage of foliage cover this would require to modify the original land cover map, and then redo the steps to produce new scenes. Another possibility would be to use connected component analysis over the vegetation voxels to restrict and reduce the outline of the crown in order to change the clumping without changing the coverage. Further analysis could be performed at finer scales such as neighborhood or tree level using a more detailed consideration of the shape and construction material of buildings as well as the real shape and detailed properties of vegetation. These object inputs, however, need to be done in a 3Dmax or CAD environment, probably more suitable for architects and designers interested in analysis at local scales.
Despite the advantages of DART to perform analysis at different scales, a high level of detail over large scenes will result in longer computation times. Therefore, it is crucial for the user to balance the trade-offs between scene size, level of detail and computation time.

5. Conclusions and Future Work

Studies of the urban microclimate and UHI are gaining more attention in recent years and the related demand for mitigation strategies is on the rise. This research contributes to the development of methodologies to produce data that enable a better understanding of the influence of vegetation and other urban parameters on the radiative budget of urban landscapes. Our study highlights the potential of using DART for detailed 3-D radiation transfer simulations at different scales, opening opportunities for more in-depth treatment of radiation in urban simulations. The field validation showed a good agreement between upwelling shortwave measurements and shortwave exitance simulated by DART. We shortly provided an overview of the sensitivity of the radiative budget to changes in LAD and varying ground cover materials. The results show that the presence of trees in the scenes accounts for a significant reduction of the absorbed radiation by the buildings and the ground. Additionally, our results indicate that highly urbanized landscapes with no tree cover can absorb up to four times more than a densely vegetated “natural” landscape.
Many possible analyses can be performed, for instance future work could be conducted on testing different aerosol optical depths, different ground, roof and wall materials, different tree species and additional vegetation properties; these analysis however, would be ideally carried out using more ad hoc scenes in order to minimize the computation times, while obtaining sufficient results for a detailed statistical analysis. Our future work will explore the adaption of DART for the estimation of mean radiant temperature of urban scenes at different scales. This approach might contribute to more accurate modeling of urban outdoor thermal comfort and could ultimately be used as a tool for planners and designers to evaluate mitigation strategies to reduce the impacts UHI effect.

Author Contributions

Conceptualization, M.A.D. and A.G.-R.; Data curation, M.A.D., T.Y., and S.W.; Formal analysis, M.A.D. and S.W.; Funding acquisition, A.G.-R.; Investigation, M.A.D.; Methodology, M.A.D., T.Y., and S.W.; Project administration, D.R. and A.G.-R.; Resources, T.Y., D.R., and A.G.-R.; Software, T.Y. and A.G.-R.; Supervision, T.Y. and A.G.-R.; Validation, M.A.D. and S.W.; Visualization, M.A.D.; Writing—original draft, M.A.D.; Writing—review & editing, T.Y., D.R., and A.G.-R.

Funding

This research was conducted at the Future Cities Laboratory, Singapore-ETH Centre, which was established collaboratively between ETH Zurich and Singapore’s National Research Foundation (FI 370074016) under its Campus for Research Excellence and Technological Enterprise Programme. Shanshan Wei is funded by the Singapore National Parks Board (Nparks) project “Remote Sensing for Urban Tree Management: Species Classification and Health Monitoring’.

Acknowledgments

The authors would like to thank Jean-Philippe Gastellu and the DART team of CESBIO (CNES, CNRS, IRD, University of Toulouse) for the consistent support with DART model and Erik Velasco (Independent Researcher) and Matthias Roth (Geography Department, National University of Singapore) for providing the shortwave net radiometer data used for validation. The authors appreciate the valuable remarks and suggestions from anonymous reviewers.

Conflicts of Interest

The authors declare no conflicts of interest.

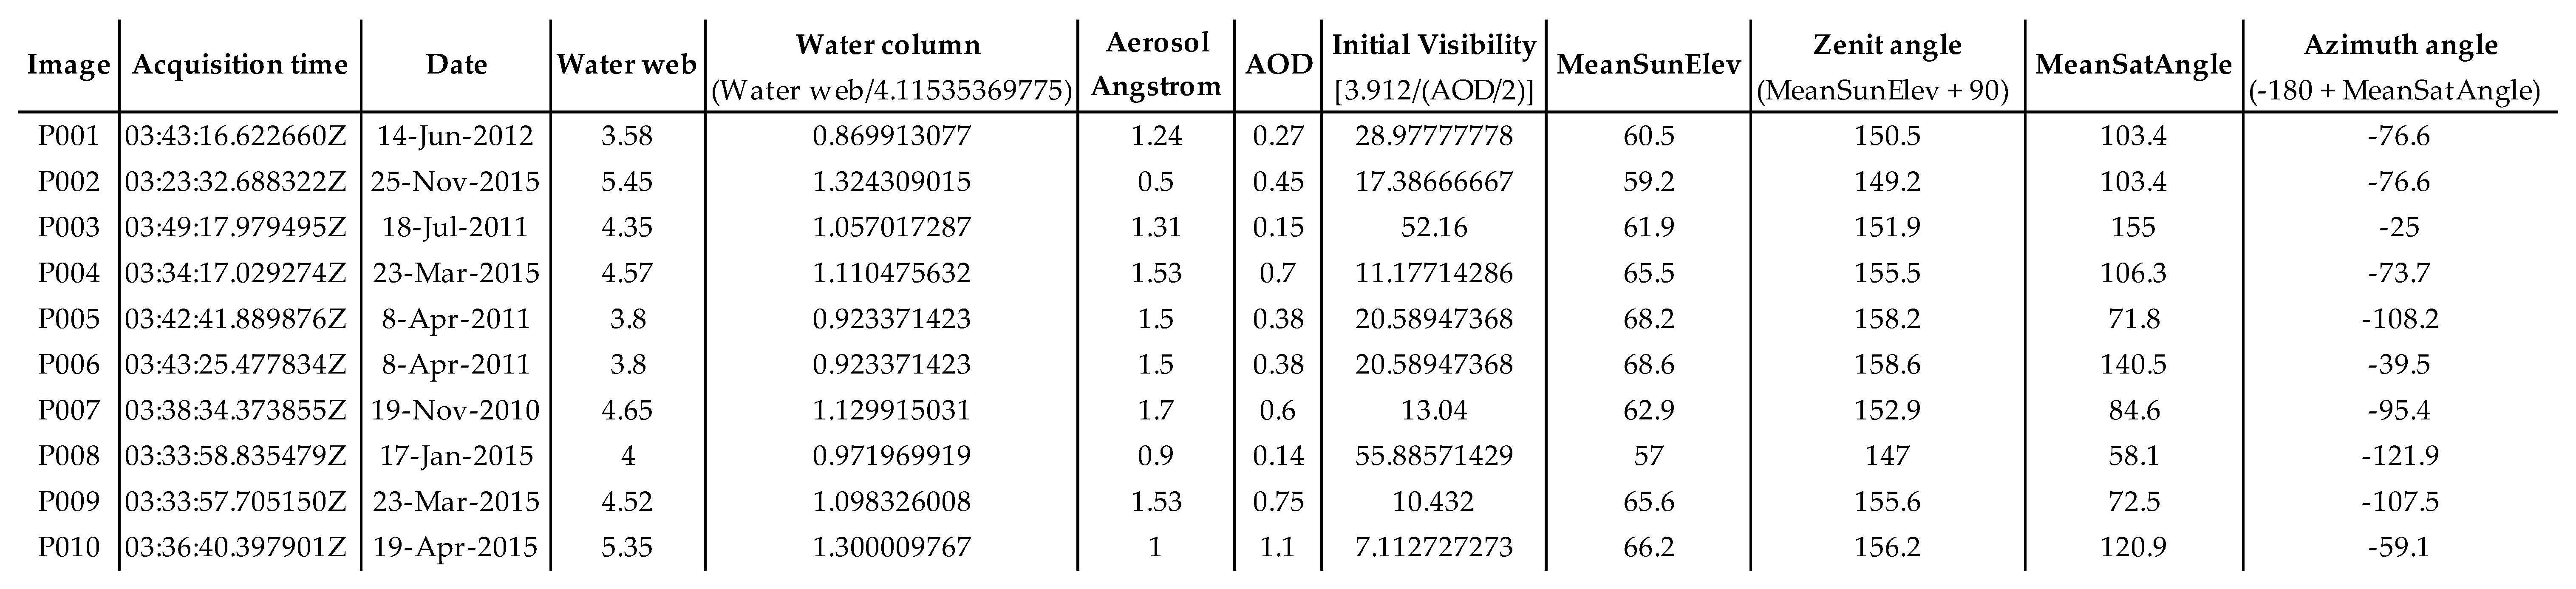
Appendix A. Parameters for Atmospheric Correction Using FLAASH Module

Figure A1. Parameters for atmospheric correction using FLAASH module.
Forests 10 00700 g0a1

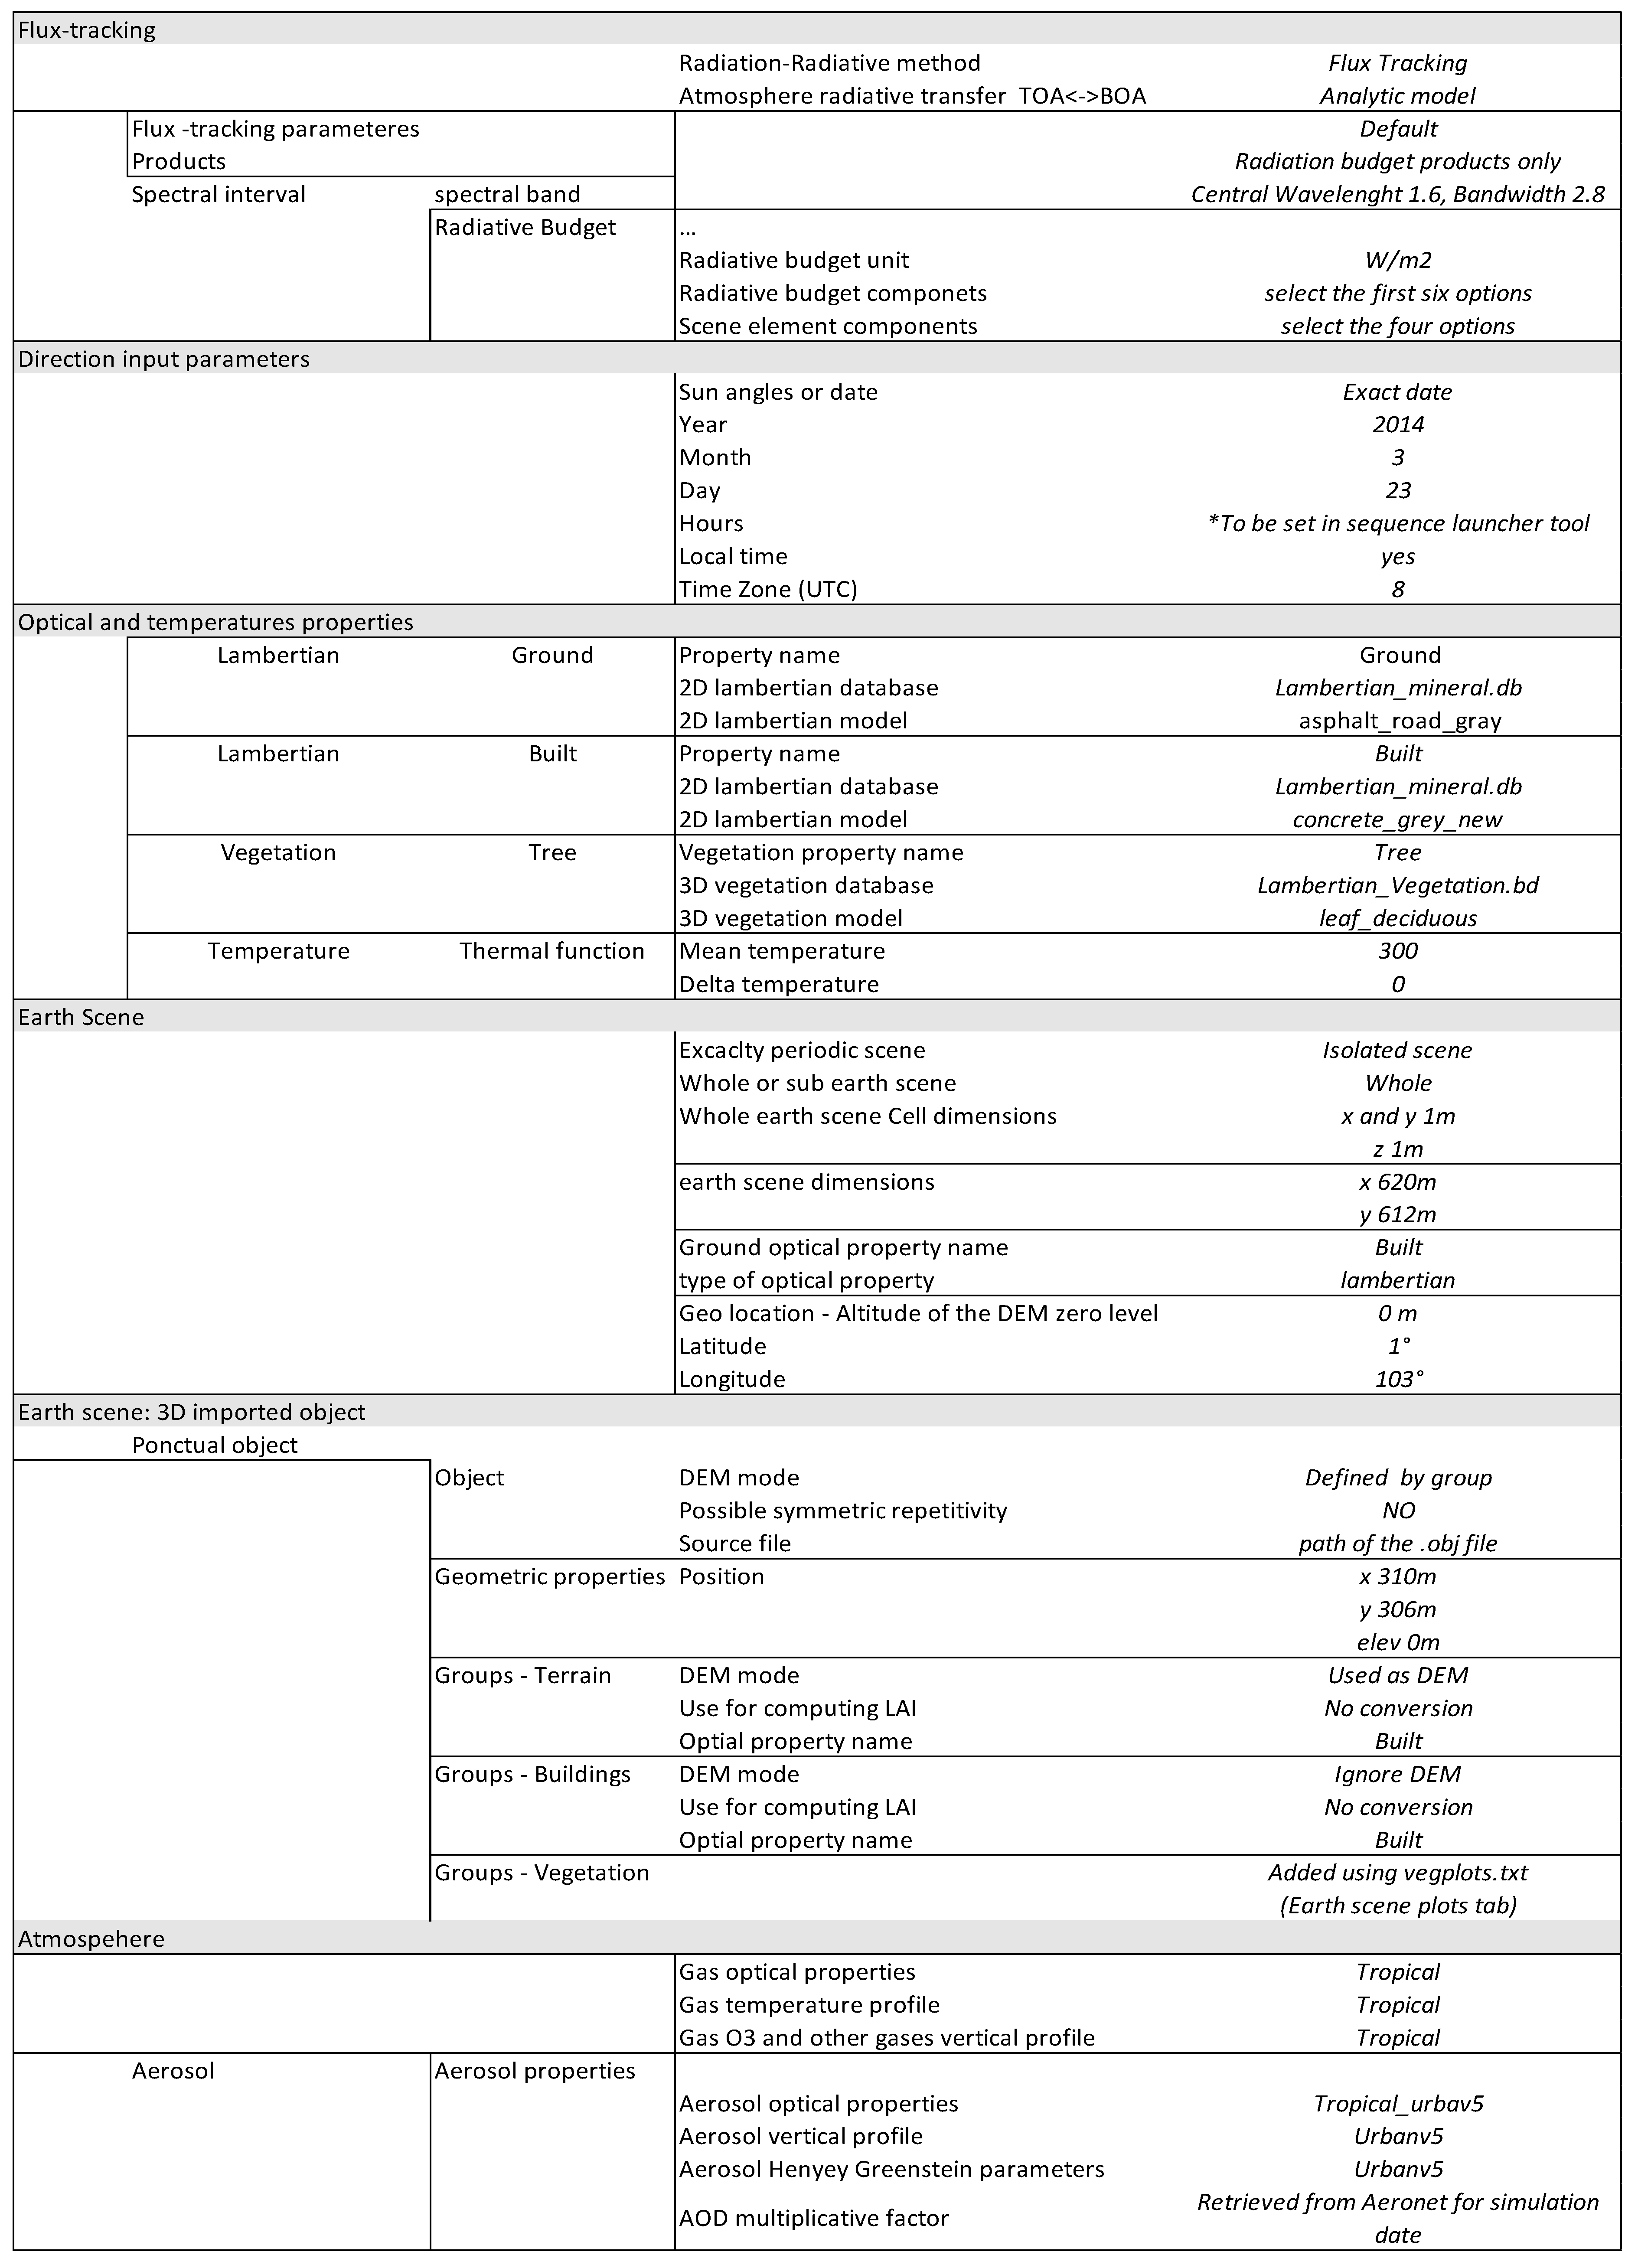
Appendix B. DART Simulation Parameters

Figure A2. Parameters used for DART simulations.
Forests 10 00700 g0a2

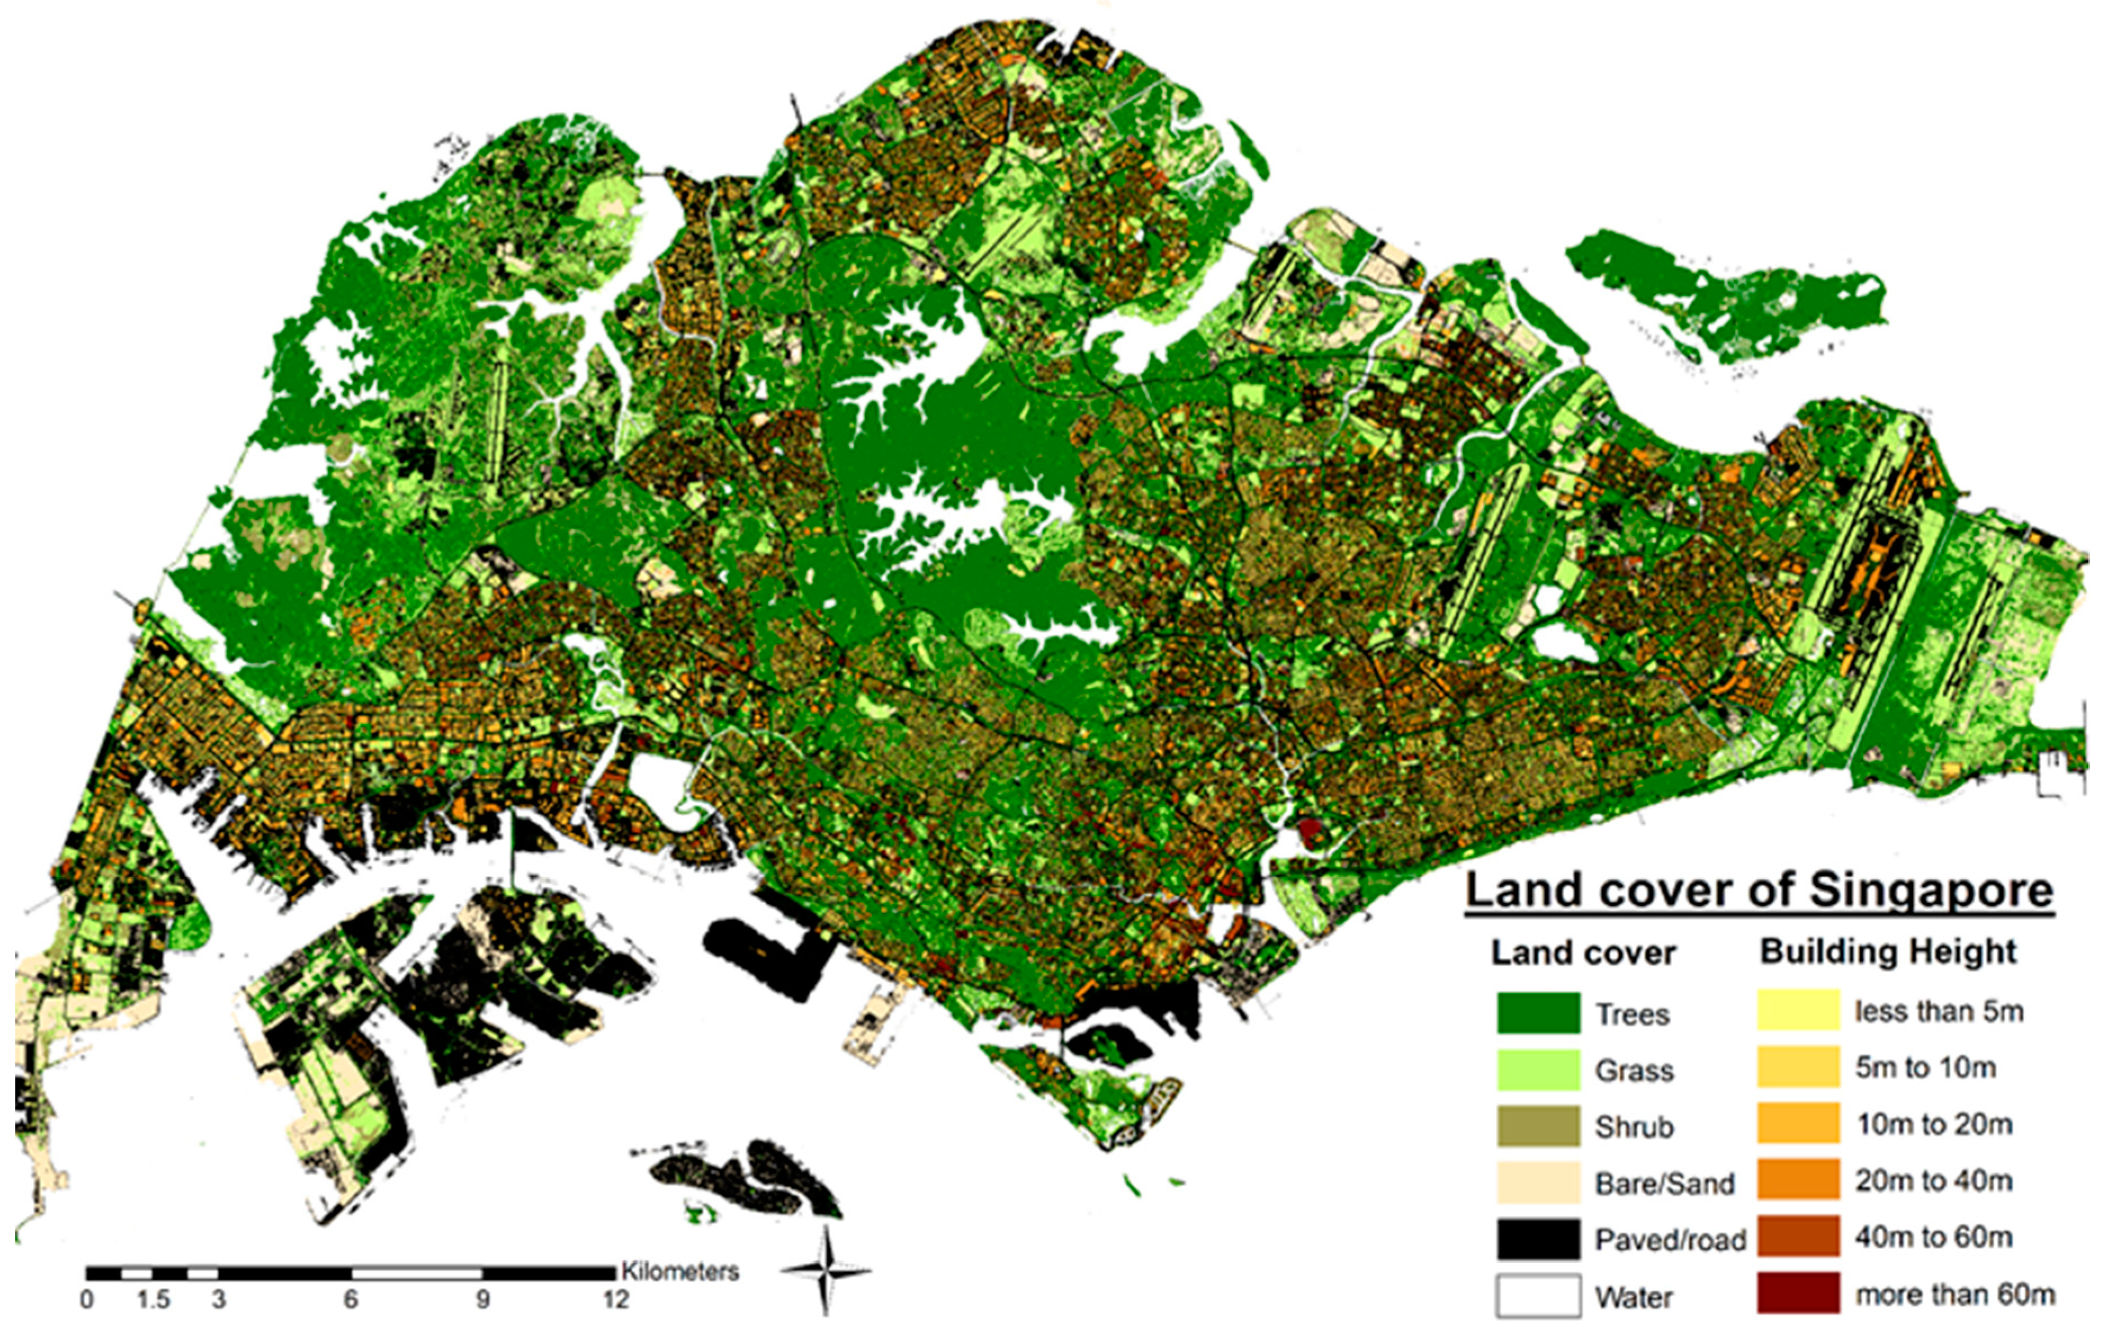
Appendix C. Land Cover Map of Singapore

Figure A3. Land cover map of Singapore.
Forests 10 00700 g0a3

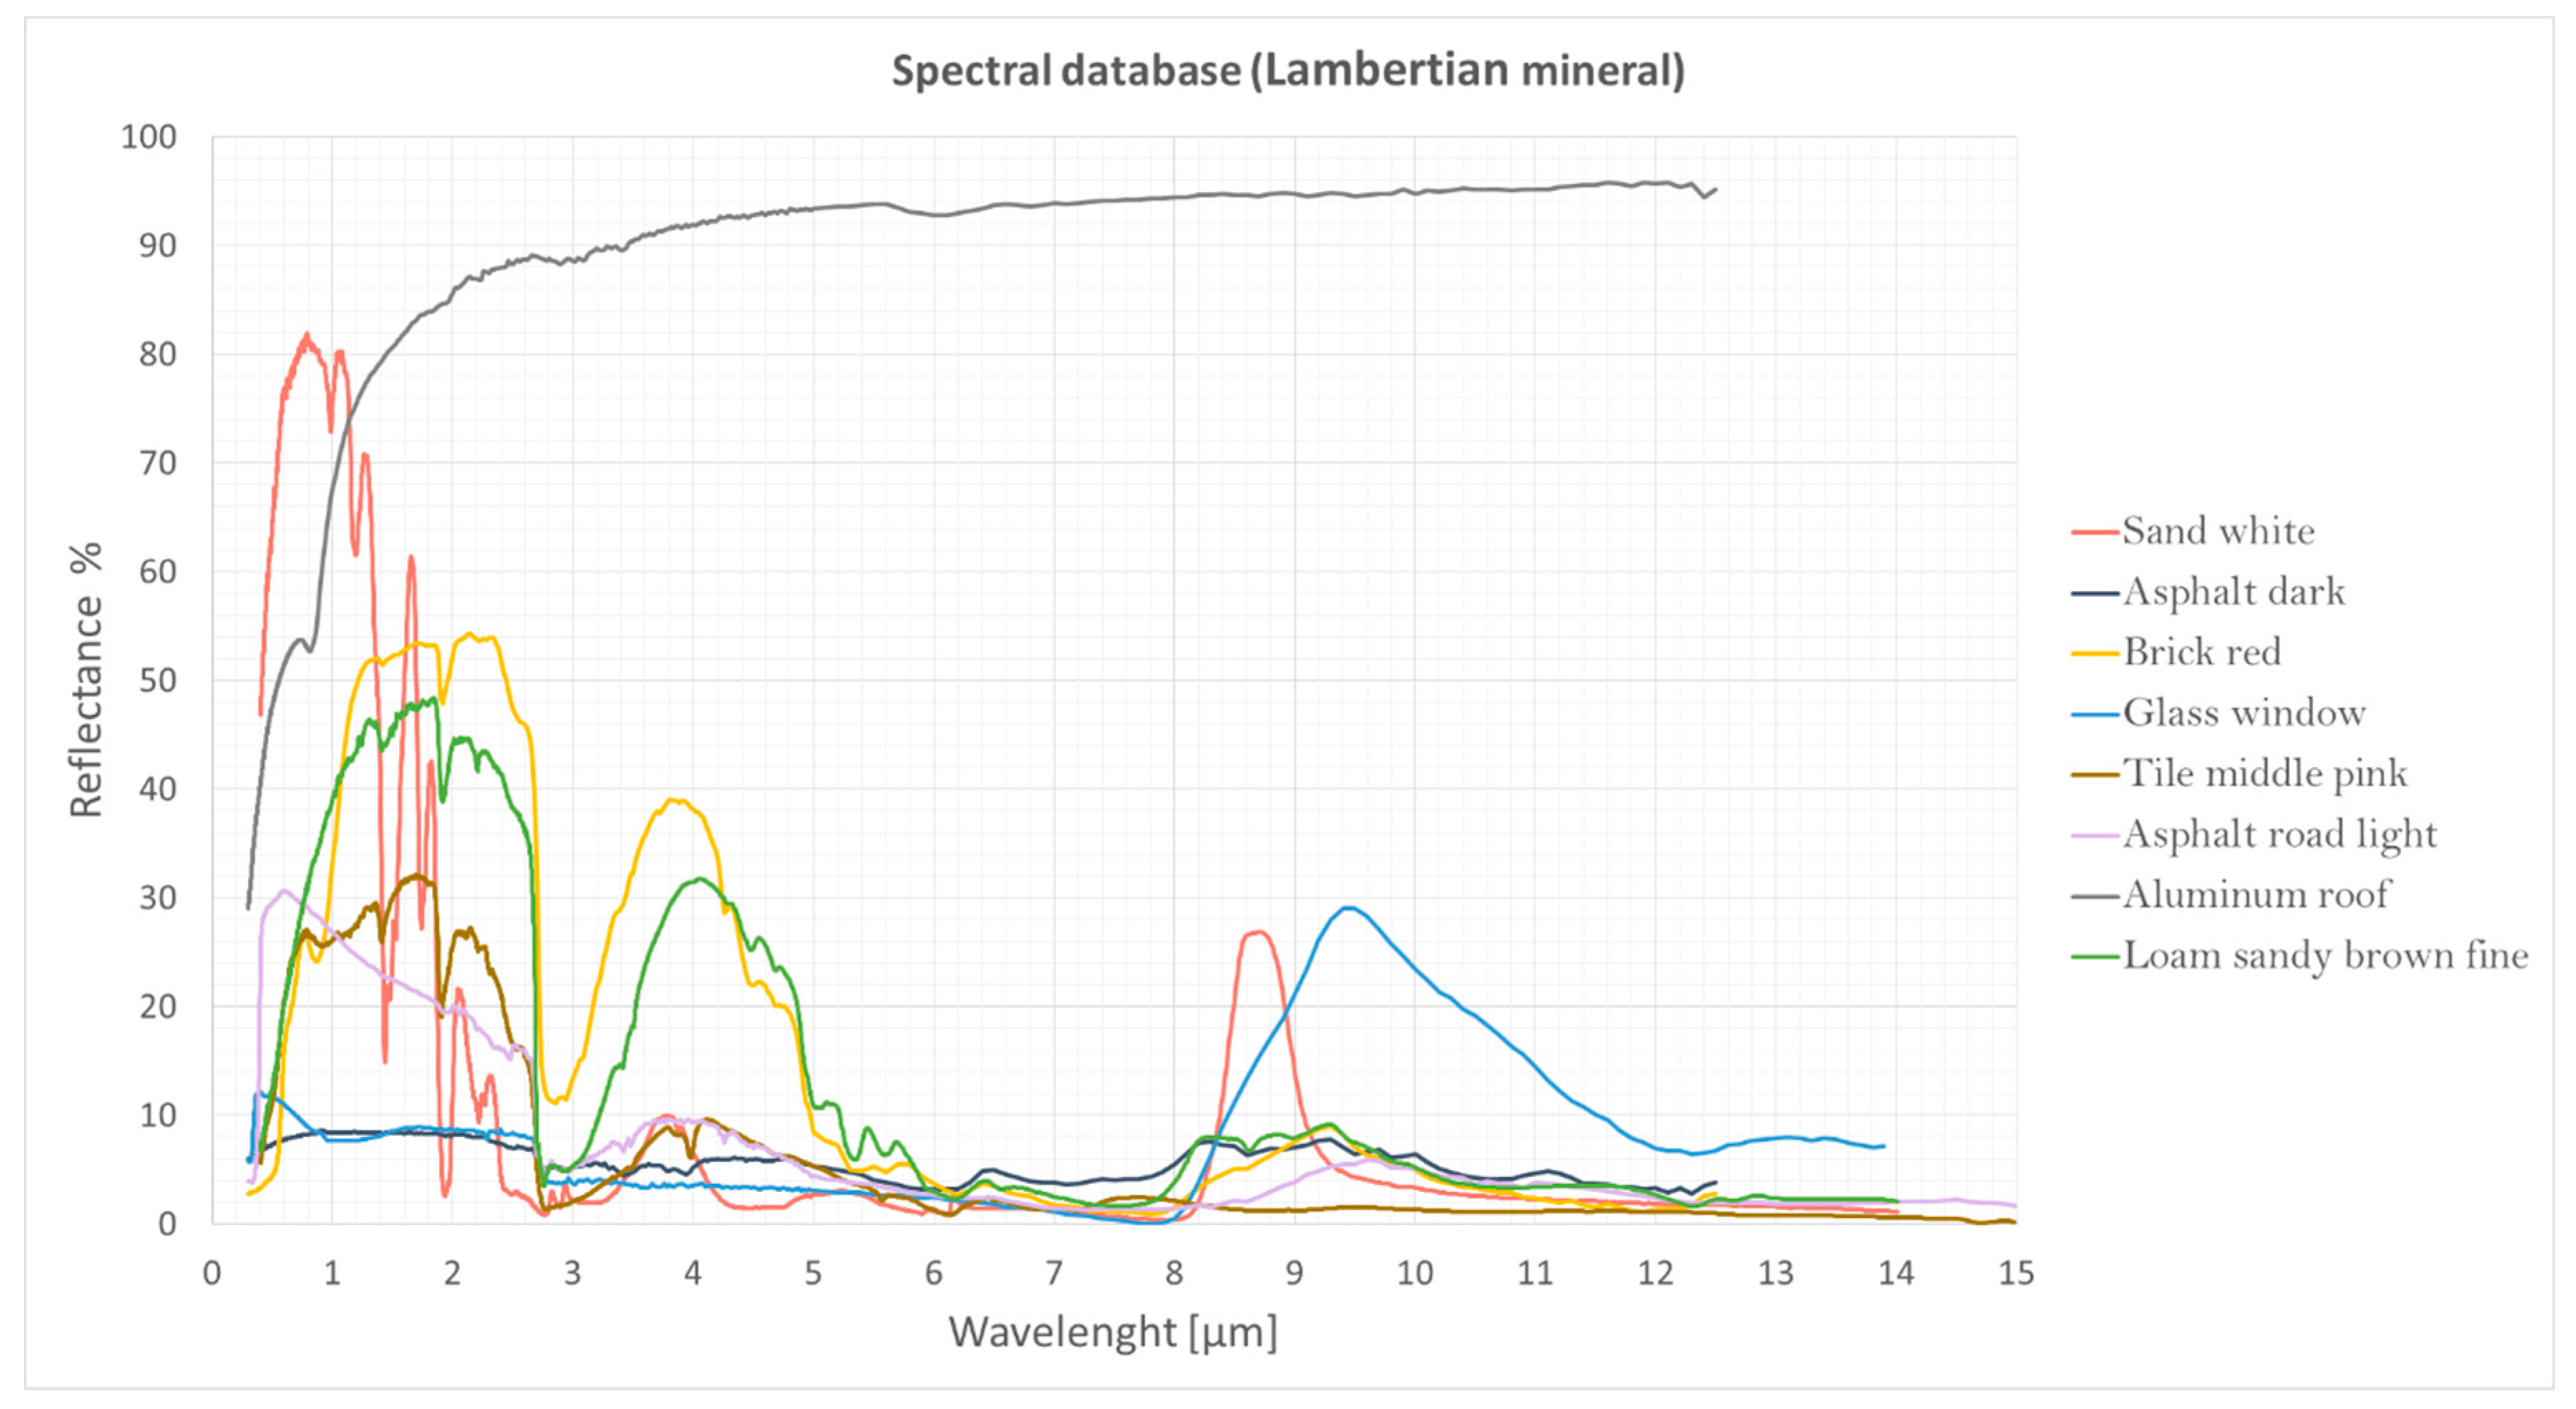
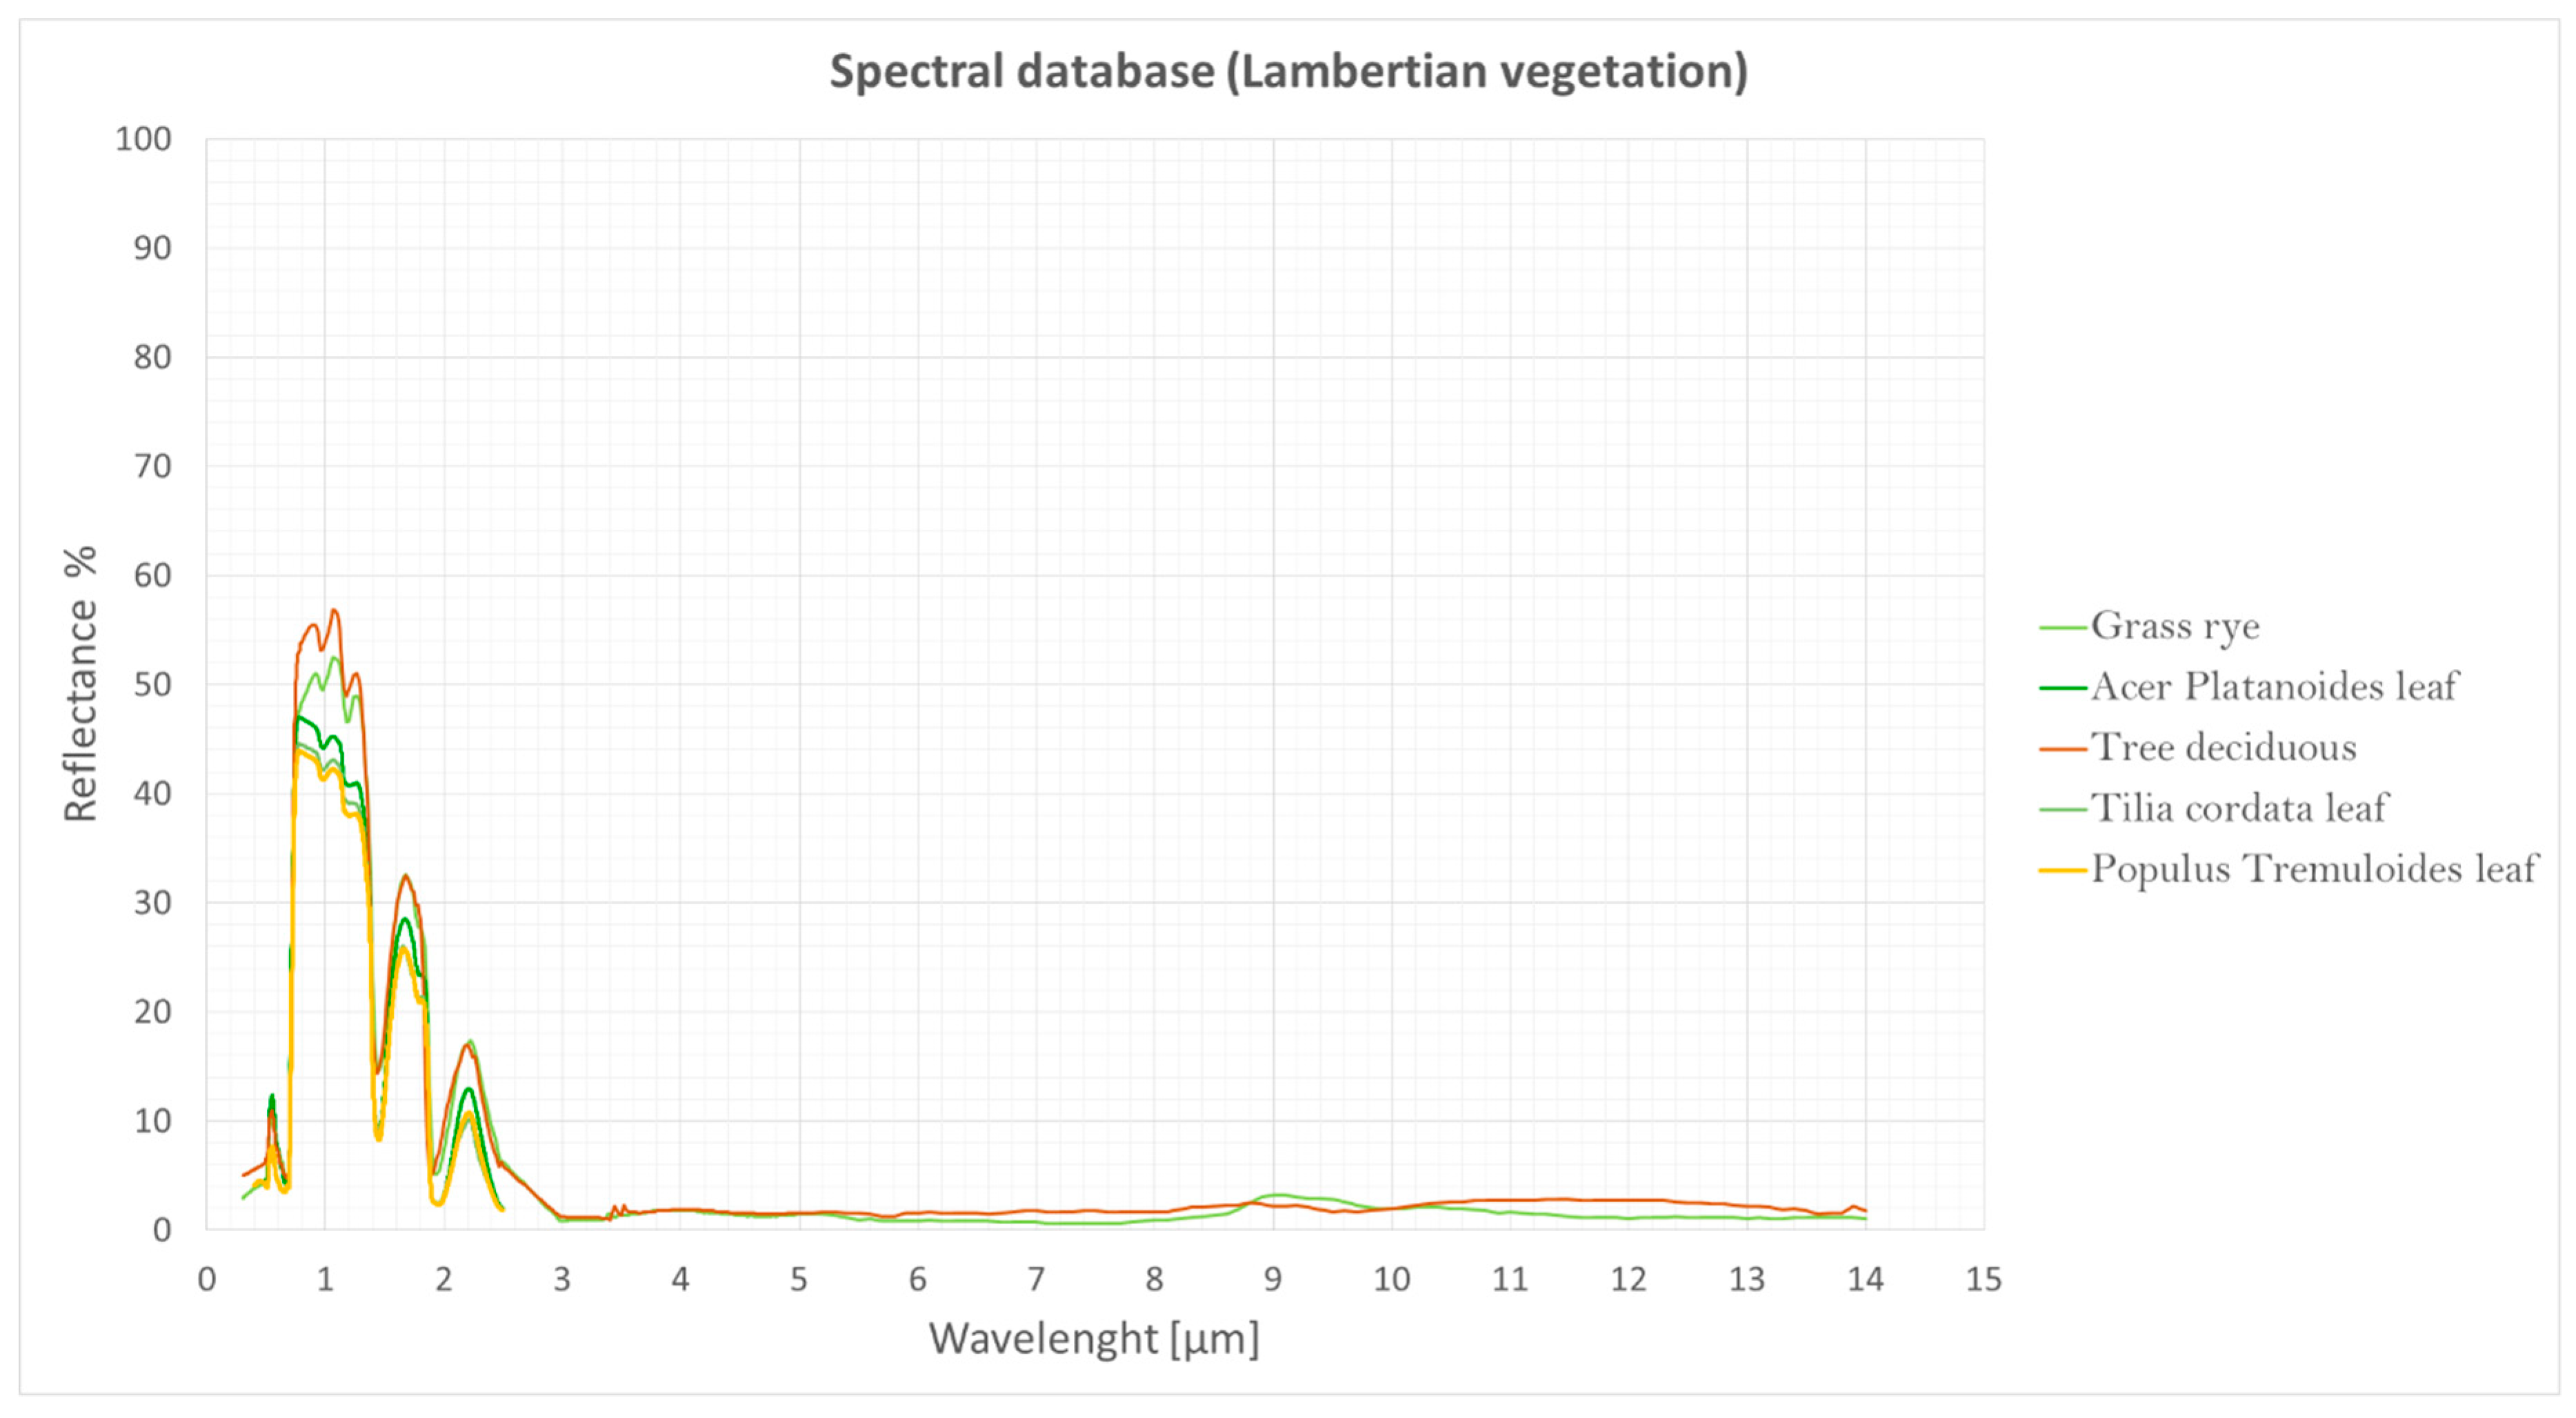
Appendix D. Spectral Reflectance of Construction Materials and Vegetation (from DART Database)

Figure A4. Spectral reflectance of construction materials from DART database.
Forests 10 00700 g0a4
Figure A5. Spectral reflectance of vegetation from DART database
Forests 10 00700 g0a5

Appendix E. Effect of Different Ground Cover Materials on the Absorbed Shortwave Radiation by Ground and Buildings for T4 and T5 Typologies

Figure A6. Effect of different ground cover materials on the absorbed shortwave radiation by ground and buildings for T4 and T5 typologies.
Forests 10 00700 g0a6

Appendix F. Simulation Results Summary

Figure A7. Absorbed radiation by buildings and ground at 13:00 [W/m2].
Forests 10 00700 g0a7
Figure A8. Simulation results ranked in terms of absorption by ground and buildings. The green indicates the scene with trees of LAD = 1 over grass is being used as a base case for comparison.
Forests 10 00700 g0a8

References

  1. Patz, D.; Engelberg, J.L. The effects of changing weather on public health. Annu. Rev. Public Health 2000, 21, 271–307. [Google Scholar] [CrossRef] [PubMed]
  2. Grimm, N.B.; Faeth, S.H.; Golubiewski, N.E.; Redman, C.L.; Wu, J.; Bai, X.; Briggs, J.M.; Grimm, N.B.; Faeth, S.H.; Golubiewski, N.E.; et al. Global Change and the Ecology of Cities. Science 2008, 319, 756–760. [Google Scholar] [CrossRef] [PubMed] [Green Version]
  3. Georgi, J.N.; Dimitriou, D. The contribution of urban green spaces to the improvement of environment in cities: Case study of Chania, Greece. Build. Environ. 2010, 45, 1401–1414. [Google Scholar] [CrossRef] [Green Version]
  4. Akbari, H. Shade trees reduce building energy use and CO2 emissions from power plants. Environ. Pollut. 2002, 116, 119–126. [Google Scholar] [CrossRef]
  5. Oke, T.R. The energetic basis of the urban heat island. Q. J. R. Meteorol. Soc. 1982, 108. [Google Scholar] [CrossRef]
  6. Nice, K.A.; Coutts, A.M.; Tapper, N.J. Urban Climate Development of the VTUF-3D v1.0 urban micro-climate model to support assessment of urban vegetation in fl uences on human thermal comfort. Urban Clim. 2018, 24, 1052–1076. [Google Scholar] [CrossRef]
  7. Landier, L.; Gastellu-Etchegorry, J.P.; Al Bitar, A.; Chavanon, E.; Lauret, N.; Feigenwinter, C.; Mitraka, Z.; Chrysoulakis, N. Calibration of urban canopies albedo and 3D shortwave radiative budget using remote-sensing data and the DART model. Eur. J. Remote Sens. 2018, 51, 739–753. [Google Scholar] [CrossRef] [Green Version]
  8. Myint, S.W.; Brazel, A.; Okin, G.; Buyantuyev, A. Combined Effects of Impervious Surface and Vegetation Cover on Air Temperature Variations in a Rapidly Expanding Desert City. GISci. Remote Sens. 2010, 47, 301–320. [Google Scholar] [CrossRef]
  9. Simpson, J.R. Improved estimates of tree-shade effects on residential energy use. Energy Build. 2002, 34, 1067–1076. [Google Scholar] [CrossRef]
  10. Gros, A.; Bozonnet, E.; Inard, C. Modelling the radiative exchanges in urban areas: A review. Adv. Build. Energy Res. 2011, 5, 163–206. [Google Scholar] [CrossRef]
  11. Bruse, M.; Huttner, S. Numerical modeling of the urban climate-a preview on ENVI-MET 4.0. In Proceedings of the Seventh International Conference on Urban Climate, Yokohama, Japan, 29 June–3 July 2009; pp. 1–4. [Google Scholar]
  12. Lindberg, F.; Holmer, B.; Thorsson, S. SOLWEIG 1.0-Modelling spatial variations of 3D radiant fluxes and mean radiant temperature in complex urban settings. Int. J. Biometeorol. 2008, 52, 697–713. [Google Scholar] [CrossRef]
  13. Govaerts, Y.M.; Verstraete, M.M. Raytran: A Monte Carlo ray-tracing model to compute light scattering in three-dimensional heterogeneous media. IEEE Trans. Geosci. Remote Sens. 1998, 36, 493–505. [Google Scholar] [CrossRef]
  14. Disney, M.I.; Lewis, P.E.; Bouvet, M.; Prieto-Blanco, A.; Hancock, S. Quantifying surface reflectivity for spaceborne lidar via two independent methods. IEEE Trans. Geosci. Remote Sens. 2009, 47, 3262–3271. [Google Scholar] [CrossRef]
  15. Kobayashi, H.; Iwabuchi, H. A coupled 1-D atmosphere and 3-D canopy radiative transfer model for canopy reflectance, light environment, and photosynthesis simulation in a heterogeneous landscape. Remote Sens. Environ. 2008, 112, 173–185. [Google Scholar] [CrossRef]
  16. Govaerts, Y.; Verstraete, M.M. Modeling the scattering of light in three-dimensional canopies: Contribution of a Monte Carlo ray tracing approach. In Proceedings of the Conference Second Topical Symposium on Combined Optical-Microwave Earth and Atmosphere Sensing, Atlanta, GA, USA, 3–6 April 1995; pp. 31–34. [Google Scholar]
  17. Gastellu-Etchegorry, J. Discrete Anisotropic Radiative Transfer (DART 5) for Modeling Airborne and Satellite Spectroradiometer and LIDAR Acquisitions of Natural and Urban Landscapes. Remote Sens. 2015, 7, 1667–1701. [Google Scholar] [CrossRef] [Green Version]
  18. Gastellu-Etchegorry, J. Modeling Radiative Transfer in Heterogeneous 3-D Vegetation Canopies. Remote Sens. Environ. 1996, 58, 131–156. [Google Scholar] [CrossRef]
  19. Gastellu-Etchegorry, J.P.; Lauret, N.; Yin, T.; Landier, L.; Kallel, A.; Malenovský, Z.; Al Bitar, A.; Aval, J.; Benhmida, S.; Qi, J.; et al. DART: Recent advances in remote sensing data modeling with atmosphere, polarization, and chlorophyll fluorescence. IEEE J. Sel. Top. Appl. Earth Obs. Remote Sens. 2017, 10, 2640–2649. [Google Scholar] [CrossRef]
  20. Widlowski, J.L.; Taberner, M.; Pinty, B.; Bruniquel-Pinel, V.; Disney, M.; Fernandes, R.; Gastellu-Etchegorry, J.P.; Gobron, N.; Kuusk, A.; Lavergne, T.; et al. Third Radiation Transfer Model Intercomparison (RAMI) exercise: Documenting progress in canopy reflectance models. J. Geophys. Res. Atmos. 2007, 112, 1–28. [Google Scholar] [CrossRef]
  21. Widlowski, J.; Mio, C.; Disney, M.; Adams, J.; Andredakis, I.; Atzberger, C.; Brennan, J.; Busetto, L.; Chelle, M.; Ceccherini, G.; et al. The fourth phase of the radiative transfer model intercomparison (RAMI) exercise: Actual canopy scenarios and conformity testing. Remote Sens. Environ. 2015, 169, 418–437. [Google Scholar] [CrossRef]
  22. Li, X.; Koh, T.; Panda, J.; Norford, L.K. Impact of urbanization patterns on the local climate of a tropical city, Singapore: An ensemble study. J. Geophys. Res. Atmos. 2016, 4386–4403. [Google Scholar] [CrossRef]
  23. Chow, W.T.L.; Roth, M. Temporal dynamcs of the urban heat island of Singapore. Int. J. Clim. 2006, 2260, 2243–2260. [Google Scholar] [CrossRef]
  24. Updike, T.; Comp, C. Radiometric Use of WorldView-2 Imagery Technical Note. DigitalGlobe 2010, 1–17. [Google Scholar]
  25. ITT Visual Information Solutions. FLAASH Module User’s Guide; Harris Geospatial Solutions: Boulder, CO, USA, 2006. [Google Scholar]
  26. ITT Visual Information Solutions. Workflow Tools in ENVI; Whitepaper; Harris Geospatial Solutions: Boulder, CO, USA.
  27. Vosselman, G. Slope based filtering of laser altimetry data. Int. Arch. Photogramm. Remote Sens. Spat. Inf. Sci. 2000, XXXIII/3, 935–942. [Google Scholar]
  28. Lee, S.; Wolberg, G.; Shin, S.Y. Scattered data interpolation with multilevel b-splines. IEEE Trans. Vis. Comput. Graph. 1997, 3, 228–244. [Google Scholar] [CrossRef]
  29. Grau, E.; Durrieu, S.; Fournier, R.; Gastellu-etchegorry, J.; Yin, T. Estimation of 3D vegetation density with Terrestrial Laser Scanning data using voxels. A sensitivity analysis of influencing parameters. Remote Sens. Environ. 2017, 191, 373–388. [Google Scholar] [CrossRef]
  30. Béland, M.; Widlowski, J.; Fournier, R.A.; Verstraete, M.M. Estimating leaf area distribution in savanna trees from terrestrial LiDAR measurements. Agric. For. Meteorol. 2011, 151, 1252–1266. [Google Scholar] [CrossRef]
  31. Béland, M.; Widlowski, J.L.; Fournier, R.A. A model for deriving voxel-level tree leaf area density estimates from ground-based LiDAR. Environ. Model. Softw. 2014, 51, 184–189. [Google Scholar] [CrossRef]
  32. Liang, S.; Li, X.; Wang, J. Fraction of Absorbed Photosynthetically Active Radiation by Green Vegetation. In Advanced Remote Sensing; Academic Press: Cambridge, MA, USA, 2012; Chapter 12. [Google Scholar]
  33. Roth, M.; Jansson, C.; Velasco, E. Multi-year energy balance and carbon dioxide fluxes over a residential neighbourhood in a tropical city. Int. J. Climatol. 2017, 37, 2679–2698. [Google Scholar] [CrossRef]
  34. Yuan, C.; Shan, R.; Zhang, Y.; Li, X.X.; Yin, T.; Hang, J.; Norford, L. Multilayer urban canopy modelling and mapping for traffic pollutant dispersion at high density urban areas. Sci. Total Environ. 2019, 647, 255–267. [Google Scholar] [CrossRef]
  35. Mughal, M.O.; Li, X.; Yin, T.; Martilli, A.; Brousse, O.; Dissegna, M.A.; Norford, L.K. High-resolution, multi-layer modelling of Singapore’s urban climate incorporating local climate zones. J. Geophys. Res. Atmos. 2019. [Google Scholar] [CrossRef]
Figure 1. Conceptual framework for 3-D scene creation. WV2 = WorldView2; DSM = Digital Surface Model; OSM = Open Street Map building footprints; DTM = Digital Terrain Model.
Forests 10 00700 g001
Figure 2. 3-D scene of Bedok planning area, Singapore. The red dot indicates the location of the flux tower used for field validation.
Forests 10 00700 g002
Figure 3. Cover properties of the 3-D objects used for radiative budget simulations representing common urban typologies found in Singapore. T1.0 represents T1 with Leaf Area Density (LAD) = 0. HDB (Housing Development Board) corresponds to public housing districts in Singapore.
Forests 10 00700 g003
Figure 4. Time series of radiative budget simulation for a residential low rise urban type (Typology 1), showing absorbed shortwave radiation by ground and buildings (ABS) and absorbed photosynthetically active radiation (APAR) with varying leaf area density (LAD) value.
Forests 10 00700 g004
Figure 5. 2D visualization of time series of absorbed radiation by ground and buildings (for a residential low density urban type, Typology 1). Time step on x-axis with changing leaf area density (LAD) on y-axis. LAD = 0 indicates simulation of a scene with buildings and ground with no trees.
Forests 10 00700 g005
Figure 6. 3-D Radiative budget results per cell type of the analyzed urban typologies at time 13:00. LAD value fixed to 0.6.
Forests 10 00700 g006
Figure 7. Comparison between different urban typologies. (a) Absorbed shortwave radiation by ground and buildings. (b) Absorbed photosynthetically active radiation.
Forests 10 00700 g007
Figure 8. 2-D visualization of absorbed radiation by ground and buildings for each typology in five time steps between 9:00 and 17:00. “LAD set to 0.6, ground material set to asphalt”.
Forests 10 00700 g008
Figure 9. (a) Time series of Discrete Anisotropic Radiative Transfer (DART)-simulated bottom of atmosphere (BOA) irradiance and exitance and upwelling and downwelling shortwave radiation obtained from net radiometer measurements. (b) Scatterplot of DART-simulated exitance against upwelling shortwave.
Forests 10 00700 g009

