Article

Biochar Fertilization Significantly Increases Nutrient Levels in Plants and Soil but Has No Effect on Biomass of Pinus massoniana (Lamb.) and Cunninghamia lanceolata (Lamb.) Hook Saplings During the First Growing Season

1
Research Institute of Subtropical Forestry, Chinese Academy of Forestry, Hangzhou 311400, China
2
Swiss Federal Institute for Forest, Snow and Landscape research WSL, Zuercherstrasse 111, CH-8903 Birmensdorf, Switzerland
3
Qianjiangyuan Forest Ecosystem Research Station, National Forestry and Grassland Administration of China, Hangzhou 311400, China
4
State Forestry Administration Key Laboratory of Forest Ecology and Environment, Research Institute of Forest Ecology, Environment and Protection, Chinese Academy of Forestry, Beijing 100091, China
*
Author to whom correspondence should be addressed.
Those authors contributed equally to this work.
Forests 2019, 10(8), 612; https://doi.org/10.3390/f10080612
Submission received: 22 June 2019 / Revised: 7 July 2019 / Accepted: 21 July 2019 / Published: 24 July 2019
(This article belongs to the Special Issue Intensive Silviculture)

Abstract

:
Previous studies have shown that biochar fertilization has profound effects on plant and fine root growth, but there is a lack of studies on how changes in plant and soil stoichiometry by biochar fertilization influence plant growth and root morphology. We investigated the effects of biochar fertilization on biomass, root morphology, plant nutrient concentrations, and the stoichiometry of plants and soil in a greenhouse experiment with Pinus massoniana (Lamb.) (PM) and Cunninghamia lanceolata (Lamb.) Hook. (CL) throughout the 2017 growing season immediately following biochar fertilization application. Four levels of biochar treatment were used, i.e., addition rates of 0 (control), 5 (low biochar), 10 (medium biochar), and 20 t ha−1 (high biochar). Biochar fertilization had no effect on biomass, fine root length, or fine root surface area. Biochar treatment, however, had significant effects on nutrient levels and their stoichiometry in both plants and soil. Detrended correspondence analysis suggested that increases in soil C:N, soil C:P, and soil N:P were associated with increases in plant nutrient levels, especially P concentration. Our results indicate that biochar fertilization prioritizes enhancing plant and soil nutrients over increasing height and diameter in the first growing season. A higher biochar fertilization dosage has a major influence on root morphology for PM and on P concentrations in the plant and soil for CL, probably through different growth characteristics and nutrient resorption rates. Further studies, particularly those considering long-term effects, are necessary before general recommendations regarding biochar application should be given.

1. Introduction

Biochar application to soil is receiving increasing attention as a potential way to promote nutrient cycling, reduce soil CO2 emissions, and enhance carbon (C) sequestration [1,2]. It has also been reported that biochar application to forest soil could change the soil environment and thereby benefit plant growth by increasing cation exchange capacity (CEC), water retention, soil aggregation, and microbial increased functions [3]. These improved forest soil environment features may have an immediate positive effect on plant and fine root growth, root morphology, and nutrients by the sufficient contact of roots with biochar [4,5]. Compared to in agricultural settings, biochar application in forests has received less attention [6], and hence the effects of biochar addition on tree growth, and especially on root morphology and stoichiometry, are still not understood.
Previous studies showed that the effects of biochar application on plant growth vary with the dosage applied and with species [7,8]. McElligott [9] showed that applying hardwood biochar to fine-textured forest Andisol at a rate of 25% and 50% (v/v) had no effect on aboveground biomass of Populus trichocarpa Torr. & Gray. Results from some studies also suggested that biochar application can improve the growth and productivity of plantations in nutrient deficient conditions [10,11]. Biochar formed from spruce significantly increased soil-available P and K concentration in comparison with control plots for 2–6 weeks in a temperate hardwood forest with P limitation in Canada [12]. The increase in soil-available P from biochar has been shown to have an important effect in promoting plant growth [13]. However, less attention has been paid to the effects of biochar dosage on soils, and thus plant growth performance, in forests.
Previous studies focused on forests have considered the effect of biochar application on plant growth and nutrient dynamics: effects of the application of Acer mono Maxim. biochar on root morphology in a field nursery for 120 to 140 days [14]; effects of biochar on plant growth of Thuja plicata Donn ex D. Don, Abies grandis [Douglas ex D. Don] Lindl., Pseudotsuga menziesii [Mirb.] Franco, and Pinus contorta [Douglas ex.] Louden in a pot experiment for 4 or 8 weeks [9]; effects of Pinus radiata D. Don biochar on soil total organic C in the Spanish Atlantic area for one year [15]; effects of biochar on mixed hardwood forest (such as Acer saccharum Marshall., Acer rubrum L., Tsuga canadensis L. Carrière) soil organic matter composition and soil nutrient dynamics for 2 years [16,17]; effects of biochar on soil available phosphorus (P) depletion [18]. Generally speaking, plant growth responses in boreal and tropical forests were stronger than those in temperate forests [19]. However, we did not know whether there is a response superiority between plant growth and nutrient absorptionby biochar addition in woody species. Furthermore, little attention has been paid to effects of biochar on the plant and soil stoichiometric relationships for different plant species in the same region, especially in subtropical forests.
Biochar application to soils has great potential to improve soil N and P cycling and thus soil C, N and P stoichiometry [20], which in turn influence plant nutritional status and growth [21]. Razaq et al. [14] found that root N concentration and C to N ratio responded positively to a high biochar application dosage. Robertson et al. [22] found that a high biochar application rate (10% dry mass) significantly increased soil total C (p < 0.001), soil total N (p = 0.029), and the soil C:N (p < 0.001) in a Pinus contorta var. latifolia stand in comparison with non-biochar treatments. Li et al. [23] showed that bamboo leaf biochar addition at a high rate (15 t ha−1) resulted in a higher water-soluble organic C and microbial biomass C content in the soil of a bamboo plantation after one year compared with values after a low rate (5 t ha−1) was applied. Palviainen et al. [24] showed that the soil N mineralization rate increased with Picea abies (L.) H. Karst biochar dosage (5 t ha−1 and 10 t ha−1). However, in another study, biochar fertilization to soil caused N deficiency in plants due to soil N immobilization and high soil C:N [9]. It is still unclear how biochar dosage affects soil and plant stoichiometry, which in turn influences root growth and morphology, and finally determines the growth of above-ground plant structures.
Evergreen Pinus massoniana (Lamb.) (PM, barren-tolerant species) and Cunninghamia lanceolata (Lamb.) Hook. (CL, fast-growing species) are native and widely planted in subtropical China, accounting for about 7.74% and 7.24% of all forested area in China. Their growth rate and productivity have declined in South China due to nutrient-poor soils [25]. Here, we investigated biochar’s, formed from bamboo, effect on nutrients in both plants and soil, as well as the influence on the biomass and root morphology of PM and CL during the first growing season following biochar treatment. The specific objectives of this study were (1) to determine the response of plant and soil nutrients and the corresponding stoichiometry to biochar fertilization; (2) to quantify the effects of biochar on above and belowground biomass, and therefore biomass allocation and root morphology of P. massoniana (PM) and C. lanceolata (CL); and (3) to clarify the stoichiometric relationships of plants and soil, and the regulation of above and belowground growth.

2. Materials and Methods

2.1. Study Site and Soil Collection

The greenhouse experiment was carried out in a nursery in Sanqiao (119.95° E, 29.48° N), Fuyang District, Zhejiang Province, China. This region has a typical subtropical humid monsoon climate, with a mean annual temperature of 16.1 °C and mean annual precipitation of 1441.9 mm, most of which falls between April and September.
Potting soil from 0–15 cm was collected from PM forests in Miaoshanwu Nature Reserve, air-dried, and sieved through a 2 mm mesh screen (to remove stones and biological material) before use. The soil is classified as Haplic Luvisol derived from granite [26]. The initial chemical properties were analyzed according to the methods of Ge et al. [27]: soil organic C (SOC) 18.70 ± 2.63 g kg−1, soil total N (STN) 0.91 ± 0.12 g kg−1, soil total phosphorus (STP) 11.20 ± 0.08 g kg−1, soil hydrolysis N (SHN) 96.1 ± 23.9 mg kg−1, soil available P (SAP) 3.81 ± 0.86 mg kg−1, soil available potassium (SAK) 76.05 ± 24.7 mg kg−1 and pH 4.80 ± 0.23.

2.2. Plant Material and Biochar Treatments

One-year-old PM (mean initial height 58.35 ± 1.02 cm and base diameter 6.47 ± 0.58 mm) and CL (mean initial height 41.29 ± 0.96 cm and base diameter 6.59 ± 0.47 mm) saplings with a similar height and base diameter were obtained from a field nursery in Lishui, Zhejiang Province, and planted in plastic pots (9.0 L, 25 cm in diameter, 27 cm in height) in March 2017. The biochar applied in this experiment was derived from bamboo branches and was produced through slow pyrolysis at 500 °C for 3 h by Yaoshi Biochar Industry Corporation (Lin’an, Zhejiang, China). The biochar was composed of 78.5% C, 0.79% N, 0.12% P, 0.78% K, and 17.4% ash. It had a pH of 9.02, a specific surface area of 295 m2 g−1, a pore volume of 0.04 cm3 g−1 and an apparent density of 0.15 g mL−1.
According to the study by Tammeorg et al. [28] and the local bamboo fertilization management level, biochar applied in soils included four dosing levels: 0 (control, CK), 5 (low biochar addition, LB), 10 (medium biochar addition, MB), and 20 t ha−1 (high biochar addition, HB), which were equivalent to application rates of 0% (control), 0.32% (low biochar addition), 0.64% (medium biochar addition), and 1.28% (w/w) (high biochar addition). Biochar was mixed with the air-dried soil homogenously before application. All plastic pots were filled with 6.0 kg of the prepared soil or the mixture of soil and biochar. Each plot was managed at 65% of the maximum water holding capacity of the soil in the respective treatment. For each species, ten replicates per treatment were prepared and all the pots were randomly positioned in the greenhouse. Six healthy replicates of similar size were harvested on 1 November 2017.

2.3. Growth and Root Morphology Measurements

Before the harvest, the height and base diameter of the six randomly selected plants from each treatment were measured. Plants were then cut at the stem base and divided into leaves and shoots. Roots were harvested and then carefully washed using deionized water to remove tightly bound soil and biochar particles. The net height and diameter growth rates were calculated as: x = 100% × (height or diameter at harvest−initial height or diameter)/initial height or diameter.
Root samples were taken to the laboratory in an ice box within two hours after harvesting. The fine root (<2 mm in diameter) samples were scanned with a root scanner (Modified Epson Expression 10000XL) and then the images were analyzed with the software WinRhizo (Regent Instruments Inc., Québec, QC, Canada). WinRhizo divided fine roots into three diameter classes, i.e., 0–0.5 mm, 0.5–1.0 mm, and 1.0–2.0 mm. The output from the image analysis included root length (cm), root volume (cm3), mean root diameter (mm), and root surface area (cm2). For each treatment, the results from six plants were averaged. Fine root samples after scanning, together with leaves, shoots, and coarse roots, were deactivated at 105 °C and then dried at 70 °C until a constant mass was reached and weighed to determine dry biomass production.

2.4. Tissue and Soil Chemical Analysis

Soil samples were collected at harvest, passed through a 2 mm mesh sieve and air-dried in the laboratory for chemical analysis. Soil pH was determined using a soil:deionized water paste (1:2.5) (v/v). SOC was measured using the wet digestion method with K2Cr2O7 [27]. STN and STP were measured with the methods described by Miller and Keeney [29]. Soil moisture content was measured using the difference in weight between fresh soil (20 g) and soil dried at 105 °C for 24 h. Plant organic C concentration (C) was measured by the wet digestion method with K2Cr2O7 [30]. Plant total N concentration (N) was determined by combustion in a UK152 Distillation and Titration Unit (DK20 Heating Digester, Italy). Plant total P concentration (P) was measured with an IRIS Instrepid II XSP (Thermo Elemental Systems, Waltham, MA, USA) after digestion of the samples in a mixture of 7.5 mL HNO3 and 2.5 mL HCl. Mobile sugar and starch were determined according to methods described by [31]. The starch concentration in the extraction was measured using an ethanol-insoluble pellet, and the sugar and starch concentrations were measured spectrophotometrically (ultraviolet-visible spectrophotometer 752 S, Cany Precision Instruments Co., Ltd., Shanghai, China) at 620 nm using the anthrone method. Tissue nonstructural carbohydrates (NSC) were calculated as the sum of the sugar and starch concentrations for each tissue [31].
All chemical analyses of each sample were repeated three times. These methods were guided by the Observation Methodology for Long-term Forest Ecosystem Research of the National Standards of the People’s Republic of China (GB/T 33027-2016).

2.5. Statistical Analysis

Quantile–quantile plots were used to check the normality of distribution before any statistical analyses. Two-way ANOVAs were performed to assess the effects of species, biochar treatment, and their interaction on plant biomass, nutrients, NSC, soil properties, and stoichiometric characteristics, and means were compared with Tukey’s test after confirmation of significant differences. Detrended correspondence analysis (DCA) was conducted using Canoco 5.0 (Wageningen, The Netherlands) and Pearson’s correlation analysis using SPSS 19 (SPSS, Inc., Chicago, IL, USA) to assess the relationships between plant growth and stoichiometry in the plants and soil under the biochar treatments and the control. SPSS 19 was used for all other statistical analyses. The significance level used for all statistical tests was p ≤ 0.05.

3. Results

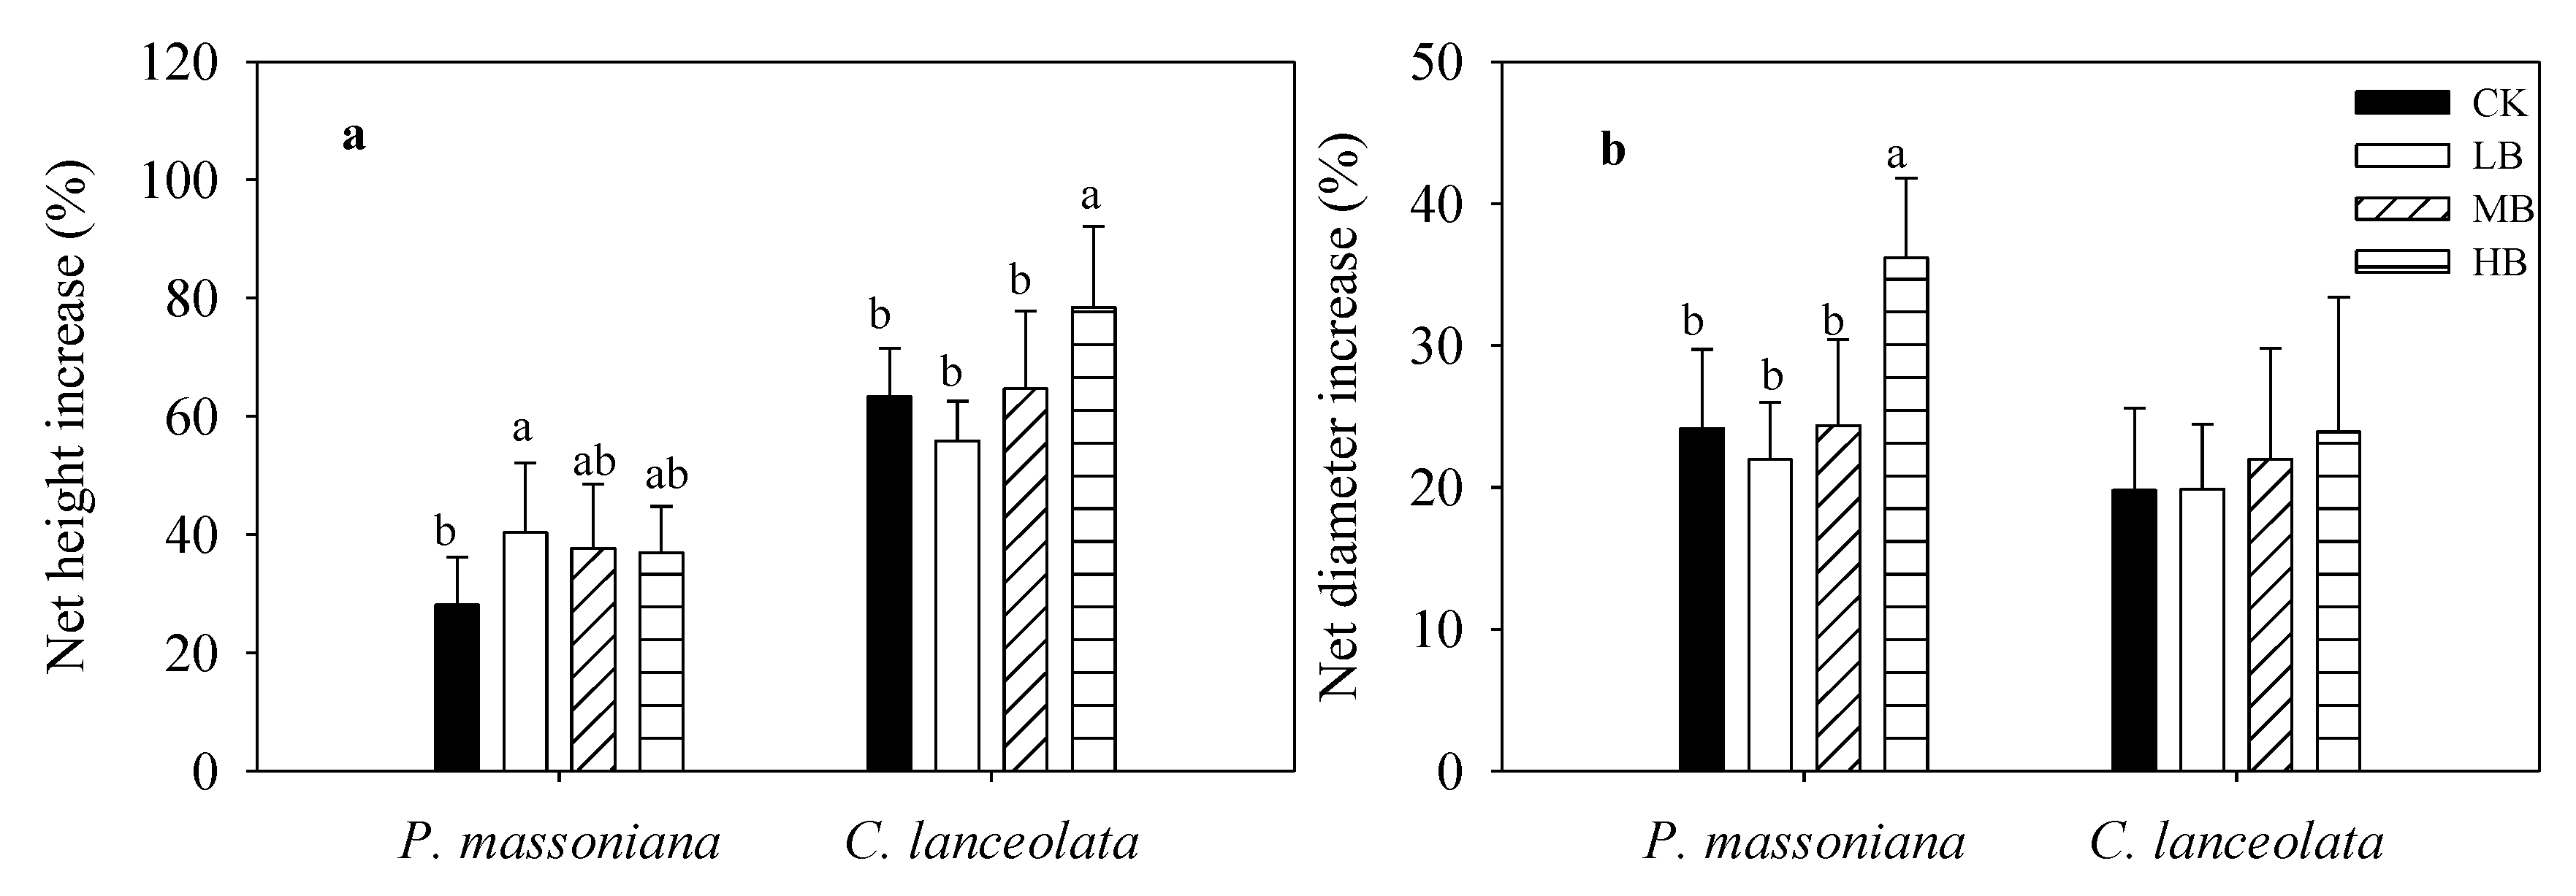
3.1. Effects of Biochar Fertilization on Sapling Growth

The responses of growth parameters to biochar treatment differed significantly between species (all p ≤ 0.05, Table 1) except for diameter. Biochar fertilization had no effect on plant biomass, height, or diameter (all p > 0.05, Table 1), but the interaction between biochar fertilization and species on plant final height was significant (p = 0.021, Table 1). Compared to thecontrol, low biochar addition significantly promoted PM height growth by 40.3%, and high biochar addition increased the CL height increment by 78.4% (Figure A1). Biochar treatment did not affect base diameter increment for either of the two species (p > 0.05, Figure A1).

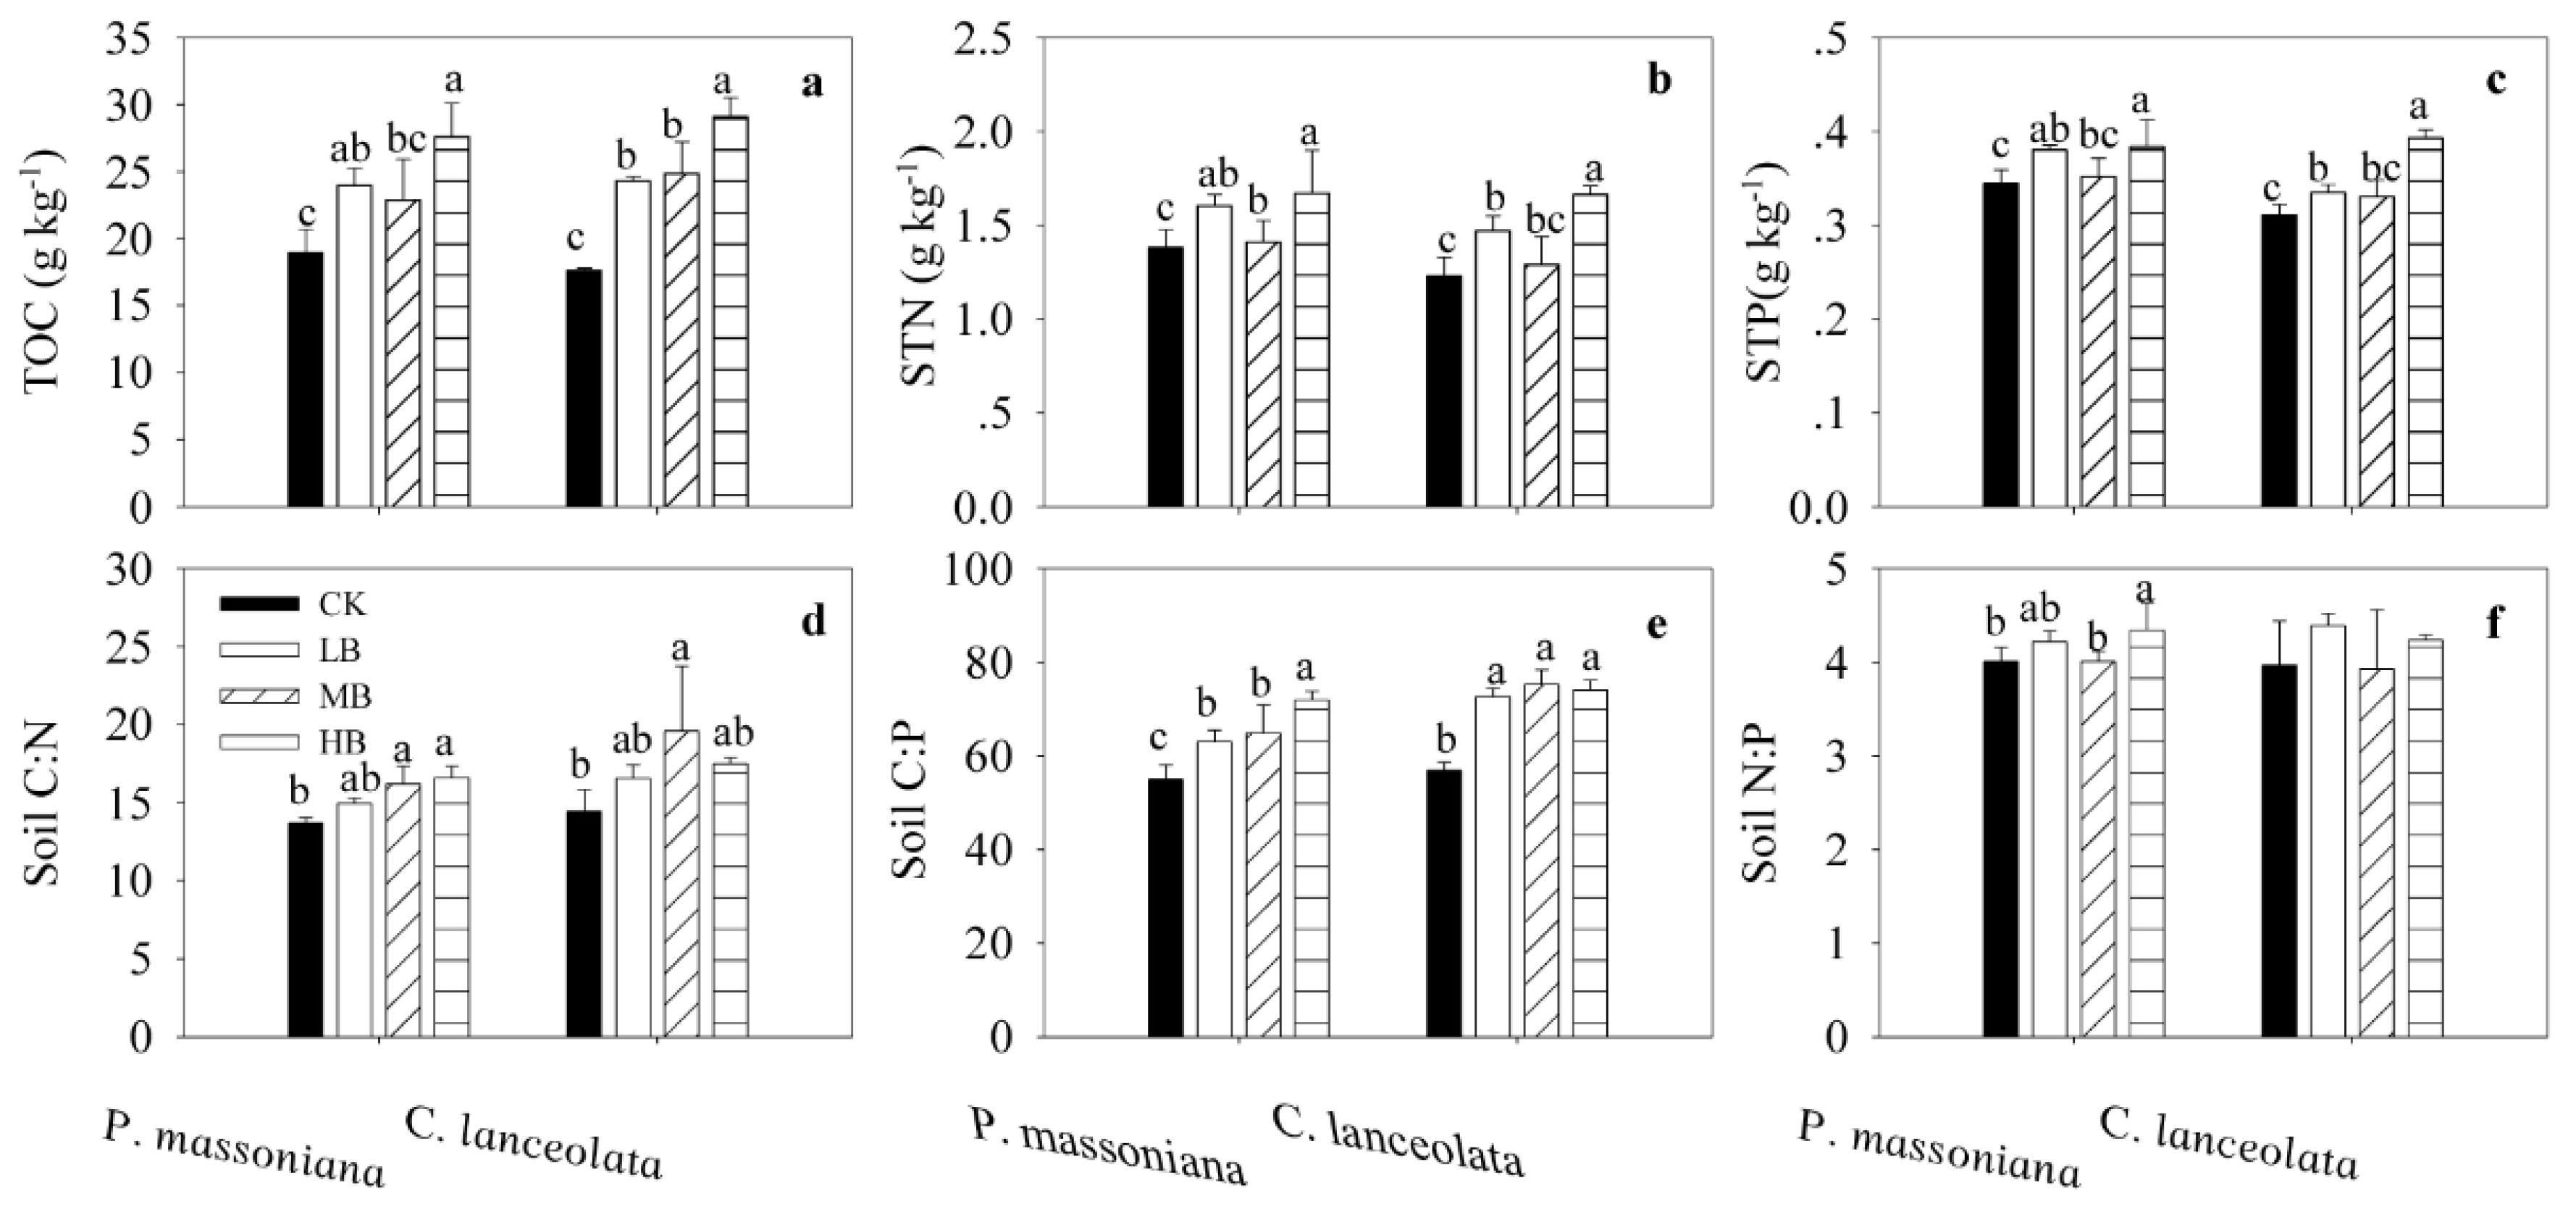
3.2. Effects of Biochar Fertilization on SOC, STN, STP, and Stoichiometry

Biochar fertilization had a significant effect on soil SOC, STN, and STP (p < 0.001, Table 1). Compared with the control, biochar fertilization (except medium biochar addition for PM) significantly increased SOC by 26.6%–45.8% in PM and 37.8%–65.0% in CL (p ≤ 0.05, Figure 1a). Biochar addition significantly increased STN and STP only in high biochar addition for PM and in low biochar addition and high biochar addition for CL (p ≤ 0.05, Figure 1b,c).
There was a significant effect of biochar fertilization on soil C:N and soil C:P (p < 0.01, Table 1) but not on soil N:P (p > 0.05, Table 1). Biochar fertilization significantly increased soil C:N in medium biochar addition and high biochar addition for PM but only in medium biochar addition for CL (p < 0.01, Figure 1d). All biochar fertilization treatments significantly increased soil C:P, for both PM and CL (p < 0.001, Figure 1e). Soil N:P increased significantly only in high biochar addition for PM (p ≤ 0.05, Figure 1f).

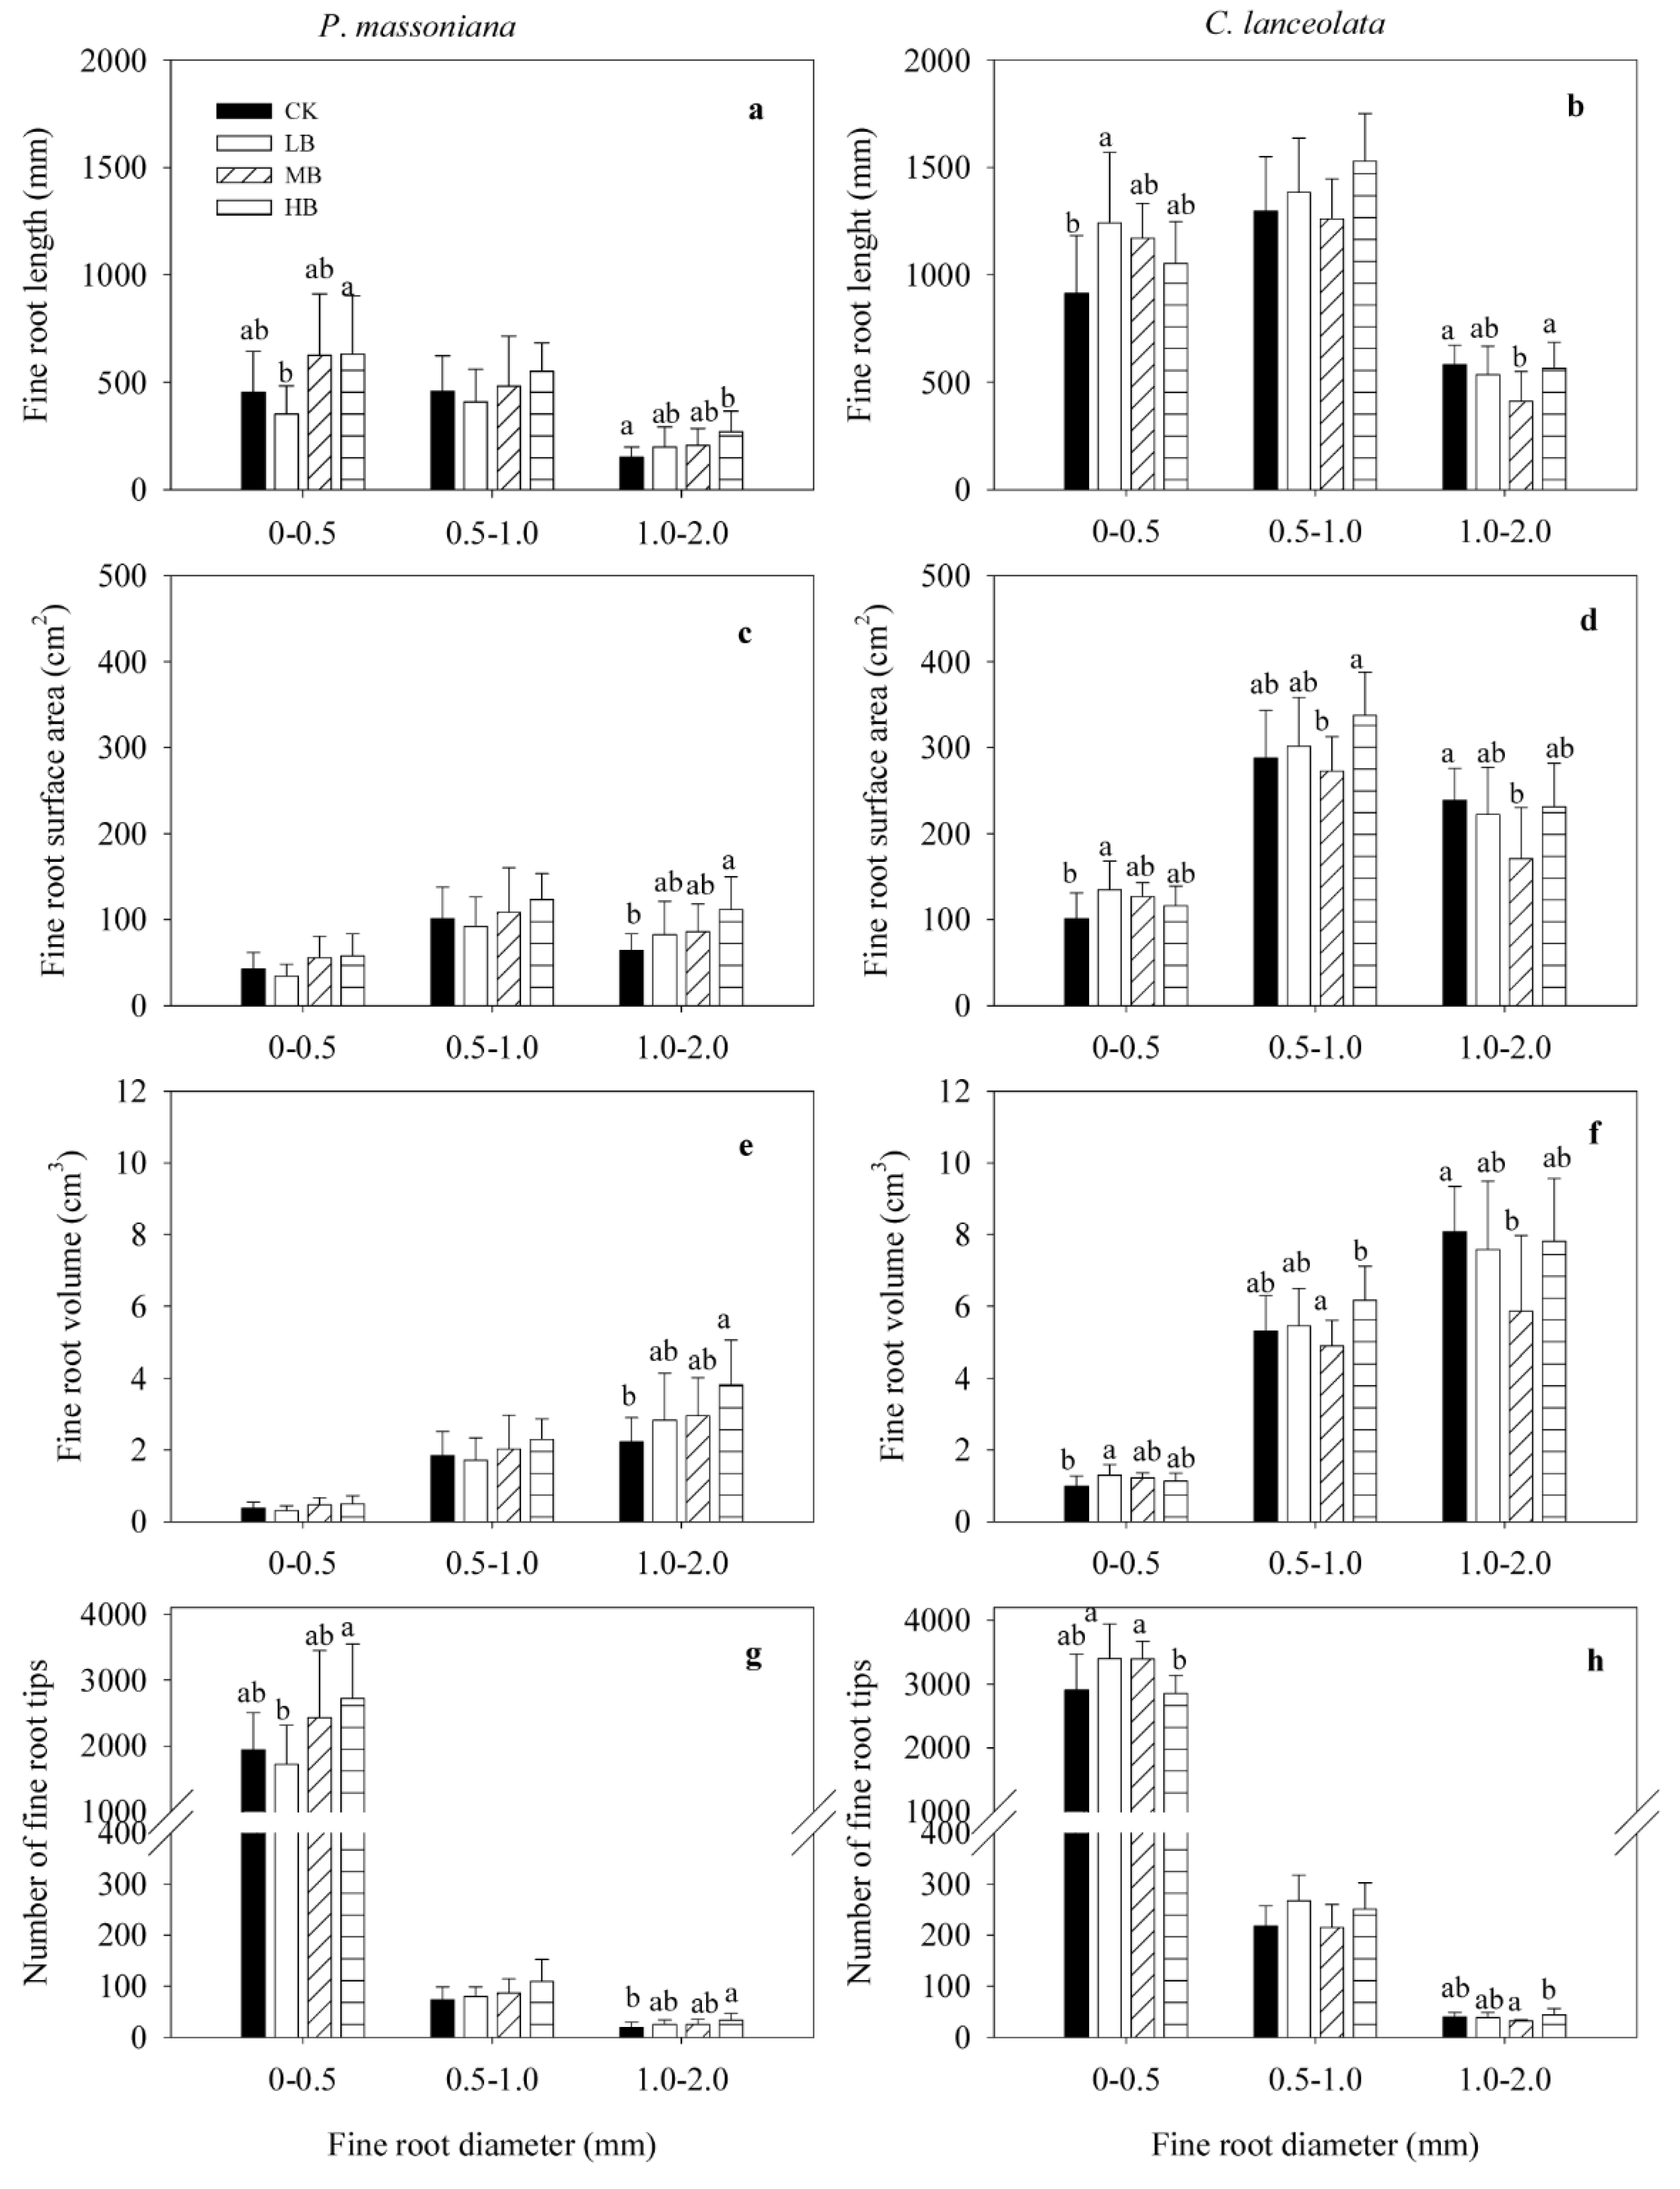
3.3. Effect of Biochar Fertilization on Fine Root Morphology

The responses of different root diameter classes to biochar fertilization varied significantly between species (p < 0.001, Table 2), but biochar fertilization treatment only had a significant effect on the number of fine root tips in the 1.0–2.0 mm class (p = 0.041, Table 2). Biochar fertilization had no effect on total fine root length (p > 0.05, Table 2), total fine root surface area (p > 0.05, Table 2), and total number of fine root tips (p > 0.05, Table 2), but it had a significant effect on total fine root volume (p = 0.024, Table 2). There was a significant interactive effect between biochar and species on the number of fine root tips (p = 0.042, Table 2).
When the tree species were analyzed separately, high biochar addition significantly increased the 1.0–2.0 mm class fine root length for PM (p ≤ 0.05, Figure 2a), low biochar addition significantly enhanced the 0–0.5 mm class fine root length, and medium biochar addition significantly reduced the 1.0–2.0 mm class fine root length for CL (p ≤ 0.05, Figure 2b). Fine root surface area and fine root volume were similar under biochar addition for both PM and CL (Figure 2c–f). Compared with the control, high biochar addition significantly enhanced the 1.0–2.0 mm class fine root surface area and fine root volume by 75.0% and 71.3%, respectively, for PM, while medium biochar addition significantly reduced these parameters by 28.4% and 27.5%, respectively, for the 1.0–2.0 mm class (Figure 2c–f). The number of fine root tips in the 0–0.5 mm class differed significantly between low biochar addition and high biochar addition for both species (p ≤ 0.05, Figure 2g,h).

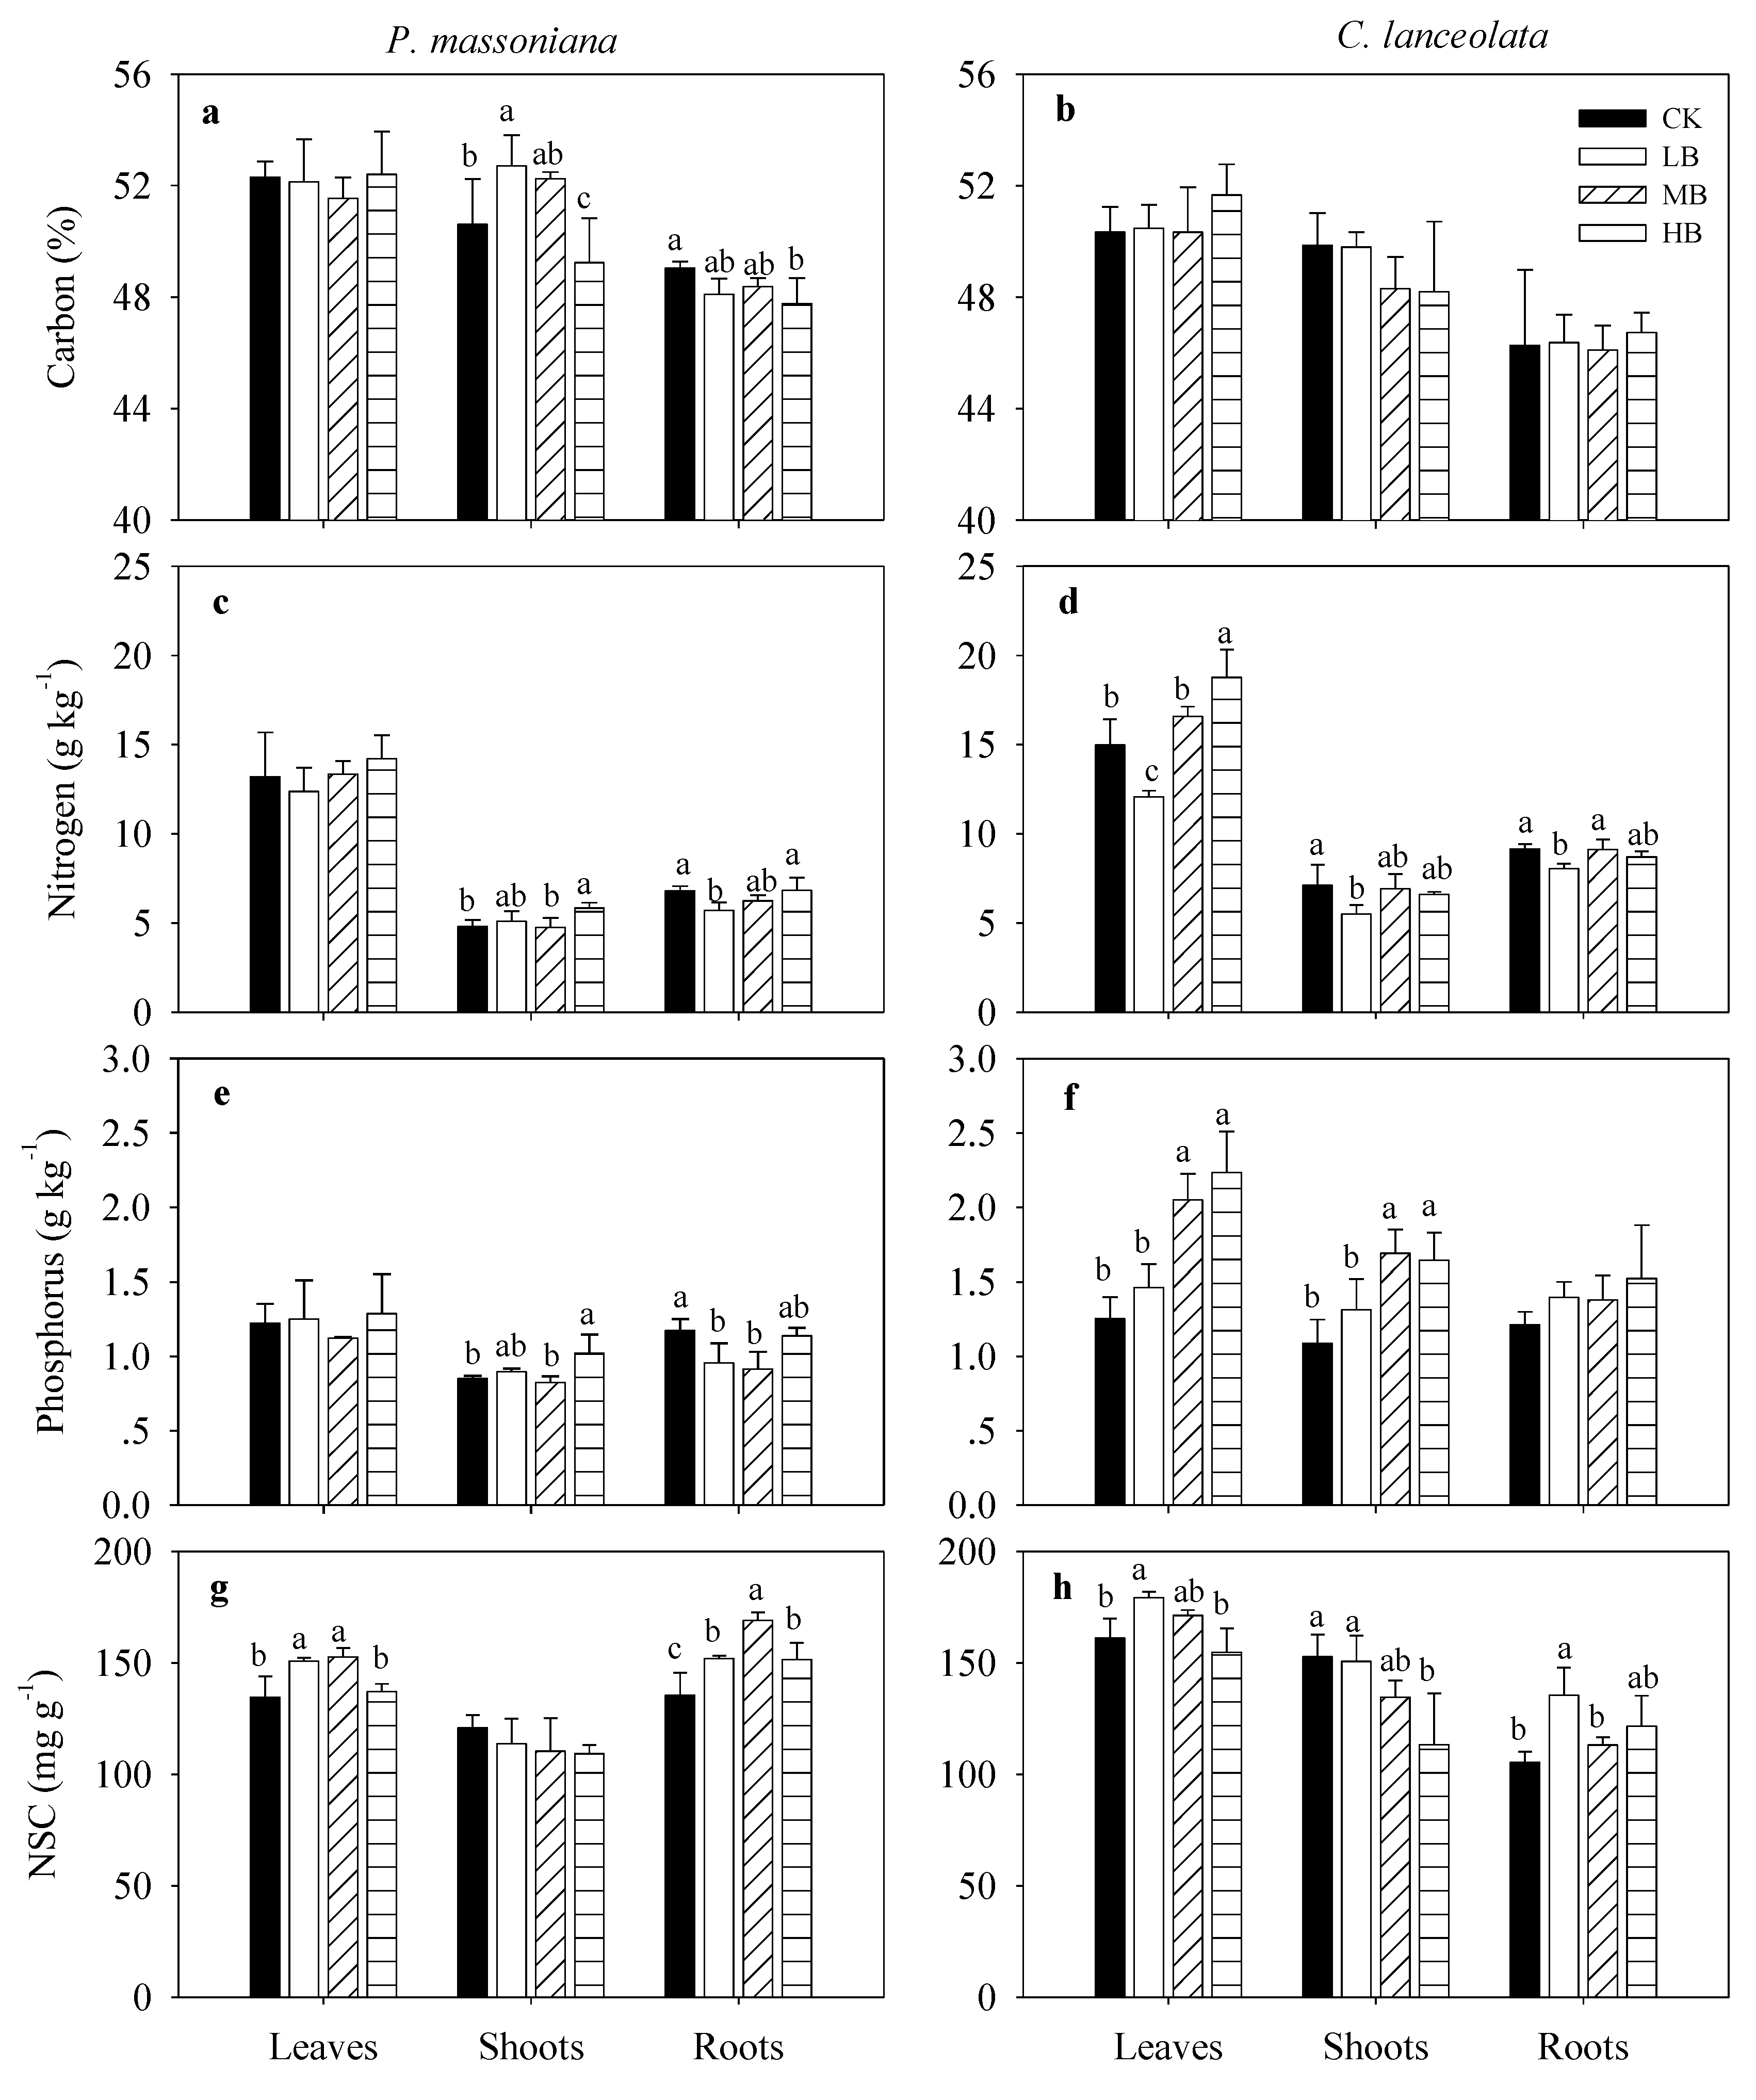
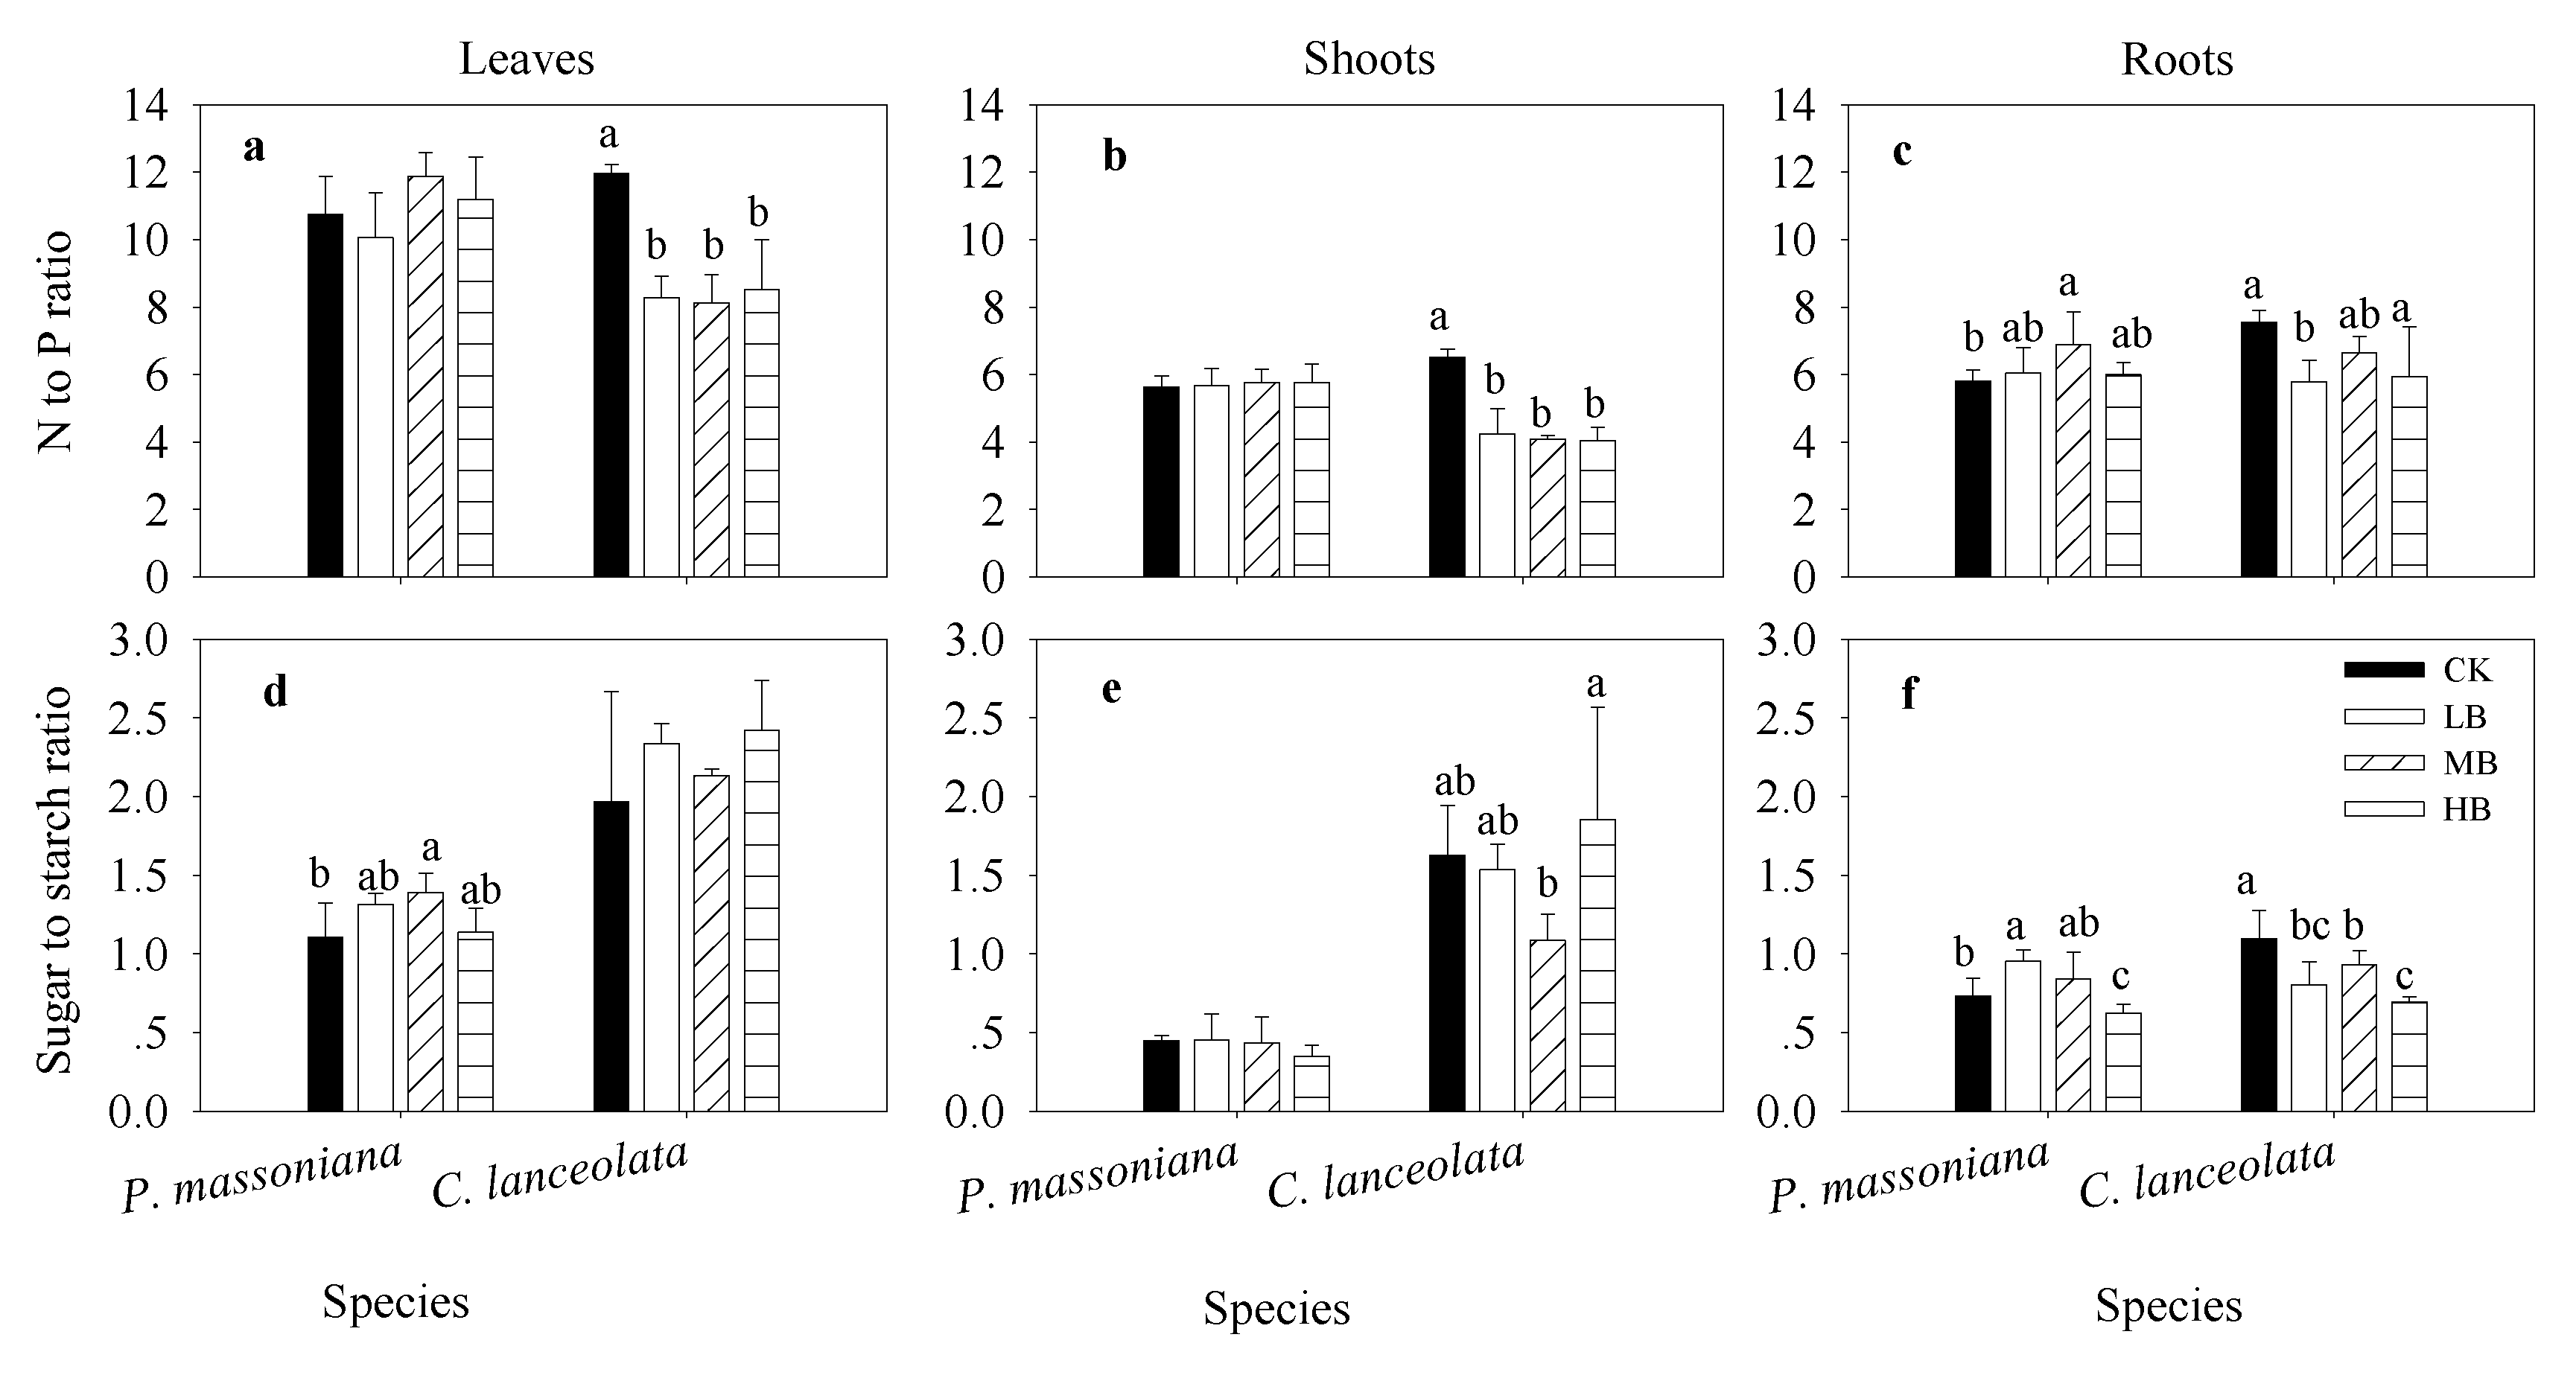
3.4. Effects of Biochar Fertilization on Plant Nutrients and Stoichiometry

There was a significant effect of biochar fertilization on the C concentration in leaves and shoots (p ≤ 0.05) but not in roots (p > 0.05) (Table 3, Figure 3a,b). Two-way ANOVAs implied that biochar significantly affected N and P concentration in leaves, N concentration in roots and P concentration in shoots (p < 0.05) (Table 3, Figure 3c–f). Biochar significantly enhanced the NSC concentration in leaves (except high biochar addition for CL) and roots (p ≤ 0.05, Figure 3g,h), but NSC did not decline significantly in shoots for either PM or CL (except high biochar addition) (p > 0.05, Figure 3g,h).
Medium biochar addition significantly increased the N to P ratio of roots for PM (p ≤ 0.05, Figure 4c), whereas all biochar fertilization addition treatments significantly decreased the N to P ratio of leaves and shoots for CL (p ≤ 0.05, Figure 4a,b). The variation in the sugar to starch ratio of leaves in medium biochar addition and of roots in low biochar addition were significantly higher than that in control for PM (p ≤ 0.05, Figure 4d,f). A significant interactive effect between biochar dosage and species on the sugar to starch ratio in roots was detected (p ≤ 0.05, Table 3).

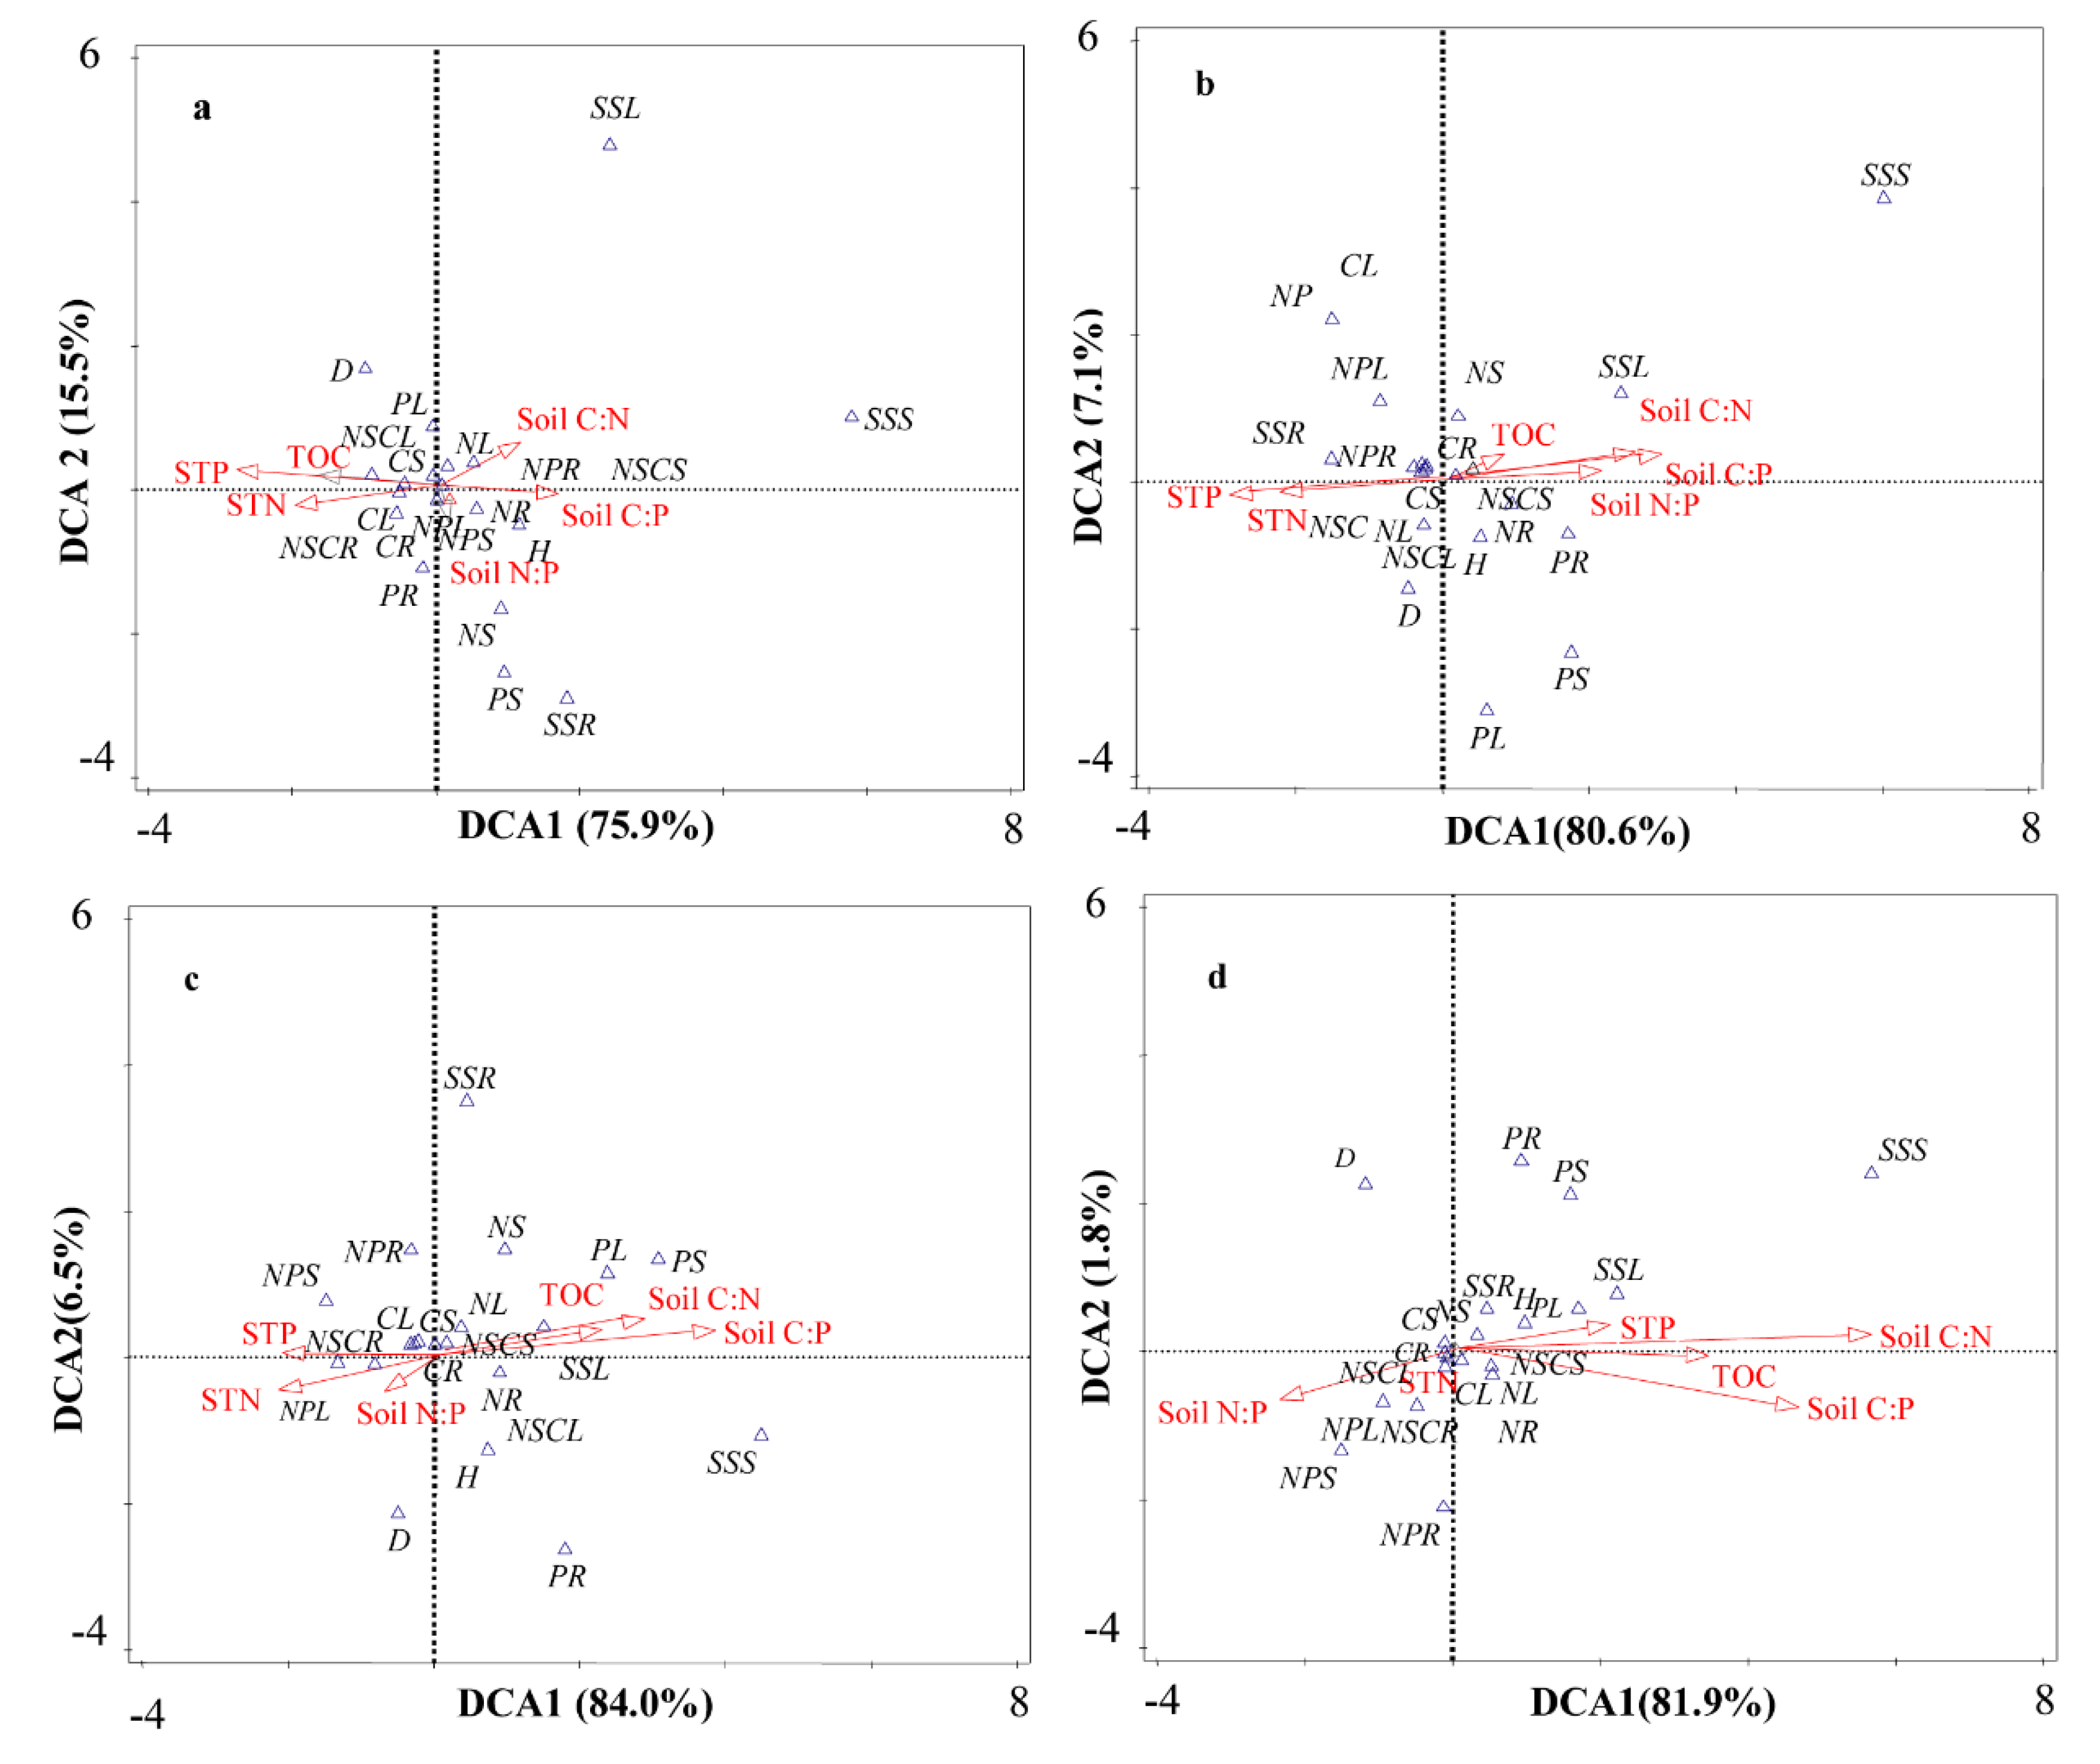
3.5. Relationships of Stoichiometry between Plants and Soil under Biochar Fertilization

The first two ordination axes of the detrended correspondence analysis (DCA) could account for 75.9% (first axis) and 15.5% (second axis) of the stoichiometric relationships for CK, 80.6% and 7.1% for LB, 84.0% and 6.5% for MB, and 81.9% and 1.8% for HB (Figure 5a–d). Biochar fertilization enhanced the interactive effect of soil C:N, soil C:P, and soil N:P on the plant nutrients and stoichiometry, especially the P concentration and the sugar to starch ratio in leaves, shoots, and roots (Figure 5b–d).
The first two ordination axes of the detrended correspondence analysis (DCA) could account for 75.9% (first axis) and 15.5% (second axis) of the stoichiometric relationships for control, 80.6% and 7.1% for low biochar addition, 84.0% and 6.5% for medium biochar addition, and 81.9% and 1.8% for high biochar addition (Figure 5a–d). Biochar fertilization enhanced the interactive effect of soil C:N, soil C:P and soil N:P on the plant nutrients and stoichiometry, especially the P concentration and the sugar to starch ratio in leaves, shoots, and roots (Figure 5b–d).
Significant relationships were found between plant and soil nutrients, as well as stoichiometry, under biochar fertilization (Table 4). SOC was positively correlated with the P concentration in leaves and shoots, as well as with the sugar to starch ratio, but was negatively correlated with the N to P ratio in shoots under biochar fertilization. Significant positive relationships between soil C:N and the N and P concentrations and the sugar to starch ratio in leaves and the P concentration in shoots were detected, and negative relationships were found with the N to P ratio in shoots and the C concentration in roots (Table 4).

4. Discussion

4.1. Effects of Biochar Fertilization on Plant Growth and Fine Root Morphology

In this study, biochar application to soil had no effect on plant biomass for either species (Table 1), suggesting that such fertilization has only a minor effect on plant dry matter accumulation over a short period [32]. One important reason why biochar fertilization did not influence plant biomass may be desiccation, because application in spring, as in the present study, may cause water shortage in soils through water absorption in the biochar [33]. The second reason was the distribution of biochar application in soil; homogeneously mixed biochar addition had no significant effect on total biomass [5]. Biochar fertilization did not lead to enhanced total root biomass (Table 1) but had a significant positive effect on fine root volume and the number of fine root tips (1.0–2.0 mm diameter class) for both PM and CL (Table 2), and thus the root zones for capturing resources from the soil were enhanced with the increase of root investment [22]. These results may be attributed to a later higher water availability in amended zones and increased soil available nutrients (especially P concentration in leaves) (Table 4). In addition, better root development caused by biochar fertilization may be related to a decrease in soil resistance to root penetration [34] or to indirect interactions between plants and organic labile compounds in the biochar.
In this study, there was a significant positive effect of biochar fertilization on root morphology in the 1.0–2.0 mm diameter class in PM under high biochar addition and in the 0–0.5 mm class in CL under low biochar addition (Figure 2a–f), indicating that biochar addition effects on root growth varied with root class and tree species. In this study, CL, a fast-growing species, may develop more 0–0.5 mm fine roots to satisfy rapid growth by absorbing water and nutrients with the increase of P concentration, compared with the increase of root diameter [35]. Biochar addition showed a positive effect on plant height and diameter in this study, possibly because of the changes in root morphology [36]. The enhanced plant height and diameter growth observed in our study (Figure A1) may have been due to the link between root hairs (and effects on soil).These changes led to greater nutrient uptake and thus growth by the enhanced bacterial diversity or the exudation of enzymes [37,38]. In addition, we found that medium biochar addition led to a decline in fine root length, surface area, and volume in the 1.0–2.0 mm class for CL (Figure 2b,d,f), suggesting that medium biochar addition may restrain the growth of this size class. This result indicates that CL has a different adaptive strategy, growing in more barren soil than PM, which resulted in the observed difference in root biomass. In conclusion, altered root morphology, enhanced nutrient availability, and increased soil nutrient concentrations under biochar addition can have a positive effect on plant biomass (although not significant in the first growing season) [39] by increasing uptake of available N [40] and reducing soil phytotoxicity.
In this study, the increased net height of CL and net diameter of PM under high biochar addition (Figure A1) were associated with increased N and P in leaves for CL and in shoots for PM (Figure 5). This result suggests that a mobilization of N and P from soil towards the leaves and shoots can improve the nutrient use efficiency of plants through an interaction between the soil and biochar, indicating that the nutrients from biochar fertilization can enhance plant height and base diameter growth but not net biomass accumulation. The results also indicate that increasing biochar levels can significantly increase tissue macronutrient contents and nutrient stoichiometry [13], although a significant negative effect was observed for the tissue N to P ratio. Woldetsadik et al. [41] also showed that aboveground biomass was positively correlated with the P concentration in stems and negatively correlated with the N to P ratio in stems. Therefore, biomass allocation to roots with a high N to P ratio was less than that to roots with a low N to P ratio but a similar growth rate [38], indicating that the change in plant nutrient concentrations and absorption patterns were partly correlated with biochar through a shift in plant nutrient stoichiometry [13].

4.2. Effects of Biochar Fertilization on Plant Nutrients in Relation to Soil Nutrients

Significantly increased N and P concentrations in shoots of PM, and increased N concentration in leaves and P concentration in leaves and shoots of CL under high biochar addition (Figure 3c–f) indicated that increasing biochar dosage led to significantly enhanced N and P concentrations in specific tissues. We found that low biochar addition led to a significant decrease in the N and P concentrations in the roots of PM and in the N concentration in the roots of CL (Figure 3c–e), suggesting that biochar may influence nutrient flows between the soil and plants via nutrient absorption by roots. Specifically, PM may have lower proportional N and P resorption, and CL may show lower N resorption, because roots of CL may have a more soil phosphorus activation compared with PM [35]. This result indicates reallocation of P from roots to leaves and shoots, with enhanced root phosphatase activity to increase N and P availability in the soil [42]. In contrast to our results, Xiang et al. [43] showed that biochar fertilization significantly increased the root P concentration but did not change the root N concentration of crops. These inconsistent findings may be associated with different nutrient absorption and reallocation strategies of trees and crops. Significantly increased NSC concentrations in leaves (except under high biochar addition) and roots under the three biochar addition rates for PM and under low biochar addition only for CL (Figure 3g,h) suggests that the changes observed in plant and soil nutrients and stoichiometry may reflect a change in investment into photosynthetic machinery for both species [42]. For example, Rees et al. [34] found that 5% (w/w) biochar fertilization had no effect on shoot production of Noccaea caerulescens subsp. caerulescens but significantly increased root surface area and root biomass. Hence, the difference in nutrient reallocation under biochar addition in our study may have resulted from the different nutrient utilization strategies and environmental adaptation of the two species.
Previous studies have suggested that a shift in the N to P ratio indicates changes in plant traits, species diversity and growth [38]. In our study, a significantly reduced N to P ratio (<14) in leaves and shoots (Figure 4a,b) and an increased P concentration leaves and shoots for CL (Figure 3e,f) suggests that nutrient resorption caused by biochar fertilization has a different effect on N and P relationships in different forest species. This indicates that CL may have a higher growth rate, which has been found to be associated with lower N to P ratios [44], affirming the relationships between the ratio of N to P in needle and plant growth [8]. These findings indicate the importance of balancing the absorption of nutrients as a potential forest management strategy [45]. In our study, low biochar addition and medium biochar addition significantly increased the sugar to starch ratio in the leaves and roots (Figure 4d,f) of PM, and all three biochar addition dosages significantly decreased the sugar to starch ratio in the roots of CL (Figure 4f), suggesting that different species have different adaptive strategies to changes in the soil environment under biochar addition. PM may reallocate more sugar in leaves and roots to promote growth by nutrient absorption from biochar, or different species may have different renewable energy resources for long-term growth [46]. Razaq et al. [14] found that biochar (application levels of 10, 15, and 20 g per plant) significantly increased the N concentration and C to N ratio in fine roots of Acer mono after 120 to 140 days compared to the control (p ≤ 0.05), indicating a positive interaction between biochar particles and roots. In conclusion, our findings show that biochar addition has a major influence on C:N:P partitioning in different forest tree species through different plant absorption strategies [47].
In this study, significantly enhanced soil C:N and C:P for both PM and CL (Figure 1d–f) under biochar fertilization was a key factor in soil chemical property changes, suggesting that a shift in soil stoichiometry may alter the amount of nutrients available for microorganisms by increasing available soil N and P and by fixing N [48]. In our study, the increases in STN and STP observed under high biochar addition were related to the C concentration in leaves, the NSC concentration in shoots, and the N concentration and N to P ratio in roots (Table 4), suggesting that the available N and P from biochar influenced tissue nutrient absorption. This result indicates that changes in the bioavailability of macro- and micronutrients in plants induced by biochar addition are beneficial for plant growth [49,50]. Macdonald et al. [51] suggested that significant relationships between plant biomass and increased pH values benefit from increased P concentration. However, a lower biochar dosage did not significantly enhance total N and P concentration in the soil in this study, indicating that the soil did not absorb enough N and P from the biochar [34], even if root and base diameter growth were improved by biochar addition, but that did not satisfy aboveground parts’ nutrient demand [5]. In our study, we found significant correlations between soil C:N and soil microbial community compositional changes (data not shown), suggesting that the increase in soil C:N was the key factor contributing to changes in microbial composition under higher addition rates.
The study of Bell et al. [52] showed that the leaf N to P ratio was significantly positively correlated with the soil N to P ratio for grass species. Fan et al. [21] showed that the soil N:P is strongly related to the plant N to P ratio. In our study, there were no significant relationships between the leaf N to P ratio and the soil N:P, but there was a significant negative correlation with the soil C:P (Figure 5 and Table 4), indicating that different plant species have different incorporation and stoichiometric interactions between the plant and soil. In addition, the stoichiometry of different plant tissues may be associated with the spatial distributions of nutrients and the interactions between the plant and soil. In our study, the N to P ratios in leaves, shoots, and roots were negatively correlated with STP, although only significantly so in roots (Table 4), suggesting that belowground interactions between roots and soil were more important than aboveground interactions under biochar fertilization. This result indicates that the increase in STP may be directly associated with the decrease in the N to P ratio in roots and other plant compartments [53]. Further long-term research is required to understand the interaction mechanism of plant and soil stoichiometry by changing root morphology and nutrient absorption under biochar fertilization.

5. Conclusions

Biochar fertilization did not significantly alter plant biomass fine root length and fine root surface area, but higher fertilization rates significantly increased soil organic C and total N and P, which directly led to an increase in soil C:N and C:P. The enhancement of plant net height and net diameter by biochar addition could be attributed to an increase in the N and P concentrations in leaves or shoots, or to greater absorption of available nutrients via changed root morphology (1.0–2.0 mm for PM and 0–0.5 mm for CL). Biochar fertilization enhanced the contribution of soil stoichiometry, tissue P concentration, and the ratio of sugar to starch on plant growth. Overall, our findings suggest that biochar fertilization has a profound effect on root traits and aboveground–belowground stoichiometry of PM and CL. However, literature is scarce regarding the interaction of biochar, root traits, and stoichiometry, and further studies are needed to explore the mechanisms and potential applications of these relationships.

Author Contributions

Conceptualization, X.G. and B.Z.; methodology, X.G. and X.W.; software, X.G., X.W. and Z.Y.; formal analysis, X.G. and Y.C.; investigation, X.G., Z.Y. and Y.C.; resources, X.G.; data curation, X.G., W.X. and M.-H.L.; writing—original draft preparation, X.G. and M.-H.L.; writing—review and editing, W.X.; supervision, B.Z. and W.X.; project administration, B.Z. and W.X.; funding acquisition, X.G.

Funding

This research was funded by the National Key Research and Development Program of the Ministry of Science and Technology of China, grant number 2016YFD0600202; the China Scholarship Council, grant number 201703270004; the National Natural Science Foundation of China, grant number 31600492 and 31670607; the Fundamental Research Funds for the Central Non-profit Research Institution; grant number CAFYBB2016SY006, CAFYBB2017ZX002-2 and CAFRISF2014005; Qianjiangyuan National Forest Ecological Research Station and CFERN & BEIJING TECHNO SOLUTIONS Award Funds for excellent academic achievements.

Acknowledgments

We greatly thank Melissa Dawes for providing linguistic suggestions. We also thank three anonymous reviewers for helpful suggestions on the manuscript.

Conflicts of Interest

The authors declare no conflict of interest.

Appendix A

Figure A1. Effects of biochar fertilization on the net height increase (a) and net diameter increase (b) of Pinus massoniana and Cunninghamia lanceolata. Different lowercase letters above individual bars for the same species mean significant differences at p ≤ 0.05. CK: control, LB: low biochar addition, MB: medium biochar addition, HB: highbiochar addition.
Forests 10 00612 g0a1

References

  1. Singh, N.; Abiven, S.; Maestrini, B.; Bird, J.A.; Torn, M.S.; Schmidt, M.W.I. Transformation and stabilization of pyrogenic organic matter in a temperate forest field experiment. Glob. Chang. Biol. 2014, 20, 1629–1642. [Google Scholar] [CrossRef] [PubMed]
  2. Lehmann, J.; Gaunt, J.; Rondon, M. Bio-char sequestration terrestrial ecosystems—A review. Mitig. Adapt. Strateg. Glob. 2006, 11, 403–427. [Google Scholar] [CrossRef]
  3. Sohi, S.P.; Krull, E.; Lopez-Capel, E.; Bol, R. A review of biochar and its use and function in soil. In Advances in Agronomy; Donald, D.L., Ed.; Academic Press: Burlington, MA, USA, 2010. [Google Scholar]
  4. Amendola, C.; Montagnoli, A.; Terzaghi, M.; Trupiano, D.; Oliva, F.; Baronti, S.; Miglietta, F.; Chiatante, D.; Scippa, G.S. Short-term effects of biochar on grapevine fine root dynamics and arbuscular mycorrhizae production. Agric. Ecosyst. Environ. 2017, 239, 236–245. [Google Scholar] [CrossRef]
  5. Makoto, K.; Tamai, Y.; Kim, Y.S.; Koike, T. Buried charcoal layer and ectomycorrhizae cooperatively promote the growth of Larix gmelinii seedlings. Plant Soil 2010, 327, 143–152. [Google Scholar] [CrossRef]
  6. Egamberdieva, D.; Wirth, S.; Behrendt, U.; Allah, E.F.A.; Berg, G. Biochar treatment resulted in a combined effect on soybean growth promotion and a shift in plant growth promoting rhizobacteria. Front. Microbiol. 2016, 7, 209. [Google Scholar] [CrossRef] [PubMed]
  7. Jeffery, S.; Bezemer, T.M.; Cornelissen, G.; Kuyper, T.W.; Lehmann, J.; Mommer, L.; Sohi, S.P.; van de Voorde, T.F.J.; Wardle, D.A.; van Groenigen, J.W. The way forward in biochar research: Targeting trade-offs between the potential wins. GCB Bioenergy 2015, 7, 1–13. [Google Scholar] [CrossRef]
  8. Makoto, K.; Choi, D.; Hashidoko, Y.; Koike, T. The growth of Larix gmelinii seedlings as affected by charcoal produced at two different temperatures. Biol. Fertil. Soils 2011, 47, 467–472. [Google Scholar] [CrossRef]
  9. McElligott, K.M. Biochar Amendments to Forest Soils: Effects on Soil Properties and Tree Growth. Master’s Thesis, University of Idaho, Moscow, ID, USA, 2011. [Google Scholar]
  10. Hagner, M.; Kemppainen, R.; Jauhiainen, L.; Tiilikkala, K.; Setälä, H. The effects of birch (Betula spp.) biochar and pyrolysis temperature on soil properties and plant growth. Soil Tillage Res. 2016, 163, 224–234. [Google Scholar] [CrossRef]
  11. Taghizadeh-Toosi, A.; Clough, T.J.; Sherlock, R.R.; Condron, L.M. Biochar absorbed ammonia is bioavailable. Plant Soil 2012, 350, 57–69. [Google Scholar] [CrossRef]
  12. Sackett, T.E.; Basiliko, N.; Noyce, G.L.; Winsborough, C.; Schurman, J.; Ikeda, C.; Thomas, S.C. Soil and greenhouse gas responses to biochar additions in a temperature hardwood forest. GCB Bioenergy 2015, 7, 1062–1074. [Google Scholar] [CrossRef]
  13. Gale, N.V.; Thomas, S.C. Dose-dependence of growth and ecophysiological responses of plants to biochar. Sci. Total Environ. 2019, 658, 1344–1354. [Google Scholar] [CrossRef] [PubMed]
  14. Razaq, M.; Salahuddin; Shen, H.L.; Sher, H.; Zhang, P. Influence of biochar and nitrogen of fine root morphology, physiology, and chemistry of Acer mono. Sci. Rep. 2018, 7, 5367. [Google Scholar] [CrossRef] [PubMed]
  15. Fernández-Ugalde, O.; Gartzia-Bengoetxea, N.; Arostegi, J.; Moragues, L.; Arias-González, A. Storage and stability of biochar-derived carbon and total organic carbon in relation to minerals in an acid forest soil of the Spanish Atlantic area. Sci. Total Environ. 2017, 587–588, 204–213. [Google Scholar] [CrossRef] [PubMed]
  16. Mitchell, P.J.; Simpson, A.J.; Soong, R.; Simpson, M.J. Shifts in microbial community and water-extractable organic matter composition with biochar amendment in a temperate forest soil. Soil Biol. Biochem. 2015, 81, 244–254. [Google Scholar] [CrossRef]
  17. Birge, H.E.; Conant, R.T.; Follett, R.F.; Haddix, M.L.; Morris, S.J.; Snapp, S.S.; Wallenstein, M.D.; Paul, E.A. Soil respiration is not limited by reductions in microbial biomass during long-term soil incubations. Soil Biol. Biochem. 2015, 81, 304–310. [Google Scholar] [CrossRef] [Green Version]
  18. Makoto, K.; Shibata, H.; Kim, Y.S.; Satomura, T.; Takagi, K.; Nomura, M.; Satoh, F.; Koike, T. Contribution of charcoal to short-term nutrient dynamics after surface fire in the humus layer of a dwarf bamboo-dominated forest. Biol. Fertil. Soils 2012, 48, 569–577. [Google Scholar] [CrossRef]
  19. Thomas, S.C.; Gale, N. Biochar and forest restoration: A review and meta-analysis of tree growth responses. New For. 2015, 46, 931–946. [Google Scholar] [CrossRef]
  20. Gul, S.; Whalen, J.K. Biochemical cycling of nitrogen and phosphorus in biochar-amended soils. Soil Biol. Biochem. 2016, 103, 1–15. [Google Scholar] [CrossRef]
  21. Fan, H.; Wu, J.P.; Liu, W.F.; Yuan, Y.H.; Hu, L.; Cai, Q.K. Linkages of plant and soil C:N:P stoichiometry and their relationships to forest growth in subtropical plantations. Plant Soil 2015, 392, 127–138. [Google Scholar] [CrossRef]
  22. Robertson, S.J.; Rutherford, P.M.; López-Gutiérrez, J.C.; Massicotte, H.B. Biochar enhances seedling growth and alters root symbioses and properties of sub-boreal forest soils. Can. J. Soil Sci. 2012, 92, 329–340. [Google Scholar] [CrossRef]
  23. Li, Y.C.; Li, Y.F.; Chang, S.X.; Yang, Y.F.; Fu, S.L.; Jiang, P.K.; Luo, Y.; Yang, M.; Chen, Z.H.; Hu, S.D.; et al. Biochar reduces soil heterotrophic respiration in a subtropical plantation through increasing soil organic carbon recalcitrancy and decreasing carbon-degrading microbial activity. Soil Biol. Biochem. 2018, 122, 173–185. [Google Scholar] [CrossRef]
  24. Palviainen, M.; Berninger, F.; Bruckman, V.J.; Köster, K.; Ribeiro, C.; De Assumpção, M.; Aaltonen, H.; Makita, N.; Mishra, A.; Kulmala, L.; et al. Effects of biochar on carbon and nitrogen fluxes in boreal forest soil. Plant Soil 2018, 425, 71–85. [Google Scholar] [CrossRef] [Green Version]
  25. Zhang, Q.F.; Xie, J.S.; Lyu, M.K.; Xiong, D.C.; Wang, J.; Chen, Y.M.; Li, Y.Q.; Wang, M.K.; Yang, Y.S. Short-term effects of soil warming and nitrogen addition on the N:P stoichiometry of Cunninghamia lanceolata in subtropical regions. Plant Soil 2017, 411, 395–407. [Google Scholar] [CrossRef]
  26. FAO. Global Forest Resources Assessment 2015: How are the World’s Forests Changing? Food and Agricultural organization of the United Nations: Rome, Italy, 2016. [Google Scholar]
  27. Ge, X.G.; Xiao, W.F.; Zeng, L.X.; Huang, Z.L.; Lei, J.P.; Li, M.H. The link between litterfall, substrate quality, decomposition rate and soil nutrient supply in 30-year-old Pinus massoniana forests in the Three Gorges Reservoir Area, China. Soil Sci. 2013, 178, 442–451. [Google Scholar] [CrossRef]
  28. Tammeorg, P.; Simojoki, A.; Mäkelä, P.; Stoddard, F.L.; Alakukku, L.; Helenius, J. Short-term effects of biochar on soil properties and wheat yield formation with meat bone meal and inorganic fertiliser on a boreal loamy sand. Agric. Ecosyst. Environ. 2014, 191, 108–116. [Google Scholar] [CrossRef]
  29. Miller, R.H.; Keeney, D.R. Methods of Soil Analysis, 2nd ed.; American Society of Agronomy, Soil Science Society of America: Madison, WI, USA, 1982. [Google Scholar]
  30. Yang, Y.S.; Guo, J.F.; Chen, G.S.; Xie, J.S.; Cai, L.P.; Lin, P. Litterfall, nutrient return, and leaf-litter decomposition in four plantations compared with a natural forest in subtropical China. Ann. For. Sci. 2004, 61, 465–476. [Google Scholar] [CrossRef] [Green Version]
  31. Li, M.H.; Xiao, W.F.; Shi, P.L.; Wang, S.G.; Zhong, Y.D.; Liu, X.L.; Wang, X.D.; Cai, X.H.; Shi, Z.M. Nitrogen and carbon source-sink relationships in trees at the Himalayan treelines compared with lower elevations. Plant Cell Environ. 2008, 31, 1377–1387. [Google Scholar] [CrossRef] [PubMed]
  32. Hol, W.H.G.; Vestergård, M.; ten Hooven, F.; Duyts, H.; van de Voorde, T.F.J.; Bezemer, T.M. Transient negative biochar effects on plant growth are strongest after microbial species loss. Soil Biol. Biochem. 2017, 115, 442–451. [Google Scholar] [CrossRef]
  33. Bruun, E.W.; Ambus, P.; Egsgaard, H.; Hauggaard-Nielsen, H. Effects of slow and fast pyrolysis biochar on soil C and N turnover dynamics. Soil Biol. Biochem. 2012, 46, 73–79. [Google Scholar] [CrossRef]
  34. Rees, F.; Sterckeman, T.; Morel, J.L. Root development of non-accumulating and hyperaccumulating plants in metal-contaminated soils amended with biochar. Chemosphere 2016, 142, 48–55. [Google Scholar] [CrossRef]
  35. Wu, P.F.; Wang, G.Y.; Farooq, T.H.; Li, Q.; Zou, X.H.; Ma, X.Q. Low phosphorus and competition affect Chinese fir cutting growth and root organic acid content: Does neighboring root activity aggravate P nutrient deficiency ? J. Soils Sediments 2017, 17, 2775–2785. [Google Scholar] [CrossRef]
  36. Obia, A.; Mulder, J.; Martinsen, V.; Cornelissen, G.; Børresen, T. In situ effects of biochar on aggregation, water retention and porosity in light-textured tropical soils. Soil Tillage Res. 2016, 155, 35–44. [Google Scholar] [CrossRef]
  37. Delgado-Baquerizo, M.; Reich, P.B.; Khachane, A.N.; Campbell, C.D.; Thomas, N.; Freitag, T.E.; Al-Soud, W.A.; Sørensen, S.; Bardgett, R.D.; Singh, B.K. It is elemental: Soil nutrient stoichiometry drives bacterial diversity. Environ. Microbiol. 2017, 19, 1176–1188. [Google Scholar] [CrossRef] [PubMed]
  38. Güsewell, S. N:P ratios in terrestrial plants: Variation and functional significance. New Phytol. 2004, 164, 243–266. [Google Scholar] [CrossRef]
  39. Backer, R.G.M.; Saeed, W.; Seguin, P.; Smith, D.L. Root traits and nitrogen fertilizer recovery efficiency of corn grown in biochar-amended soil under greenhouse condition. Plant Soil 2017, 415, 465–477. [Google Scholar] [CrossRef]
  40. Ventura, M.; Zhang, C.; Baldi, E.; Fornasier, F.; Sorrenti, G.; Panzacchi, P.; Tonon, G. Effect of biochar addition on soil respiration partitioning and root dynamics in an apple orchard. Eur. J. Soil Sci. 2014, 65, 186–195. [Google Scholar] [CrossRef]
  41. Woldetsadik, D.; Drechsel, P.; Marschner, B.; Itanna, F.; Gebrekidan, H. Effect of biochar derived from faecal matter on yield and nutrient content of lettuce (Lactuca sativa) in two contrasting soils. Environ. Syst. Res. 2017, 6, 2. [Google Scholar] [CrossRef]
  42. Castellanos, A.E.; Llano-Sotelo, J.M.; Machado-Encinas, L.I.; López-Piña, J.E.; Romo-Leon, J.R.; Sardans, J.; Peñuelas, J. Folia C, N, and P stoichiometry characterize successful plant ecological strategies in the Sonoran Desert. Plant Ecol. 2018, 219, 775–788. [Google Scholar] [CrossRef]
  43. Xiang, Y.Z.; Deng, Q.; Duan, H.L.; Guo, Y. Effects of biochar application on root traits: A meta-analysis. GCB Bioenergy 2017, 9, 1563–1572. [Google Scholar] [CrossRef]
  44. Ǻgren, G.I. The C:N:P stoichiometry of autotrophs-theory and observations. Ecol. Lett. 2004, 7, 185–191. [Google Scholar] [CrossRef]
  45. Zhang, R.; Zhao, Y.X.; Lin, J.H.; Hu, Y.Y.; Hänninen, H.; Wu, J.S. Biochar application alleviates unbalanced nutrient uptake caused by N deposition in Torreya grandis trees and seedlings. For. Ecol. Manag. 2019, 432, 319–326. [Google Scholar] [CrossRef]
  46. Li, N.; He, N.P.; Yu, G.R.; Wang, Q.F.; Sun, J. Leaf non-structural carbohydrates regulated by plant functional groups and climate: Evidences from a tropical to cold-temperate forest transect. Ecol. Indic. 2016, 62, 22–31. [Google Scholar] [CrossRef]
  47. McGroddy, M.E.; Daufresne, T.; Hedin, L.O. Scaling of C:N:P stoichiometry in forests worldwide: Implications of terrestrial red field-type ratios. Ecology 2004, 85, 2390–2401. [Google Scholar] [CrossRef]
  48. Gregory, S.J.; Anderson, C.W.N.; Arbestain, M.C.; McManus, M.T. Response of plant and soil microbes to biochar amendment of an arsenic-contaminated soil. Agric. Ecosyst. Environ. 2014, 191, 133–141. [Google Scholar] [CrossRef]
  49. Reverchon, F.; Flicker, R.C.; Yang, H.; Yan, G.J.; Xu, Z.H.; Chen, C.R.; Bai, S.H.; Zhang, D.K. Changes in δ15N in a soil–plant system under different biocharfeedstocks and application rates. Biol. Fertil. Soils 2014, 50, 275–283. [Google Scholar] [CrossRef]
  50. Elzobair, K.A.; Stromberger, M.E.; Ippolito, J.A.; Lentz, R.D. Contrasting effects of biochar versus manure on soil microbial communities and enzyme activities in an Aridisol. Chemosphere 2016, 142, 145–152. [Google Scholar] [CrossRef] [PubMed]
  51. Macdonald, L.M.; Farrell, M.; Van Zwieten, L.; Krull, E.S. Plant growth responses to biochar addition: An Australian soils perspective. Biol. Fertil. Soils 2014, 50, 1035–1045. [Google Scholar] [CrossRef]
  52. Bell, C.; Carrillo, Y.; Boot, C.M.; Rocca, J.D.; Pendall, E.; Wallenstein, M.D. Rhizosphere stoichiometry: Are C:N:P ratios of plants, soils, and enzymes conserved at the plant species-level? New Phytol. 2014, 201, 505–517. [Google Scholar] [CrossRef]
  53. Richardson, S.J.; Allen, R.B.; Doherty, J.E. Shifts in leaf N:P ratio during resorption reflect soil P in temperate rainforest. Funct. Ecol. 2008, 22, 738–745. [Google Scholar] [CrossRef]
Figure 1. The effects of biochar fertilization on (a) soil organic C (SOC), (b) soil total N (STN), (c) soil total P (STP), and (df) soil stoichiometry under Pinus massoniana and Cunninghamia lanceolata. Different lowercase letters above bars in the same species mean significant differences at p ≤ 0.05. CK: control, LB: low biochar addition, MB: medium biochar addition, HB: high biochar addition.
Forests 10 00612 g001
Figure 2. The effects of biochar fertilization on fine root length (a,b), fine root surface area (c,d), fine root volume (e,f), and number of fine root tips (g,h) in Pinus massoniana and Cunninghamia lanceolata. Different lowercase letters above bars in the same soil layer mean significant differences at p ≤ 0.05. CK: control, LB: low biochar addition, MB: medium biochar addition, HB: high biochar addition.
Forests 10 00612 g002
Figure 3. The effects of biochar fertilization on plant C (a,b), N (c,d), P (e,f), and nonstructural carbohydrates (NSC) (g,h) in Pinus massoniana and Cunninghamia lanceolata. Different lowercase letters above bars in the same plant compartment mean significant differences at p ≤ 0.05. CK: control, LB: low biochar addition, MB: medium biochar addition, HB: high biochar addition.
Forests 10 00612 g003
Figure 4. The effects of biochar fertilization on the plant N to P ratio and sugar to starch ratio of leaves (a), shoots (b), and roots (c) in Pinus massoniana and Cunninghamia lanceolata. Different lowercase letters above bars in the same species mean significant differences at p ≤ 0.05. CK: control, LB: low biochar addition, MB: medium biochar addition, HB: high biochar addition.
Forests 10 00612 g004
Figure 5. The effects of biochar fertilization (a) control, (b) low biochar addition, (c) medium biochar addition, and (d) high biochar addition on soil organic C (SOC), soil total N (STN), soil total P (STP), nonstructural carbohydrates (NSC), plant N to P ratio (RNP), plant sugar to starch ratio (RSS), soil C:N, soil C:P, and soil N:P in experiments of Pinus massoniana and Cunninghamia lanceolata.
Forests 10 00612 g005
Table 1. Results of two-way ANOVA on effects of species (Pinus massoniana and Cunninghamia lanceolata), biochar treatment, and their interaction on plant biomass and soil indicators.
VariableSpecies (S)Biochar (B)S × B
FpFpFp
Leaves biomass16.370.0000.760.5260.760.526
Shoots biomass5.970.0191.340.2761.450.243
Roots biomass6.050.0181.450.2422.080.118
Total biomass5.290.0271.140.3440.620.604
Initial height108.370.0000.630.6011.340.277
Initial diameter0.290.5962.550.0692.170.107
Final height39.160.0001.430.2483.610.021
Final diameter0.530.4722.100.1152.650.062
Soil organic C0.690.41929.270.0000.920.453
Soil total N4.280.05511.380.0000.440.731
Soil total P12.170.00315.990.0003.250.049
Soil C:N5.960.0275.930.0060.800.513
Soil C:P22.890.00035.720.0003.340.046
Soil N:P0.010.9182.120.1370.260.854
Note: The F-values and p-values are presented the effect of species, biochar, and their interaction for plant organ biomass, initial/final height and diameter, soil nutrients, and soil stoichiometry, p ≤ 0.05 are shown in bold.
Table 2. Results of two-way ANOVA on effects of species (Pinus massoniana and Cunninghamia lanceolata), biochar treatment, root diameter class, and their interaction on fine root length, fine root surface area, fine root volume, and number of fine root tips.
VariableFine Root LengthFine Root Surface AreaFine Root VolumeNumbers of Fine Root Tips
FpFpFpFp
Total fine roots
Species (S)201.470.000210.320.000168.770.00034.690.000
Biochar (B)1.500.2301.700.1831.820.0241.460.241
Diameter class (D)113.640.000115.500.000240.970.159801.940.000
S × B1.320.2831.040.3871.300.2883.010.042
0–0.5 mm roots
Species (S)71.060.000109.310.000141.520.00026.590.000
Biochar (B)1.750.1721.480.2351.330.2781.470.237
S × B2.400.0822.040.1241.840.1552.990.042
0.5–1.0 mm roots
Species (S)229.180.000219.510.000208.740.000175.430.000
Biochar (B)1.840.1552.000.1302.120.1132.200.104
S × B0.720.5450.770.5170.850.4731.270.297
1.0–2.0 mm roots
Species (S)112.990.000108.690.000104.300.00020.100.000
Biochar (B)2.200.1032.000.1291.810.1622.660.041
S × B2.460.0472.280.0942.100.1160.990.406
Note: The F-values and p-values are presented the effect of species, biochar and the their interaction on fine root length, fine root surface area, fine root volume and the numbers of fine root tips for total fine roots, 0–0.5 mm roots, 0.5–1.0 mm roots, and 1.0–2.0 mm roots, p ≤ 0.05 are shown in bold.
Table 3. Results of two-way ANOVA on effects of species (Pinus massoniana and Cunninghamia lanceolata), biochar, and their interaction on plant nutrients and stoichiometry.
VariablesCNPNSCN to P RatioSugar to Starch Ratio
FpFpFpFpFpFp
Leaves
Species (S)8.560.01017.040.00143.680.00076.730.00017.160.00165.200.000
Biochar (B)0.940.04610.060.0018.490.00113.920.0004.670.0161.130.367
S × B0.320.0893.450.0428.860.0011.0780.3876.440.0050.930.450
Shoots
Species (S)14.060.00229.880.00094.440.00023.440.00029.120.00081.480.000
Biochar (B)3.330.0462.280.1198.530.0015.100.0119.800.0011.480.259
S × B1.770.1933.510.0406.040.0062.070.14511.510.0002.090.141
Roots
Species (S)16.650.001184.710.00025.210.00095.170.0006.920.3533.810.069
Biochar (B)0.190.9057.740.0021.490.2549.540.0012.140.1355.870.007
S × B0.600.6221.140.2792.230.1245.880.0072.420.1044.810.014
Note: The F-values and p-values are presented the effect of species, biochar, and their interaction on plant nutrients and stoichiometry in leaves, shoots and roots, p ≤ 0.05 are shown in bold.
Table 4. The relationships between plants and soil indicators under biochar fertilization of Pinus massoniana and Cunninghamia lanceolata.
VariablesLeavesStemsRoots
CNPNSCRNPRSSCNPNSCRNPRSSCNPNSCRNPRSS
SOC0.260.350.47 *0.05−0.390.22−0.310.100.46 *−0.36−0.55 **0.13−0.100.000.260.16−0.340.43 *
STN0.42 *0.020.100.01−0.12−0.12−0.14−0.240.00−0.51 *−0.22−0.120.32−0.38−0.010.36−0.44 *−0.46 *
STP0.58 **0.140.150.02−0.180.77 **0.00−0.240.01−0.65 **−0.20−0.190.21−0.42 *−0.040.38−0.44 *−0.52
Soil C:N−0.050.43 *0.52 **0.36−0.400.41 *−0.250.390.62 **0.05−0.51 *0.26−0.47 *0.390.36−0.16−0.01−0.06
Soil C:P−0.070.360.57 **0.40−0.53 **0.45 *−0.44 *0.290.65 **−0.04−0.66 **0.30−0.300.290.40−0.04−0.19−0.23
Soil N:P0.02−0.140.010.05−0.140.02−0.24−0.130.01−0.09−0.170.030.30−0.170.040.17−0.27−0.18
Note: p ≤ 0.05 are shown in bold. * p < 0.05, ** p < 0.01. NSC: Non-structural carbohydrates; RNP: plant N to P ratio; RSS: plant sugar to starch ratio; SOC: soil organic C; STN: soil total N, STP: soil total P.

