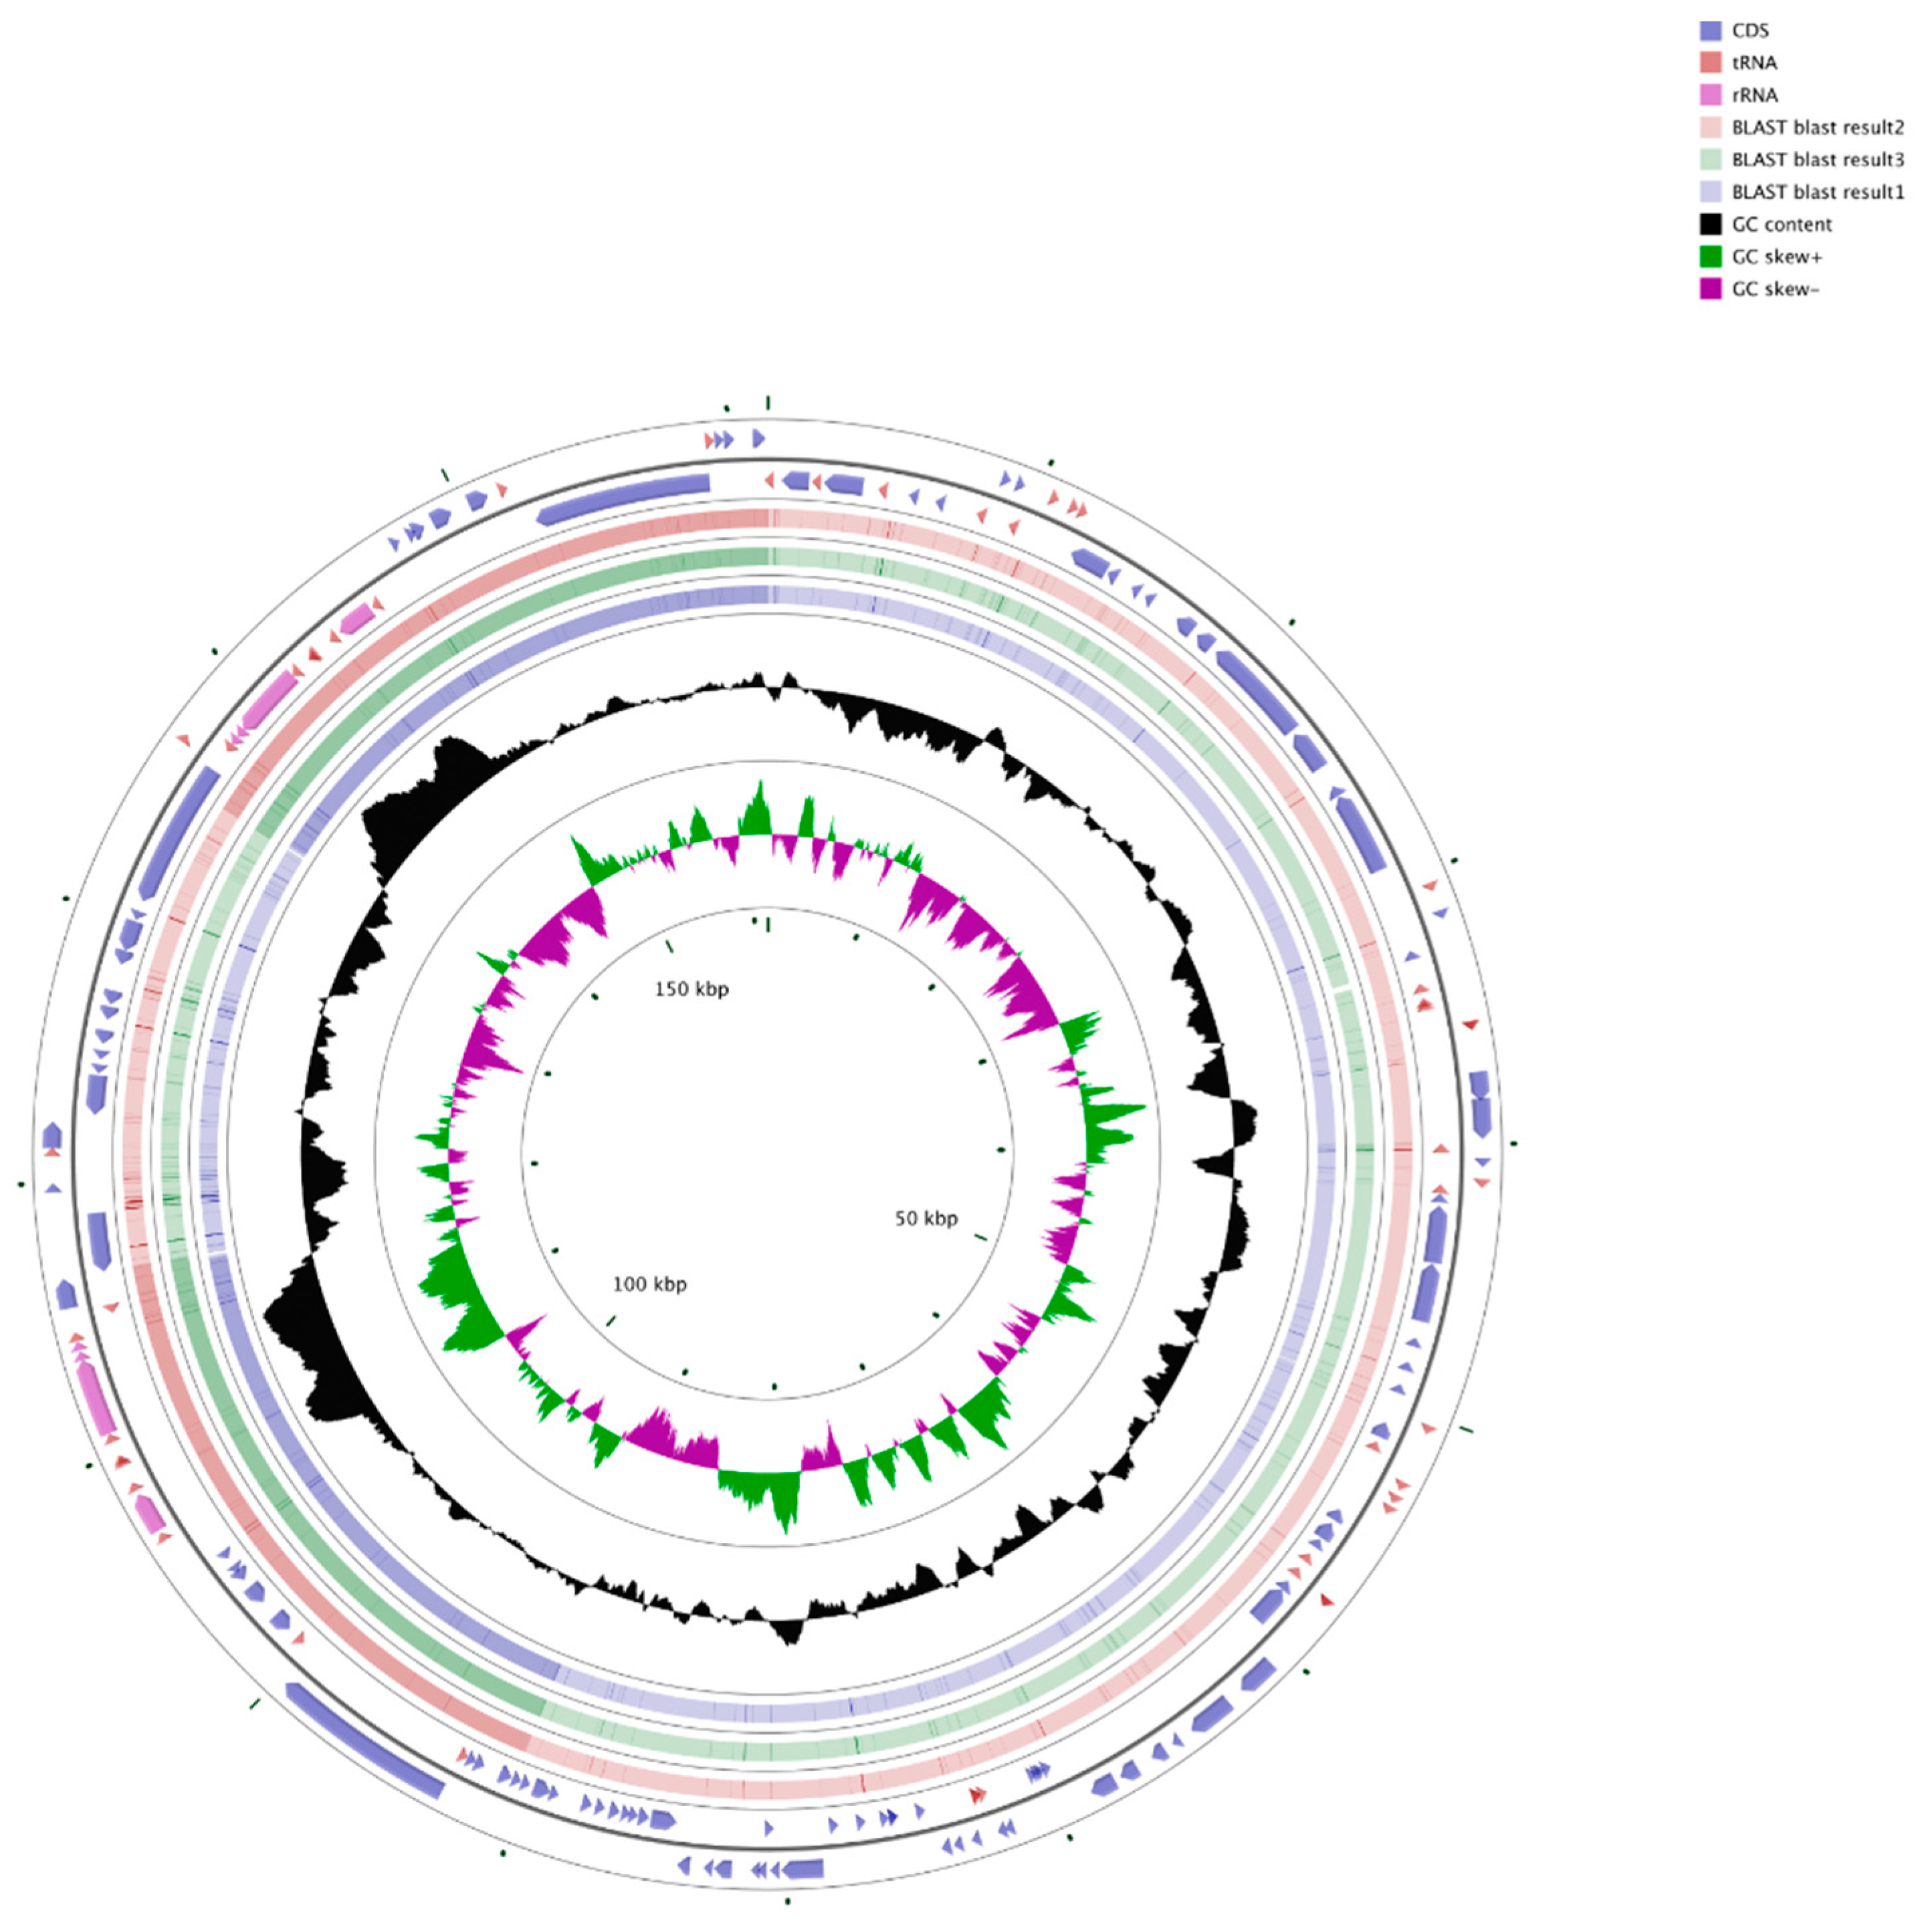
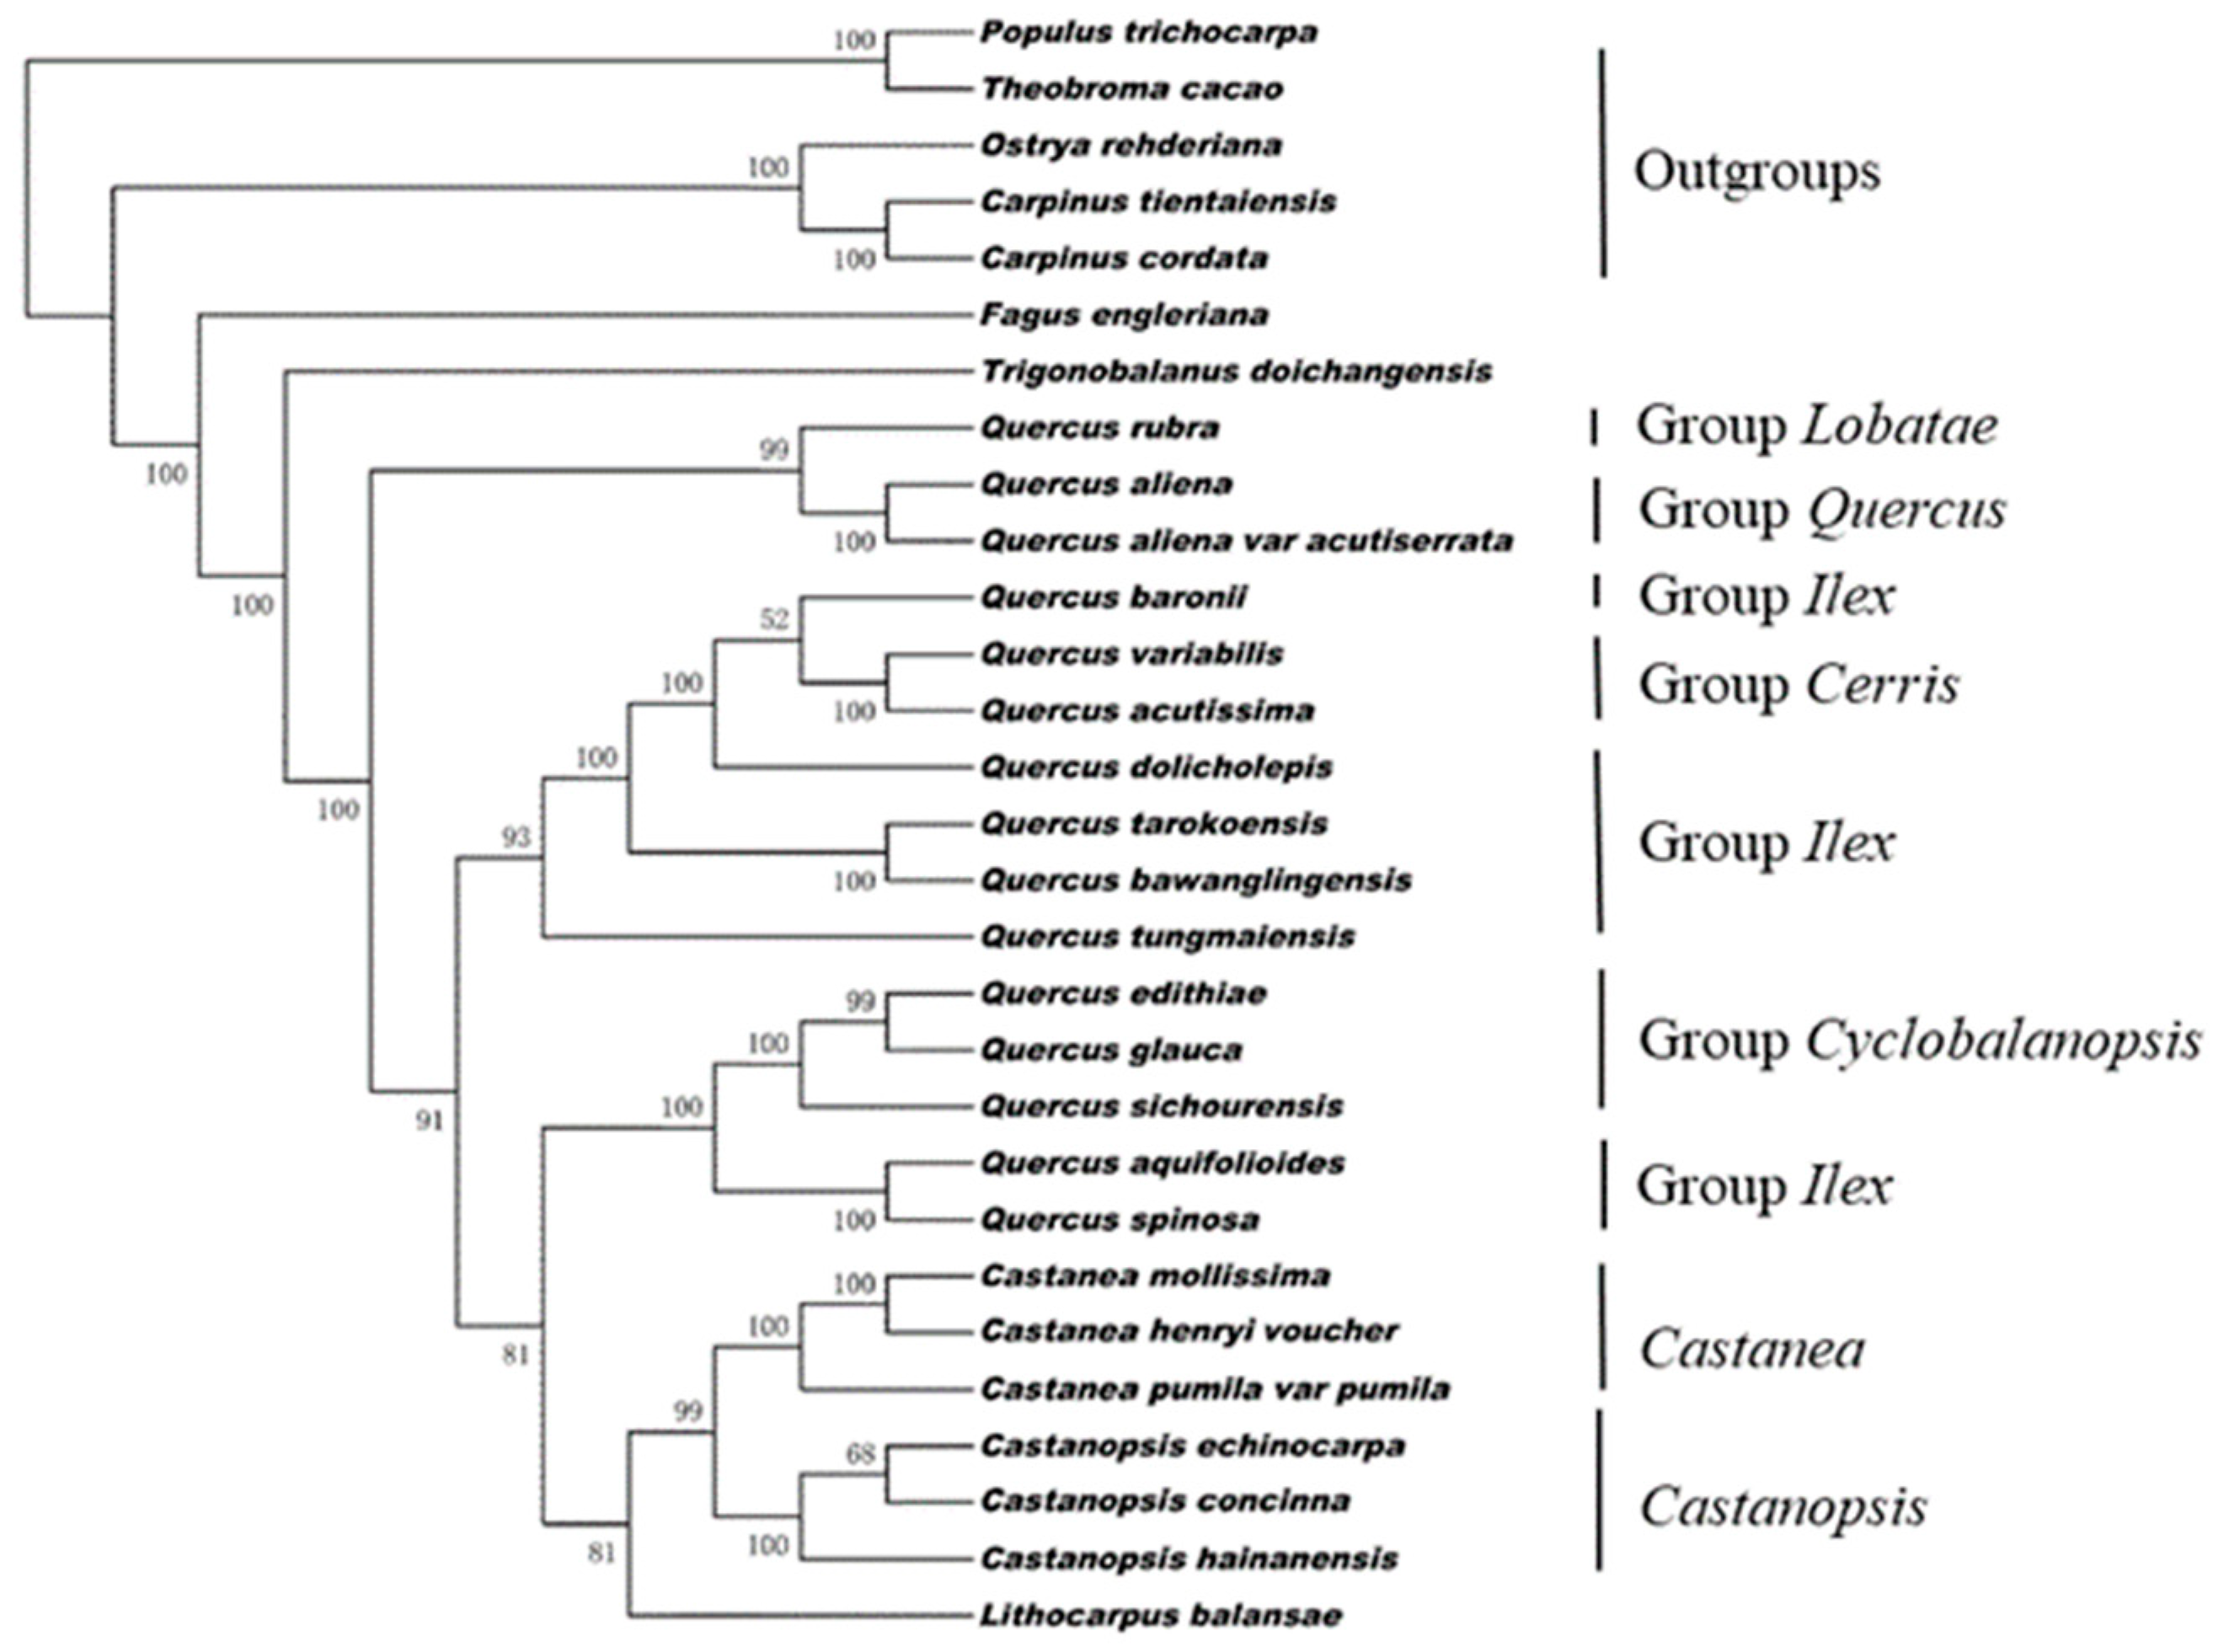
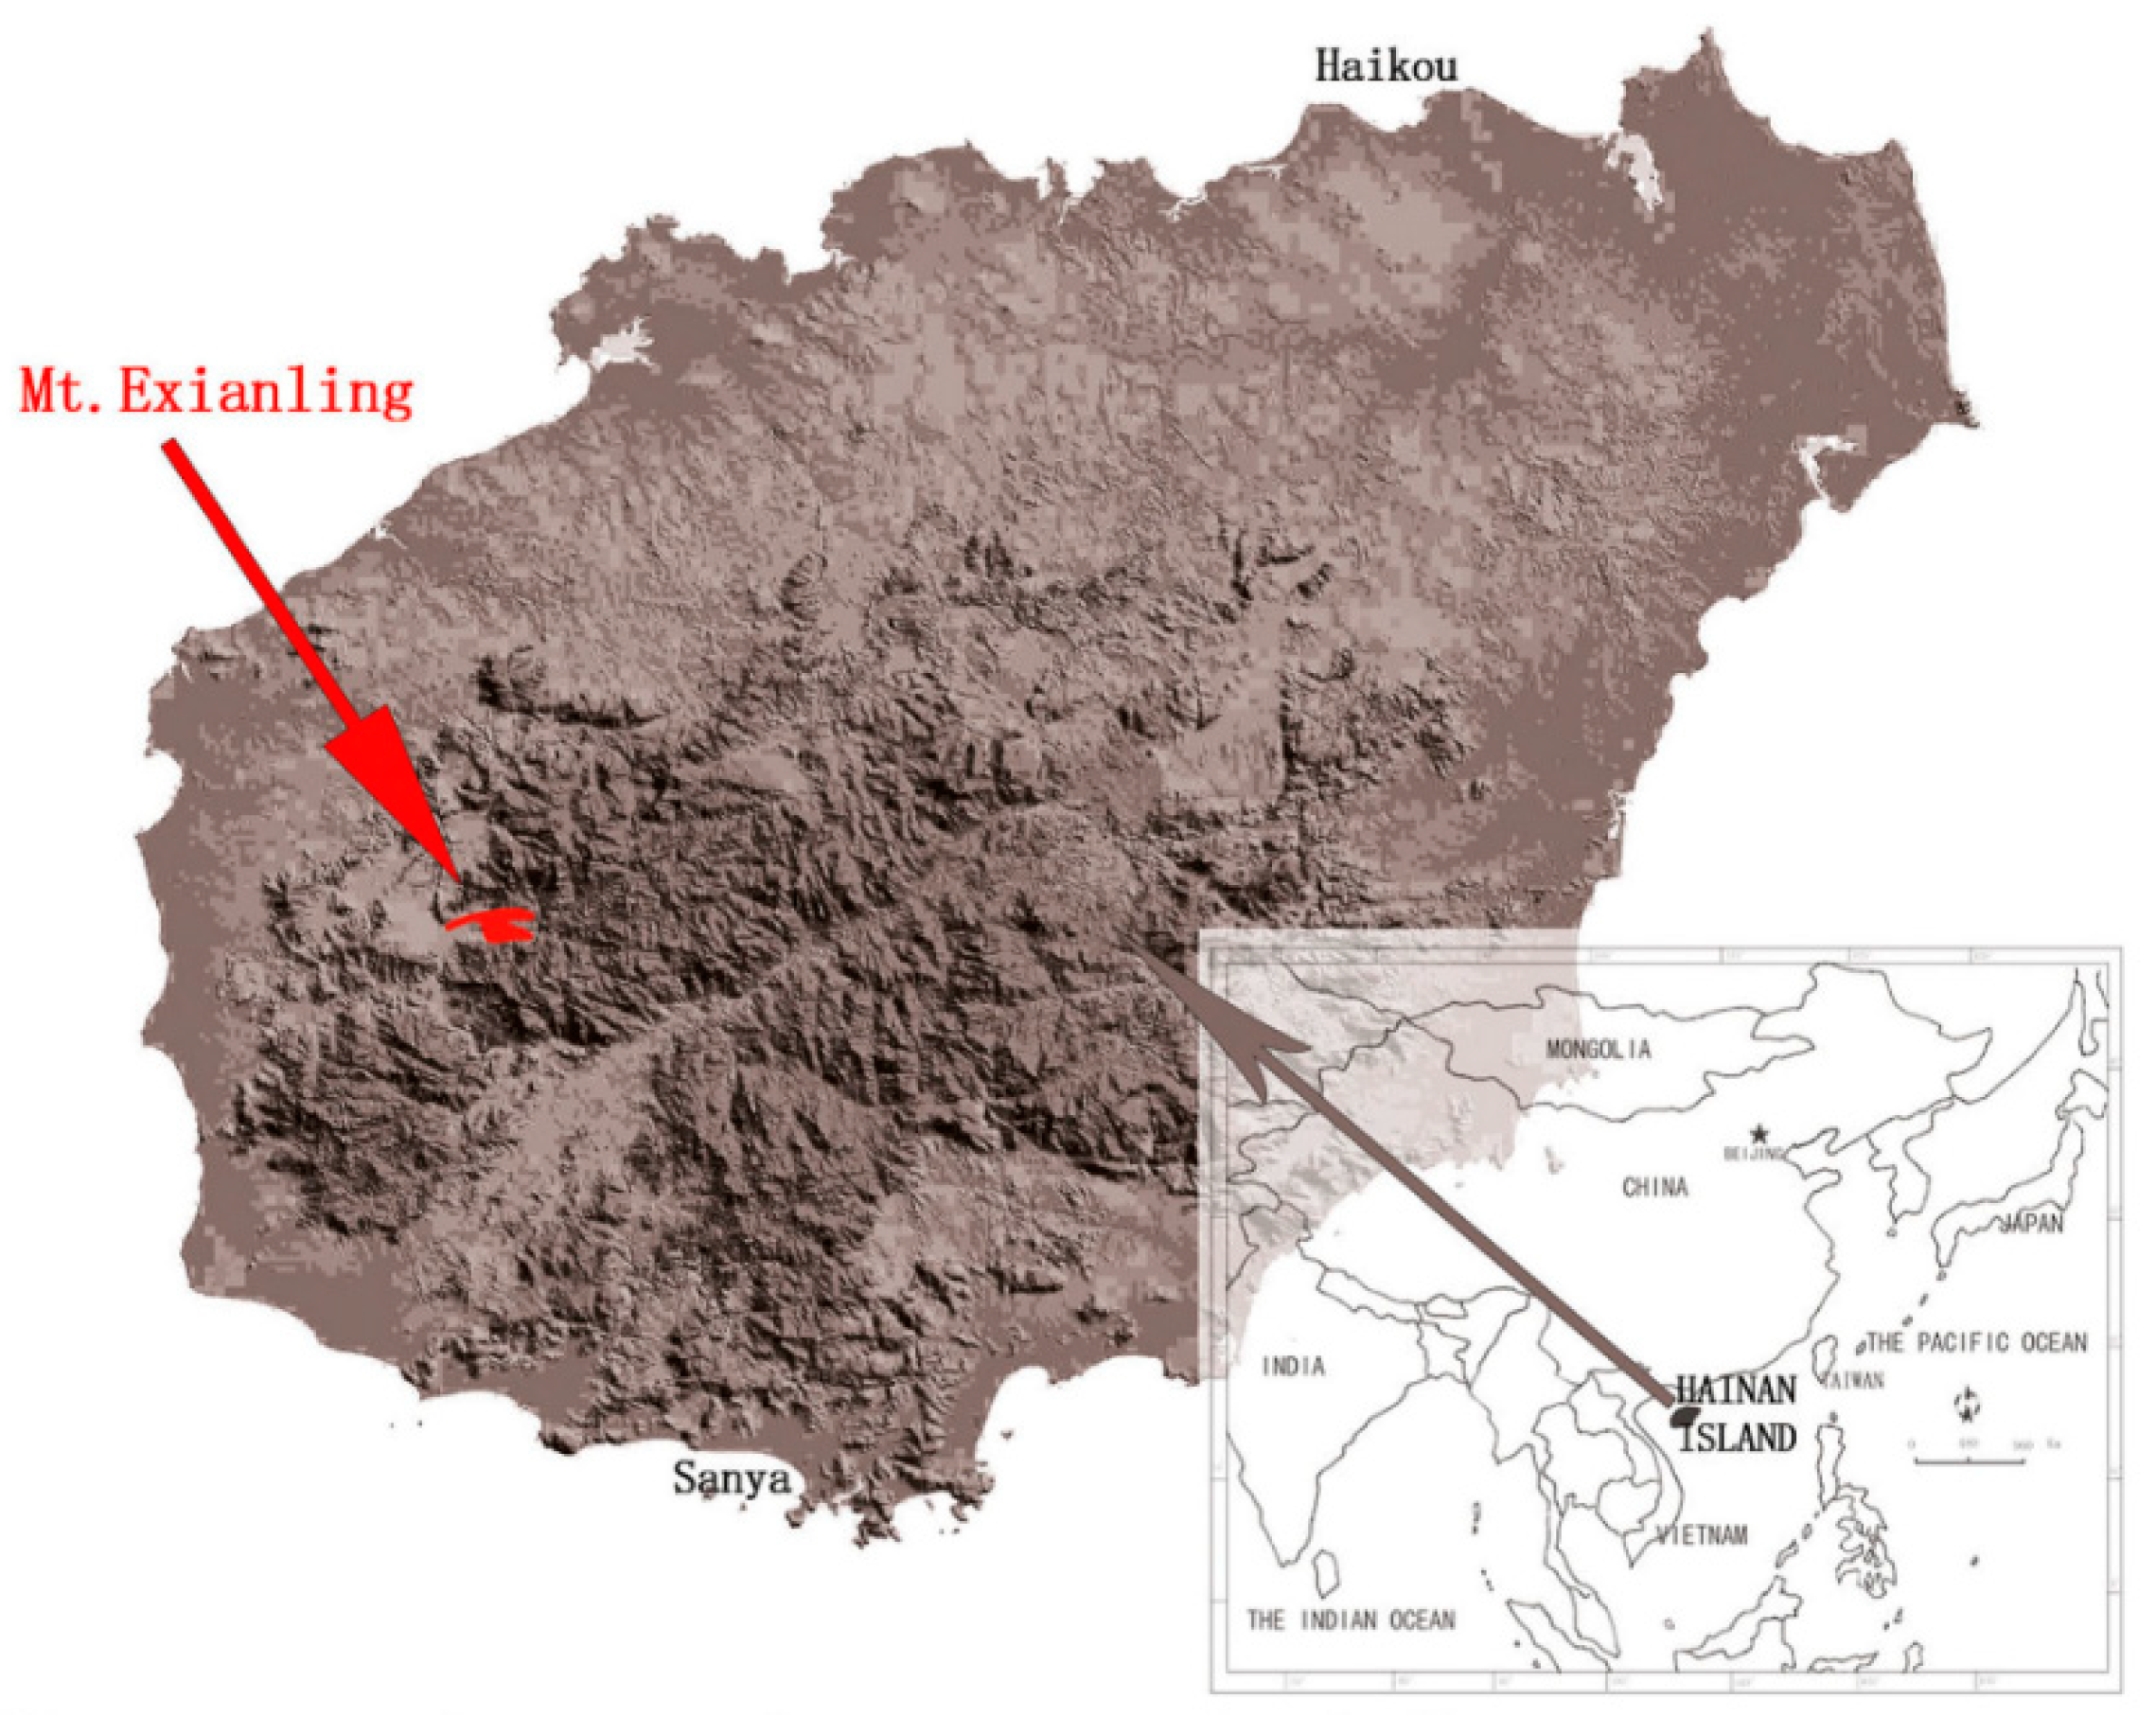
Abstract
Quercus bawanglingensis Huang, Li et Xing, an endemic evergreen oak of the genus Quercus (Fagaceae) in China, is currently listed in the Red List of Chinese Plants as a vulnerable (VU) plant. No chloroplast (cp) genome information is currently available for Q. bawanglingensis, which would be essential for the establishment of guidelines for its conservation and breeding. In the present study, the cp genome of Q. bawanglingensis was sequenced and assembled into double-stranded circular DNA with a length of 161,394 bp. Two inverted repeats (IRs) with a total of 51,730 bp were identified, and the rest of the sequence was separated into two single-copy regions, namely, a large single-copy (LSC) region (90,628 bp) and a small single-copy (SSC) region (19,036 bp). The genome of Q. bawanglingensis contains 134 genes (86 protein-coding genes, 40 tRNAs and eight rRNAs). More forward (29) than inverted long repeats (21) are distributed in the cp genome. A simple sequence repeat (SSR) analysis showed that the genome contains 82 SSR loci, involving 84.15% A/T mononucleotides. Sequence comparisons among the nine complete cp genomes, including the genomes of Q. bawanglingensis, Q. tarokoensis Hayata (NC036370), Q. aliena var. acutiserrata Maxim. ex Wenz. (KU240009), Q. baronii Skan (KT963087), Q. aquifolioides Rehd. et Wils. (KX911971), Q. variabilis Bl. (KU240009), Fagus engleriana Seem. (KX852398), Lithocarpus balansae (Drake) A. Camus (KP299291) and Castanea mollissima Bl. (HQ336406), demonstrated that the diversity of SC regions was higher than that of IR regions, which might facilitate identification of the relationships within this extremely complex family. A phylogenetic analysis showed that Fagus engleriana and Trigonobalanus doichangensis form the basis of the produced evolutionary tree. Q. bawanglingensis and Q. tarokoensis, which belong to the group Ilex, share the closest relationship. The analysis of the cp genome of Q. bawanglingensis provides crucial genetic information for further studies of this vulnerable species and the taxonomy, phylogenetics and evolution of Quercus.
1. Introduction
The cp genomes of most gymnosperms are uniparentally paternally inherited, whereas the majority of angiosperms are uniparentally maternally inherited [1]. In most angiosperms, the cp genomes, which encode approximately 130 genes and range from 76 to 217 kb [2,3], are typical double-stranded circular DNA composed of four regions containing two copies of inverted repeats (IRa and IRb) and two single-copy regions (LSC and SSC) [4,5]. Due to its uniparental inheritance, highly conserved structure, general lack of recombination and small effective population size, the analysis of cp DNA has been deemed a useful method for evolution research and the exploration of plant systematics [6,7,8,9]. In fact, the availability of sufficient data on cp genomes is crucial for phylogenetic relationship reconstruction, i.e., the assessment of relationships within angiosperms [10,11,12], the identification of members of Pinaceae [13] and Pinus [14], and adequate comparisons, i.e., cp genomes from sister species [15] and possibly multiple individuals [16]. At present, approximately 3000 plastid genomes of Eukaryota are shareable in the National Center for Biotechnology Information database (NCBI; Available online: https://www.ncbi.nlm.nih.gov/genomes/GenomesGroup.cgi?opt=plastid&taxid=2759&sort=Genome) due to improvements in sequencing technologies. In addition, molecular genetic methodologies based on nuclear and organellar genomes are crucial for conservation studies [17], particularly the conservation of threatened species for which there is scarce information on the genetic variation among populations [18]. Comprehensive analysis of both cpDNA and nDNA sequences could provide supplementary and often contrasting information on the genetic diversity among populations [17,19,20,21], which could be used to explore the causes of species threats and for the formulation of appropriate conservation measures. In addition, the DNA barcode has broad applications for rapid and accurate species identification [22]. Although the design of universal primers for single-copy nuclear sequences related to species boundaries is difficult, these nuclear primers might also be used for species discrimination in the future [23]. Barcodes based on whole plastid analyses that show interspecific discrepancies are expected to yield more information at the species and population levels for species identification to reveal new species and aid in biodiversity surveys and thus offer useful conservation strategies [24,25].
Oaks (Quercus L., Fagaceae) encompass approximately 500 species that are located throughout the northern hemisphere, although they mainly thrive in northern South America and Indonesia [26,27] and are dominant, diverse angiosperm plants due to their economical, ecological, religious and cultural benefits [28]. In biology research, oaks are widely used for both hybridization and introgression. Oaks were originally formalized as belonging to the subgenera Cyclobalanopsis and Quercus based entirely on their morphological characteristics [27,29], and the shift from a morphology- to a molecular-based classification changed the classification of oaks to the following two major clades (each comprising three groups): a Palearctic-Indomalayan clade (group Ilex, group Cerris and group Cyclobalanopsis) and a predominantly Nearctic clade (group Protobalanus, group Lobatae and group Quercus) [28]. Most recently, based on their morphology, molecular features, and evolutionary history, Quercus was split into two subgenera, Quercus and Cerris, and these subgenera include eight groups: for subgenus Quercus, group Protobalanus, group Ponticae, group Virentes, group Quercus and group Lobatae, and for subgenus Quercus, group Cyclobalanopsis, group Ilex, and group Cerris [30]. In subsequent studies, the main challenge in oak classification will be infrasectional classification. With the rapid development of sequencing technology, genomic databases are becoming increasingly vital for in-depth studies of plant phylogenetics [31,32]. However, due to the use of plastid and nuclear data, incongruent phylogenies have been observed in not only Quercus but also other genera [33,34,35]. In fact, high-resolution phylogenomic approaches can be used to assess the nuclear genome (e.g., RAD-sequencing) and likely provide even more highly important sources of information for phylogenetic and evolutionary studies, particularly in American oaks, such as Lobatae, Protobalanus and Quercus [36,37,38]. Plastid genomes are also important, because they can provide supplementary information that can be somewhat hidden in nuclear genomes (e.g., population–area relationships, ancient taxa histories and relationships) [38,39,40]. Hence, it is necessary to obtain preliminary cp genome data that can be used in future studies for species identification, for the assessment of relationships and eventual phenomena, such as reticulation, isolation, and introgression, and for establishing adequate conservation strategies.
Q. bawanglingensis is an endemic and vulnerable plant in China that is included in the Red List of Chinese Plants at the D2 VU level (the Red List of Chinese Plants. Available from: http://www.chinaplantredlist.org) [41] based on the following criteria: a decline in the area of occupancy (AOO) by <20 km² or in the number of locations by ≤5. Nevertheless, its genetic background and resources have not been widely studied. Deng et al. (2017) reported that Q. bawanglingensis, which belongs to the phylogenetic group Ilex Q. setulosa complex, was more related to Q. setulosa in terms of leaf epidermal features [42]. As recorded in the Flora of China (the Flora of China. Available from: http://foc.iplant.cn), Q. bawanglingensis is considered a distinct species related to Q. phillyreoides, but its genetic traits and taxonomic status are uncertain. Thus, a high-resolution and supported molecular phylogenetic tree is necessary. Obtaining cp genome information is necessary due to the lack of data on Q. bawanglingensis, and the importance and availability of information on the plastid genomes of oaks for detailed comparisons are increasing [40,43,44,45,46]. Polymorphic chloroplast microsatellite markers designed based on a cp genome analysis can be utilised to comprehend the levels and patterns of the geographical structure and genetic diversity of Q. bawanglingensis, and this information can subsequently be used formulate an effective protection strategy.
In this study, we first sequenced and described the complete cp genome of Q. bawanglingensis and performed a comparative analysis of the cp genomes of multiple Quercus species in order to (1) investigate the structural patterns of the whole chloroplast genome of Quercus species including the genome structure, gene order and gene content; (2) examine abundant simple sequence repeats (SSRs) and large repeat sequences in the whole cp genome of Q. bawanglingensis to provide markers for phylogenetic and genetic studies; and (3) construct a chloroplast phylogeny for Fagaceae species using their whole cp DNA sequences.
2. Materials and Methods
2.1. Chloroplast DNA Extraction, Illumina Sequencing, Assembly, Annotation and Sequence Analyses
A single individual of Q. bawanglingensis (height: 3.3 m, diameter at breast height (DBH): 7.8 cm) was used as a sampling object from Mount Exianling (109°06′, 35.88″E; 19°00′, 45.65″N) on Hainan Island (Figure A1) [47]. Hainan, a portion of the Indo-Burma Biodiversity Hotspot and the second largest island in China, is located at the northern edge of tropical Southeast Asia. Mount Exianling, the largest and the best-preserved tropical limestone rainforest on Hainan Island, is situated in the western area of this island [47]. The mount covers 2000 ha. and has an altitude from 100 to 1238 m. The island is characterised by a typical tropical monsoon and continental climate, with a rainy season (May to November) and a dry season (December to April of the following year). The annual average temperature is 24.5 °C, and the annual precipitation is 1647 mm.
Fresh leaves of the individual were collected and flash-frozen in liquid nitrogen and then stored in a refrigerator (−80 °C) until DNA extraction. DNA extraction was performed using the modified CTAB method [48]. DNA quality was assessed in a one drop spectrophotometer (OD-1000, Shanghai Cytoeasy Biotech Co., Ltd., Shanghai, China), and integrity was evaluated using 0.8% agarose gel. Sequencing was performed using an Illumina Hiseq4000 platform (Genepioneer Biotechnologies Co. Ltd., Nanjing, China) with PE250 based on Sequencing by Synthesis (SBS), with at least 5.74 GB of clean data obtained for Q. bawanglingensis. We then used FastQC v0.11.3 to trim the raw reads, and the cp-like reads were then extracted through a BLAST analysis between the trimmed reads and references (Q. tarokoensis and Q. tungmaiensis). We subsequently assembled the sequences with the cp-like reads using NOVOPlasty [49]. Genome annotation was performed using CPGAVAS [50], and the results were checked using DOGMA (DOGMA. Available from: http://dogma.ccbb.utexas.edu) and BLAST [51]. The tRNAs were identified by tRNAscan-SE [52], and we then mapped the entire genome using the OGDRAWv1.2 programme (OGDRAWv1.2. Available from: http://ogdraw.mpimp-golm.mpg.de) [53]. The cp genome sequences of Q. bawanglingensis have been deposited in GenBank (MK449426). SSRs and long repeats were determined using the MIcroSAtellite (MISA) identification tool (MISA. Available from: http://pgrc.ipk-gatersleben.de/misa/misa.html) [54] and REPuter (REPuter. Available from: https://bibiserv.Cebitec.uni-bielefeld.de/reputer) [55]. We also conducted various analyses of the guanine and cytosine (GC) content, codon usage, diversification in synonymous codon usage, and relative synonymous codon usage (RSCU) values.
2.2. Genome Comparison
Paired sequence alignment was performed using MUMmer [56]. mVISTA [57] was used to examine the genetic divergence among nine complete cp genomes, namely, those of Q. bawanglingensis, Q. tarokoensis (NC036370.1), Q. aliena var. acutiserrata (KU240008), Q. baronii (KT963087), Q. aquifolioides (KX911971), Q. variabilis (KU240009), Fagus engleriana (KX852398), Lithocarpus balansae (KP299291) and Castanea mollissima (HQ336406), in the Shuffle-LAGAN mode [58] with the genome of Q. tarokoensis as the reference genome. The cp genome sequences of Q. bawanglingensis, Q. tarokoensis, Q. aliena var. acutiserrata, Q. baronii, Q. aquifolioides and Q. variabilis were aligned using MAFFT v.5 [56], and a sliding window analysis was performed to detect the nucleotide diversity of the cp genomes using DnaSP v5 [59].
2.3. Phylogenetic Analysis
The phylogenetic analysis was performed using FastTree based on sequences from 29 taxa, namely, 24 Fagaceae species, three Betulaceae species and two outgroups (Populus trichocarpa and Theobroma cacao), all of which were downloaded from the NCBI except those of Q. bawanglingensis. MAFFT v.5 [56] was utilized to align the cp genomes of the 29 species. We also performed multiple sequence alignments manually using BioEdit [60] and reconstructed a maximum likelihood (ML) tree using FastTree version 2.1.10 [61].
3. Results
3.1. Features of the Chloroplast Genome of Q. bawanglingensis
In total, at least 5.74 GB of clean data was obtained for Q. bawanglingensis, and these data were assembled into a double-stranded circular DNA with a length of 161,394 bp (Figure 1 and Table 1). The total lengths of the LSC, SSC and IRs are 90,628, 19,036 and 51,730 bp, respectively, and the sequences encode 134 genes, including eight rRNA genes, 40 tRNA genes and 86 protein-coding genes (Table A1). Different sections exhibit different distributions of genes: eight rRNA genes, 14 tRNA genes and 13 protein-coding genes within IR regions; one tRNA gene and 12 protein-coding genes in the SSC region; and 25 tRNA genes and 61 protein-coding genes within the LSC region (Figure 1 and Table 1). Furthermore, the GC contents of the entire cp genome and the IR, SSC and LSC regions are 36.80%, 42.70%, 30.90% and 34.60%, respectively, which are equivalent to the values obtained for other species in this study (Table 1 and Table A1).
Figure 1.
Map of the chloroplast genome of Q. bawanglingensis. The genes in the clockwise direction fill the inner circle, and the outer circle contains genes in the counterclockwise direction. Different colours represent different genes in different functional groups. The lighter grey shows the A + T content, and the darker grey in the inner circle indicates the G + C content. The direction of the genes is denoted by the direction of the grey arrow.
Table 1.
Comparison of features of nine Fagaceae chloroplast genomes.
The results of the codon usage analysis are summarized in Table A2. Overall, these identified genes consist of 26,801 codons, and the most and least frequent amino acids in these codons are leucine (2828, 10.55%) and cysteine (308, 1.15%), respectively. The majority of the codons end in A- and U-.
The statistics of exons and introns are provided in Table A3 and Table A4. The sequence contains 23 intron-containing genes, including clpP and ycf3, comprising two introns; in addition, ten of these intron-containing genes are located in LSC regions, and only ndhA is found in the SSC region. The longest intron (2511 bp) is found in turnK-UUU, and the smallest intron (483 bp) is located in trnL-UAA.
3.2. Analysis of Long Repeats and SSRs
The long-repeat analysis of the Q. bawanglingensis cp genome revealed that the genome contains eight more forward long repeats than inverted long repeats (21) (Table A5). The majority of the repeats are located in the LSC region (40), followed by the SSC region (12) and IRs (8). Moreover, a large proportion of repeats are located in intergenic regions (34, 68%), most of which are distributed in the LCS region, and the minority are found in the trnS-GCU, trnS-UGA, trnG-GCC (exon), trnG-GCC, psaB, psaA, clpP, rpl2, ndhF, ndhI, ndhA (intron), ycf1, trnV-UAC, trnA-UGC and rpl2 genes. Significantly, a longer repeat was not found in the Q. bawanglingensis cp genome, whose repeats range from 18 to 31 bp.
Based on the SSR polymorphism results, we found 82 SSRs in the Q. bawanglingensis cp genome. Most of the SSRs are distributed in the LSC region (62, 75.61%), followed by the SSC region (16, 19.51%) and IRs (4, 4.88%), whereas 64 are located in intergenic spaces and 18 in genes, such as trnK-UUU, trnG-GC, atpF, rpoC2, rpoC1, rpoB, atpB, accD, clpP, petB, petD, ndhF, ndhD, ndhA and ycf1 (Table A6). Furthermore, rpoC1 and rpoC2 contain more SSR loci than the other genes. The cpSSRs in the cp genome generally consist of 69 mononucleotide SSRs (poly A or poly T), six dinucleotide SSRs and seven trinucleotide SSRs.
3.3. Comparison of Complete Chloroplast Genomes among Fagaceae Species
We performed a Blast analysis of the sequences from nine cp genomes using mVISTA, and the cp genome of Q. tarokoensis was used as the reference (Figure 2). The results showed that the entire genome is well conserved across all species with the exception of F. engleriana. The SCs have a substantially higher nucleotide diversity than the IRs, whereas more variation was found in the noncoding regions compared with the coding regions, consistent with the observations of the nucleotide variability (pi), which showed that the pi values of LSC, SSC and IRb are 0.004906, 0.007103 and 0.000729, respectively, among the six species (Q. bawanglingensis, Q. variabilis, Q. aliena var. acutiserrata, Q. aquifolioides, Q. baronii, and Q. tarokoensis); this information is graphically presented in Figure 3. Importantly, both the results from the mVISTA analysis and the assessment of nucleotide variability showed that numerous divergence hotspot regions, such as rbcL-accD (pi: 0.02365, 0.02317), accD (pi: 0.02365), trnS-trnG (pi: 0.01865, 0.01802), ycf1 (pi: 0.01643, 0.01627), trnG-trnR (pi: 0.0173), trnK-rps16 (pi: 0.01627), ndhF (pi: 0.01619) and trnH-psbA (pi:0.01548), are completely located within the SC regions (Figure 2, Figure 3 and Figure 4). In addition, more variable sites are located in intergenic regions than in coding genes, which allows the potential development of DNA barcodes for species identification and taxonomical studies of the genus Quercus.
Figure 2.
Sequence identity plots of the nine Fagaceae cp genomes generated by mVISTA, with the Q. tarokoensis genome as the reference. The vertical and horizontal axes in the figure represent the consistency degree of the sequences from 50% to 100% and the sequence length, respectively. Annotated genes are displayed along the top.
Figure 3.
Nucleotide variability (pi) values. X-axis: position of the midpoint of a window. Y-axis: nucleotide diversity of each window.
Figure 4.
Comparison of the cp genomes from four Fagaceae species. The outer two rings pointing in different directions show the coding sequence (CDS), rRNA genes, and tRNA genes. The three inner circles show the blast results for Q. bawanglingensis vs. L. balansae, Quercus tarokoensis and Q. variabilis, respectively. GC skew+ (in a green colour) means G > C, whereas GC skew- (in a purple colour) indicates G < C.
The IRs are extremely conserved in Quercus (Figure 5), consistent with the observations shown in Figure 2, Figure 3 and Figure 4 but are slightly different from the others investigated in this study. The rps19 gene is located within the LSC, 10 bp from the border of the LSC/IRb, in all species with the exception of C. mollissima (0 bp), and this gene is also found 16 bp between the trnH gene in the LSC and the IRA/LSC border in all species except C. mollissima, in which the gene is found at a distance of 8 bp. At the boundary of the LSC/IRb, the rpl2 gene is located 62 bp from the LSC, whereas shorter distances were found in C. mollissima (67 bp) and F. engleriana (65 bp). In Quercus species, the boundary of the LSC/IRs is highly conserved, whereas the borders of IRs/SSC are highly variable. The IRs/SSC borders are generally located in the varied sites of the ycf1 and ndhF genes. The junctions of SSC/IRa located in ycf1 within the SSC and IRa regions vary in length (Q. bawanglingensis: 4653 and 1038 bp; Q. tarokoensis: 4625 and 1064 bp; Q. aliena var. acutiserrata: 4615 and 1043 bp; Q. variabilis: 4620 and 1041 bp; Q. baronii: 4611 and 1047 bp; Q. aquifolioides: 4513 and 1057 bp; C. mollissima: 4623 and 1059 bp; L. balansae: 4626 and 828 bp; and F. engleriana: 4633 and 1049 bp). The ndhF gene relevant for photosynthesis was found to be located at 1 to 159 bp from the IRb/SSC junction.
Figure 5.
Comparison of the borders for the LSC and SSC regions and IRs among the nine Fagaceae cp genomes.
3.4. Phylogenetic Analysis
With P. trichocarpa and T. cacao as the outgroups, a phylogenetic tree was generated using ML based on the above-described whole-cp genome data (Figure 6). The phylogenetic results resolved 29 nodes with bootstrap support values of 52–100, which generally strongly supports the hypothesis that the Fagaceae species form a single clade. F. engleriana is located at the top node as a sister to T. doichangensis with high support, whereas L. balansae and Castanopsis species closely related to group Cyclobalanopsis are split into Quercus. The clade formed by Quercus indubitably involves group Quercus, whereas group Ilex is both separately clustered with group Cyclobalanopsis, and Cerris. Q. bawanglingensis is located in one clade that includes several evergreen oaks. The phylogenetic tree also revealed that Q. bawanglingensis is a sister to Q. tarokoensis with a 100% bootstrap value.
Figure 6.
Maximum likelihood (ML) phylogenetic tree of 29 species of Fagaceae constructed using their chloroplast genomes. Populus trichocarpa and Theobroma cacao were used as the outgroups.
4. Discussion
In general, the complete cp genome of Q. bawanglingensis has a strong resemblance to those of other Quercus species in the aspects of genome size and structure, GC content, genes and gene order, which illustrates that the cp genomes are conserved in Quercus [43,44,45,62,63]. Nonetheless, changes in the border of LSC/IRb and the nucleotide variability were detected, which are relatively common in plants [15,46,64]. The maximum difference in genome size among the nine Fagaceae species is 3055 bp, whereas the largest difference in the LSC region is 2981 bp, which could indicate that the divergence in the LSC length leads to variation in the size of the cp genomes based on IR contraction or expansion [31]. Differences in the four IR boundaries among species frequently appear during the process of cp genome evolution, which leads to further changes in the cp genome size. Hence, IR regions are used to explain size differences between cp genomes due to their contraction and expansion at the borders, even though they are the most conserved regions in cp genome sequences [64,65,66,67].
Higher nucleotide diversity has been found in SCs compared with IRs and in noncoding regions compared with coding regions, which is in accordance with the results found for other taxa [43,44,45,63,68], although exceptions have been identified [32,69]. A cp genome has a copy-dependent repair mechanism that ensures the uniformity and stability of two IR regions in sequence and enhances the stability and conservation of the genome [70,71], which might explain the lower sequence divergence in the IRs compared with the LSC or SSC regions, because natural selection coding regions are more conserved than non-coding regions [72]. In our study, both the results from the mVISTA analysis and the nucleotide variability (pi) assessment showed that numerous divergence hotspot regions are primarily situated in the SCs of the cp genome and that more variable sites are located in intergenic regions than in coding genes, and these can be directly utilized for the development of new molecular markers for research on Quercus species identification and taxonomy. Among these divergence hotspot regions, trnH-psbA has already been selected as a suitable barcode for plants [40,73], as have rbcL-accD, trnS-trnG [74], ndhF [40,75], ycf1 [69,76], accD [67,77], trnG-trnR [78] and trnK-rps16 [79]. In this study, the ycf1, ndhF and accD genes were found to be optimal genetic markers based on their high substitution variability, repeat sequence diversity and SSC/IR junction length variability. The accD gene, which encodes the acetyl-CoA carboxylase (ACCase) enzyme, is crucial for maintenance of the plastid compartment and for leaf development in tobacco [67] and might be considered a locus for obtaining insights into chloroplast genome evolution [77] in Quercus. As a NADH dehydrogenase gene, ndhF is favoured by studies on the evolution of plant taxonomy [79,80,81]. The ycf1 gene, which has the largest open reading frame, is crucial for the protein translocons at the inner envelope membranes in Chloroplasts (TIC) complex, which related to plant survival, due to Tic214/Tic20, which provides access of cps to exotic proteins [82]. The ycf1 gene is also important for examining the diversification of the cp genome in algae or other plants [83]. Further research is necessary for examining whether these divergence hotspot regions could be used for assessing the taxonomic evolution of Quercus or could be considered candidate DNA barcodes.
The observed GC content is generally consistent with the results of previous intensive studies [3,84,85,86,87], which confirms that the cp genome of Fagaceae species is rich in adenine and thymine (AT). GC skewness is considered an indicator of replication terminals, replication origin, lag chains and DNA lead chains [88,89,90] as well as a dominant factor in codon bias. Several studies [3,84,87,91] have suggested that high AT richness is the major reason for synonymous codons ending in A/U. This phenomenon might be subordinate to natural selection and mutation during the process of evolution.
cpSSRs, which are typical uniparentally inherited material, have been used extensively in analyses of taxonomic status, phylogenetic relationships, the maternal structure of the community, diversity and differentiation [92,93,94]. SSR polymorphisms result from a mutational mechanism in which SSRs with a length of at least 10 bp appear as slipped-strand mispairings [95]. We found 82 SSRs in the Q. bawanglingensis cp genome that were mostly distributed in the LSC (62, 75.61%) and intergenic spaces (64, 78.04%). Efficient molecular markers might be selected by using auxiliary information from the uneven distribution of cpSSRs for phylogenetic and phylogeographical studies [38,96,97]. In addition, the majority of cpSSRs in the Q. bawanglingensis cp genome mononucleotides and dinucleotides are formed by A and T, which might be related to the high AT richness in the nucleotide composition, similar to the results found for other cp genomes [39,43,46,98].
Previous studies on the origin time of Fagaceae have shown that fossils of T. doichangensis were the first to appear in the fossil record and that Cyclobalanopsis is closer than Quercus to the ancestral group in Fagaceae [99]. Based on the phylogenetic trees, F. engleriana and T. doichangensis are located in the basal phylogeny, and the evolutionary tree is consistent with the fossil record [99]. Q. bawanglingensis and Q. tarokoensis have a close relationship, and in accordance with their morphological features, both of these species belong to section Engleriana in group Ilex [73,100]. Importantly, the Quercus species were not shown to form a clade, similar to the findings in other research [44,45,46]. Group Ilex within group Cerris forms a Cerris-Ilex clade, which is identified by inferences from primarily chloroplast haplotypes between group Cerris and its sister group, Ilex [39]. A group comprising Heterobalanus (corresponding to group Ilex) and Cyclobalanopsis matches the traditional taxonomy, which formalized both Cyclobalanopsis and Ilex as one lineage [101]. Overall, the relationships among the other branches in Fagaceae are mostly consistent with those inferred from nuclear data [33,102].
5. Conclusions
In the present study, we successfully completed the whole cp genome for the vulnerable oak tree Q. bawanglingensis using next generation sequencing technology. In comparing the Q. bawanglingensis cp genome with prior Quercue species from NCBI, we found that it was very similar in cp genome structure and gene content. Nevertheless, obviously heterogeneous sequence divergences were revealed in different regions among Quercus cp genomes. The divergence hotspot regions and abundant SSRs identified in the cp genome could be used for molecular marker development for further population genetics studies on whether and how natural populations have adapted to their local environments, to predict their responses to future habitat alterations and to establish adequate conservation strategies for this vulnerable species. The phylogenetic relationships of Q. bawanglingensis in Fagaceae were robustly resolved based on the cp genome data, strongly supporting the sister relationship between Q. bawanglingensis and Q. tarokoensis in the group Ilex lineage. Overall, the data obtained will contribute to further studies on the diversity, ecology, taxonomy, phylogenetic evolution and conservation of Chinese Quercus species.
Author Contributions
The experiments were conceived and designed by Z.-P.J. and J.-F.L.; X.L., E.-M.C., Y.-N.H., Y.W., and N.Y. were involved in the collection of the study materials. X.L. and E.-M.C. participated in the DNA extraction and data analyses. X.L. wrote and J.-F.L. revised the manuscript. All authors read and approved the final manuscript.
Funding
This study was funded by the Fundamental Research Funds for the Central Non-Profit Research Institution of CAF (CAFYBB2018ZB001).
Acknowledgments
The authors sincerely thank Mingzhi Li of Genepioneer Biotechnologies Co. Ltd., Nanjing, China for the assistance provided with this study. In addition, the authors sincerely thank the reviewers for their careful reading and helpful comments on this manuscript.
Conflicts of Interest
The authors declare no conflict of interest.
Appendix A
Figure A1.
Location of Mt. Exianling, Hainan Island, China.
Table A1.
Base composition of the Q. bawanglingensis chloroplast genome.
Table A1.
Base composition of the Q. bawanglingensis chloroplast genome.
| Region | CDS | tRNA Genes | rRNA Genes | A (%) | T (U) (%) | C (%) | G (%) | G + C (%) |
|---|---|---|---|---|---|---|---|---|
| LSC | 61 | 25 | 32.00 | 33.40 | 17.70 | 16.90 | 34.60 | |
| SSC | 12 | 1 | 34.40 | 34.70 | 16.30 | 14.60 | 30.90 | |
| IRs | 13 | 14 | 8 | 28.60 | 28.60 | 21.40 | 21.40 | 42.70 |
| Total | 86 | 40 | 8 | 31.20 | 32.00 | 18.70 | 18.10 | 36.80 |
Table A2.
Detailed statistics on codon usage, diversification in synonymous codon usage, relative synonymous codon usage (RSCU) values and codon-anticodon recognition patterns of the Q. bawanglingensis chloroplast genome.
Table A2.
Detailed statistics on codon usage, diversification in synonymous codon usage, relative synonymous codon usage (RSCU) values and codon-anticodon recognition patterns of the Q. bawanglingensis chloroplast genome.
| Amino Acid | Codon | No. | RSCU | tRNA | Amino Acid | Codon | No. | RSCU | tRNA |
|---|---|---|---|---|---|---|---|---|---|
| Phe | UUU | 986 | 1.29 | Glu | GAG | 354 | 0.5 | ||
| Phe | UUC | 537 | 0.71 | trnF-GAA | Ser | UCU | 559 | 1.66 | |
| Leu | UUA | 896 | 1.9 | trnL-UAA | Ser | UCC | 350 | 1.04 | Trns-GGA |
| Leu | UUG | 570 | 1.21 | trnL-CAA | Ser | UCA | 404 | 1.20 | trnS-UGA |
| Leu | CUU | 590 | 1.25 | Ser | UCG | 192 | 0.57 | ||
| Leu | CUC | 203 | 0.43 | Ser | AGU | 394 | 1.17 | ||
| Leu | CUA | 373 | 0.79 | trnL-UAG | Ser | AGC | 127 | 0.38 | trnS-GCU |
| Leu | CUG | 196 | 0.42 | Pro | CCU | 408 | 1.47 | ||
| Ile | AUU | 1137 | 1.45 | Pro | CCC | 225 | 0.81 | trnP-GGG | |
| Ile | AUC | 455 | 0.58 | trnI-GAU | Pro | CCA | 313 | 1.13 | trnP-UGG |
| Ile | AUA | 758 | 0.97 | Pro | CCG | 163 | 0.59 | ||
| Met | AUG | 618 | 1.00 | trnM-CAU trnI-CAU | Thr | ACU | 535 | 1.59 | |
| Val | GUU | 509 | 1.42 | Thr | ACC | 247 | 0.73 | ||
| Val | GUC | 180 | 0.50 | trnV-GAC | Thr | ACA | 403 | 1.20 | trnT-UGU |
| Val | GUA | 545 | 1.52 | trnV-UAC | Thr | ACG | 162 | 0.48 | |
| Val | GUG | 204 | 0.57 | Ala | GCU | 632 | 1.80 | ||
| Tyr | UAU | 798 | 1.58 | Ala | GCC | 221 | 0.63 | ||
| Tyr | UAC | 212 | 0.42 | trnY-GUA | Ala | GCA | 384 | 1.09 | trnA-UGC |
| Ter | UAA | 47 | 1.64 | Ala | GCG | 169 | 0.48 | ||
| Ter | UAG | 21 | 0.73 | Cys | UGU | 222 | 1.44 | ||
| Ter | UGA | 18 | 0.63 | Cys | UGC | 86 | 0.56 | trnC-GCA | |
| His | CAU | 486 | 1.54 | Try | UGG | 463 | 1.00 | trnW-CCA | |
| His | CAC | 146 | 0.46 | trnH-GUG | Arg | CGU | 336 | 1.25 | |
| Gln | CAA | 735 | 1.55 | trnQ-UUG | Arg | CGC | 109 | 0.41 | |
| Gln | CAG | 215 | 0.45 | Arg | CGA | 354 | 1.32 | trnR-ACG | |
| Asn | AAU | 1012 | 1.54 | Arg | CGG | 122 | 0.45 | ||
| Asn | AAC | 302 | 0.46 | Arg | AGA | 505 | 1.88 | trnR-UCU | |
| Lys | AAA | 1070 | 1.47 | Arg | AGG | 186 | 0.69 | ||
| Lys | AAC | 383 | 0.53 | trnN-GUU | Gly | GGU | 582 | 1.28 | |
| Asp | GAU | 872 | 1.61 | Gly | GGC | 208 | 0.46 | trnG-GCC | |
| Asp | GAC | 208 | 0.39 | trnD-GUC | Gly | GGA | 707 | 1.55 | trnG-CCC |
| Glu | GAA | 1069 | 1.5 | trnE-UUC | Gly | GGG | 328 | 0.72 |
Table A3.
List of annotated genes in the Q. bawanglingensis chloroplast genome.
Table A3.
List of annotated genes in the Q. bawanglingensis chloroplast genome.
| Category for Genes | Group of Gene | Name of Gene |
|---|---|---|
| Photosynthesis related genes | Photosystem I | psaA, psaB, psaC, psaI, psaJ, |
| Photosystem II | psbA, psbB, psbC, psbD, psbE, psbF, psbH, psbI, psbJ, psbK, psbL, psbM, psbN, psbT, psbZ | |
| Cytochrome b/f complex | petA, petB1, petD1, petL, petG, petN | |
| ATP synthase | atpA, atpB, atpE, atpF1, atPH, atpI | |
| Cytochrome c synthesis | ccsA | |
| Assembly/stability of photosystem | ycf32, ycf4 | |
| NADPH dehydrogenase | ndhA1, ndhB1d, ndhC, ndhD, ndhE, ndhF, ndhG, ndhH, ndhI, ndhJ, ndhK | |
| Rubisco | rbcL | |
| Transcription and translation related genes | Transcription | rpoC11, rpoC2, rpoA, rpoB |
| Ribosomal proteins | rps2, rps3, rps4, rps7d, rps8, rps11, rps12d, rps14, rps15, rps161, rps18, rps19, | |
| Large subunit | rpl21, rpl14, rpl161, rpl20, rpl22, rpl23d, rpl32, rpl33, rpl36 | |
| RNA genes | Ribosomal RNA | 4.5S rRNAd, 5S rRNAd, 16S rRNAd, 23S rRNA d |
| Transfer RNA | trnH-GUG, trnK-UUU1, trnQ-UUG, trnS-GCU, trnG-GCC1, trnR-UCU, trnC-GCA, trnD-GUC, trnY-GUA, trnE-UUC, trnT-GGUd, trnM-CAU, trnS-UGA, trnG-UCC, trnfM-CAU, trnS-GGA, trnT-UGU, trnL-UAA1, trnF-GAA, trnV-UAC1, trnW-CCA, trnP-UGG, trnP-GGG, trnL-CAAd, trnV-GACd, trnI-GAU1d , trnR-ACGd, trnL-UAG, trnN-GUUd , trnA-UGC1d , trnI-CAUd | |
| Other genes | RNA processing | matK |
| Carbon metabolism | cemA | |
| Fatty acid synthesis | accD | |
| Proteolysis | clpP2 | |
| Translational initiation factor | infA | |
| Genes of unknown function | Conserved reading frames | ycf1d, ycf2 d |
1, genes containing only one intron; 2, genes containing two introns; d, two gene copies in the IRs.
Table A4.
The lengths of introns and exons in genes in the Q. bawanglingensis chloroplast genome.
Table A4.
The lengths of introns and exons in genes in the Q. bawanglingensis chloroplast genome.
| Gene | Strands | Location | Exon1 (bp) | Exon2 (bp) | Intron1 (bp) | Exon3 (bp) | Intron2 (bp) |
|---|---|---|---|---|---|---|---|
| trnK-UUU | – | LSC | 37 | 35 | 2511 | ||
| trnI-GAU | + | IRA | 37 | 35 | 955 | ||
| trnI-GAU | - | IRB | 42 | 35 | 950 | ||
| trnA-UGC | + | IRA | 38 | 35 | 800 | ||
| trnA-UGC | IRB | 38 | 35 | 800 | |||
| trnG-GCC | + | IRA | 23 | 37 | 736 | ||
| trnV-UAC | - | LSC | 38 | 35 | 630 | ||
| trnL-UAA | + | LSC | 35 | 50 | 483 | ||
| rps12 | + | IRB | 232 | 536 | 26 | ||
| rps12 | - | IRA | 231 | 537 | 30 | ||
| rpoC1 | - | LSC | 432 | 1626 | 833 | ||
| ndhB | + | IRB | 777 | 756 | 680 | ||
| ndhB | - | IRA | 777 | 756 | 680 | ||
| ndhA | - | SSC | 552 | 540 | 1037 | ||
| clpP | - | LSC | 69 | 294 | 862 | 228 | 653 |
| ycf3 | - | LSC | 126 | 228 | 721 | 153 | 768 |
| rpl16 | - | LSC | 9 | 399 | 1102 | ||
| rpl2 | - | IRA | 390 | 471 | 648 | ||
| rpl2 | + | IRB | 393 | 471 | 645 | ||
| petB | + | LSC | 6 | 642 | 843 | ||
| atpF | - | IRB | 144 | 411 | 770 | ||
| rps16 | - | LSC | 42 | 228 | 899 | ||
| petD | + | LSC | 9 | 474 | 640 |
Table A5.
Repeated sequences of the Q. bawanglingensis chloroplast genome.
Table A5.
Repeated sequences of the Q. bawanglingensis chloroplast genome.
| ID | Size (bp) | Repeat Start I | Type | Size (bp) | Repeat Start 2 | Mismatch (bp) | E-Value | Region | Gene |
|---|---|---|---|---|---|---|---|---|---|
| 1 | 18 | 325 | F | 18 | 4926 | 0 | 1.07 × 10⁻¹ | LSC | |
| 2 | 21 | 6821 | R | 21 | 6821 | 0 | 1.67 × 10⁻³ | LSC | |
| 3 | 19 | 6835 | R | 19 | 6835 | 0 | 2.67 × 10⁻² | LSC | |
| 4 | 18 | 7431 | R | 18 | 7431 | 0 | 1.07 × 10⁻¹ | LSC | |
| 5 | 18 | 8884 | R | 18 | 8884 | 0 | 1.07 × 10⁻¹ | LSC | |
| 6 | 18 | 9988 | R | 18 | 9988 | 0 | 1.07 × 10⁻¹ | LSC | |
| 7 | 31 | 11,852 | R | 31 | 11,852 | 0 | 1.59 × 10⁻⁹ | LSC | |
| 8 | 22 | 30,370 | F | 22 | 30,388 | 0 | 4.16 × 10⁻⁴ | LSC | |
| 9 | 20 | 10,290 | F | 20 | 31,747 | 0 | 6.66 × 10⁻³ | LSC | |
| 10 | 19 | 8557 | R | 19 | 35,014 | 0 | 2.67 × 10⁻² | LSC | |
| 11 | 20 | 4925 | F | 20 | 36,722 | 0 | 6.66 × 10⁻³ | LSC | |
| 12 | 18 | 325 | F | 18 | 36,723 | 0 | 1.07 × 10⁻¹ | LSC | |
| 13 | 21 | 9531 | F | 21 | 40,098 | 0 | 1.67 × 10⁻³ | LSC | trnS-GCU, trnS-UGA |
| 14 | 20 | 40,206 | R | 20 | 40,206 | 0 | 6.66 × 10⁻³ | LSC | |
| 15 | 22 | 11,376 | F | 22 | 41,438 | 0 | 4.16 × 10⁻⁴ | LSC | trnG-GCC (exon), trnG-GCC |
| 16 | 18 | 43,688 | F | 18 | 45,912 | 0 | 1.07 × 10⁻¹ | LSC | psaB, psaA |
| 17 | 19 | 21,298 | R | 19 | 54,384 | 0 | 2.67 × 10⁻² | LSC | |
| 18 | 21 | 54,575 | F | 21 | 54,594 | 0 | 1.67 × 10⁻³ | LSC | |
| 19 | 20 | 56,125 | R | 20 | 56,125 | 0 | 6.66 × 10⁻³ | LSC | ndhC |
| 20 | 21 | 62,263 | R | 21 | 62,263 | 0 | 1.67 × 10⁻³ | LSC | |
| 21 | 19 | 64,976 | R | 19 | 64,976 | 0 | 2.67 × 10⁻² | LSC | |
| 22 | 21 | 69,245 | R | 21 | 69,245 | 0 | 1.67 × 10⁻³ | LSC | |
| 23 | 18 | 69,246 | R | 18 | 69,246 | 0 | 1.07 × 10⁻¹ | LSC | |
| 24 | 18 | 69,246 | F | 18 | 69,247 | 0 | 1.07 × 10⁻¹ | LSC | |
| 25 | 18 | 69,247 | R | 18 | 69,247 | 0 | 1.07 × 10⁻¹ | LSC | |
| 26 | 19 | 71,499 | R | 19 | 71,499 | 0 | 2.67 × 10⁻² | LSC | |
| 27 | 19 | 72,775 | R | 19 | 72,775 | 0 | 2.67 × 10⁻² | LSC | |
| 28 | 18 | 18,660 | F | 18 | 76,843 | 0 | 1.07 × 10⁻¹ | LSC | clpP |
| 29 | 18 | 52,390 | F | 18 | 87,369 | 0 | 1.07 × 10⁻¹ | LSC | |
| 30 | 20 | 91,234 | F | 20 | 91,254 | 0 | 6.66 × 10⁻³ | IRB | rpl2 |
| 31 | 20 | 105,557 | F | 20 | 105,575 | 0 | 6.66 × 10⁻³ | IRB | |
| 32 | 23 | 113,771 | F | 23 | 113,802 | 0 | 1.04 × 10⁻⁴ | IRB | |
| 33 | 18 | 69,461 | F | 18 | 116,760 | 0 | 1.07 × 10⁻¹ | LSC, SSC | ndhF |
| 34 | 21 | 117,268 | R | 21 | 117,268 | 0 | 1.67 × 10⁻³ | SSC | ndhF |
| 35 | 18 | 66,388 | F | 18 | 118,801 | 0 | 1.07 × 10-01 | LSC, SSC | |
| 36 | 18 | 4934 | F | 18 | 118,916 | 0 | 1.07 × 10⁻¹ | LSC, SSC | |
| 37 | 19 | 18,660 | R | 19 | 119,064 | 0 | 2.67 × 10⁻² | LSC, SSC | |
| 38 | 23 | 119,066 | R | 23 | 119,066 | 0 | 1.04 × 10⁻⁴ | SSC | |
| 39 | 19 | 10,289 | F | 19 | 126,141 | 0 | 2.67 × 10⁻² | LSC, SSC | |
| 40 | 18 | 31,747 | F | 18 | 126,142 | 0 | 1.07 × 10⁻¹ | LSC, SSC | |
| 41 | 19 | 73,588 | F | 19 | 127,650 | 0 | 2.67 × 10⁻² | LSC, SSC | ndhA |
| 42 | 25 | 127,669 | F | 25 | 127,693 | 0 | 6.51 × 10⁻⁶ | SSC | ndhA (intron) |
| 43 | 20 | 119,064 | R | 20 | 130,690 | 0 | 6.66 × 10⁻³ | SSC | |
| 44 | 19 | 18,660 | F | 19 | 130,691 | 0 | 2.67 × 10⁻² | LSC, SSC | |
| 45 | 18 | 10,551 | F | 18 | 133,570 | 0 | 1.07 × 10⁻¹ | LSC, SSC | ycf1 |
| 46 | 24 | 116,026 | F | 24 | 135,972 | 0 | 2.60 × 10⁻⁵ | IRB, IRA | ycf1 |
| 47 | 23 | 138,197 | F | 23 | 138,228 | 0 | 1.04 × 10⁻⁴ | IRA | |
| 48 | 20 | 57,490 | F | 20 | 142,313 | 0 | 6.66 × 10⁻³ | LSC, IRA | trnV-UAC, trnA-UGC |
| 49 | 20 | 146,427 | F | 20 | 146,445 | 0 | 6.66 × 10⁻³ | IRA | |
| 50 | 20 | 160,748 | F | 20 | 160,768 | 0 | 6.66 × 10⁻³ | IRA | rpl2 |
Table A6.
Simple sequence repeats (SSRs) in the Q. bawanglingensis chloroplast genome.
Table A6.
Simple sequence repeats (SSRs) in the Q. bawanglingensis chloroplast genome.
| ID | SSR | Size | Start | End | Region | Gene | ID | SSR | Size | Start | End | Region | Gene |
|---|---|---|---|---|---|---|---|---|---|---|---|---|---|
| 1 | (A)11 | 11 | 333 | 343 | LSC | 42 | (T)10 | 10 | 59,813 | 59,822 | LSC | atpB | |
| 2 | (A)10 | 10 | 1796 | 1805 | LSC | 43 | (T)11 | 11 | 60,285 | 60,295 | LSC | ||
| 3 | (T)15 | 15 | 4116 | 4130 | LSC | trnK-UUU | 44 | (AT)6 | 12 | 62,268 | 62,279 | LSC | |
| 4 | (C)12(A)11 | 23 | 4426 | 4448 | LSC | 45 | (T)11 | 11 | 64,317 | 64,327 | LSC | accD | |
| 5 | (T)13 | 13 | 4690 | 4702 | LSC | 46 | (A)10 | 10 | 64,492 | 64,501 | LSC | ||
| 6 | (A)11 | 11 | 4934 | 4944 | LSC | 47 | (AT)7 | 14 | 64,795 | 64,808 | LSC | ||
| 7 | (A)11 | 11 | 5134 | 5144 | LSC | 48 | (T)11 | 11 | 65,170 | 65,180 | LSC | ||
| 8 | (T)11 | 11 | 6967 | 6977 | LSC | 49 | (T)10 | 10 | 66,211 | 66,220 | LSC | ||
| 9 | (A)10 | 10 | 8139 | 8148 | LSC | 50 | (T)14 | 14 | 66,389 | 66,402 | LSC | ||
| 10 | (A)16 | 16 | 8555 | 8570 | LSC | 51 | (T)10 | 10 | 68,836 | 68,845 | LSC | ||
| 11 | (A)10 | 10 | 8889 | 8898 | LSC | 52 | (A)19(AT)6 | 86 | 69,247 | 69,332 | LSC | ||
| 12 | (A)11 | 11 | 10,153 | 10,163 | LSC | 53 | (C)11 | 11 | 70,943 | 70,953 | LSC | ||
| 13 | (T)11 | 11 | 10,293 | 10,303 | LSC | 54 | (T)13 | 13 | 73,588 | 73,600 | LSC | ||
| 14 | (T)11 | 11 | 11,217 | 11,227 | LSC | trnG-GCC | 55 | (A)10 | 10 | 75,271 | 75,280 | LSC | |
| 15 | (A)11 | 11 | 13,552 | 13,562 | LSC | 56 | (A)14(A)13 | 34 | 76,829 | 76,862 | LSC | clpP | |
| 16 | (T)10(A)13(T)11 | 163 | 14,125 | 14,287 | LSC | atpF | 57 | (A)11 | 11 | 81,665 | 81,675 | LSC | PETB |
| 17 | (T)10 | 10 | 15,319 | 15,328 | LSC | 58 | (TA)7 | 14 | 83,134 | 83,147 | LSC | petD | |
| 18 | (A)12 | 12 | 18,667 | 18,678 | LSC | 59 | (A)10 | 10 | 85,981 | 85,990 | LSC | ||
| 19 | (T)10 | 10 | 20,639 | 20,648 | LSC | rpoC2 | 60 | (T)10 | 10 | 86,299 | 86,308 | LSC | |
| 20 | (T)10 | 10 | 20,768 | 20,777 | LSC | rpoC2 | 61 | (A)10(T)10 | 36 | 87,375 | 87,410 | LSC | |
| 21 | (T)12 | 12 | 21,296 | 21,307 | LSC | rpoC2 | 62 | (T)10 | 10 | 89,017 | 89,026 | LSC | |
| 22 | (C)10(A)10(T)10 | 93 | 24,830 | 24,922 | LSC | rpoC1 | 63 | (T)10 | 10 | 90,643 | 90,652 | IRB | |
| 23 | (T)17 | 17 | 25,303 | 25,319 | LSC | rpoC1 | 64 | (T)10 | 10 | 114,296 | 114,305 | IRB | |
| 24 | (T)10 | 10 | 28,570 | 28,579 | LSC | rpoB | 65 | (T)11 | 11 | 117,274 | 117,284 | SSC | ndhF |
| 25 | (T)10 | 10 | 29,642 | 29,651 | LSC | 66 | (T)15 | 15 | 118,801 | 118,815 | SSC | ||
| 26 | (C)13 | 13 | 30,442 | 30,454 | LSC | 67 | (A)10 | 10 | 118,917 | 118,926 | SSC | ||
| 27 | (T)11 | 11 | 31,750 | 31,760 | LSC | 68 | (A)12t(A)11 | 24 | 119,066 | 119,089 | SSC | ||
| 28 | (A)10 | 10 | 32,113 | 32,122 | LSC | 69 | (T)14 | 14 | 119,222 | 119,235 | SSC | ||
| 29 | (A)12 | 12 | 34,229 | 34,240 | LSC | 70 | (A)12 | 12 | 120,003 | 120,014 | SSC | ||
| 30 | (A)13 | 13 | 35,021 | 35,033 | LSC | 71 | (T)12 | 12 | 122,398 | 122,409 | SSC | ||
| 31 | (A)11 | 11 | 36,731 | 36,741 | LSC | 72 | (A)10 | 10 | 122,745 | 122,754 | SSC | ndhD | |
| 32 | (A)11 | 11 | 39,921 | 39,931 | LSC | 73 | (A)11 | 11 | 124,071 | 124,081 | SSC | ||
| 33 | (AT)6 | 12 | 40,068 | 40,079 | LSC | 74 | (T)10 | 10 | 126,004 | 126,013 | SSC | ||
| 34 | (T)14 | 14 | 40,210 | 40,223 | LSC | 75 | (T)11 | 11 | 126,145 | 126,155 | SSC | ||
| 35 | (A)13 | 13 | 40,365 | 40,377 | LSC | 76 | (A)11(T)12(A)11 | 77 | 127,622 | 127,722 | SSC | ndhA | |
| 36 | (A)10 | 10 | 40,882 | 40,891 | LSC | 77 | (T)10 | 10 | 130,474 | 130,483 | SSC | ||
| 37 | (A)10(A)10 | 89 | 52,317 | 52,405 | LSC | 78 | (A)12 | 12 | 130,698 | 130,709 | SSC | ||
| 38 | (T)11 | 11 | 53,423 | 53,433 | LSC | 79 | (T)10 | 10 | 133,670 | 133,679 | SSC | ycf1 | |
| 39 | (A)10 | 10 | 53,932 | 53,941 | LSC | 80 | (T)13 | 13 | 134,247 | 134,259 | SSC | ycf1 | |
| 40 | (T)10 | 10 | 54,316 | 54,325 | LSC | 81 | (A)10 | 10 | 137,718 | 137,727 | IRA | ||
| 41 | (A)10 | 10 | 55,210 | 55,219 | LSC | 82 | (A)10 | 10 | 161,371 | 161,380 | IRA |
References
- Birky, C.W.; Maruyama, T.; Fuerst, P. An approach to population and evolutionary genetic theory for genes in mitochondria and chloroplasts, and some results. Genetics 1983, 103, 513–527. [Google Scholar] [PubMed]
- Sugiura, M. The chloroplast genome. In 10 Years Plant Molecular Biology; Springer: Dordrecht, The Netherlands, 1992; pp. 149–168. [Google Scholar]
- Tangphatsornruang, S.; Sangsrakru, D.; Chanprasert, J.; Uthaipaisanwong, P.; Yoocha, T.; Jomchai, N.; Tragoonrung, S. The chloroplast genome sequence of mungbean (Vigna radiata) determined by high-throughput pyrosequencing: Structural organization and phylogenetic relationships. DNA Res. 2009, 17, 11–22. [Google Scholar] [CrossRef] [PubMed]
- Shinozaki, K.; Ohme, M.; Tanaka, M.; Wakasugi, T.; Hayashida, N.; Matsubayashi, T.; Zaita, N.; Chunwongse, J.; Obokata, J.; Yamaguchi-Shinozaki, K. The complete nucleotide sequence of the tobacco chloroplast genome: Its gene organization and expression. EMBO J. 1986, 5, 2043–2049. [Google Scholar] [CrossRef]
- Zhang, T.; Fang, Y.; Wang, X.; Deng, X.; Zhang, X.; Hu, S.; Yu, J. The complete chloroplast and mitochondrial genome sequences of Boea hygrometrica: Insights into the evolution of plant organellar genomes. PLoS ONE 2012, 7, e30531. [Google Scholar] [CrossRef] [PubMed]
- Cosner, M.E.; Raubeson, L.A.; Jansen, R.K. Chloroplast DNA rearrangements in Campanulaceae: Phylogenetic utility of highly rearranged genomes. BMC Evol. Biol. 2004, 4, 27. [Google Scholar] [CrossRef] [PubMed]
- Nock, C.J.; Waters, D.L.; Edwards, M.A.; Bowen, S.G.; Rice, N.; Cordeiro, G.M.; Henry, R.J. Chloroplast genome sequences from total DNA for plant identification. Plant Biotechnol. J. 2011, 9, 328–333. [Google Scholar] [CrossRef]
- Reith, M. Complete uncleotide sequence of the Porphyra purpurea chloroplast genome. Plant Mol. Biol. Rep. 1995, 13, 327–332. [Google Scholar] [CrossRef]
- Wicke, S.; Schneeweiss, G.M.; Müller, K.F.; Quandt, D. The evolution of the plastid chromosome in land plants: Gene content, gene order, gene function. Plant Mol. Biol. 2011, 76, 273–297. [Google Scholar] [CrossRef]
- Samson, N.; Bausher, M.G.; Lee, S.B.; Jansen, R.K.; Daniell, H. The complete nucleotide sequence of the coffee (Coffea arabica L.) chloroplast genome: Organization and implications for biotechnology and phylogenetic relationships amongst angiosperms. Plant Biotechnol. J. 2007, 5, 339–353. [Google Scholar] [CrossRef]
- Moore, M.J.; Bell, C.D.; Soltis, P.S.; Soltis, D.E. Using plastid genome-scale data to resolve enigmatic relationships among basal angiosperms. Proc. Natl. Acad. Sci. USA 2007, 104, 19363–19368. [Google Scholar] [CrossRef]
- Jansen, R.K.; Cai, Z.; Raubeson, L.A.; Daniell, H.; Depamphilis, C.W.; Leebens-Mack, J.; Müller, K.F.; Guisinger-Bellian, M.; Haberle, R.C.; Hansen, A.K. Analysis of 81 genes from 64 plastid genomes resolves relationships in angiosperms and identifies genome-scale evolutionary patterns. Proc. Natl. Acad. Sci. USA 2007, 104, 19369–19374. [Google Scholar] [CrossRef] [PubMed]
- Lin, C.-P.; Huang, J.-P.; Wu, C.-S.; Hsu, C.-Y.; Chaw, S.-M. Comparative chloroplast genomics reveals the evolution of Pinaceae genera and subfamilies. Genome Biol. Evol. 2010, 2, 504–517. [Google Scholar] [CrossRef] [PubMed]
- Parks, M.; Cronn, R.; Liston, A. Increasing phylogenetic resolution at low taxonomic levels using massively parallel sequencing of chloroplast genomes. BMC Biol. 2009, 7, 84. [Google Scholar] [CrossRef] [PubMed]
- Liu, L.; Wang, Y.; He, P.; Li, P.; Lee, J.; Soltis, D.E.; Fu, C. Chloroplast genome analyses and genomic resource development for epilithic sister genera Oresitrophe and Mukdenia (Saxifragaceae), using genome skimming data. BMC Genom. 2018, 19, 235. [Google Scholar] [CrossRef] [PubMed]
- Li, Z.-H.; Ma, X.; Wang, D.-Y.; Li, Y.-X.; Wang, C.-W.; Jin, X.-H. Evolution of plastid genomes of Holcoglossum (Orchidaceae) with recent radiation. BMC Evol. Biol. 2019, 19, 63. [Google Scholar] [CrossRef]
- Haig, S.M. Molecular contributions to conservation. Ecology 1998, 79, 413–425. [Google Scholar] [CrossRef]
- Juchum, F.; Leal, J.; Santos, L.; Almeida, M.; Ahnert, D.; Corrêa, R. Evaluation of genetic diversity in a natural rosewood population (Dalbergia nigra Vell. Allemão ex Benth.) using RAPD markers. Genet. Mol. Res. 2007, 6, 543–553. [Google Scholar]
- Lira, C.F.; Cardoso, S.R.S.; Ferreira, P.C.G.; Cardoso, M.A.; Provan, J. Long-term population isolation in the endangered tropical tree species Caesalpinia echinata Lam. revealed by chloroplast microsatellites. Mol. Ecol. 2003, 12, 3219–3225. [Google Scholar] [CrossRef]
- McCauley, D.E. The use of chloroplast DNA polymorphism in studies of gene flow in plants. Trends Ecol. Evol. 1995, 10, 198–202. [Google Scholar] [CrossRef]
- Ennos, R.A. Using organelle markers to elucidate the history, ecology and evolution of plant populations. Mol. Syst. Plant Evol. 1999, 1–19. [Google Scholar] [CrossRef]
- Gregory, T.R. DNA barcoding does not compete with taxonomy. Nature 2005, 434, 1067. [Google Scholar] [CrossRef] [PubMed]
- Qian, W.; Qiu-Shi, Y.; Jian-Quan, L. Are nuclear loci ideal for barcoding plants? A case study of genetic delimitation of two sister species using multiple loci and multiple intraspecific individuals. J. Syst. Evol. 2011, 49, 182–188. [Google Scholar]
- Barrett, C.F.; Davis, J.I.; Leebens-Mack, J.; Conran, J.G.; Stevenson, D.W. Plastid genomes and deep relationships among the commelinid monocot angiosperms. Cladistics 2013, 29, 65–87. [Google Scholar] [CrossRef]
- Li, X.; Yang, Y.; Henry, R.J.; Rossetto, M.; Wang, Y.; Chen, S. Plant DNA barcoding: From gene to genome. Biol. Rev. 2015, 90, 157–166. [Google Scholar] [CrossRef] [PubMed]
- Nixon, K.C.; Crepet, W.L. Trigonobalanus (Fagaceae): Taxonomic status and phylogenetic relationships. Am. J. Bot. 1989, 76, 828–841. [Google Scholar] [CrossRef]
- Nixon, K.C. Infrageneric classification of Quercus (Fagaceae) and typification of sectional names. In Annales des Sciences Forestières; EDP Sciences: Les Ulis, France, 1993. [Google Scholar]
- Hubert, F.; Grimm, G.W.; Jousselin, E.; Berry, V.; Franc, A.; Kremer, A. Multiple nuclear genes stabilize the phylogenetic backbone of the genus Quercus. Syst. Biodivers. 2014, 12, 405–423. [Google Scholar] [CrossRef]
- Ørsted, A.S. Bidrag til kundskab om Egefamilien i Nutid og Fortid; Mathematisk-naturvidenskabelig Klass: Skrifter Udgivne af Videnskabs-Selskabet i Christiana; Bianco Lunos Bogtr.: Copenhagen, Denmark, 1871. [Google Scholar]
- Denk, T.; Grimm, G.W.; Manos, P.S.; Deng, M.; Hipp, A.L. An updated infrageneric classification of the oaks: Review of previous taxonomic schemes and synthesis of evolutionary patterns. In Oaks Physiological Ecology. Exploring the Functional Diversity of Genus Quercus L.; Springer: Cham, Switzerland, 2017. [Google Scholar]
- Kim, K.; Lee, S.-C.; Lee, J.; Yu, Y.; Yang, K.; Choi, B.-S.; Koh, H.-J.; Waminal, N.E.; Choi, H.-I.; Kim, N.-H. Complete chloroplast and ribosomal sequences for 30 accessions elucidate evolution of Oryza AA genome species. Sci. Rep. 2015, 5, 15655. [Google Scholar] [CrossRef] [PubMed]
- Yang, J.; Yue, M.; Niu, C.; Ma, X.-F.; Li, Z.-H. Comparative analysis of the complete chloroplast genome of four endangered herbals of Notopterygium. Genes 2017, 8, 124. [Google Scholar] [CrossRef] [PubMed]
- Oh, S.-H.; Manos, P.S. Molecular phylogenetics and cupule evolution in Fagaceae as inferred from nuclear CRABS CLAW sequences. Taxon 2008, 57, 434–451. [Google Scholar]
- Pelser, P.B.; Kennedy, A.H.; Tepe, E.J.; Shidler, J.B.; Nordenstam, B.; Kadereit, J.W.; Watson, L.E. Patterns and causes of incongruence between plastid and nuclear Senecioneae (Asteraceae) phylogenies. Am. J. Bot. 2010, 97, 856–873. [Google Scholar] [CrossRef] [PubMed]
- Pérez-Escobar, O.A.; Balbuena, J.A.; Gottschling, M. Rumbling orchids: How to assess divergent evolution between chloroplast endosymbionts and the nuclear host. Syst. Biol. 2015, 65, 51–65. [Google Scholar] [CrossRef] [PubMed]
- Hipp, A.L.; Eaton, D.A.; Cavender-Bares, J.; Fitzek, E.; Nipper, R.; Manos, P.S. A framework phylogeny of the American oak clade based on sequenced RAD data. PLoS ONE 2014, 9, e93975. [Google Scholar] [CrossRef] [PubMed]
- McVay, J.D.; Hipp, A.L.; Manos, P.S. A genetic legacy of introgression confounds phylogeny and biogeography in oaks. Proc. R. Soc. B Biol. Sci. 2017, 284, 20170300. [Google Scholar] [CrossRef] [PubMed]
- Pham, K.K.; Hipp, A.L.; Manos, P.S.; Cronn, R.C. A time and a place for everything: Phylogenetic history and geography as joint predictors of oak plastome phylogeny. Genome 2017, 60, 720–732. [Google Scholar] [CrossRef] [PubMed]
- Simeone, M.C.; Cardoni, S.; Piredda, R.; Imperatori, F.; Avishai, M.; Grimm, G.W.; Denk, T. Comparative systematics and phylogeography of Quercus Section Cerris in western Eurasia: Inferences from plastid and nuclear DNA variation. PeerJ 2018, 6, e5793. [Google Scholar] [CrossRef] [PubMed]
- Yang, J.; Vázquez, L.; Chen, X.; Li, H.; Zhang, H.; Liu, Z.; Zhao, G. Development of chloroplast and nuclear DNA markers for Chinese oaks (Quercus subgenus Quercus) and assessment of their utility as DNA barcodes. Front. Plant Sci. 2017, 8, 816. [Google Scholar] [CrossRef]
- Qin, H.; Yang, Y.; Dong, S.; He, Q.; Jia, Y.; Zhao, L.; Yu, S.; Liu, H.; Liu, B.; Yan, Y. Threatened species list of China’s higher plants. Biodivers. Sci. 2017, 25, 744. [Google Scholar] [CrossRef]
- Deng, M.; Jiang, X.-L.; Song, Y.-G.; Coombes, A.; Yang, X.-R.; Xiong, Y.-S.; Li, Q.-S. Leaf epidermal features of Quercus Group Ilex (Fagaceae) and their application to species identification. Rev. Palaeobot. Palynol. 2017, 237, 10–36. [Google Scholar] [CrossRef]
- Yang, Y.; Hu, Y.; Ren, T.; Sun, J.; Zhao, G. Remarkably conserved plastid genomes of Quercus group Cerris in China: Comparative and phylogenetic analyses. Nord. J. Bot. 2018, 36, e01921. [Google Scholar] [CrossRef]
- Yang, Y.; Zhou, T.; Duan, D.; Yang, J.; Feng, L.; Zhao, G. Comparative analysis of the complete chloroplast genomes of five Quercus species. Front. Plant Sci. 2016, 7, 959. [Google Scholar] [CrossRef]
- Yang, Y.; Zhu, J.; Feng, L.; Zhou, T.; Bai, G.; Yang, J.; Zhao, G. Plastid genome comparative and phylogenetic analyses of the key genera in Fagaceae: Highlighting the effect of codon composition bias in phylogenetic inference. Front. Plant Sci. 2018, 9, 82. [Google Scholar] [CrossRef] [PubMed]
- Li, X.; Li, Y.; Zang, M.; Li, M.; Fang, Y. Complete chloroplast genome sequence and phylogenetic analysis of Quercus acutissima. Int. J. Mol. Sci. 2018, 19, 2443. [Google Scholar] [CrossRef] [PubMed]
- Zhang, R.; Qin, X.; Chen, H.; Chan, B.P.L.; Xing, F.; Xu, Z. Phytogeography and floristic affinities of the limestone flora of Mt. Exianling, Hainan Island, China. Bot. Rev. 2017, 83, 38–58. [Google Scholar] [CrossRef]
- Doyle, J.J. A rapid DNA isolation procedure for small quantities of fresh leaf tissue. Phytochem. Bull. 1987, 19, 11–15. [Google Scholar]
- Dierckxsens, N.; Mardulyn, P.; Smits, G. NOVOPlasty: De novo assembly of organelle genomes from whole genome data. Nucleic Acids Res. 2016, 45, e18. [Google Scholar]
- Liu, C.; Shi, L.; Zhu, Y.; Chen, H.; Zhang, J.; Lin, X.; Guan, X. CpGAVAS, an integrated web server for the annotation, visualization, analysis, and GenBank submission of completely sequenced chloroplast genome sequences. BMC Genom. 2012, 13, 715. [Google Scholar] [CrossRef]
- Wyman, S.K.; Jansen, R.K.; Boore, J.L. Automatic annotation of organellar genomes with DOGMA. Bioinformatics 2004, 20, 3252–3255. [Google Scholar] [CrossRef]
- Schattner, P.; Brooks, A.N.; Lowe, T.M. The tRNAscan-SE, snoscan and snoGPS web servers for the detection of tRNAs and snoRNAs. Nucleic Acids Res. 2005, 33, W686–W689. [Google Scholar] [CrossRef]
- Lohse, M.; Drechsel, O.; Bock, R. Organellar Genome DRAW (OGDRAW): A tool for the easy generation of high-quality custom graphical maps of plastid and mitochondrial genomes. Curr. Genet. 2007, 52, 267–274. [Google Scholar] [CrossRef]
- Mudunuri, S.B.; Nagarajaram, H.A. IMEx: Imperfect microsatellite extractor. Bioinformatics 2007, 23, 1181–1187. [Google Scholar] [CrossRef]
- Kurtz, S.; Choudhuri, J.V.; Ohlebusch, E.; Schleiermacher, C.; Stoye, J.; Giegerich, R. REPuter: The manifold applications of repeat analysis on a genomic scale. Nucleic Acids Res. 2001, 29, 4633–4642. [Google Scholar] [CrossRef] [PubMed]
- Katoh, K.; Kuma, K.-I.; Toh, H.; Miyata, T. MAFFT version 5: Improvement in accuracy of multiple sequence alignment. Nucleic Acids Res. 2005, 33, 511–518. [Google Scholar] [CrossRef] [PubMed]
- Mayor, C.; Brudno, M.; Schwartz, J.R.; Poliakov, A.; Rubin, E.M.; Frazer, K.A.; Pachter, L.S.; Dubchak, I. VISTA: Visualizing global DNA sequence alignments of arbitrary length. Bioinformatics 2000, 16, 1046–1047. [Google Scholar] [CrossRef] [PubMed]
- Frazer, K.A.; Pachter, L.; Poliakov, A.; Rubin, E.M.; Dubchak, I. VISTA: Computational tools for comparative genomics. Nucleic Acids Res. 2004, 32, W273–W279. [Google Scholar] [CrossRef] [PubMed]
- Librado, P.; Rozas, J. DnaSP v5: A software for comprehensive analysis of DNA polymorphism data. Bioinformatics 2009, 25, 1451–1452. [Google Scholar] [CrossRef] [PubMed]
- Hall, T.A. BioEdit: A user-friendly biological sequence alignment editor and analysis program for Windows 95/98/NT. Nucleic Acids Symp. Ser. 1999, 41, 95–98. [Google Scholar]
- Price, M.N.; Dehal, P.S.; Arkin, A.P. FastTree 2-approximately maximum-likelihood trees for large alignments. PLoS ONE 2010, 5, e9490. [Google Scholar] [CrossRef]
- Hu, H.-L.; Zhang, J.-Y.; Li, Y.-P.; Xie, L.; Chen, D.-B.; Li, Q.; Liu, Y.-Q.; Hui, S.-R.; Qin, L. The complete chloroplast genome of the daimyo oak, Quercus dentata Thunb. Conserv. Genet. Resour. 2018, 1–3. [Google Scholar] [CrossRef]
- Zhang, X.; Hu, Y.; Liu, M.; Lang, T. Optimization of Assembly Pipeline may Improve the Sequence of the Chloroplast Genome in Quercus spinosa. Sci. Rep. 2018, 8, 8906. [Google Scholar] [CrossRef]
- Wang, R.-J.; Cheng, C.-L.; Chang, C.-C.; Wu, C.-L.; Su, T.-M.; Chaw, S.-M. Dynamics and evolution of the inverted repeat-large single copy junctions in the chloroplast genomes of monocots. BMC Evol. Biol. 2008, 8, 36. [Google Scholar] [CrossRef]
- Yao, X.; Tang, P.; Li, Z.; Li, D.; Liu, Y.; Huang, H. The first complete chloroplast genome sequences in Actinidiaceae: Genome structure and comparative analysis. PLoS ONE 2015, 10, e0129347. [Google Scholar] [CrossRef] [PubMed]
- Raubeson, L.A.; Peery, R.; Chumley, T.W.; Dziubek, C.; Fourcade, H.M.; Boore, J.L.; Jansen, R.K. Comparative chloroplast genomics: Analyses including new sequences from the angiosperms Nuphar advena and Ranunculus macranthus. BMC Genom. 2007, 8, 174. [Google Scholar] [CrossRef] [PubMed]
- Kode, V.; Mudd, E.A.; Iamtham, S.; Day, A. The tobacco plastid accD gene is essential and is required for leaf development. Plant J. 2005, 44, 237–244. [Google Scholar] [CrossRef] [PubMed]
- Nguyen, P.A.T.; Kim, J.S.; Kim, J.-H. The complete chloroplast genome of colchicine plants (Colchicum autumnale L. and Gloriosa superba L.) and its application for identifying the genus. Planta 2015, 242, 223–237. [Google Scholar] [CrossRef] [PubMed]
- Firetti, F.; Zuntini, A.R.; Gaiarsa, J.W.; Oliveira, R.S.; Lohmann, L.G.; Van Sluys, M.A. Complete chloroplast genome sequences contribute to plant species delimitation: A case study of the Anemopaegma species complex. Am. J. Bot. 2017, 104, 1493–1509. [Google Scholar] [CrossRef] [PubMed]
- Perry, A.S.; Wolfe, K.H. Nucleotide substitution rates in legume chloroplast DNA depend on the presence of the inverted repeat. J. Mol. Evol. 2002, 55, 501–508. [Google Scholar] [CrossRef]
- Khakhlova, O.; Bock, R. Elimination of deleterious mutations in plastid genomes by gene conversion. Plant J. 2006, 46, 85–94. [Google Scholar] [CrossRef] [PubMed]
- Shaw, J.; Lickey, E.B.; Schilling, E.E.; Small, R.L. Comparison of whole chloroplast genome sequences to choose noncoding regions for phylogenetic studies in angiosperms: The tortoise and the hare III. Am. J. Bot. 2007, 94, 275–288. [Google Scholar] [CrossRef] [PubMed]
- Hollingsworth, P.M.; Forrest, L.L.; Spouge, J.L.; Hajibabaei, M.; Ratnasingham, S.; van der Bank, M.; Chase, M.W.; Cowan, R.S.; Erickson, D.L.; Fazekas, A.J.; et al. A DNA barcode for land plants. Proc. Natl. Acad. Sci. USA 2009, 106, 12794–12797. [Google Scholar] [CrossRef]
- Shaw, J.; Shafer, H.L.; Leonard, O.R.; Kovach, M.J.; Schorr, M.; Morris, A.B. Chloroplast DNA sequence utility for the lowest phylogenetic and phylogeographic inferences in angiosperms: The tortoise and the hare IV. Am. J. Bot. 2014, 101, 1987–2004. [Google Scholar] [CrossRef] [PubMed]
- Yang, Z.; Zhao, T.; Ma, Q.; Liang, L.; Wang, G. Comparative genomics and phylogenetic analysis revealed the chloroplast genome variation and interspecific relationships of Corylus (Betulaceae) Species. Front. Plant Sci. 2018, 9, 927. [Google Scholar] [CrossRef]
- Dong, W.; Xu, C.; Li, C.; Sun, J.; Zuo, Y.; Shi, S.; Cheng, T.; Guo, J.; Zhou, S. ycf1, the most promising plastid DNA barcode of land plants. Sci. Rep. 2015, 5, 8348. [Google Scholar] [CrossRef] [PubMed]
- Li, J.; Su, Y.; Wang, T. The Repeat Sequences and Elevated Substitution Rates of the Chloroplast accD Gene in Cupressophytes. Front. Plant Sci. 2018, 9, 533. [Google Scholar] [CrossRef] [PubMed]
- Nagalingum, N.S.; Schneider, H.; Pryer, K.M. Molecular phylogenetic relationships and morphological evolution in the heterosporous fern genus Marsilea. Syst. Bot. 2007, 32, 16–25. [Google Scholar] [CrossRef]
- Zecca, G.; Abbott, J.R.; Sun, W.-B.; Spada, A.; Sala, F.; Grassi, F. The timing and the mode of evolution of wild grapes (Vitis). Mol. Phylogenet. Evol. 2012, 62, 736–747. [Google Scholar] [CrossRef] [PubMed]
- Díaz, J.G.; Bauters, K.; Xanthos, M.; Larridon, I. Scleria diversity in Madagascar: Evolutionary links to mainland Africa. Royal Botanic Gardens, Kew 2017. [Google Scholar]
- Moura, M.N.; Santos-Silva, F.; Gomes-da-Silva, J.; de Almeida, J.P.P.; Forzza, R.C. Between Spines and Molecules: A Total Evidence Phylogeny of the Brazilian Endemic Genus Encholirium (Pitcairnioideae, Bromeliaceae). Syst. Bot. 2019. [Google Scholar] [CrossRef]
- Kikuchi, S.; Bédard, J.; Hirano, M.; Hirabayashi, Y.; Oishi, M.; Imai, M.; Takase, M.; Ide, T.; Nakai, M. Uncovering the protein translocon at the chloroplast inner envelope membrane. Science 2013, 339, 571–574. [Google Scholar] [CrossRef]
- De Cambiaire, J.-C.; Otis, C.; Lemieux, C.; Turmel, M. The complete chloroplast genome sequence of the chlorophycean green alga Scenedesmus obliquus reveals a compact gene organization and a biased distribution of genes on the two DNA strands. BMC Evol. Biol. 2006, 6, 37. [Google Scholar] [CrossRef]
- Clegg, M.T.; Gaut, B.S.; Learn, G.H.; Morton, B.R. Rates and patterns of chloroplast DNA evolution. Proc. Natl. Acad. Sci. USA 1994, 91, 6795–6801. [Google Scholar] [CrossRef]
- Guo, S.; Guo, L.; Zhao, W.; Xu, J.; Li, Y.; Zhang, X.; Shen, X.; Wu, M.; Hou, X. Complete chloroplast genome sequence and phylogenetic analysis of Paeonia ostii. Molecules 2018, 23, 246. [Google Scholar] [CrossRef] [PubMed]
- Kuang, D.-Y.; Wu, H.; Wang, Y.-L.; Gao, L.-M.; Zhang, S.-Z.; Lu, L. Complete chloroplast genome sequence of Magnolia kwangsiensis (Magnoliaceae): Implication for DNA barcoding and population genetics. Genome 2011, 54, 663–673. [Google Scholar] [CrossRef] [PubMed]
- Shimda, H.; Sugiuro, M. Fine structural features of the chloroplast genome: Comparison of the sequenced chloroplast genomes. Nucleic Acids Res. 1991, 19, 983–995. [Google Scholar] [CrossRef] [PubMed]
- Lobry, J.R. Asymmetric substitution patterns in the two DNA strands of bacteria. Mol. Biol. Evol. 1996, 13, 660–665. [Google Scholar] [CrossRef] [PubMed]
- Necşulea, A.; Lobry, J.R. A new method for assessing the effect of replication on DNA base composition asymmetry. Mol. Biol. Evol. 2007, 24, 2169–2179. [Google Scholar]
- Tillier, E.R.; Collins, R.A. The contributions of replication orientation, gene direction, and signal sequences to base-composition asymmetries in bacterial genomes. J. Mol. Evol. 2000, 50, 249–257. [Google Scholar] [CrossRef]
- Delannoy, E.; Fujii, S.; Colas des Francs-Small, C.; Brundrett, M.; Small, I. Rampant gene loss in the underground orchid Rhizanthella gardneri highlights evolutionary constraints on plastid genomes. Mol. Biol. Evol. 2011, 28, 2077–2086. [Google Scholar] [CrossRef] [PubMed]
- Flannery, M.; Mitchell, F.; Coyne, S.; Kavanagh, T.; Burke, J.; Salamin, N.; Dowding, P.; Hodkinson, T.J. Plastid genome characterisation in Brassica and Brassicaceae using a new set of nine SSRs. Theor. Appl. Genet. 2006, 113, 1221–1231. [Google Scholar] [CrossRef]
- Provan, J. Novel chloroplast microsatellites reveal cytoplasmic variation in Arabidopsis thaliana. Mol. Ecol. 2000, 9, 2183–2185. [Google Scholar] [CrossRef]
- Bryan, G.; McNicoll, J.; Ramsay, G.; Meyer, R.; De Jong, W. Polymorphic simple sequence repeat markers in chloroplast genomes of Solanaceous plants. Theor. Appl. Genet. 1999, 99, 859–867. [Google Scholar] [CrossRef]
- Asaf, S.; Khan, A.L.; Khan, M.A.; Waqas, M.; Kang, S.-M.; Yun, B.-W.; Lee, I.-J. Chloroplast genomes of Arabidopsis halleri ssp. gemmifera and Arabidopsis lyrata ssp. petraea: Structures and comparative analysis. Sci. Rep. 2017, 7, 7556. [Google Scholar] [CrossRef] [PubMed]
- Schroeder, H.; Cronn, R.; Yanbaev, Y.; Jennings, T.; Mader, M.; Degen, B.; Kersten, B. Development of molecular markers for determining continental origin of wood from white oaks (Quercus L. sect. Quercus). PLoS ONE 2016, 11, e0158221. [Google Scholar] [CrossRef] [PubMed]
- Powell, W.; Morgante, M.; Andre, C.; McNicol, J.; Machray, G.; Doyle, J.; Tingey, S.; Rafalski, J. Hypervariable microsatellites provide a general source of polymorphic DNA markers for the chloroplast genome. Curr. Biol. 1995, 5, 1023–1029. [Google Scholar] [CrossRef]
- Li, X.; Gao, H.; Wang, Y.; Song, J.; Henry, R.; Wu, H.; Hu, Z.; Yao, H.; Luo, H.; Luo, K.; et al. Complete chloroplast genome sequence of Magnolia grandiflora and comparative analysis with related species. Sci. China Life Sci. 2013, 56, 189–198. [Google Scholar] [CrossRef] [PubMed]
- Zhou, Z. Fossils of the Fagaceae and their implications in systematics and biogeography. Acta Phytotaxon. Sin. 1999, 37, 369–385. [Google Scholar]
- Pu, C.; Zhou, Z.; Luo, Y. A cladistic analysis of Quercus (Fagaceae) in China based on leaf epidermic and architecture. Acta Bot. Yunnanica 2002, 24, 689–698. [Google Scholar]
- Editorial Committee of Flora of China. Flora of China; Science Press: Beijing, China, 1998. [Google Scholar]
- Denk, T.; Grimm, G.W. The oaks of western Eurasia: Traditional classifications and evidence from two nuclear markers. Taxon 2010, 59, 351–366. [Google Scholar] [CrossRef]
© 2019 by the authors. Licensee MDPI, Basel, Switzerland. This article is an open access article distributed under the terms and conditions of the Creative Commons Attribution (CC BY) license (http://creativecommons.org/licenses/by/4.0/).