Abstract
Knowledge of the potential productivity of forest sites is fundamental for making strategic decisions in forest management. Site productivity is usually evaluated using the site index, and therefore the development of site index models is one of the crucial tasks in forest research and forest management. This research aims to develop an effective method for building top-growth and site index models using data from temporary sample plots (TSP). Exploiting the advantages of the generalised algebraic difference approach (GADA), the proposed method overcomes the limitations of the guide curve method that has been to date used in site index modelling using TSPs data and allows to obtain only a set of anamorphic site index curves. The proposed approach enables the construction of dynamic site index models with polymorphism and variable asymptotes. Such models better reflect local, site-specific height growth trajectories and therefore allow more appropriate site index estimation. We tested the proposed method using data collected from 5105 temporary sample plots in Poland. Our results indicate that growth trend estimates using height–age measurements of TSPs may be valuable data for modelling top height growth. For these reasons, the proposed method can be very useful in forest management.
1. Introduction
Knowledge of the potential productivity of forest sites is fundamental to making strategic decisions in forest management, including those related to species composition and silvicultural treatments, as well as to determining timber yield [1]. Site productivity is usually evaluated using the site index, determined using top height at a predetermined age, referred to as base age [2,3,4,5]. Site index models are also used to project forest growth [1,6,7]. The development of site index models is thus one of the essential tasks in forest management and forest research.
Most site index models developed in the 20th century were fitted using base-age-specific parameter estimation, whose primary defect is the dependence of the parameters on the base age [6,8]. The algebraic difference approach (ADA; [9]) is the precursor to the generalised algebraic difference approach (GADA) and enables the modeler to fit site curves that are invariant to the choice of base age (base-age invariant). Historically, the choice of base age resulted in different site index predictions for the same height–age combination, an undesirable outcome. Base age invariance was achieved by re-formulating the traditional site model and substituting initial conditions for site-specific parameters. In the beginning, the self-referencing functions were based on anamorphic (proportional) models, which have a single shape for all productivity sites but are scaled up and down having different asymptotes for different productivity sites. The anamorphic site index models were superseded by polymorphic models, which generate different shapes of growth patterns for different sites. Since ADA is base-age invariant, the choice of base age does not affect the model parameters [10,11]. However, the method’s limitation is that it provides models that can be anamorphic or polymorphic and generate different shapes of growth patterns for different sites, with a single asymptote [12]. This limitation does not apply to the GADA, a method of equation derivation proposed by Cieszewski and Bailey [12]. Including site parameters from the basic ADA equation, GADA takes into consideration the effect of site conditions on the process of stand growth. Thanks to this approach, GADA allows to obtain polymorphic models with variable asymptotes. Such models better reflect local, site-specific height growth trajectories, and therefore the use of GADA results in more appropriate site index estimation.
However, apart from the correctness of a method for constructing models, one should consider other factors that contribute to the inadequacy of models. These factors include: a lack of adjustment of site index models to local site conditions, which results from the variability of tree height growth across climatic and soil conditions; variations in silvicultural treatments and forest management; variability resulting from differences between populations of trees growing at a different place of origin (provenance); and methodological errors arising from the inadequate selection of data for the construction of site index models and especially, a lack of data representativeness. These factors may result in an incorrect determination of site productivity.
One solution to the above problems is the development of local site index models which take into account the growing conditions specific to a particular area. Local site index models can be developed using four main sources of data:
- The results of periodically repeated observations of permanent sample plots (PSPs);
- Data concerning the growth of individual trees, so-called stem analysis (SA);
- Repeated airborne laser scanning (ALS);
- Temporary sample plots (TSPs).
Site index models are most commonly developed using data from repeated measurements of PSP. However, this requires long-term measurements of many plots, which is a significant limitation of this approach [13,14]. Besides, PSPs are usually created for experimentation, which is mainly done in sites with better conditions for tree growth. In the case of national forest inventory (NFI) data, the results from permanent sample plots are usually representative of large areas rather than local site conditions [14,15,16].
Site index models usually use data from SA of pre-dominant or co-dominant trees. However, this method has limitations. One of them is uncertainty in whether the pre-dominant trees used in SA were in the top layer of the stand (or were pre-dominant) throughout the whole growing period. Therefore, models built on SA data may sometimes overstate the growth rate of stands [14]. Such models can differ from those relying on PSP data due to changes in the social position of trees selected for SA [13]. Another limitation of the approach is the high costs and time consumption involved in collecting a representative sample of trees.
Recent research also suggests the usefulness of data from repeated ALS for building site index models [17]. Currently, however, this method is sometimes difficult to apply, since it requires access to results of repeated ALS for areas for which there is a need to develop site index models and the estimation of stand ages is problematic.
TSPs offer one of the most readily available data sources for site index modelling; however, TSP measurements do not provide growth series. Until now, the guide curve method has usually been applied for the development of site index models from TSP data [7,14,18]. The guide curve method is a method of modelling time series based on cross-sectional data collected by measuring many sample plots at the same point of time. The proportional guide curve system uses a single guide curve representing the mean heights at each age within the data. This guide curve then is proportionally scaled to pass through the observed reference height at any base age. The non-proportional guide curve system scales the guide curves according to smoothed standard deviations of heights represented by the data at different base ages.The main advantage of using TSPs is the relative ease of acquisition of empirical data, since they may come from periodic forest inventory, aiming to develop a forest management plan. However, this advantage is outweighed by a severe drawback that limits the use of TSP data for the development of site index models: stand measurement results from TSPs give only individual points representing height–age pairs and do not provide growth series. Therefore, to date TSP measurements were used to calibrate a guide curve. A guide curve is an outdated method of analysing panel data with a single curve, which constitutes its main fault. Moreover, the guide curve allows for adjustments to a set of growth curves that are anamorphic (proportional) or semi-polymorphic—calculated using the distance proportion between the guide curve and confidence bounds for a height–age sample [7]. Moreover, the guide curve system, which is the method of analysing panel data with a single curve, is potentially biased [8]. These limitations of the guide curve method decrease the value of TSPs for the development of site index models [14].
This research aims to develop an effective method for the development of site index models using data from TSPs. The method will not share the abovementioned limitation of the guide curve method, and will, therefore, enable the construction of dynamic site index models by using the growth function derivated with the GADA method, allowing to obtain polymorphic models with variable asymptotes for different site quality. To develop the method, we assume that it is possible to use TSPs to build models that will be characterised by both polymorphism and different asymptotes. This allows both site-specific effects of growth conditions on height growth trajectories to be taken into account. In ecological research, a set of sites that share similar attributes but represent different ages constitute chronosequence. We assume that proper data sampling (which ensures a uniform distribution of stands of all ages over the whole range of site conditions) and combining data from single age–height observations into chronosequences allows for creating a series of growth trajectories representing different site conditions, which overcomes the limitation the guide curve method used to date. A set of obtained growth trajectories allows the calibration of adequate site index models that reflect the local specificity of growth dependently on site conditions. A GADA-derived equation characterised with desirable properties was selected for fitting site index models to growth series obtained from TSP (chronosequences) for different site conditions. The proposed procedure allowed to solve the faults and limitations of the guide curve method. Such models would be suitable for determining site productivity by taking into account the local conditions.
2. Materials and Methods
The research area was the Knyszynska Forest, located in northeastern Poland (Figure 1), in the second Mazury-Podlasie natural forest region. The Knyszynska Forest is a vast forest complex, with Scots pine as the dominant tree species. The forest’s area is under the influence of a temperate climate, with an average annual temperature of about 7 °C and an annual rainfall of 650 mm.
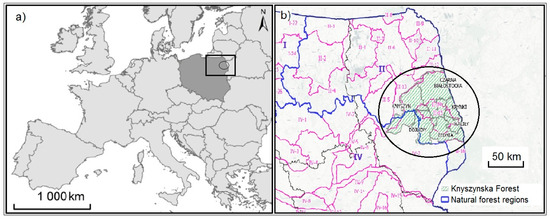
Figure 1.
The research area in Poland (a) and the Knyszynska Forest within the Second Natural Forest Region (b).
The research material consisted of measurements taken in 2016–2018 of trees growing on 5105 TSPs, circular in shape, in seven forest districts located in the Knyszynska Forest (Czarna Bialostocka, Dojlidy, Knyszyn, Krynki, Supranl, Walily, and Zednia; Figure 1). The plots size varied between 100 and 500 m2 and was dependent on the age of the stand (Table 1). On each TSP, the threshold for diameter measurement was equal to 7 cm. Top height was estimated for each TSP using the mean height of the largest diameter trees, with the number of trees used for the calculation proportional to 100 trees per hectare. Thus, for example, from a 0.02 ha plot, the two thickest trees would be used, while from a 0.04 ha plot, the four thickest trees would be used. The result of top height estimation using the number of trees proportional to 100 trees per hectare from a sample plot could be slightly different from the one achieved for the same plot if the top height was calculated as the mean height from 100 m2 subplots [17]. However, the calculation of top height as the mean height from 100 m2 sub-plots is impractical and impossible when using standard inventory data. The ages of the TSPs were determined using stand register data.

Table 1.
Frequency of temporary sample plots (TSP) of different size in age classes.
Extreme outlier values were removed from the data using the interquartile range, a measure which is often used to separate outliers in data [19]. It was assumed that an outlier was an observation at an abnormal distance from other values in a random sample from a population. Outliers were separated using lower and upper quartiles (Q1–Q3), and interquartile range (IQ) was calculated as the difference between quartile Q3 and Q1. We defined extreme values in the tails of the distribution by the lower inner bound Q1 − 1.5 × IQ and the upper inner bound Q3 + 1.5 × IQ according to Tukey [20], which picked 1.5 × IQ as the demarcation line for outliers. Reasonableness of this measure for bell-curve-shaped data means that, usually, about 1% of the data will ever be outliers. This study analysed commercial stands whose age did not exceed the maximum harvesting age of 120 years that is used in the Knyszynska Forest. Since tree height strongly depends on the method of the renewal of the tree stand, this study excluded TSPs located in stands under 20 years of age [4].
The proposed method assumes that all sites are sampled equally across the range of stand ages. It is thus essential that the inventories during which height–age data from TSPs are collected are appropriately designed. The height–age measurements from TSPs were collected in the framework of the preparation of a forest management plan. In the sampling procedure, all stands in a given forest district were divided into layers using their species and age. In the next step, the stands were sampled in order to establish TSPs for a given species from each 20 year-wide age class. This procedure assures that the sampled stands are distributed equally across the range of ages. We selected only stands with an age lower than or equal to the rotation age (maximum of 120 years), since in intensively managed high- and medium-productivity Scots pine stands in Poland, short rotation periods of less than 120 years are most frequently used, so that on low-productivity sites, plots located in older stands might be overrepresented.
To improve the distribution of tree stands across all ages in the sites, we selected eight main site types in the study area (Table 2). We excluded stands on rare sites (bog pine forest, bog mixed coniferous forest, bog mixed broadleaved forest, and riparian forest) and those in which, according to the forest silviculture rules, which describe acceptable practices, prepared to reflect science and local forest conditions, pine should not be grown as it is not the forest-forming species in this sites (riparian forest, moist broadleaved forest, alder forest, and alder–ash forest). We also excluded swamp sites (wet coniferous forest and boggy mixed coniferous forest) as they are not harvested, and therefore stands on these sites are generally the oldest, with an average age of over 100 years and almost no stands younger than 60 years. Altogether, 93 TSPs located in such atypical site conditions were excluded from the analysis, accounting for 1.8% of the 5105 TSPs collected during the inventory.
Table 2.
The basic characteristics of the research material collected on temporary sample plots located in areas of Scots pine.
The forestry literature offers many mathematical functions to build site index models. When selecting a potential mathematical function, we assumed that the site index model should be characterized by the following desirable properties [12,21,22]:
- ○
- Polymorphism, allowing to acknowledge the possible differences in growth patterns resulting from variability in site conditions;
- ○
- Variable asymptotes for different sites;
- ○
- Equality of the site index and height at base age;
- ○
- Possibility of using the same function as a height growth and site index model.
Using the above-mentioned criteria and the results of previous research concerning site index modelling for Scots pine in Poland [11,23,24,25,26], we chose the dynamic equation derived using the GADA method by Cieszewski [27] as the base function for site index model development:
where
where H is the measured height at age T, H1 is a site parameter denoting a stand height at age T1, and β1, β2, and β3 are estimated parameters.
The selected GADA function shown in Equation (1) allows the calculation of top height at a given age from the top height at another age. An essential property of this equation is that the selection of a base age does not affect predictions. The main virtue of this approach is the possibility of using growth chronosequences obtained from the whole empirical material.
We estimated the parameters of Equation (1) using the top heights of the artificial chronosequences of stands’ top height growth. Artificial site-level height–age chronosequences were derived from age–height pairs for 5012 TSPs. The artificial chronosequences were designed to resemble height–age trajectories for individual plots through time. The artificial trajectories were made by computing height percentiles (5, 10, …, 95) for each age on five-year intervals. An artificial height–age chronosequence was composed of matching percentiles across age classes (e.g., 60th percentile height for each age class). This resulted in 19 (site-level) age–height chronosequences, which may seem like a small number relative to what is typically used to model sites, but it is composed of data points from 5012 TSPs. Another distinction from the measured chronosequences (permanent plots or stem analysis) is that the trajectories were guaranteed to be parallel—i.e., they would intersect but they did not cross.
The linked 19 individual height percentiles calculated in particular years of the stands’ lives created 19 artificial chronosequences (Figure 2).
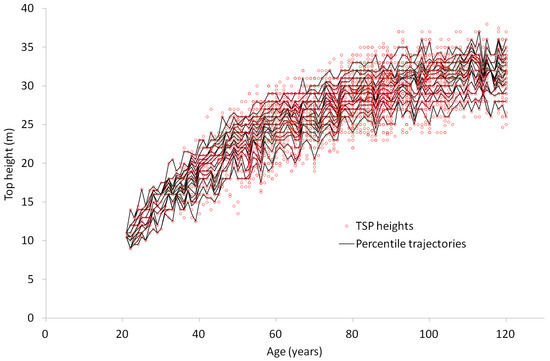
Figure 2.
Top heights of individual temporal sample plots and 19 artificial growth trajectories obtained by joined percentiles (5, 10, …, 95) of heights in particular years.
Both nonlinear fixed effects (NFE) and nonlinear mixed effects (NME) are subject-specific methods of fitting cross-sectional and time-series data models. The NME fitting method is not suitable for self-referencing models as well as for any non-random sudo-data in general. Therefore, the NFE method was selected for fitting the model to chronosequences obtained from TSP data. To simultaneously calculate the site and global parameters of Equation (1), we used a nested iterative procedure (NIP) [8,17,28]. The NIP starts with the calibration of the global parameters of the equation, using the preliminary values of site index (H1) determined by the mean height at the base age estimated for the whole empirical material. In the next iteration, the preliminary values of the global parameters are used as constants, and the site parameters are estimated for every growth trajectory. Next, the global parameters are refitted, using the H1 estimates for a given trajectory as the constants. The NIP was repeated until the parameters of the model stabilised. Parameter estimation was carried out in R using an nls (nonlinear least squares) procedure and a suitably defined model form [29].
We compared the model developed using our approach with both the local reference model for Scots pine (developed by Socha et al. [30] on the basis of growth trajectories obtained from SA in the Second Natural Forest Region where the Knyszynska Forest is located) and the general model for Scots pine in Poland. The reference model is a dynamic, polymorphic site index model developed using GADA and function 1.
The developed model was tested against independent data set consisting of growth trajectories obtained by SA of 67 dominant trees collected in the area of the Second Natural Forest Region in Poland. Using the site index estimated for individual SA trees and ages, considered as independent variables, we calculated the growth trajectories of every individual tree according to the site index model developed using TSP data and the site index model fitted to SA data. Differences between heights predicted using the TSP and SA models and the observed heights obtained by SA were presented graphically and statistically characterized by mean errors and root-mean-square errors (RMSE).
3. Results
Figure 2 shows the 19 artificial chronosequences for top height obtained for the individual years of the stands’ lives. The data from these chronosequences were then used to calibrate the parameters of Equation (1) (Table 3), giving the compatible site index model. The model showed a good fit, explaining over 98% (adjusted R2) of the top height growth variation (Table 3). Graphical diagnosis using the plot of residuals versus predicted values showed no correlation with the predicted top heights (Figure 3). In most cases, the increments in top height which the model predicted in individual years differed from the corresponding artificial percentile trajectories by no more than two meters (Figure 3). Both the plots of residuals in prediction TH and the square root of standardised residuals against fitted values showed no apparent trends across the range of TH (Figure 3).
Table 3.
The results of parameter estimation using a nested iterative procedure and fitting characteristics of the site index model developed using TSP plot data.
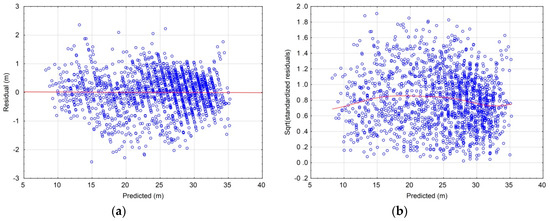
Figure 3.
Plot of residuals against the predicted values of top height fitted by the model (a) and scale-location (b).
The dynamic local model, characterised by polymorphism and variable asymptotes for different site conditions (Figure 4), allowed to both model top height change with age and estimate the site index for Scots pine.
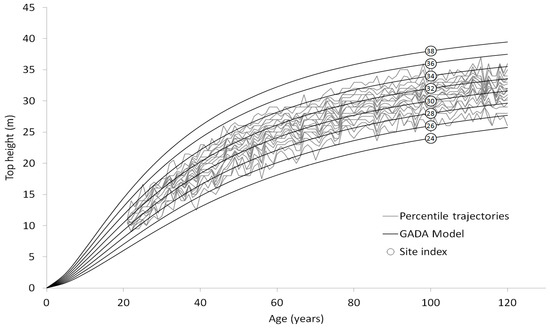
Figure 4.
Top height growth trajectories for Scots pine determined by the proposed method, using top height percentiles from TSPs calculated for the individual ages of the stands. The values in circles represent the corresponding site index at the base age of 100 years. GADA: generalised algebraic difference approach.
The model fitted with the TSP data using the developed approach and the local model for Scots pine in the Second Natural Forest Region showed very similar results (Figure 5). As we can see in Figure 5, our approach enabled us to fit a localized equation with TSP data that closely resembled a local model fit with longitudinal data (without the need for expensive longitudinal data). The “General model” for Scots pine in Figure 5, in contrast, diverges greatly from the two approaches to localized models and would result in significant bias.
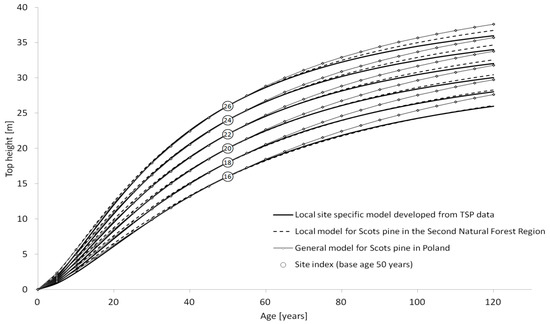
Figure 5.
Top height change trajectories for Scots pine according to the model developed using TSP data, the reference model for Scots pine for the Second Natural Forest Region, and the general model for Scots pine in Poland. The values in circles represent the corresponding site index at the base age of 50 years.
Using the site index calculated for the base age of 50 years as the reference level, we found large congruity between growth curves drawn according to the developed model and the local reference model for Scots pine for the Second Natural Forest Region. Small differences were present mainly for the most productive sites (site indexes of 24–26 m). For the least productive sites (site index of 16, 18 m), the growth curves were almost identical (Figure 5). The growth curves drawn according to the developed local TSP model were less asymptotic than the curves drawn according to the general, nationwide model for Scots pine in Poland. This indicates that in local site conditions, the general model overestimated the height growth rate in comparison to the height growth rate estimated using the local site-specific model. For the stands with equal top heights at the age of 50 years, the height at the age of 120 years, independently of the site conditions, was overestimated of about 4 m (Figure 5).
Model trajectories calculated for individual trees by the TSP model using the site parameters estimated for individual trees agreed well with the observed growth trajectories obtained from stem analysis (Figure 6). Differences between the growth trajectories of individual trees calculated according to models developed using TSP data and SA data and the observed heights of individual trees obtained by SA were very similar (Figure 6). The model developed using TSP data adequately described the growth trajectories of individual patterns, similar to the SA model developed using SA data set. The mean value of the height prediction error for individual trees by the model developed using TSP data was equal to −0.31 m, whereas the mean error in using the SA data was equal to −0.13 m. However, the RMSE of height prediction of individual SA trees both with the ALS and the SA models were nearly identical and equal to 0.77 m for the TSP model and 0.76 m for the model fitted to SA data. Deviations between the developed TSP model and SA model and the observed SA heights were in most cases less than 2.0 m (Figure 6).
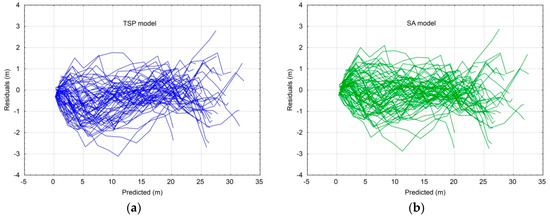
Figure 6.
Differences between observed growth trajectories obtained by stem analysis of 67 trees collected in the Second Natural Forest Region in Poland and height growth trajectories calculated using the model developed with TSP data (a, blue lines) and the model fitted to stem analysis (SA) data (b, green lines).
4. Discussion
The approach proposed in this research allows the use of height–age measurements from TSPs to develop dynamic models using the GADA method. The guide curve method used to date to develop site index models from TSP data [7,18] lacks the advantages of fitting dynamic models using the GADA method, which takes into consideration the effect of site conditions on the process of stand growth and therefore allows for the simultaneous estimation of model parameters and site-specific parameters. The GADA is the most effective system for parameter estimation because is based on identifying individual trends represented in the data from the whole range of site conditions, whereas the guide curve is based only on mean trends in the dataset. Thanks to this properties, the GADA allows to obtain polymorphic models with variable asymptotes. Such models better reflect local, site-specific height growth trajectories and therefore result in a more accurate site index estimation. The Guide curve allows one to obtain only static, anamorphic, or semi-polymorphic models.
According to Cieszewski et al. [8], the guide curve method, which is proportionally scaled to follow observed heights at any base age, is potentially biased. Conversely, the proposed approach helps develop polymorphic models with variable asymptotes and is characterised by the equivalence of site index and top height estimated for any base age.
We compared the performance of the model built using the method proposed with that of the reference model developed for Scots pine in the Knyszyńska Forest, fitted with stem analysis data [30]. There was a strong agreement in growth trajectories between the local models, whereas the general model for Scots pine in Poland showed systematic errors. The model fitted to the TSP observations indicated only slightly slower changes in top height growth with age than the reference model. However, the models developed using stem analysis data may overestimate the top height growth compared to the top-height changes with age observed on PSPs [14]. Therefore, the observed slight underestimation of height increment by the model developed using TSPs compared to the model developed using stem analysis data (a phenomenon observed in our case for the most productive sites) may be convenient. Further research on the topic should analyse the differences between models fitted to TSP data and models calibrated using both stem analysis and PSPs. Such a comparison could provide additional insights into the appropriateness of site index models developed using the proposed approach.
This research study showed that height–age measurements from TSPs can be valuable data for the calibration of local site index models. However, the proposed method assumes that the site conditions have an equal probability of selection across the range of stand ages. This is not necessarily the case in practice. There is a bias towards older stands on low-productivity sites because unproductive sites tend to take longer to reach merchantable log sizes. Highly productive sites are likely to be cut sooner, so are less likely to reach the maximum rotation age. This means that the closer a stand is to the maximum rotation age (120 years), the more likely a site is unproductive site. This characteristic of age relative to management results in a negative correlation between site index and observed age or a negative bias in site index models, especially in the upper ranges of observed ages [31,32,33]. We mitigated this bias by limiting our study to stands which were younger than 120 years of age.
Age trends resulting from the negative correlation between stand age and site index are still one of the most important issues for the estimation of site productivity using site index [3,31,33,34,35,36,37]. However, this problem is not specific to a given data source used in site index modelling. Furthermore, both models developed from PSP, stem analysis, TSP, and ALS data are not resistant to changes in site conditions. For changes in a site conditions, the age trend could be expected also in the case of site indices calculated using appropriate, local site-specific models. This issue should thus be taken into account when estimating potential site productivity using the site index, whose additional limitation is that it is appropriate mainly for stands of a similar age. For the purpose of model fitting, we removed the plots with age <20 and >120 years; however, the developed model allowed to calculate the site index for stands both younger than 20 and older than 120 years without avoiding large errors in site index estimation. On the other hand, in the forest management practice in Poland, the estimation of the site index for stands older 120 years has little practical importance.
The variation in top height growth patterns may be caused by a variety of factors. The shape of a top height growth curve is affected by soil type and geographical location [38], as well as by provenance-dependent genetic variability among a given species [39,40]. Both environmental conditions and provenance-dependent variability result in different top height growth patterns among ecoregions [41,42]. Such differences mean that site index models—which have been developed mostly for country scales—should be replaced by dynamic models developed for local or regional scales. This would allow the models to appropriately represent the relationship between stand height growth and site productivity. The proposed approach may be especially useful for the calibration of local site index models, since height–age measurements from TSPs are the most common—and the most efficient—procedure for taking samples of forest stands from geographic areas. The developed method could be recommended for the preparation of forest management plans. Forest management plans are prepared in Poland for individual forest districts using inventory data from about 1000–1500 TSPs. Therefore the development TSPs collected during inventory allow the development of local site index models for individual forest districts, or in the case of a lower number of plots for a given species, plots from neighbouring forest districts could be used. This method could also be applied to the National Forest Inventory data, which systematically cover the whole forested area of Poland, and to data from many other countries. Hence, the presented method makes it possible to sample from all sites across the entire range of stand ages throughout a country.
5. Conclusions
In this research, we proposed and tested a new approach for the calibration of top height growth and site index models based on measurement data from TSPs located in areas with a wide range of local conditions. Opposite to the guide curve method, the models developed using the proposed approach are characterised both by polymorphism and by variable asymptotes and therefore appropriately reflect the effect of specific local site conditions on height growth patterns. Our results indicate that growth trend estimates using height–age measurements from TSPs may be valuable data for modelling top height growth. Therefore, TSPs are an alternative source of data to PSPs and stem analysis, which are both commonly used for modelling top height growth and site indexes.
TSPs offer the most cost-effective method of sampling, which takes into account a variety of local site conditions across a large geographic area. By exploiting the advantages of the GADA, the proposed approach overcomes the limitations of the guide curve method and can thus have high utility in forest management.
Author Contributions
Conceptualization, J.S.; Methodology, J.S.; Validation, J.S.; Formal Analysis, J.S.; Investigation, J.S. and L.T.-C.; Resources, J.S. and L.T.-C.; Data Curation, J.S.; Writing—Original Draft Preparation, J.S. and L.T.-C.; Writing—Review & Editing, J.S. and L.T.-C.; Visualization, J.S. and L.T.-C.; Funding Acquisition, J.S.
Funding
This work was supported by the project I-MAESTRO. Project Innovative forest MAnagEment STrategies for a Resilient biOeconomy under climate change and disturbances (I-MAESTRO) is supported under the umbrella of ForestValue ERA-NET Cofund by the National Science Centre, Poland and French Ministry of Agriculture, Agrifood, and Forestry; French Ministry of Higher Education, Research and Innovation, German Federal Ministry of Food and Agriculture (BMEL) via Agency for Renewable Resources (FNR), Slovenian Ministry of Education, Science and Sport (MIZS). ForestValue has received funding from the European Union’s Horizon 2020 research and innovation programme under grant agreement N° 773324.
Conflicts of Interest
The authors declare no conflicts of interest.
References
- Pretzsch, H.; Grote, R.; Reineking, B.; Rötzer, T.; Seifert, S. Models for forest ecosystem management: A European perspective. Ann. Bot. 2008, 101, 1065–1087. [Google Scholar] [CrossRef] [PubMed]
- Monserud, R.A.; Moody, U.; Breuer, D.W. A soil-site study for inland Douglas-fir. Can. J. For. Res. 1990, 20, 686–695. [Google Scholar] [CrossRef]
- Sharma, R.P.; Brunner, A.; Eid, T. Site index prediction from site and climate variables for Norway spruce and Scots pine in Norway. Scand. J. For. Res. 2012, 27, 619–636. [Google Scholar] [CrossRef]
- Skovsgaard, J.P.; Vanclay, J.K. Forest site productivity: A review of the evolution of dendrometric concepts for even-aged stands. Forestry 2008, 81, 13–31. [Google Scholar] [CrossRef]
- Weiskittel, A.R.; Hann, D.W.; Kershaw, J.A., Jr.; Vanclay, J.K. Forest Growth and Yield Modeling; Wiley-Blackwel: Chichester, UK, 2011. [Google Scholar]
- Cieszewski, C.J.; Strub, M. Parameter Estimation of Base—Age Invariant Site Index Models: Which Data Structure to Use?—A Discussion. For. Sci. 2007, 53, 552–555. [Google Scholar]
- Mathiasen, R.L.; Olsen, W.K.; Olsen, W.K.; Edminster, C.B. Site Index Curves for White Fir in the Southwestern United States Developed Using a Guide Curve Method. West. J. Appl. For. 2006, 21, 87–93. [Google Scholar]
- Cieszewski, C.J.; Harrison, M.; Martin, S.W. Examples of Practical Methods for Unbiased Parameter Estimation in Self-Referencing Functions. In Proceedings of the First International Conference on Measurements and Quantitative Methods and Management and The 1999 Southern Mensurationists Meeting, Jekyll Island, Athens, GA, USA, 17–18 November 1999; D.B. Warnell School of Forest Resources, University of Georgia: Athens, GA, USA, 2000; p. 207. [Google Scholar]
- Bailey, R.L.; Clutter, J.L. Base-age invariant polymorphic site curves. For. Sci. 1974, 20, 155–159. [Google Scholar]
- Cieszewski, C.J.; Zasada, M. Dynamiczna forma anamorficznego modelu bonitacyjnego dla sosny pospolitej w Polsce. Sylwan 2002, 146, 17–24. [Google Scholar]
- Cieszewski, C.J.; Zasada, M. Model bonitacyjny dla sosny na podstawie tablic zasobności Szymkiewicza. Sylwan 2003, 147, 51–62. [Google Scholar]
- Cieszewski, J.; Bailey, L. Generalized Algebraic Difference Approach: Theory Based Derivation of Dynamic Site Equations with Polymorphism and Variable Asymptotes. For. Sci. 2000, 46, 116–126. [Google Scholar]
- Perin, J.; Hébert, J.; Brostaux, Y.; Lejeune, P.; Claessens, H. Modelling the top-height growth and site index of Norway spruce in Southern Belgium. For. Ecol. Manag. 2013, 298, 62–70. [Google Scholar] [CrossRef]
- Raulier, F.; Lambert, M.-C.; Pothier, D.; Ung, C.-H. Impact of dominant tree dynamics on site index curves. For. Ecol. Manag. 2003, 184, 65–78. [Google Scholar] [CrossRef]
- Sharma, R.P.; Brunner, A.; Eid, T.; Øyen, B.-H. Modelling dominant height growth from national forest inventory individual tree data with short time series and large age errors. For. Ecol. Manag. 2011, 262, 2162–2175. [Google Scholar] [CrossRef]
- Weiskittel, A.R.; Hann, D.W.; Hibbs, D.E.; Lam, T.Y.; Bluhm, A. Modeling top height growth of red alder plantations. For. Ecol. Manag. 2009, 258, 323–331. [Google Scholar] [CrossRef]
- Socha, J.; Pierzchalski, M.; Bałazy, R.; Ciesielski, M. Modelling top height growth and site index using repeated laser scanning data. For. Ecol. Manag. 2017, 406, 307–3017. [Google Scholar] [CrossRef]
- Osborne, J.G.; Schumacher, F.X. The construction of normal-yield and stand tables for even-aged timber stands. J. Agric. Res. 1935, 51, 547–564. [Google Scholar]
- Antony, D.A.; Singh, G. Model-Based Outlier Detection System with Statistical Preprocessing. J. Mod. Appl. Stat. Methods 2016, 15, 39. [Google Scholar]
- Tukey, J.W. Model-Based Outlier Detection System with. In Exploratory Data Analysis; Addison-Wesley Publishing Company: Boston, MA, USA, 1977; p. 15. [Google Scholar]
- Cieszewski, C.J. Developing a Well-Behaved Dynamic Site Equation Using a Modified Hossfeld IV Function Y 3 = (axm)/(c + x m–1), a Simplified Mixed-Model and Scant Subalpine Fir Data. For. Sci. 2003, 49, 539–554. [Google Scholar]
- Goelz, J.C.G.; Burk, T.E. Development of a well-behaved site index equation: Jack pine in north central Ontario. Can. J. For. Res. 1992, 22, 776–784. [Google Scholar] [CrossRef]
- Cieszewski, C.J.; Strub, M.; Zasada, M. New dynamic site equation that fits best the Schwappach data for Scots pine (Pinus sylvestris L.) in Central Europe. For. Ecol. Manag. 2007, 243, 83–93. [Google Scholar] [CrossRef]
- Socha, J.; Ochał, W.; Grabczyński, S.; Maj, M. Modele bonitacyjne dla gatunków lasotwórczych Polski opracowane na podstawie tablic zasobności. Sylwan 2015, 159, 639–649. [Google Scholar]
- Socha, J.; Orzeł, S. Dynamiczne krzywe bonitacyjne dla drzewostanów sosnowych Puszczy Niepołomickiej. Sylwan 2011, 155, 301–312. [Google Scholar]
- Socha, J.; Orzeł, S. Dynamic site index curves for Scots pine (Pinus sylvestris L.) in southern Poland. Sylwan 2013, 157, 26–38. [Google Scholar]
- Cieszewski, C.J. Three methods of deriving advanced dynamic site equations demonstrated on inland Douglas-fir site curves. Can. J. For. Res. 2001, 31, 165–173. [Google Scholar] [CrossRef]
- Socha, J.; Ochał, W. Dynamic site index model and trends in changes of site productivity for Alnus glutinosa (L.) Gaertn. in southern Poland. Dendrobiology 2017, 77, 45–57. [Google Scholar] [CrossRef]
- R D.C.T. R: A Language and Environment for Statistical Computing; R Foundation for Statistical Computing: Vienna, Austria, 2017; Available online: http://www.R-project.org (accessed on 28 June 2019).
- Socha, J.; Bruchwald, A.; Neroj, B.; Gruba, P.; Wertz, B.; Ochał, W.; Pierzchalski, M. Summary of the research project “Actual and potential site productivity in Poland for main forest forming tree species”. Unpublished, Report of the research project, Faculty of Forestry, University of Agriculture in Krakow. 2017. [Google Scholar]
- Nothdurft, A.; Wolf, T.; Ringeler, A.; Böhner, J.; Saborowski, J. Spatio-temporal prediction of site index based on forest inventories and climate change scenarios. For. Ecol. Manag. 2012, 279, 97–111. [Google Scholar] [CrossRef]
- Tegnhammar, L. On the Estimation of Site Index for Norway Spruce; Department of Forest Survey, Swedish University of Agricultural Sciences: Uppsala, Sweden, 1992; Volume 53, p. 259. [Google Scholar]
- Yue, C.; Mäkinen, H.; Klädtke, J.; Kohnle, U. An approach to assessing site index changes of Norway spruce based on spatially and temporally disjunct measurement series. For. Ecol. Manag. 2014, 323. [Google Scholar] [CrossRef]
- Albert, M.; Schmidt, M. Climate-sensitive modelling of site-productivity relationships for Norway spruce (Picea abies (L.) Karst.) and common beech (Fagus sylvatica L.). For. Ecol. Manag. 2010, 259, 739–749. [Google Scholar] [CrossRef]
- Elfving, B.; Tegnhammar, L. Trends of tree growth in Swedish forests 1953−1992: An analysis based on sample trees from the national forest inventory. Scand. J. For. Res. 1996, 11, 26–37. [Google Scholar] [CrossRef]
- Socha, J. Effect of topography and geology on the site index of Picea abies in the West Carpathian, Poland. Scand. J. For. Res. 2008, 23, 203–213. [Google Scholar] [CrossRef]
- Socha, J.; Coops, N.; Ochal, W. Assessment of age bias in site index equations. iForest–Biogeosci. For. 2016, 9, 402. [Google Scholar] [CrossRef]
- Johansson, T. Site index curves for Norway spruce plantations on farmland with different soil types. Studia For. Suec. 1995, 198, 1–19. [Google Scholar]
- Adams, J.P.; Matney, T.G.; Land, S.B., Jr.; Belli, K.L.; Duzan, H.W., Jr. Incorporating genetic parameters into a loblolly pine growth-and-yield model. Can. J. For. Res. 2006, 36, 1959–1967. [Google Scholar] [CrossRef]
- Buford, M.A.; Burkhart, H.E. Genetic Improvement Effects on Growth and Yield of Loblolly Pine Plantations. For. Sci. 1987, 33, 707–724. [Google Scholar]
- Alvarez-González, J.G.; Ruiz-González, A.D.; Rodríguez-Soalleiro, R.; Barrio-Anta, M. Ecorregional site index models for Pinus pinaster in Galicia (northwestern Spain). Ann. For. Sci. 2005, 62, 115–127. [Google Scholar] [CrossRef]
- Monserud, R.A.; Rehfeldt, G.E. Genetic and Environmental Components of Variation of Site Index in Inland Douglas-Fir. For. Sci. 1990, 36, 1–9. [Google Scholar]
© 2019 by the authors. Licensee MDPI, Basel, Switzerland. This article is an open access article distributed under the terms and conditions of the Creative Commons Attribution (CC BY) license (http://creativecommons.org/licenses/by/4.0/).