Investigating Relationships between Nutrient Concentrations, Stem Sinuosity, and Tree Improvement in Douglas-Fir Stands in Western Washington


Abstract
1. Introduction
2. Materials and Methods
- Donkey Creek (47°19′08.5″ N, 123°47′59.2″ W);
- Crane Creek (47°23′41.2″ N, 124°03′38.9″ W);
- Donaldson Creek (46°37′59.6″ N, 123°45′59.8″ W).
2.1. Chemical Analyses
2.2. Statistical Analysis
3. Results
3.1. Univariate Analyses
3.2. Multivariate Analyses
4. Discussion
5. Conclusions
Supplementary Materials
Author Contributions
Funding
Acknowledgments
Conflicts of Interest
References
- Campbell, R.K. Phenotypic Variation and Repeatability of Stem Sinuosity in Douglas-Fir. Northwest Sci. 1965, 39, 47–59. [Google Scholar]
- Warensjö, M.; Rune, G. Stem straightness and compression wood in a 22-year-old stand of container-grown Scots pine trees. Silva Fenn. 2004, 38, 143–153. [Google Scholar] [CrossRef][Green Version]
- Middleton, G.R.; Carter, R.E.; Munro, B.D.; Mackay, J.F.G. Losses in Timber Values Associated with Distorted Growth in Immature Douglas-Fir; FRDA Report; Ministry of Forests and Forestry Canada: Victoria, BC, Canada, 1989.
- Pederick, L.A.; Hopmans, P.; Flinn, D.W.; Abbott, I. Variation in genotypic response to suspected copper deficiency in Pinus radiata. Aust. For. Res. 1984, 14, 75–84. [Google Scholar]
- Downes, G.M.; Moore, G.A.; Turvey, N.D. Variations in response to induced stem bending in seedlings of Pinus radiata. Trees 1994, 8, 151–159. [Google Scholar] [CrossRef]
- McKeand, S.E.; Jokela, E.J.; Huber, D.A.; Byram, T.D.; Allen, H.L.; Li, B.; Mullin, T.J. Performance of improved genotypes of loblolly pine across different soils, climates, and silvicultural inputs. For. Ecol. Manag. 2006, 227, 178–184. [Google Scholar] [CrossRef]
- Espinoza, J.A. Genetic and Nutritional Effects on Stem Sinuosity in Loblolly Pine. Ph.D. Dissertation, North Carolina State University. Available online: https://repository.lib.ncsu.edu/handle/1840.16/4296 (accessed on 23 January 2018).
- Gatch, J.A.; Harrington, T.B.; Price, T.S.; Edwards, M.B. Stem sinuosity, tree size, and pest injury of machneplanted trees with and without bent taproots: A comparison of loblolly and slash pine. In Proceedings of the Tenth Biennial Southern Silvicultural Research Conference, Shreveport, LA, USA, 16–18 February 1999; Haywood, J.D., Ed.; Department of Agriculture, Forest Service, Southern Research Station: Asheville, NC, USA, 1999; pp. 359–361. [Google Scholar]
- Grob, J.A.; Carlson, W.C. Developmental anatomy of shoot growth of terminal leaders of Douglas-fir (Pseudotsuga menziesii (Mirb.) Franco). Plant Physiol. 1994, 105, 53. [Google Scholar]
- Howe, G.T.; Jayawickrama, K.J. Genetics of stem quality in coastal Douglas-fir. In Proceedings of the Genetic Improvement of Wood Quality in Coastal Douglas-Fir and Western Hemlock; Pacific Northwest Tree Improvement Research Cooperative Corvallis: Corvallis, OR, USA, 2002. [Google Scholar]
- Hopmans, P. Stem deformity in Pinus radiata plantations in south-eastern Australia: I. Response to copper fertiliser. Plant Soil 1990, 122, 97–104. [Google Scholar] [CrossRef]
- Ugolini, F.C. Soil Development and Alder Invasion in a Recently Deglaciated Area of Glacier Bay, Alaska. Proc. Symp. Northwest Sci. Assoc. 1968, 40, 115–140. [Google Scholar]
- Perakis, S.S.; Sinkhorn, E.R. Biogeochemistry of a temperate forest nitrogen gradient. Ecol. 2011, 92, 1481–1491. [Google Scholar] [CrossRef]
- Lawrence, G.B.; David, M.B.; Shortle, W.C. A new mechanism for calcium loss in forest-floor soils. Nature 1995, 378, 162–165. [Google Scholar] [CrossRef]
- Lautner, S.; Fromm, J. Calcium-dependent physiological processes in trees. Plant Boil. 2009, 12, 268–274. [Google Scholar] [CrossRef] [PubMed]
- Brown, P.H.; Hu, H. Localization of Boron in Cell Walls of Squash and Tobacco and Its Association with Pectin (Evidence for a Structural Role of Boron in the Cell Wall). Plant Physiol. 1994, 105, 681–689. [Google Scholar]
- Lehto, T.; Ruuhola, T.; Dell, B. Boron in forest trees and forest ecosystems. For. Ecol. Manag. 2010, 260, 2053–2069. [Google Scholar] [CrossRef]
- Carter, R.E.; Miller, I.M.; Klinka, K. Relationships Between Growth Form and Stand Density in Immature Douglas-fir. For. Chron. 1986, 62, 440–445. [Google Scholar] [CrossRef][Green Version]
- Adams, W.T.; Neale, D.B.; Doerksen, A.H.; Smith, D.B. Inheritance and linkage of isozyme variants from seed and vegetative bud tissues in coastal Douglas-fir [Pseudotsugu menziesii var. menziesii (Mirb.) France]. Silvae Genet. 1990, 39, 153–167. [Google Scholar]
- Schweitzer, J.A.; Bailey, J.K.; Rehill, B.J.; Martinsen, G.D.; Hart, S.C.; Lindroth, R.L.; Keim, P.; Whitham, T.G. Genetically based trait in a dominant tree affects ecosystem processes. Ecol. Lett. 2004, 7, 127–134. [Google Scholar] [CrossRef]
- Soil Survey Staff, Natural Resources Conservation Service, United States Department of Agriculture. Web Soil Survey. Available online: https://websoilsurvey.sc.egov.usda.gov/. (accessed on 20 March 2018).
- Maynard, D.G.; Kalra, Y.P. Nitrate and exchangeable ammonium nitrate. In Soil Sampling and Methods of Analysis; Carter, M.R., Ed.; Canadian Society of Soil Science, Lewis Publishers: Ann Arbor, MI, USA, 1999; pp. 25–38. [Google Scholar]
- Mehlich, A. Mehlich 3 soil test extractant: A modification of Mehlich 2 extractant. Commun. Soil Sci. Plant Anal. 1984, 15, 1409–1416. [Google Scholar] [CrossRef]
- Trüby, P.; Aldinger, E. Eine Methode zur Bestimmung austauschbarer Kationen in Waldböden. J. Plant Nutr. Soil Sci. 1989, 152, 301–306. [Google Scholar] [CrossRef]
- USEPA. Method 200.7, Revision 4.4: Determination of Metals and Trace Elements in Water and Wastes by Inductively Coupled Plasma-Atomic Emission Spectrometry; U.S. Environmental Protection Agency: Cincinnati, OH, USA, 1994.
- Wei, T. Package ‘corrplot’. Statistician 2015, 56, 316–324. [Google Scholar]
- Oksanen, J.; Kindt, R.; Legendre, P.; O’Hara, R.B. vegan: Community Ecology Package. R package version 1.8-3. Available online: http://CRAN.R-project.org/ (accessed on 23 January 2018).
- Anderson, M.J.; Braak, C.T. Permutation tests for multi-factorial analysis of variance. J. Stat. Comput. Simul. 2003, 73, 85–113. [Google Scholar] [CrossRef]
- Simpson, G.L. permute: Functions for generating restricted permutations of data. R package version 0.7–0 ed. 2012. [Google Scholar]
- James, J.; Littke, K.; Bonassi, T.; Harrison, R. Exchangeable cations in deep forest soils: Separating climate and chemical controls on spatial and vertical distribution and cycling. Geoderma 2016, 279, 109–121. [Google Scholar] [CrossRef]
- R Core Team. R: A language and environment for statistical computing. Available online: https://www.R-project.org/. (accessed on 20 June 2019).
- Edmonds, R.L.; Binkley, D.; Feller, M.C.; Sollins, P.; Abee, A.; Myrold, D.D. Nutrient Cycling: Effects on Productivity of Northwest Forests. In Maintaining the Long-Term Productivity of Pacific Northwest Forest Ecosystems; Timber Press: Ore, Portland, 1989; pp. 17–35. [Google Scholar]
- Ballard, T.M.; Carter, R.E. Evaluating Forest Stand Nutrient Status; Province of British Columbia, Ministry of Forests: Victoria, BC, Canada, 1986.
- Patterson, M. Stand Management Cooperative, University of Washington, Personal communication, 2017.
- Littke, K.; Zabowski, D. Calcium Uptake, Partitioning, and Sinuous Growth in Douglas-Fir Seedlings. For. Sci. 2007, 53, 692–700. [Google Scholar]
- Pregitzer, C.C.; Bailey, J.K.; Schweitzer, J.A. Genetic by environment interactions affect plant–soil linkages. Ecol. Evol. 2013, 3, 2322–2333. [Google Scholar] [CrossRef] [PubMed]
- Madritch, M.; Donaldson, J.R.; Lindroth, R.L. Genetic Identity of Populus tremuloides Litter Influences Decomposition and Nutrient Release in a Mixed Forest Stand. Ecosyst. 2006, 9, 528–537. [Google Scholar] [CrossRef]
- Adams, W.T.; Howe, G.T. Stem sinuosity measurement in young Douglas-fir progeny tests. In Proceedings of the IUFRO Working Party on Breeding Strategy for Douglas-Fir as an Introduced Species, Vienna, Austria, 10–14 June 1985; Reutz, W., Nather, J., Eds.; Schriftenreihe der Forstlichen Bundesverschsanstalt: Vienna, Austria, 1985; pp. 147–159. [Google Scholar]
- Temel, F.; Adams, W.T. Persistence and Age-Age Genetic Correlations of Stem Defects in Coastal Douglas-Fir (Pseudotsuga Menziesii Var. Menziesii (Mirb.) Franco). For. Genet. 2000, 7, 145–153. [Google Scholar]


| Site | Crane Creek | Donkey Creek | Donaldson Creek |
|---|---|---|---|
| Soil series | Matheny Creek medial silt loam found on till plains | Mopang medial silt loam (Andisol) found on outwash terraces on till plains | Vesta medial silt loam (Andisol) found on mountainous uplands |
| Parent material | Silty alluvium over gravelly glacial outwash | Old alluvium over glacial drift | Residuum weathered from basalt |
| Drainage class | Somewhat poorly drained | Well drained | Well drained |
| Elevation | 58 meters above sea level | 207 meters above sea level | 110 meters above sea level |
| Temperature and precipitation | 230 to 300 centimeters of precipitation per year and 8–10 °C | 230 centimeters of precipitation and 9 °C | 230 centimeters of precipitation and 9 °C |
| Variable | Site | Genetic Gain | Description of Significance, If Any |
|---|---|---|---|
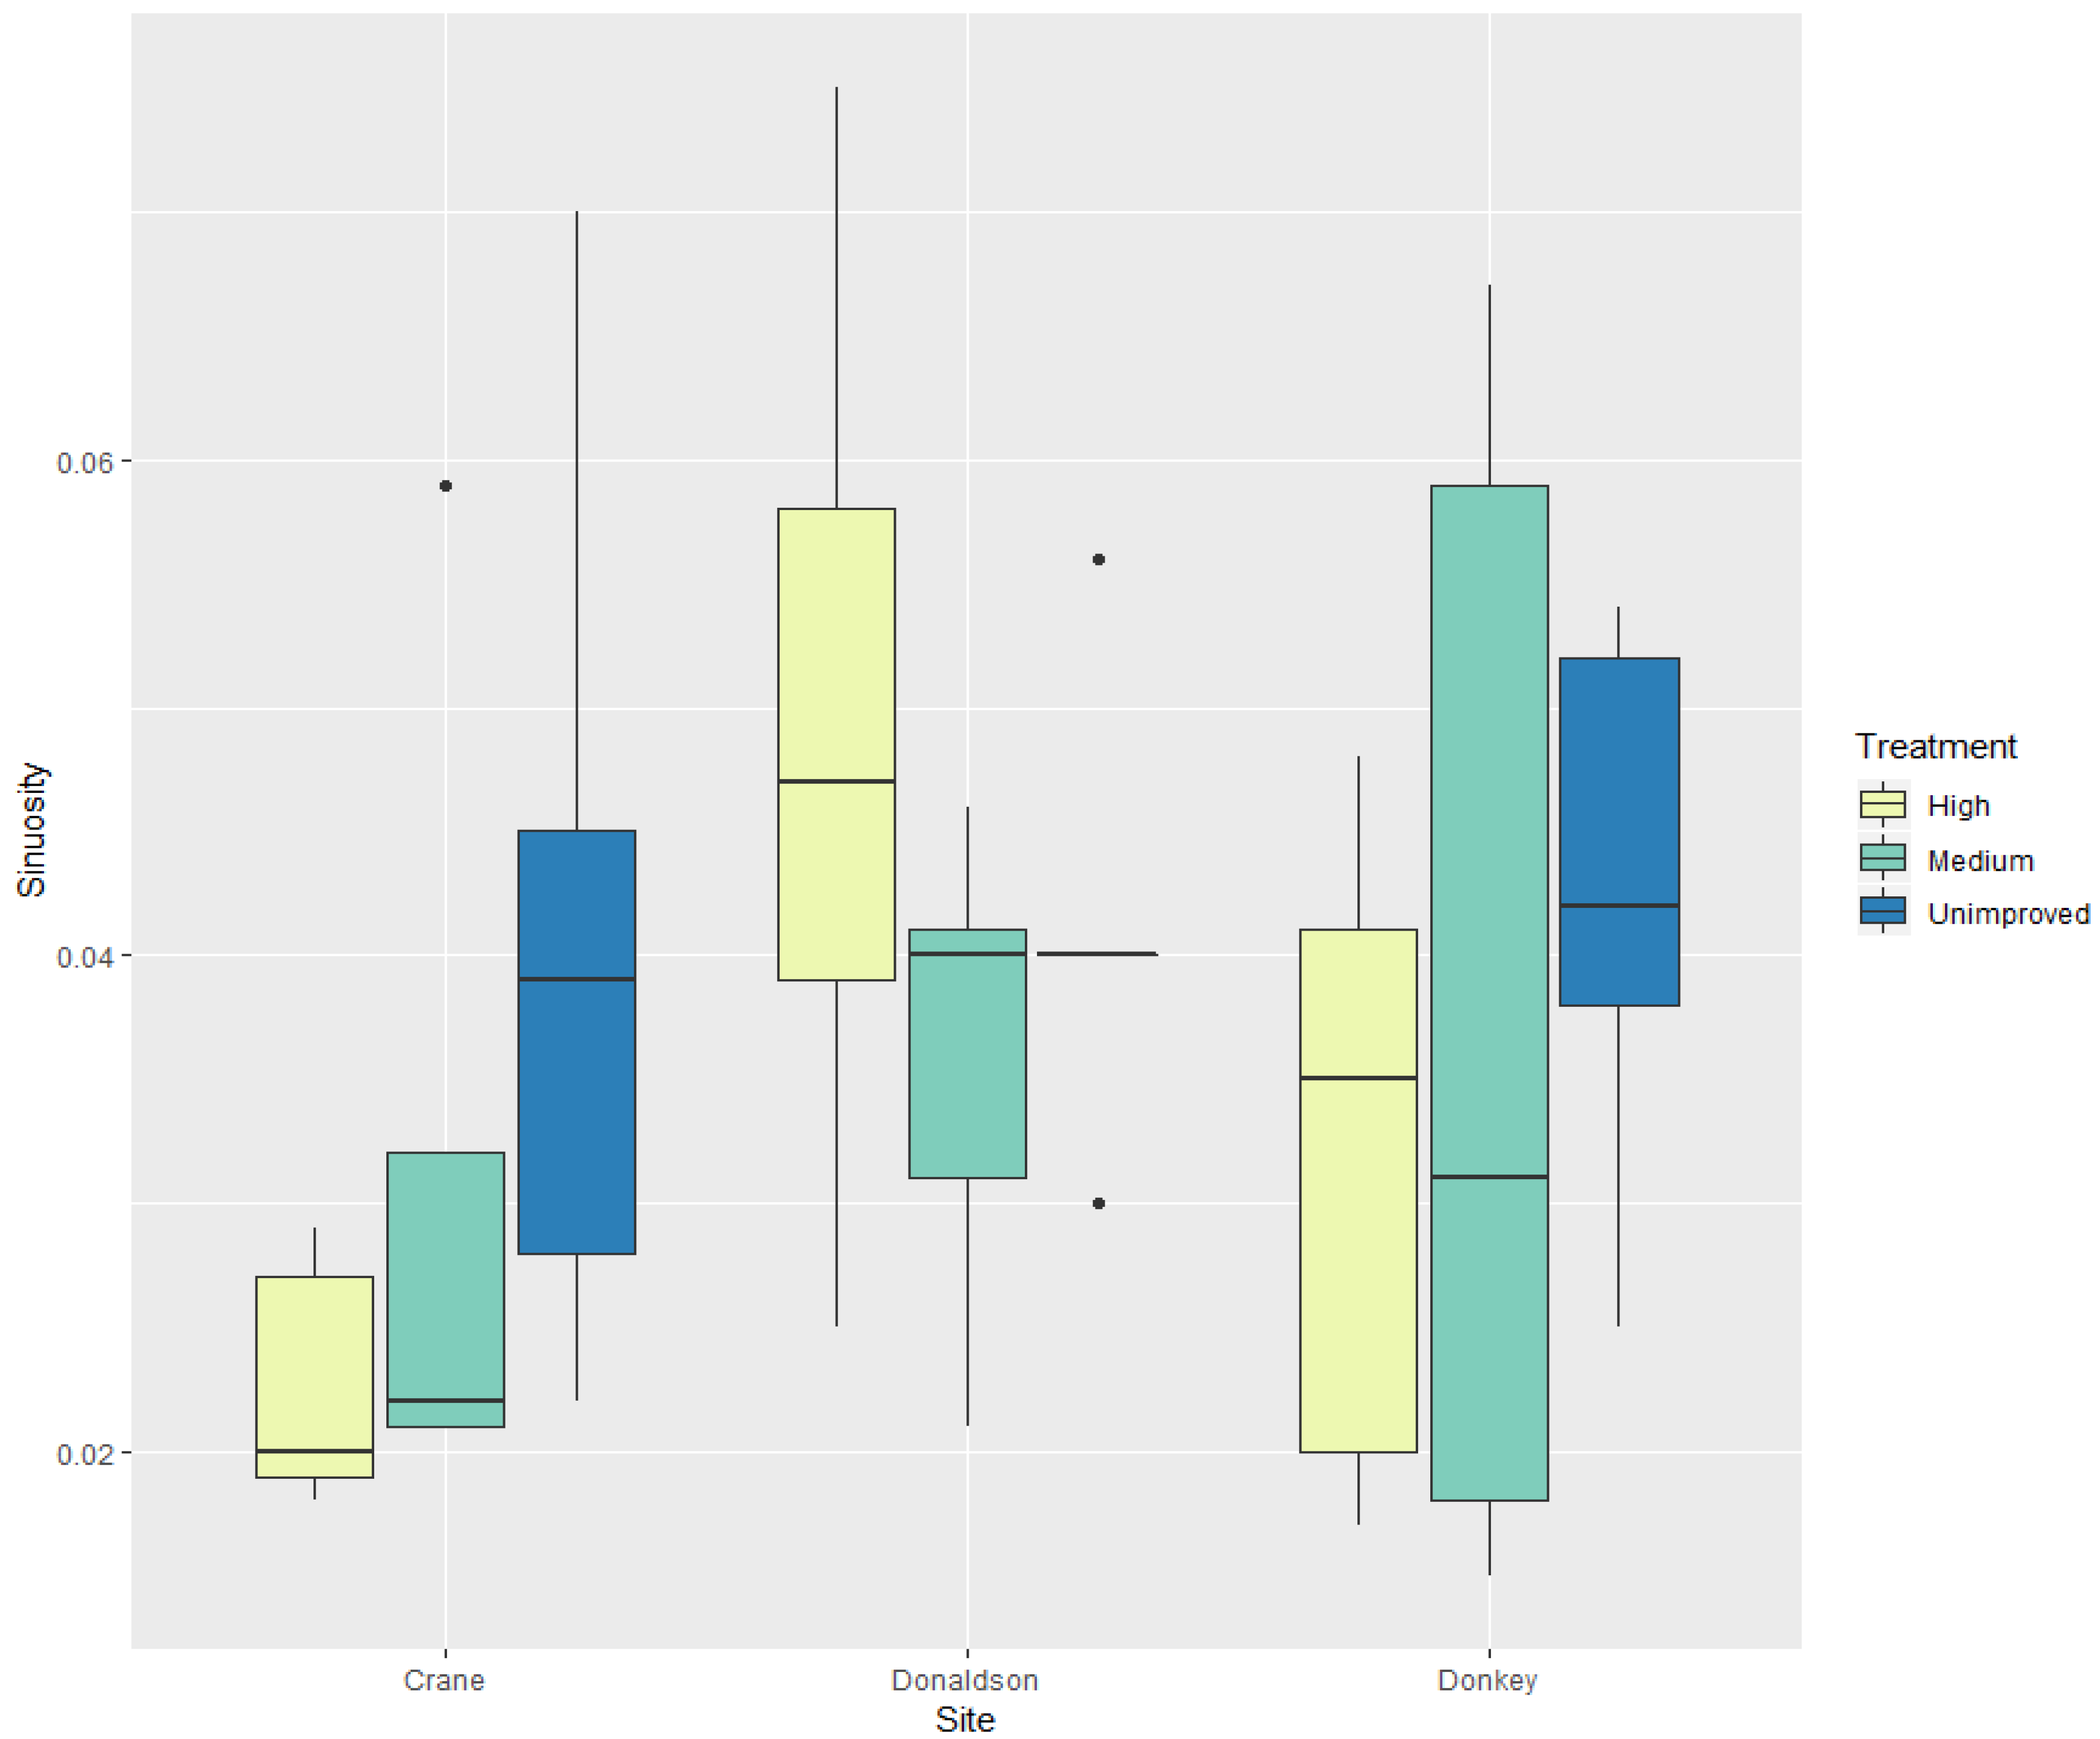
| Sinuosity | *** | *** | Crane Creek had lowest sinuosity, unimproved trees were the most sinuous |
| Tree height | *** | *** | Crane Creek had the shortest trees, unimproved trees were the shortest |
| pH | *** | ns | Crane Creek had lowest pH |
| Bulk density | ns | ||
| Moisture content | ** | ns | Crane Creek had lowest soil moisture |
| 100 needle dry weight | * | ns | Crane Creek had highest needle weight |
| Organic C | ns | ns | |
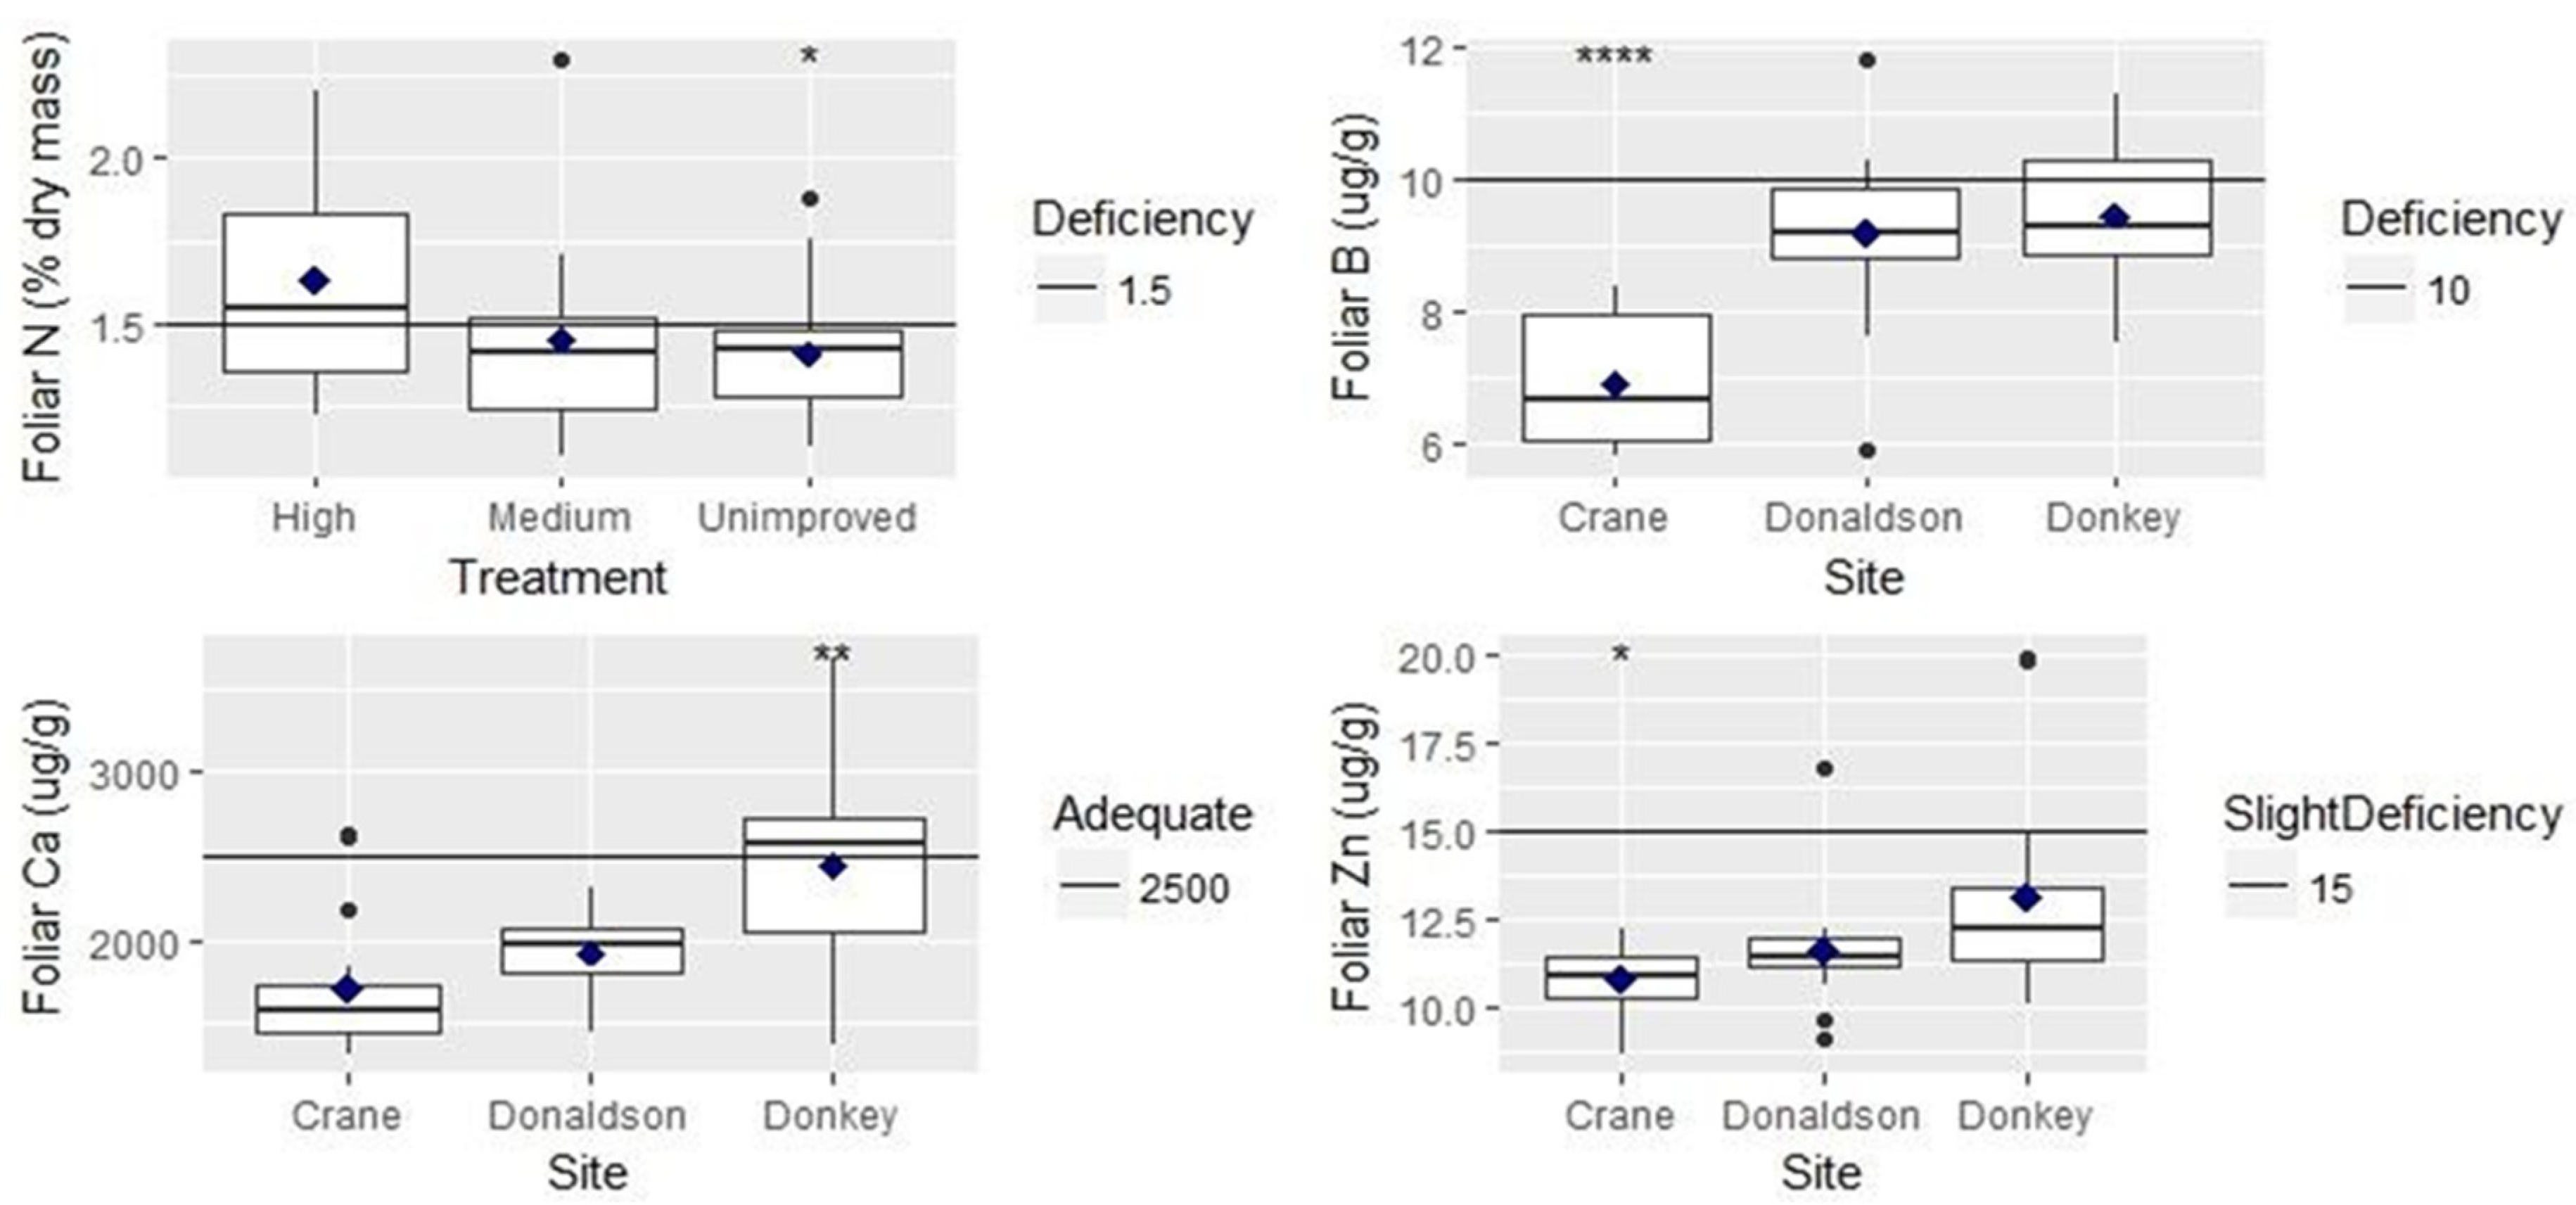
| Foliar nitrogen | ns | Highest genetic gain had highest foliar N | |
| Available soil ammonium | ** | ns | Donkey Creek had highest soil NH4-N |
| Available soil nitrate | ** | ns | Donkey Creek had lowest soil NO3-N |
| Foliar boron | *** | ns | Crane Creek had lowest foliar B |
| Available soil boron | ns | ||
| Foliar calcium | *** | Crane Creek had lowest foliar Ca | |
| Available soil calcium | ns | ns | |
| Foliar copper | ** | ns | Crane Creek had lowest foliar Cu |
| Available soil copper | ** | ns | Crane Creek had lowest soil Cu |
| Foliar magnesium | *** | ns | Crane Creek had lowest foliar Mg |
| Available soil magnesium | ns | ns | |
| Foliar manganese | *** | ns | Crane Creek had lowest foliar Mn |
| Available soil manganese | *** | ns | Crane Creek had lowest soil Mn |
| Foliar zinc | * | ns | Crane Creek had lowest foliar Zn |
| Available soil zinc | ns | ||
| Foliar sulphur | * | ns | Donkey Creek had highest foliar S |
© 2019 by the authors. Licensee MDPI, Basel, Switzerland. This article is an open access article distributed under the terms and conditions of the Creative Commons Attribution (CC BY) license (http://creativecommons.org/licenses/by/4.0/).
Share and Cite
Dwivedi, P.; Sucre, E.; Turnblom, E.C.; Harrison, R.B. Investigating Relationships between Nutrient Concentrations, Stem Sinuosity, and Tree Improvement in Douglas-Fir Stands in Western Washington. Forests 2019, 10, 541. https://doi.org/10.3390/f10070541
Dwivedi P, Sucre E, Turnblom EC, Harrison RB. Investigating Relationships between Nutrient Concentrations, Stem Sinuosity, and Tree Improvement in Douglas-Fir Stands in Western Washington. Forests. 2019; 10(7):541. https://doi.org/10.3390/f10070541
Chicago/Turabian StyleDwivedi, Pranjal, Eric Sucre, Eric C. Turnblom, and Robert B. Harrison. 2019. "Investigating Relationships between Nutrient Concentrations, Stem Sinuosity, and Tree Improvement in Douglas-Fir Stands in Western Washington" Forests 10, no. 7: 541. https://doi.org/10.3390/f10070541
APA StyleDwivedi, P., Sucre, E., Turnblom, E. C., & Harrison, R. B. (2019). Investigating Relationships between Nutrient Concentrations, Stem Sinuosity, and Tree Improvement in Douglas-Fir Stands in Western Washington. Forests, 10(7), 541. https://doi.org/10.3390/f10070541