Press-Pulse Odocoileus Virginianus Herbivory in Relict Tsuga Canadensis Stands in the Western Upper Peninsula of Michigan, USA

Abstract
1. Introduction
2. Methods
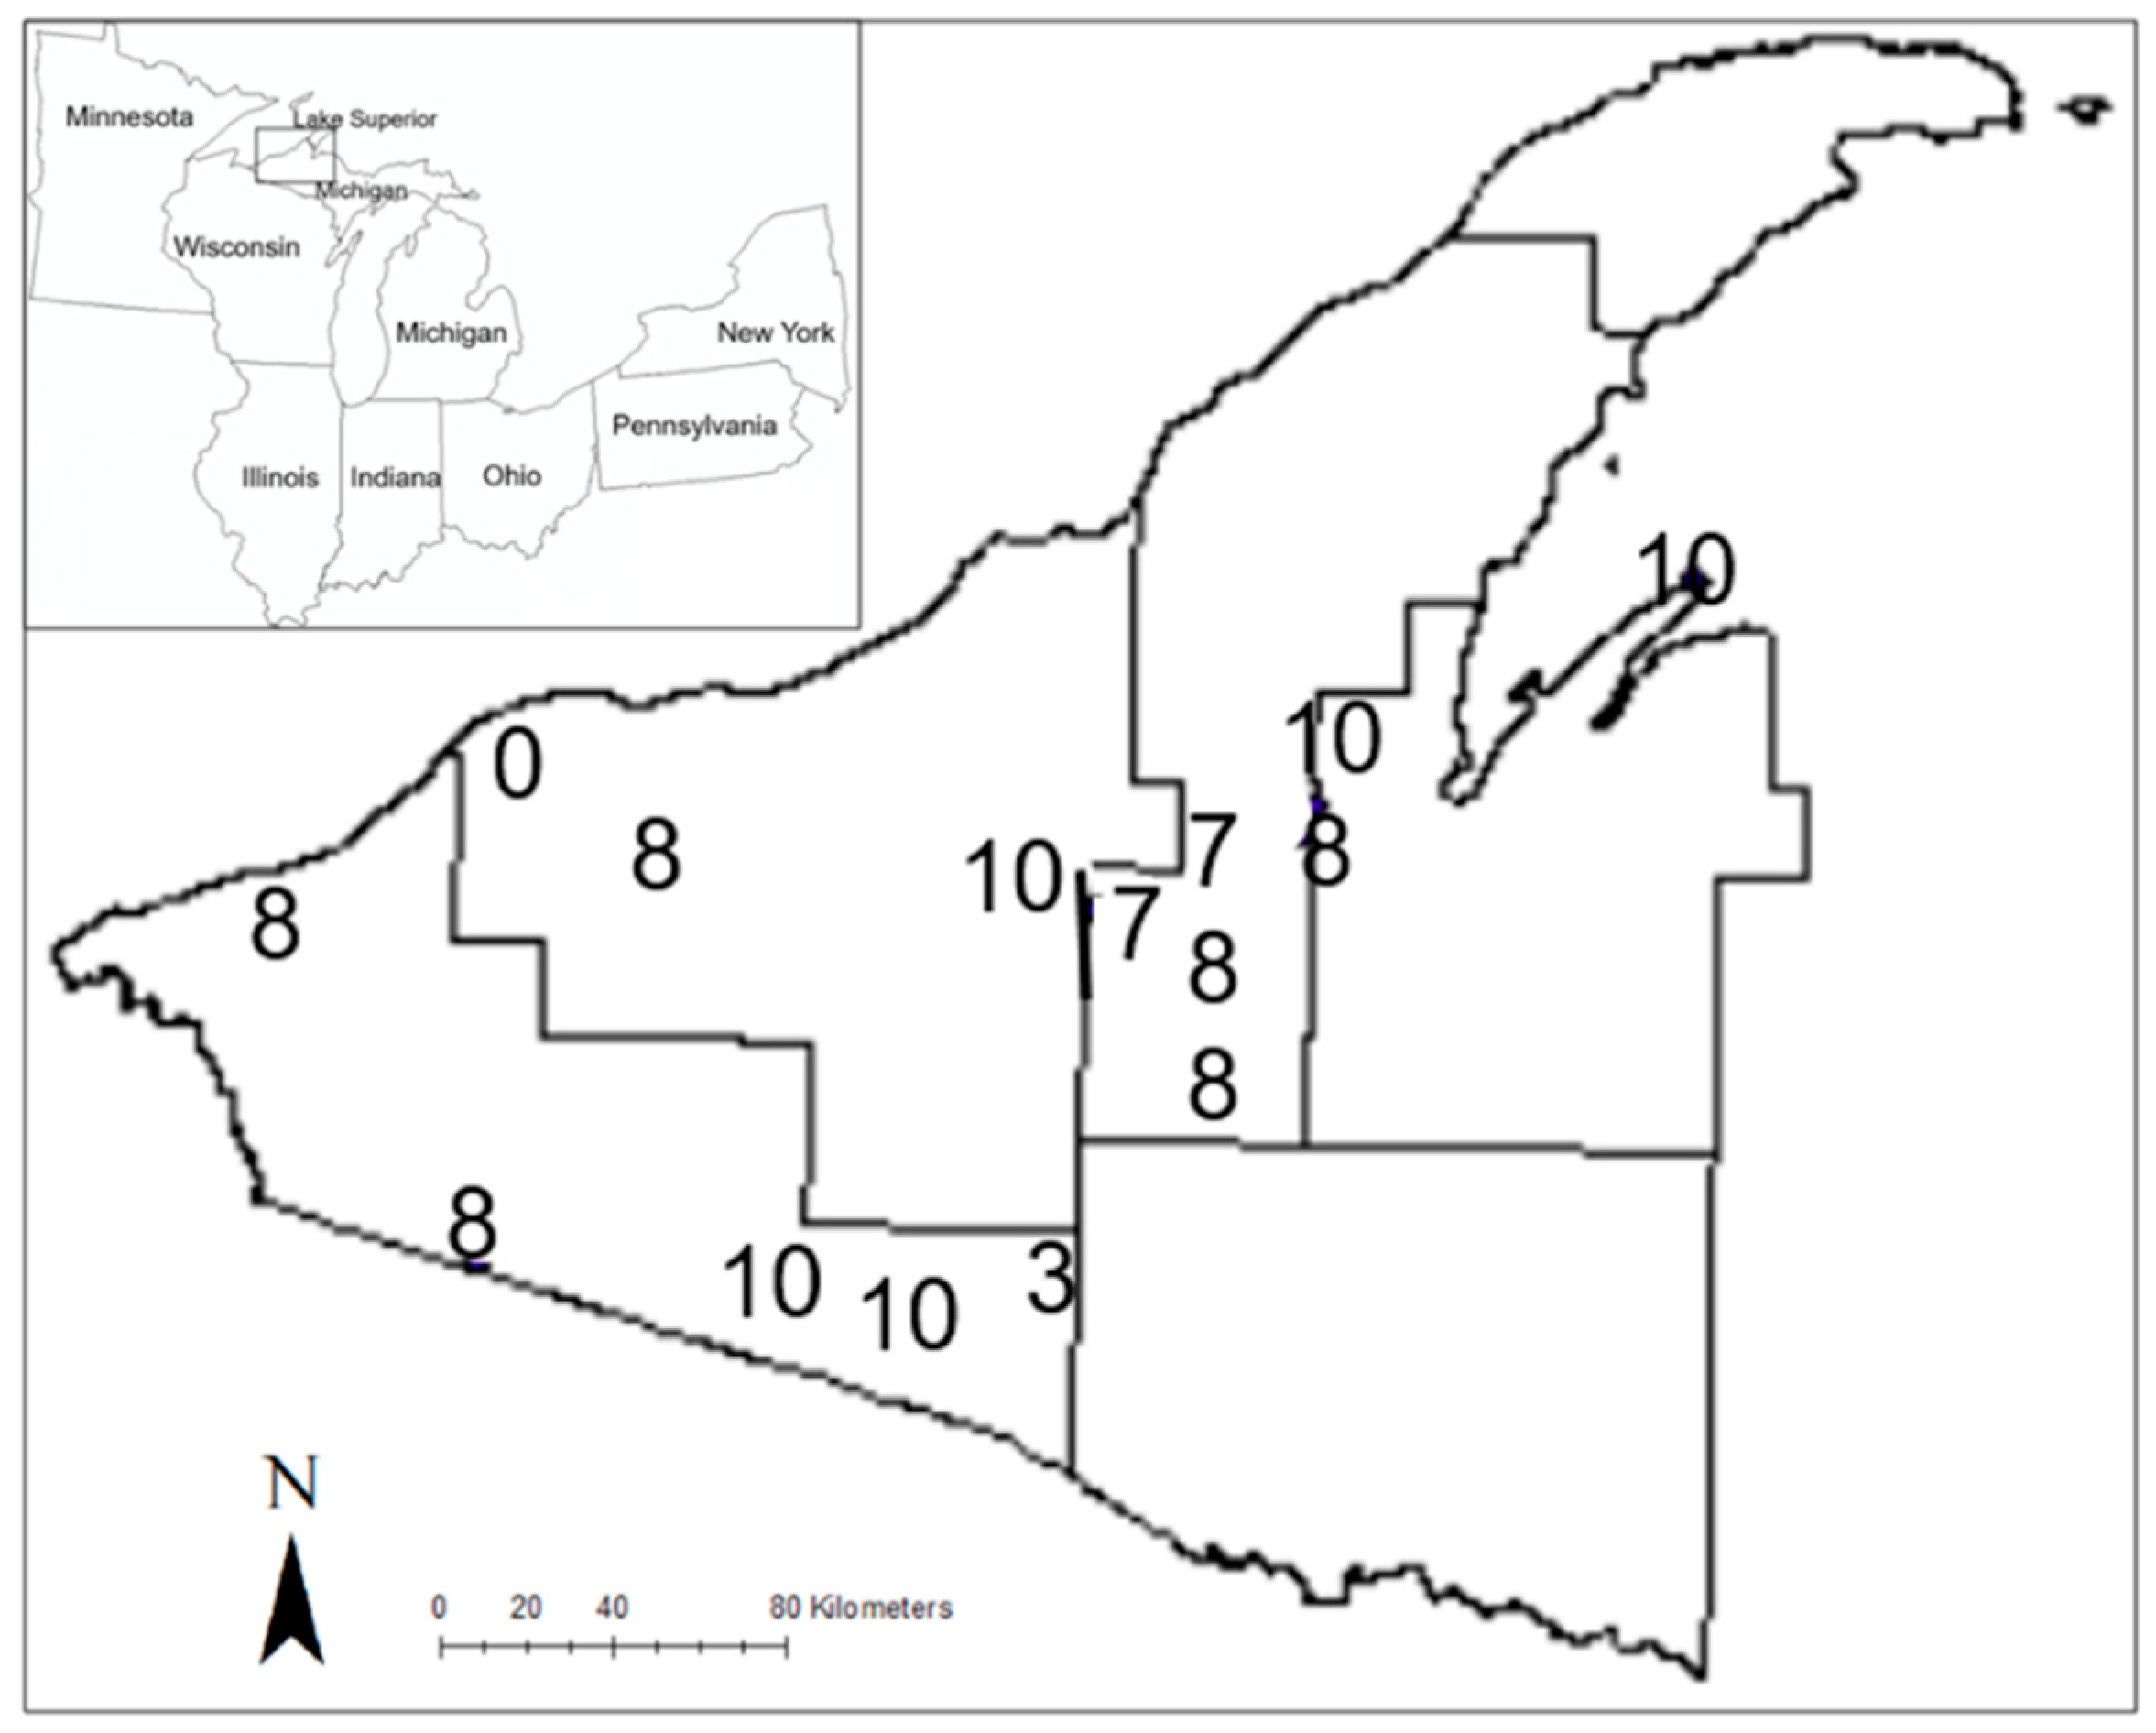
2.1. Study Sites
2.2. Data Collection
2.3. Analytical Methods
3. Results
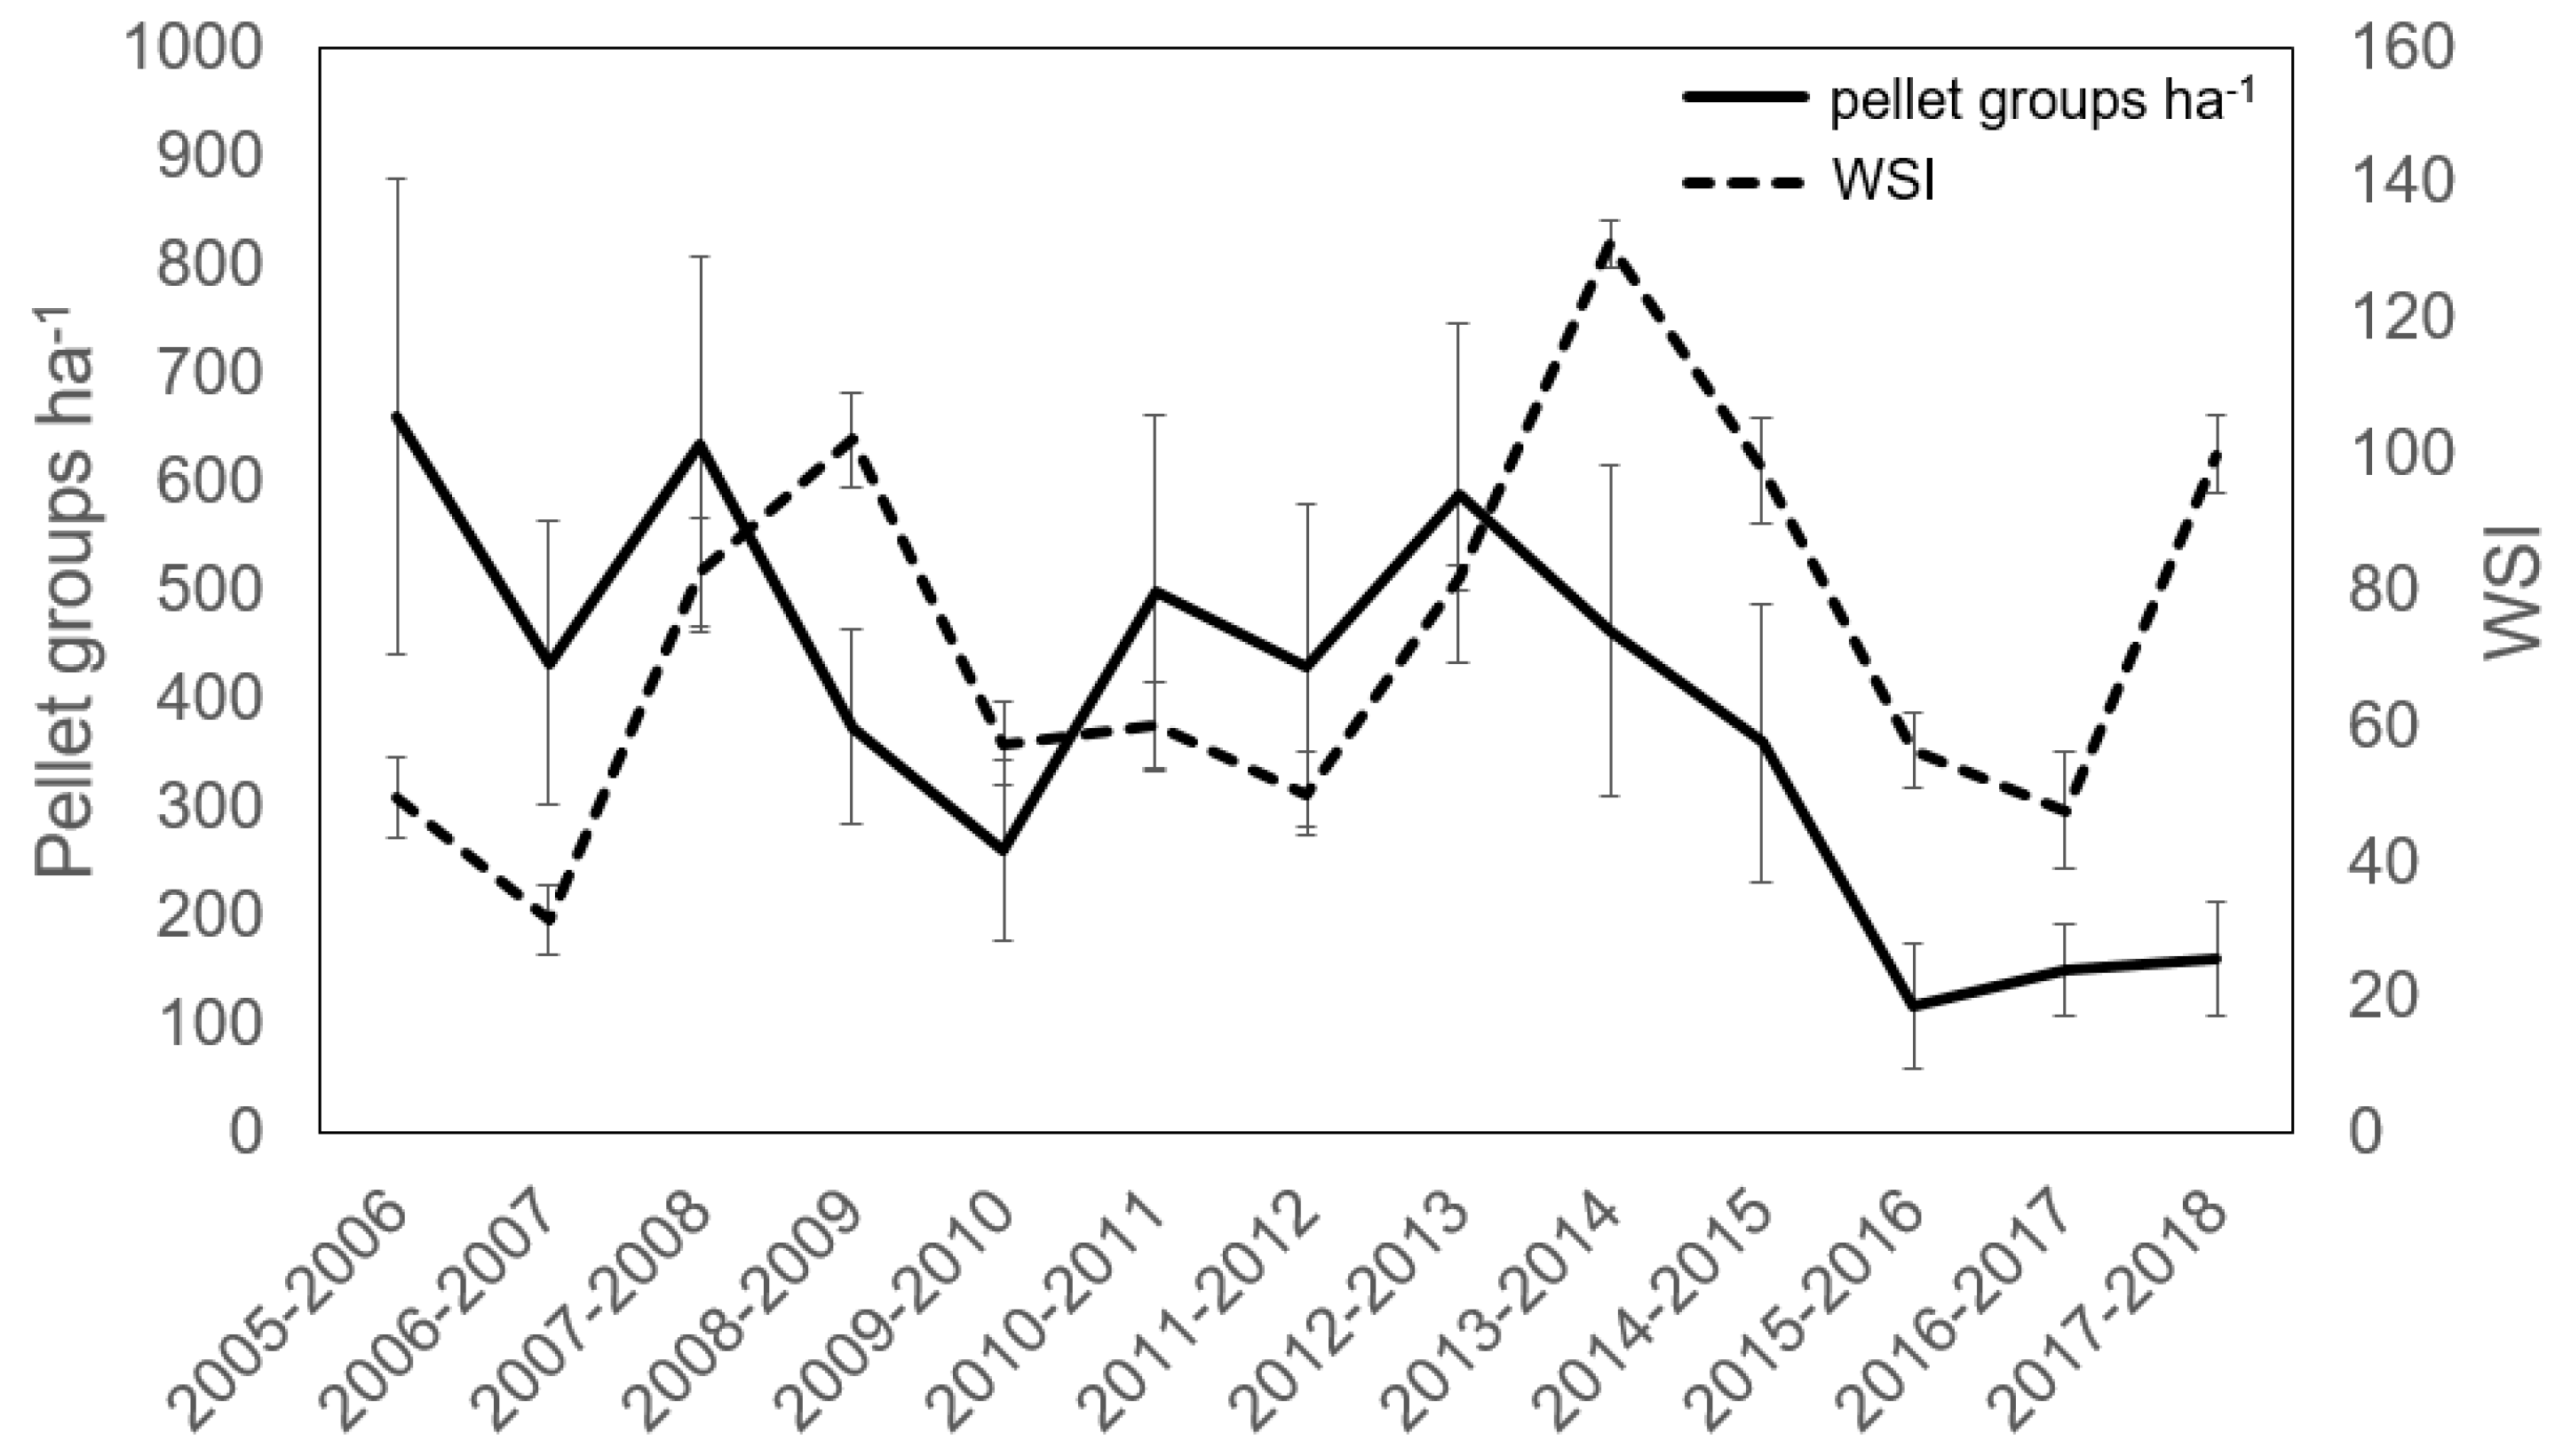
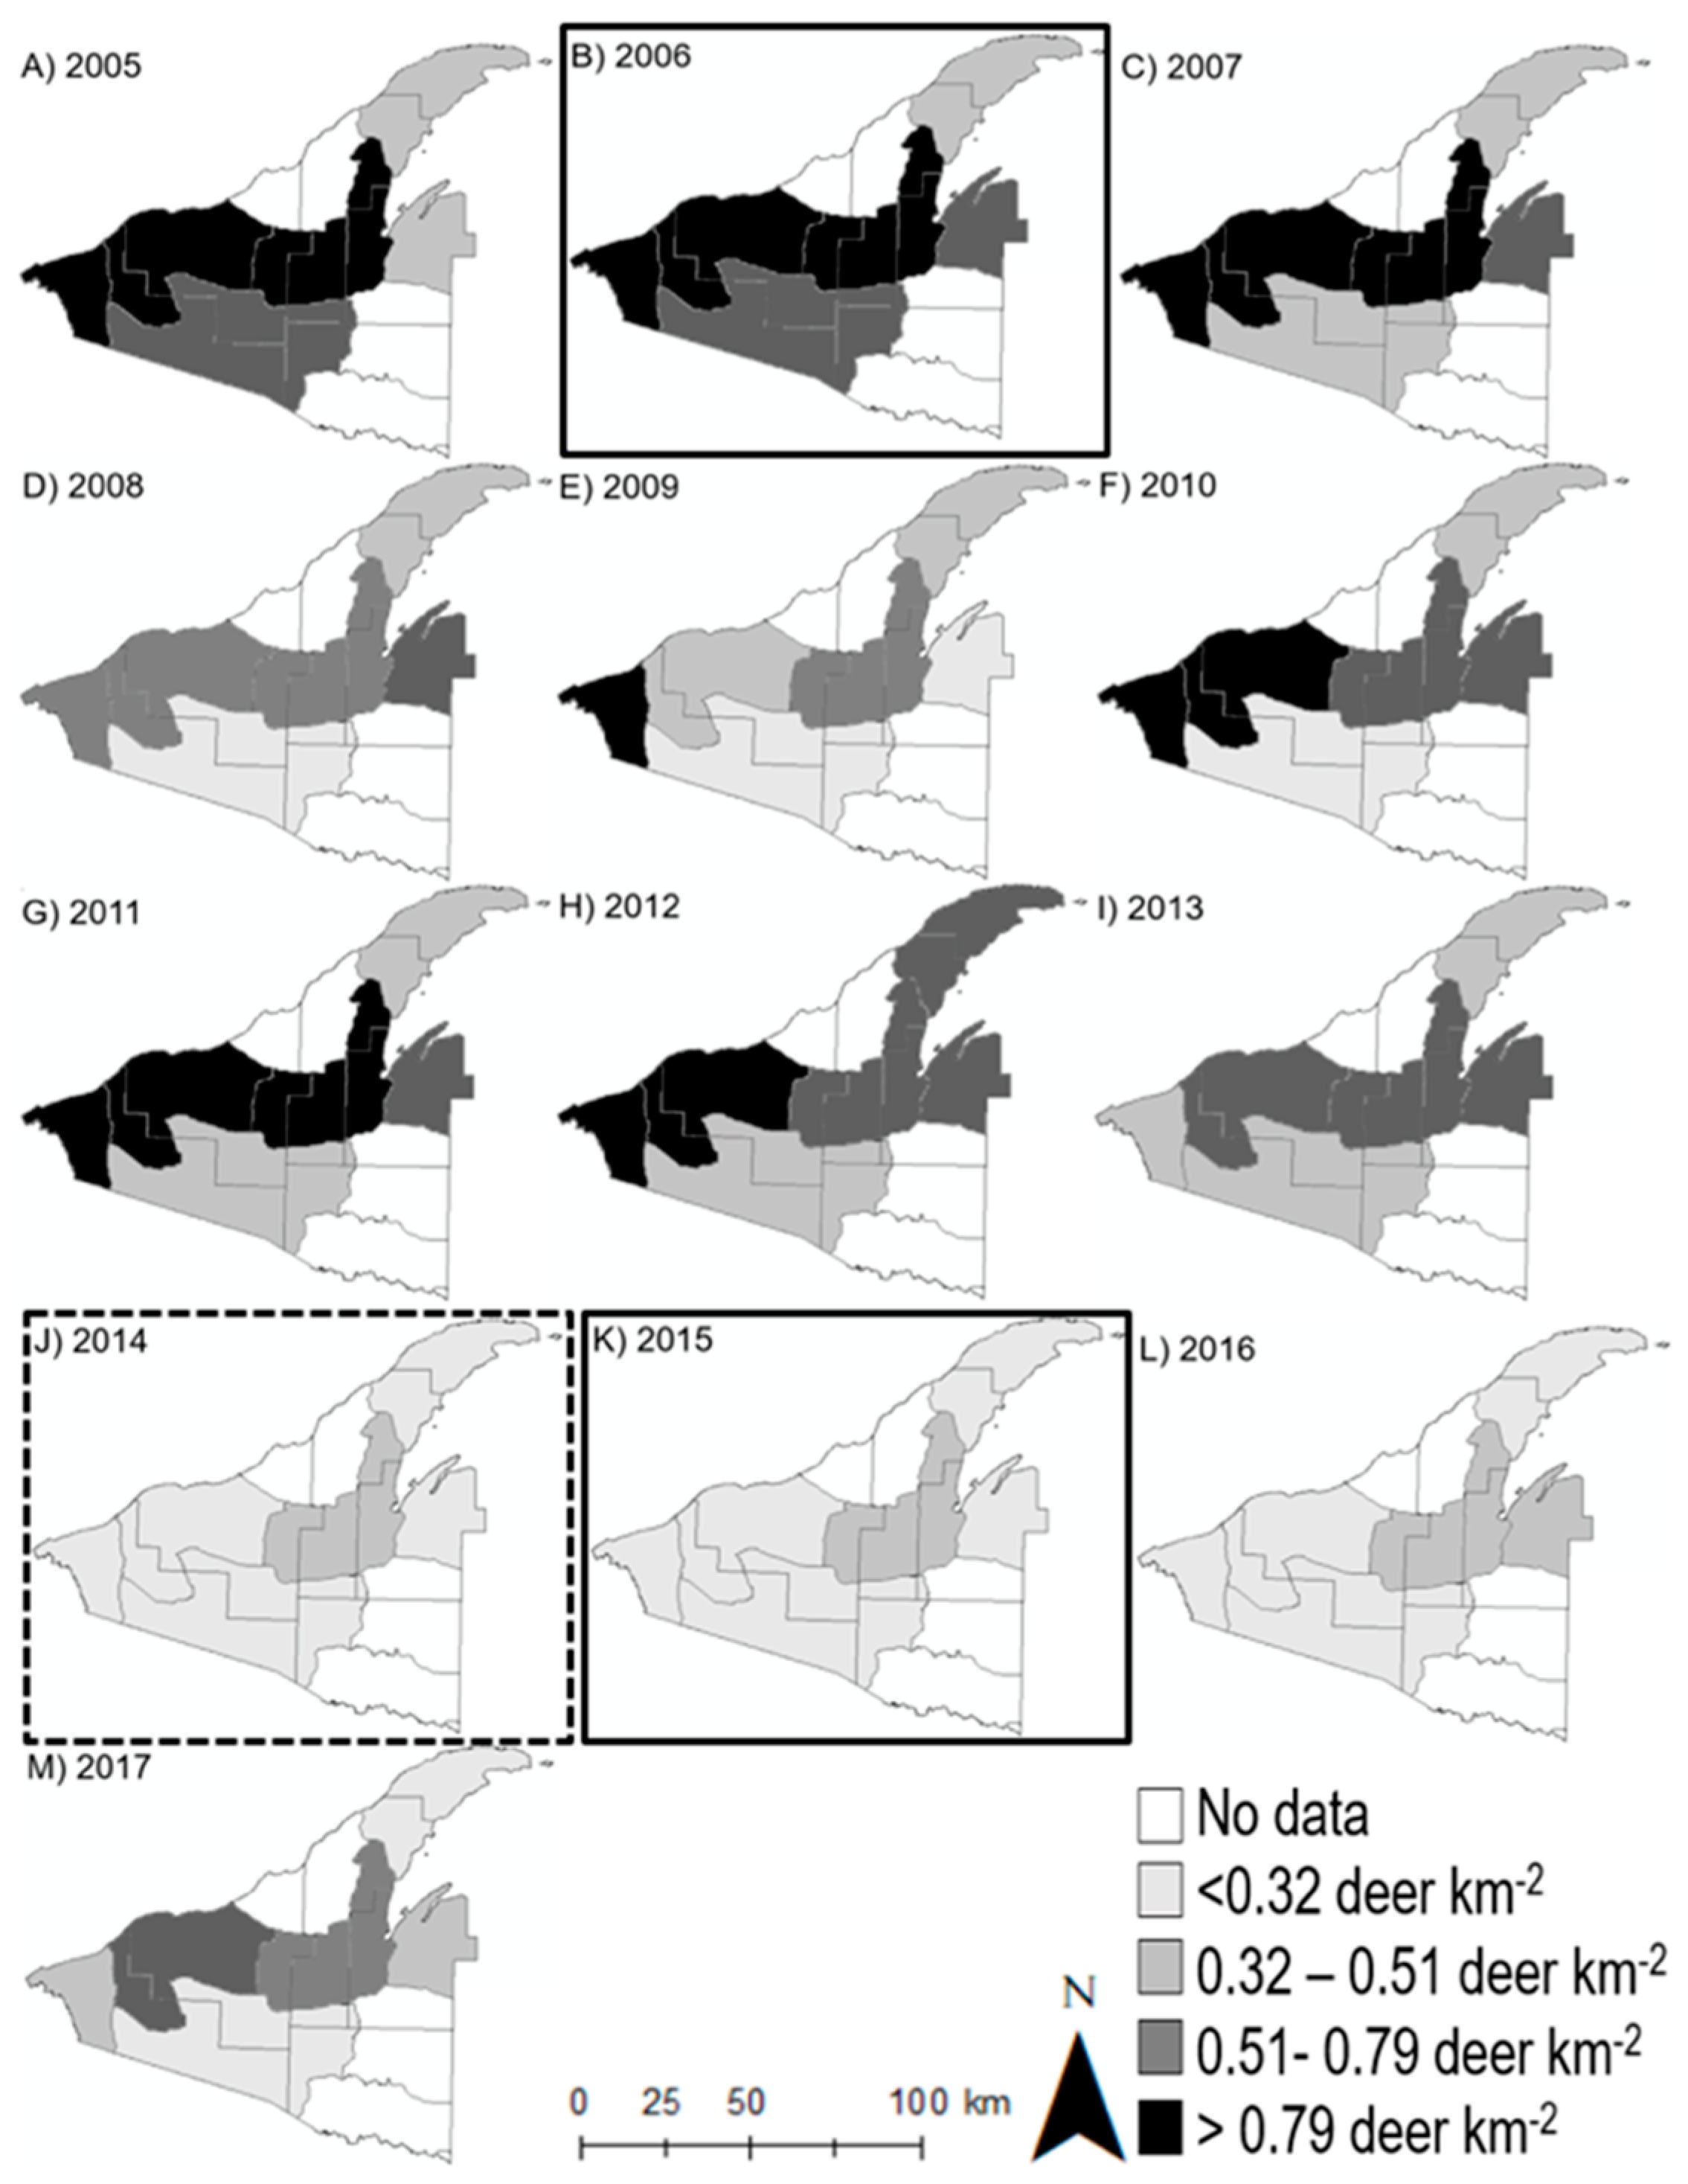
3.1. Deer Use and Abundance
3.2. Overstory Structure
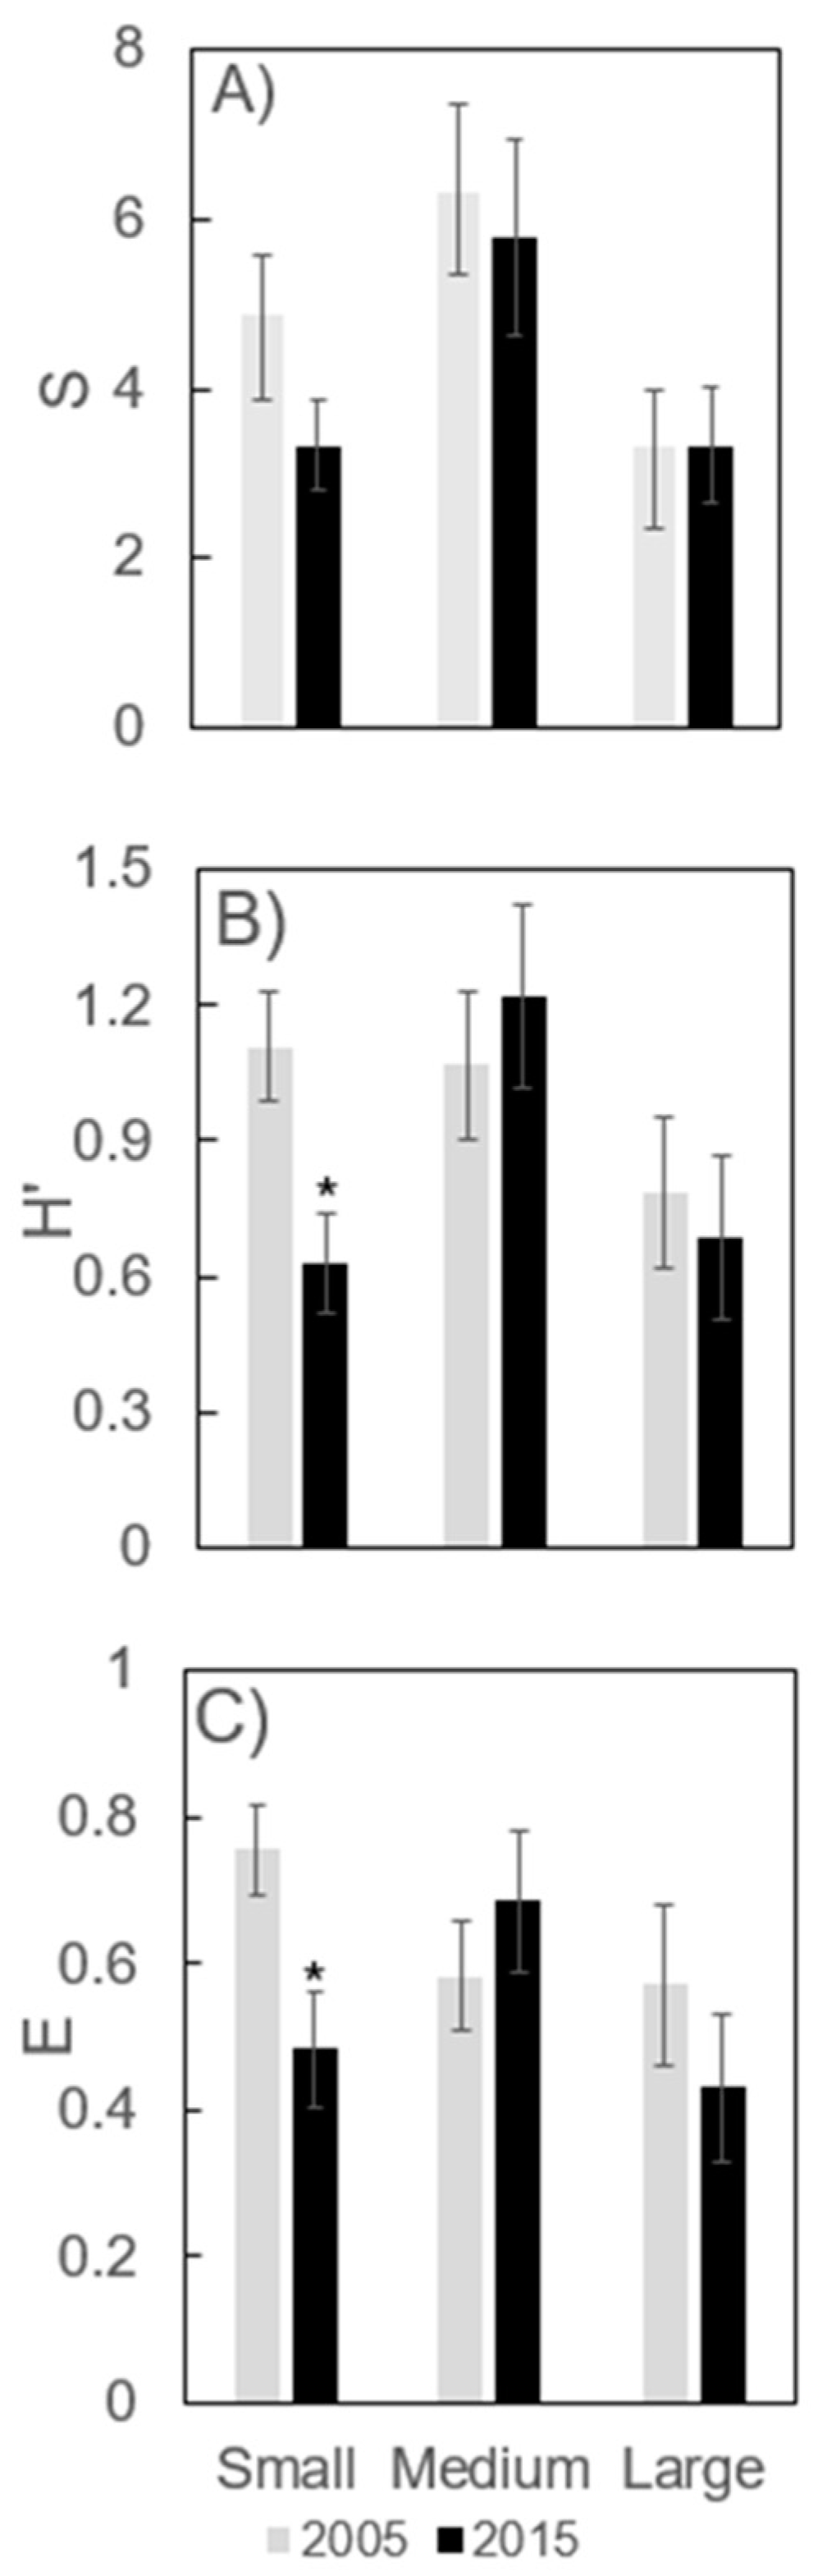
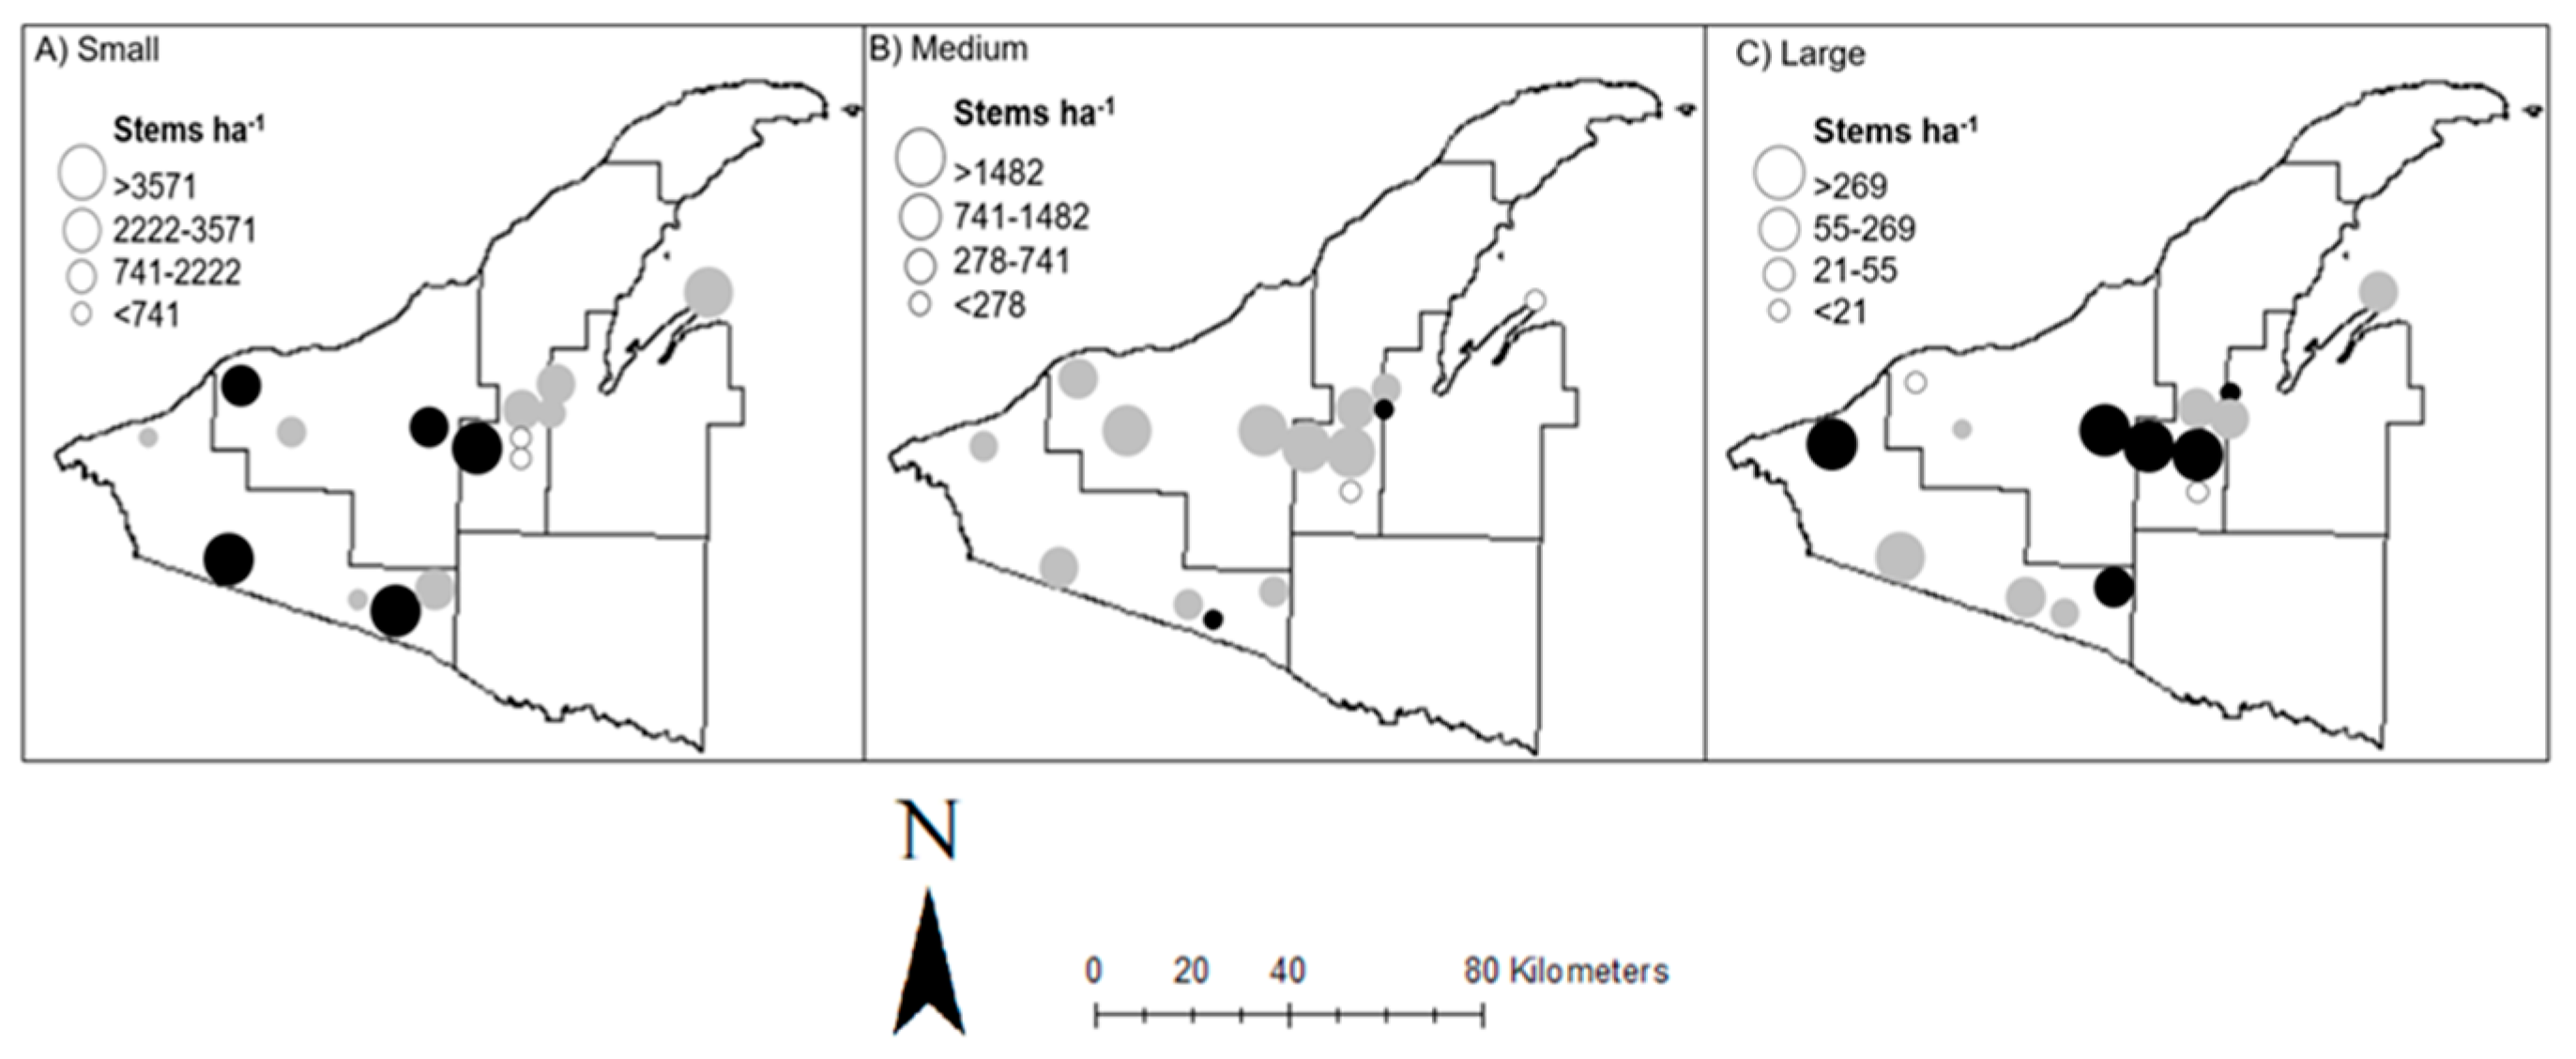
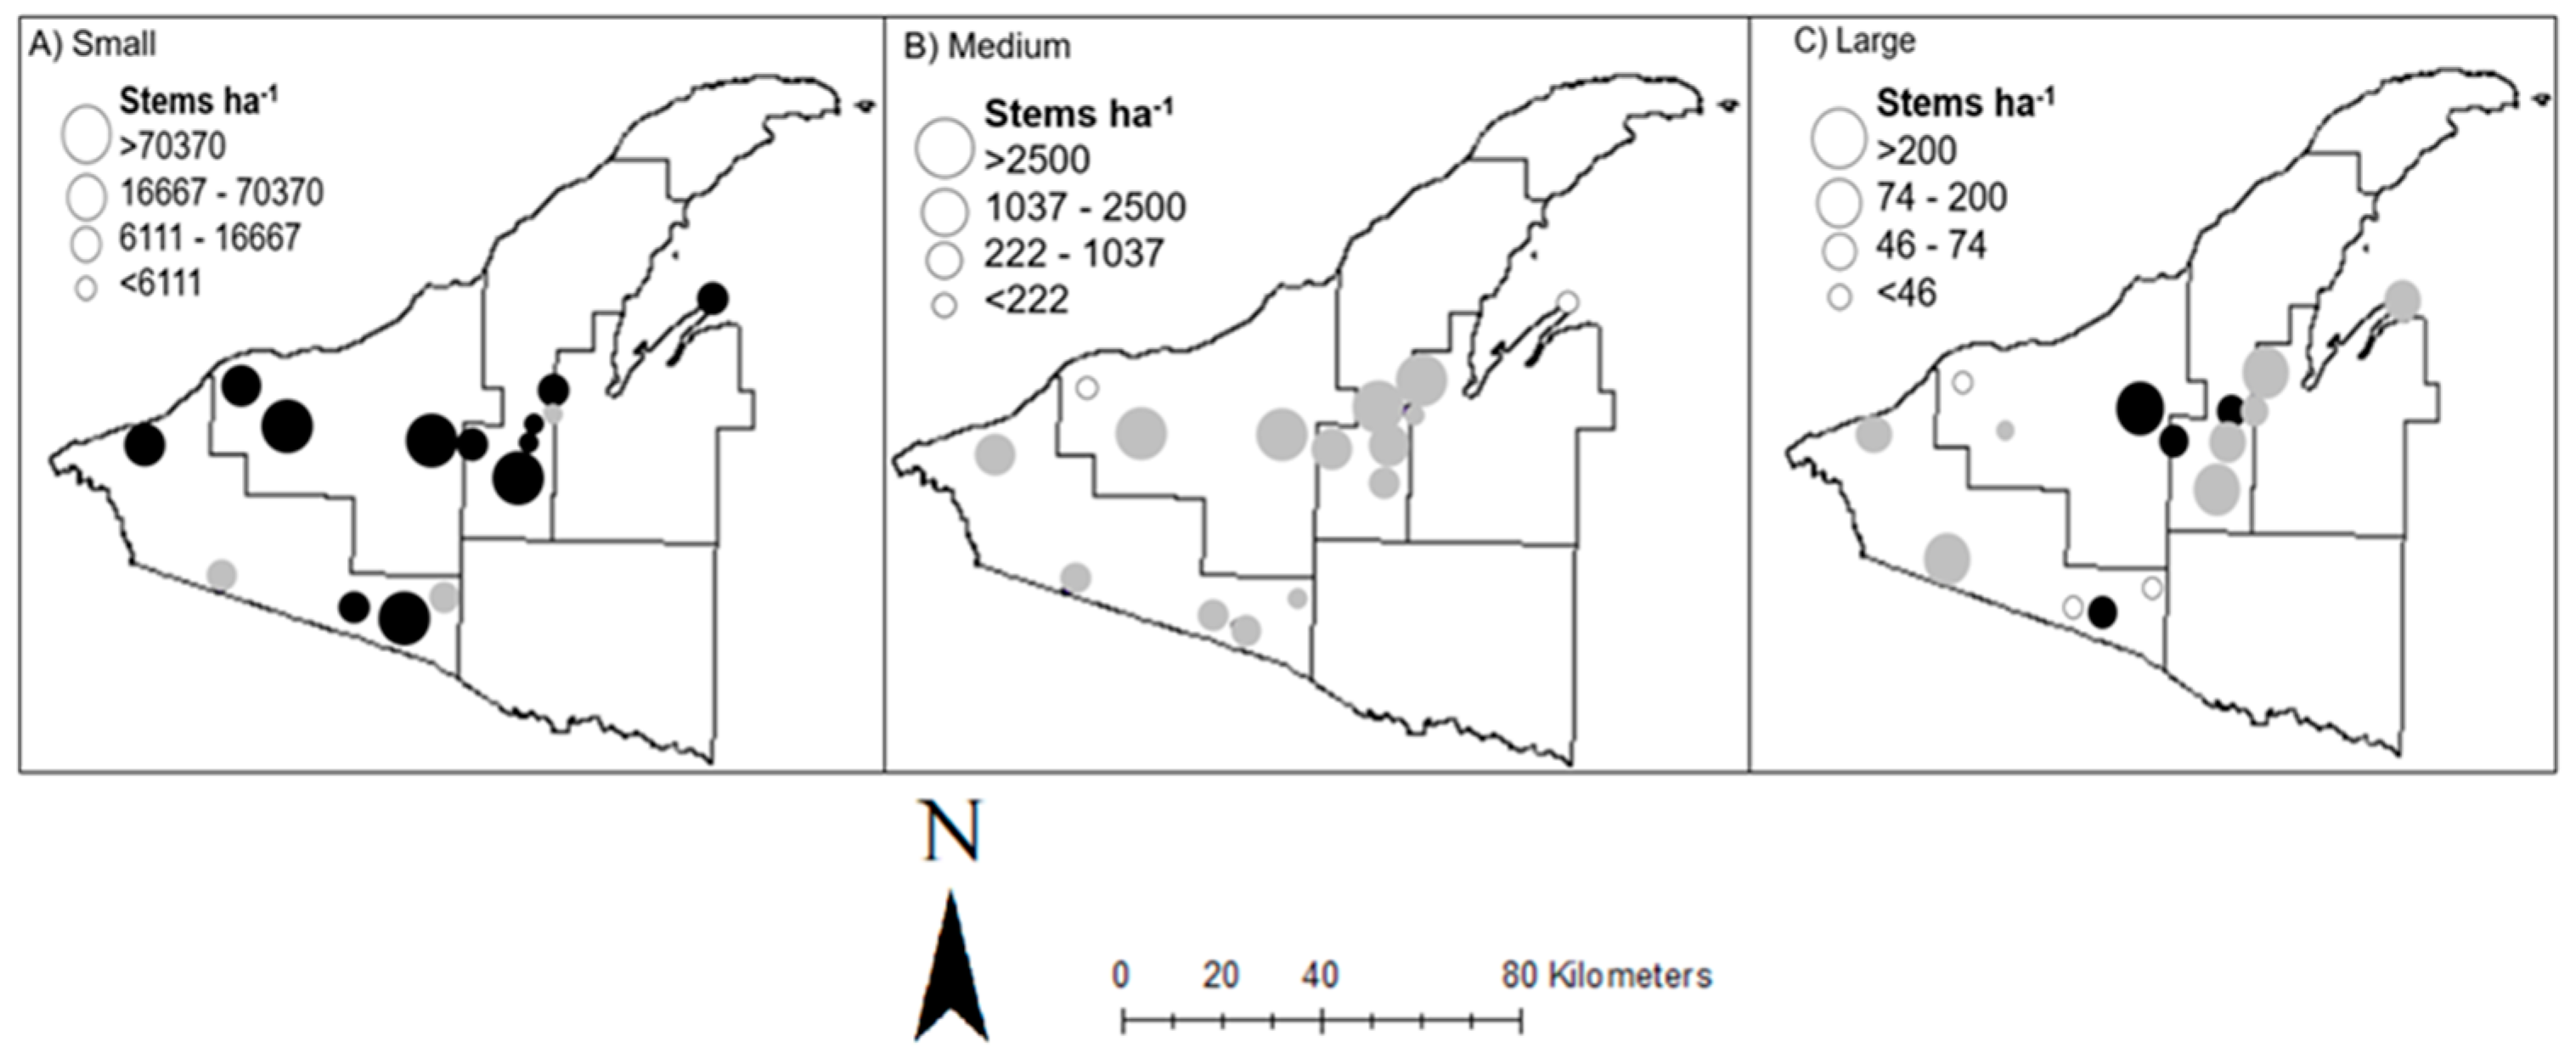
3.3. Small Seedling/Saplings (0.04–0.24 m height)
3.4. Medium Saplings (0.25–1.4 m height)
3.5. Large Saplings (>1.4 m height to 4 cm dbh)
3.6. Eastern Hemlock Regeneration
4. Discussion
5. Conclusions Management Implications
Author Contributions
Funding
Acknowledgments
Conflicts of Interest
References
- Wiegmann, S.M.; Waller, D.M. Fifty years of change in northern upland forest understories: Identity and traits of “winner” and “loser” plant species. Biol. Conserv. 2006, 129, 109–123. [Google Scholar] [CrossRef]
- Bradshaw, L.; Waller, D.M. Impacts of white-tailed deer on regional patterns of forest tree recruitment. For. Ecol. Manag. 2016, 375, 1–11. [Google Scholar] [CrossRef]
- Anderson, R.C.; Katz, A.J. Recovery of browse-sensitive tree species following release from white-tailed deer Odocoileus virginianus Zimmerman browsing pressure. Biol. Conserv. 1993, 63, 203–208. [Google Scholar] [CrossRef]
- Augustine, D.J.; Frelich, L.E.; Jordan, P.A. Evidence for two alternate stable states in an ungulate grazing system. Ecol. Appl. 1998, 8, 1260–1269. [Google Scholar] [CrossRef]
- Jensen, N.R.; Webster, C.R.; Witt, J.C.; Grant, J.B. Ungulate winter habitat selection as a driver of herbaceous-layer heterogeneity in northern temperate forests. Ecosphere 2011, 2, 1–16. [Google Scholar] [CrossRef]
- Walters, M.B.; Farinosi, E.J.; Willis, J.L.; Gottschalk, K.W. Managing for diversity: Harvest gap size drives complex light, vegetation and deer herbivory impacts on tree seedlings. Ecosphere 2016, 7, e01397. [Google Scholar] [CrossRef]
- Augustine, D.; McNaughton, S. Ungulate Effects on the Functional Species Composition of Plant Communities: Herbivore Selectivity and Plant Tolerance. J. Wildl. Manag. 1998, 62, 1165–1183. [Google Scholar] [CrossRef]
- Rooney, T.P.; Waller, D.M. Direct and indirect effects of white-tailed deer in forest ecosystems. For. Ecol. Manag. 2003, 181, 165–176. [Google Scholar] [CrossRef]
- Murray, B.D.; Webster, C.R.; Bump, J.K. Broadening the ecological context of ungulate–ecosystem interactions: The importance of space, seasonality, and nitrogen. Ecology 2013, 94, 1317–1326. [Google Scholar] [CrossRef] [PubMed]
- Webster, C.R.; Dickinson, Y.L.; Burton, J.L.; Frelich, L.E.; Jenkins, M.A.; Kern, C.C.; Raymond, P.; Saunders, M.R.; Walters, M.B.; Willis, J.L. Promoting and maintaining diversity in contemporary hardwood forests: Confronting contemporary drivers of change and the loss of ecological memory. For. Ecol. Manag. 2018, 421, 98–108. [Google Scholar] [CrossRef]
- Salk, T.T.; Frelich, L.E.; Sugita, S.; Calcote, R.; Ferrari, J.B.; Montgomery, R.A. Poor recruitment is changing the structure and species composition of an old growth hemlock hardwood forest. For. Ecol. Manag. 2011, 261, 1998–2006. [Google Scholar] [CrossRef]
- Witt, J.C.; Webster, C.R. Regeneration dynamics in remnant Tsuga canadensis stands in the northern Lake States: Potential direct and indirect effects of herbivory. For. Ecol. Manag. 2010, 260, 519–525. [Google Scholar] [CrossRef]
- Nuttle, T.; Yerger, E.H.; Stoleson, S.H.; Ristau, T.E. Legacy of top-down herbivore pressure ricochets back up multiple trophic levels in forest canopies over 30 years. Ecosphere 2011, 2, 1–11. [Google Scholar] [CrossRef]
- Royo, A.A.; Collins, R.; Adams, M.B.; Kirschbaum, C.; Carson, W.P. Pervasive interactions between ungulate browsers and disturbance regimes promote temperate forest herbaceous diversity. Ecology 2010, 91, 93–105. [Google Scholar] [CrossRef] [PubMed]
- Harris, R.M.B.; Beaumont, L.J.; Vance, T.R.; Tozer, C.R.; Remenyi, T.A.; Perkins-Kirkpatrick, S.E.; Mitchell, P.J.; Nicotra, A.B.; McGregor, S.; Andrew, N.R.; et al. Biological responses to the press and pulse of climate trends and extreme events. Nat. Clim. Chang. 2018, 8, 579–587. [Google Scholar] [CrossRef]
- Leopold, A.; Sowls, L.; Spencer, D.A. Survey of Over-Populated Deer Ranges in the United States. J. Wildl. Manag. 1947, 11, 162–177. [Google Scholar] [CrossRef]
- Husheer, S.W.; Coomes, D.A.; Robertson, A.W. Long-term influences of introduced deer on the composition and structure of New Zealand Nothofagus forests. For. Ecol. Manag. 2003, 181, 99–117. [Google Scholar] [CrossRef]
- Binkley, D.; Moore, M.M.; Romme, W.H.; Brown, P.M. Was Aldo Leopold right about the Kaibab Deer Herd? Ecosystems 2006, 9, 227–241. [Google Scholar] [CrossRef]
- Forsyth, D.M.; Caley, P. Testing the irruptive paradigm of large herbivore dynamics. Ecology 2006, 87, 297–303. [Google Scholar] [CrossRef]
- Starns, H.D.; Weckerly, F.W.; Ricca, M.A.; Duarte, A. Vegetation changes associated with a population irruption by Roosevelt elk. Ecol. Evol. 2014, 5, 109–120. [Google Scholar] [CrossRef]
- Takimoto, G.; Spiller, D.A.; Post, D.M. Ecosystem size, but not disturbance, determines food-chain length on islands of the Bahamas. Ecology 2008, 89, 3001–3007. [Google Scholar] [CrossRef]
- Fuller, T.K. Dynamics of a declining white-tailed deer population in northern central Minnesota. Wildl. Monogr. 1990, 110, 3–37. [Google Scholar]
- Patterson, B.R.; Power, V.A. Contribution of forage competition, harvest and climate fluctuation to changes in population growth of northern white-tailed deer. Oecologia 2002, 130, 62–71. [Google Scholar] [CrossRef] [PubMed]
- Alverson, W.S.; Waller, D.M.; Solheim, S.L. Forests too deer: Edge effects in northern Wisconsin. Conserv. Biol. 1988, 2, 348–358. [Google Scholar] [CrossRef]
- Waller, D.M. Effects of deer on forest herb layers. In The Herbaceous Layer in Forests of Eastern North America; Gilliam, F.S., Ed.; Oxford University Press: New York, NY, USA, 2014; pp. 369–399. [Google Scholar]
- Doepker, R.V.; Beyer, D.E.; Donovan, M.L. Deer Population Trends in Michigan’s Upper Peninsula; Michigan Department of Natural Resources, Wildlife Division: Lansing, MI, USA, 1994.
- Pekins, P.J.; Smith, K.S.; Mautz, W.W. The energy cost of gestation in white-tailed deer. Can. J. Zool. 1998, 76, 1091–1097. [Google Scholar] [CrossRef]
- Albon, S.D.; Irvine, R.J.; Halvorsen, O.; Langvatn, R.; Loe, E.; Ropstad, E.; Veiberg, V.; van der Wal, R.; Bjørkvoll, E.M.; Duff, E.I.; et al. Contrasting effects of summer and winter warming on body mass explain population dynamics in a food-limited Arctic herbivore. Glob. Chang. Biol. 2017, 23, 1374–1389. [Google Scholar] [CrossRef]
- Anderson, R.C.; Loucks, O.L. White-tailed deer (Odocoileus virginianus) influence on structure and composition of Tsuga canadensis forests. J. Appl. Ecol. 1979, 16, 855–861. [Google Scholar] [CrossRef]
- Ellison, A.M.; Bank, M.S.; Clinton, B.D.; Colburn, E.A.; Elliott, K.; Ford, C.R.; Foster, D.R.; Kloeppel, B.D.; Knoepp, J.D.; Lovett, G.M.; et al. Loss of foundation species: Consequences for the structure and dynamics of forested ecosystems. Front. Ecol. Environ. 2005, 3, 479–486. [Google Scholar] [CrossRef]
- Martin, K.L.; Goebel, P.C. The foundation species influence of eastern hemlock (Tsuga canadensis) on biodiversity and ecosystem function on the Unglaciated Allegheny Plateau. For. Ecol. Manag. 2013, 289, 143–152. [Google Scholar] [CrossRef]
- Mladenoff, D.J.; Stearns, F. Eastern hemlock regeneration and deer browsing in the northern Great Lakes region: A re-examination and model simulation. Conserv. Biol. 1993, 7, 889–900. [Google Scholar] [CrossRef]
- Verme, L.J. 1973 Movements of white-tailed deer in Upper Michigan. J. Wildl. Manag. 1973, 37, 545–552. [Google Scholar] [CrossRef]
- Morrison, S.F.; Forbes, G.J.; Young, G.J.; Lusk, S. Within-yard habitat use by white-tailed deer at varying winter severity. For. Ecol. Manag. 2003, 172, 173–182. [Google Scholar] [CrossRef]
- Beals, E.W.; Cottam, G.; Vogl, R.J. Influence of Deer on Vegetation of the Apostle Islands, Wisconsin. J. Wildl. Manag. 1960, 24, 68–80. [Google Scholar] [CrossRef]
- Rooney, T.P.; Waller, D.M. Local and regional variation in hemlock seedling establishment in forests of the Upper Great Lakes region. For. Ecol. Manag. 1998, 111, 211–224. [Google Scholar] [CrossRef]
- Rooney, T.P.; McCormick, R.J.; Solheim, S.L.; Waller, D.M. Regional variation in recruitment of hemlock seedlings and saplings in the Upper Great Lakes, USA. Ecol. Appl. 2000, 10, 1119–1132. [Google Scholar] [CrossRef]
- Murray, B.D.; Webster, C.R.; Bump, J.K. A migratory ungulate facilitates cross-boundary nitrogen transport in forested landscapes. Ecosystems 2014, 17, 1002–1013. [Google Scholar] [CrossRef]
- Frelich, L.E.; Calcote, R.R.; Davis, M.B.; Pastor, J. Patch Formation and Maintenance in an Old-Growth Hemlock-Hardwood Forest. Ecology 1993, 74, 513–527. [Google Scholar] [CrossRef]
- Van Deelen, T.R.; Campa, H.; Hamady, M.; Haufler, J.B. Migration and seasonal range dynamics of deer using adjacent deeryards in northern Michigan. J. Wildl. Manag. 1998, 62, 205–213. [Google Scholar] [CrossRef]
- National Data Buoy Center. Historical Data and Climatic Summaries, 1 Jan–15 April in 2014. 2014. Available online: https://www.ndbc.noaa.gov/station_page.php?station=sxhw3 (accessed on 11 March 2019).
- National Data Buoy Center. Historical Data and Climatic Summaries, 1 Jan–15 April in 2014. 2014. Available online: http://www.ndbc.noaa.gov/station_history.php?station=pclm4 (accessed on 11 March 2019).
- National Weather Service National Weather Service, Marquette, Michigan. 2019. Available online: https://www.weather.gov/mqt/seasonsnowfallmaps (accessed on 18 February 2019).
- Mroz, G.D.; Gale, M.R.; Jurgensen, M.F.; Frederick, D.J.; Clark, A. Composition, structure and aboveground biomass of two old-growth northern hardwood stands in Upper Michigan. Can. J. For. Res. 1985, 15, 78–82. [Google Scholar] [CrossRef]
- Wisconsin Department of Natural Resources. Wisconsin Deer Research Studies Annual Report 2013–2014; Bureau of Sciences Services, Wildlife and Forestry Research Section: Madison, WI, USA, 2014. [Google Scholar]
- Sabine, D.L.; Forbes, G.; Ballard, W.B.; Bowman, J.; Whitlaw, H. Migration behavior of white-tailed deer under varying winter climate regimes in New Brunswick. J. Wildl. Manag. 2002, 66, 718–728. [Google Scholar] [CrossRef]
- Witt, J.C.; Webster, C.R.; Froese, R.E.; Vucetich, J.A. Scale-dependent drivers of ungulate patch use along a temporal and spatial gradient of snow depth. Can. J. Zool. 2012, 90, 972–983. [Google Scholar] [CrossRef]
- National Operational Hydrologic Remote Sensing Center. Snow Data Assimilation System (SNODAS) Data Products at NSIDC, November 15–April 15 in 2005–2018; National Snow and Ice Data Center: Boulder, CO, USA, 2004. [Google Scholar]
- Norton, D.C.; Bolsenga, S.J. Spatiotemporal Trends in Lake Effect and Continental Snowfall in the Laurentian Great Lakes, 1951–1980. J. Clim. 1993, 6, 1943–1956. [Google Scholar] [CrossRef]
- Albert, D.A. Regional Landscape Ecosystems of Michigan, Minnesota, and Wisconsin: A Working Map and Classification; General Technical Report NC-178; U.S. Department of Agriculture, Forest Service, North Central Forest Experiment Station: St. Paul, MN, USA, 1995.
- Reay, R.S. Management of eastern hemlock for deer wintering areas. In Symposium on Sustainable Management of Hemlock Ecosystems in Eastern North America; McManus, K.A., Shields, K.S., Souto, D.R., Eds.; U.S. Forest Service: Newtown Square, PA, USA, 1999; pp. 144–147. [Google Scholar]
- Nelson, M.E.; Mech, L.D. Wolf predation risk associated with white-tailed deer movements. Can. J. Zool. 1991, 69, 2696–2699. [Google Scholar] [CrossRef]
- Wisconsin Department of Natural Resources. Management Workbook for White-Tailed Deer; Bureau of Wildlife Management and Bureau of Integrated Science Services: Madison, WI, USA, 2001. [Google Scholar]
- Michigan Technological University Keweenaw Research Center. Weather History. 2019. Available online: http://blizzard.mtukrc.org/~weather/00_KRC_Weather_History.xls (accessed on 20 May 2019).
- National Data Buoy Center. Historical Data and Climatic Summaries, Nov 15–April 15 in 2009–2018. Available online: https://www.ndbc.noaa.gov/station_page.php?station=sxhw3 (accessed on 11 March 2019).
- National Data Buoy Center. Historical Data and Climatic Summaries, Nov 15–April 15 in 2009–2018. Available online: http://www.ndbc.noaa.gov/station_history.php?station=pclm4 (accessed on 11 March 2019).
- Frawley, B.J. Michigan Deer Harvest Survey Report 2005 Seasons; Wildlife Report No. 3454; Michigan Department of Natural Resources: Lansing, MI, USA, 2006.
- Frawley, B.J. Michigan Deer Harvest Survey Report 2006 Seasons; Wildlife Report No. 3467; Michigan Department of Natural Resources: Lansing, MI, USA, 2007.
- Frawley, B.J. Michigan Deer Harvest Survey Report 2007 Seasons; Wildlife Report No. 3499; Michigan Department of Natural Resources: Lansing, MI, USA, 2008.
- Frawley, B.J. Michigan Deer Harvest Survey Report 2008 Seasons; Wildlife Report No. 3513; Michigan Department of Natural Resources: Lansing, MI, USA, 2006.
- Frawley, B.J. Michigan Deer Harvest Survey Report 2009 Seasons; Wildlife Report No. 3513; Michigan Department of Natural Resources: Lansing, MI, USA, 2006.
- Frawley, B.J. Michigan Deer Harvest Survey Report 2010 Seasons; Wildlife Report No. 3526; Michigan Department of Natural Resources: Lansing, MI, USA, 2006.
- Frawley, B.J. Michigan Deer Harvest Survey Report 2011 Seasons; Wildlife Report No. 3548; Michigan Department of Natural Resources: Lansing, MI, USA, 2006.
- Frawley, B.J. Michigan Deer Harvest Survey Report 2012 Seasons; Wildlife Report No. 3566; Michigan Department of Natural Resources: Lansing, MI, USA, 2006.
- Frawley, B.J. Michigan Deer Harvest Survey Report 2013 Seasons; Wildlife Report No. 3585; Michigan Department of Natural Resources: Lansing, MI, USA, 2006.
- Frawley, B.J.; Boon, C.E. Michigan Deer Harvest Survey Report 2014 Seasons; Wildlife Report No. 3609; Michigan Department of Natural Resources: Lansing, MI, USA, 2006.
- Frawley, B.J.; Boon, C.E. Michigan Deer Harvest Survey Report 2015 Seasons; Wildlife Report No. 3621; Michigan Department of Natural Resources: Lansing, MI, USA, 2006.
- Frawley, B.J. Michigan Deer Harvest Survey Report 2016 Seasons; Wildlife Report No. 3639; Michigan Department of Natural Resources: Lansing, MI, USA, 2006.
- Frawley, B.J. Michigan Deer Harvest Survey Report 2017 Seasons; Wildlife Report No. 3656; Michigan Department of Natural Resources: Lansing, MI, USA, 2006.
- McCune, B.; Grace, J.B. Analysis of Ecological Communities; mJm Software Design: Gleneden Beach, OR, USA, 2002; pp. 25–34. [Google Scholar]
- Zuur, A.F.; Ieno, E.N.; Walker, N.J.; Saveliev, A.A.; Smith, G.M. Mixed Effects Models and Extensions in Ecology with R; Springer Science and Business Media: New York, NY, USA, 2009. [Google Scholar]
- R Core Team. R: A Language and Environment for Statistical Computing; R Foundation for Statistical Computing: Vienna, Austria, 2019; Available online: https://www.R-project.org (accessed on 26 March 2019).
- Pinheiro, J.; Bates, D.; DebRoy, S.; Sarkar, D.; R Core Team. nlme: Linear and Nonlinear Mixed Effects Models. R Package Version 3.1-131. 2017. Available online: https://CRAN.R-project.org/package=nlme (accessed on 6 December 2018).
- Hilbe, J.M.; Robinson, A.P. Methods of Statistical Model Estimation; CRC Press: Boca Raton, FL, USA, 2013. [Google Scholar]
- Hilbe, J.; Robinson, A. msme: Functions and Datasets for “Methods of Statistical Model Estimation”. R Package Version 0.5.3. 2018. Available online: https://CRAN.R project.org/package=msme (accessed on 6 December 2018).
- Nelson, M.E.; Mech, L.D. A three-decade dearth of deer (Odocoileus virginianus) in a wolf (Canis lupus) dominated ecosystem. Am. Midl. Nat. 2006, 155, 373–382. [Google Scholar] [CrossRef]
- Hurst, J.E.; Porter, W.F. Evaluation of shifts in white-tailed deer winter yards in the Adirondack region of New York. J. Wildl. Manag. 2008, 72, 367–375. [Google Scholar] [CrossRef]
- Dukes, J.S.; Pontius, J.; Orwig, D.; Garnas, J.R.; Rodgers, V.L.; Brazee, N.; Cooke, B.; Theoharides, K.A.; Stange, E.E.; Harrington, R.; et al. Responses of insect pests, pathogens, and invasive plant species to climate change in the forests of northeastern North America: What can we predict? Can. J. For. Res. 2009, 39, 231–248. [Google Scholar] [CrossRef]
- Waller, D.M. Local and regional factors influencing the regeneration of hemlock. In Hemlock Ecology and Management; Mroz, G., Martin, J., Eds.; University of Wisconsin Press: Madison, WI, USA, 1995; pp. 73–90. [Google Scholar]
- Schulte, L.A.; Mladenoff, D.J.; Crow, T.R.; Merrick, L.C.; Cleland, D.T. Homogenization of northern U.S. Great Lakes forests due to land use. Landsc. Ecol. 2007, 22, 1089–1103. [Google Scholar] [CrossRef]
- Fisichelli, N.A.; Frelich, L.E.; Reich, P.B. Climate and interrelated tree regeneration drivers in mixed temperate–boreal forests. Landsc. Ecol. 2013, 28, 149–159. [Google Scholar] [CrossRef]
- Frelich, L.E.; Reich, P.B. Minireviews: Neighborhood effects, disturbance severity, and community stability in forests. Ecosystems 1999, 2, 151–166. [Google Scholar] [CrossRef]
- Jõgiste, K.; Korjus, H.; Stanturf, J.A.; Frelich, L.E.; Baders, E.; Donis, J.; Jansons, A.; Kangur, A.; Köster, K.; Laarmann, D.; et al. Hemiboreal forest: Natural disturbances and the importance of ecosystem legacies to management. Ecosphere 2017, 8, e01706. [Google Scholar] [CrossRef]
- Mladenoff, D.J. The role of eastern hemlock across scales in the northern lake states. In Hemlock Ecology and Management; Mroz, G., Martin, J., Eds.; University of Wisconsin Press: Madison, WI, USA, 1995; pp. 29–42. [Google Scholar]
- Frelich, L.E.; Lorimer, C.G. Current and Predicted Long-term Effects of Deer Browsing in Hemlock Forests in Michigan, USA. Biol. Conserv. 1985, 34, 99–120. [Google Scholar] [CrossRef]
- Lancaster, K.F. Managing Eastern Hemlock: A Preliminary Guide; USDA Forest Service, Northeastern Area: Broomall, PA, USA, 1985.
- Lorimer, C.G. Dynamics and structural characteristics of eastern hemlock stands. In Hemlock Ecology and Management; Mroz, G., Martin, J., Eds.; University of Wisconsin—Madison: Madison, WI, USA, 1995; pp. 43–60. [Google Scholar]


| Stand Area (ha) | Snow Depth (m) † | Basal Area (BA) | Trees ha−1 | %Tsuga BA | %Tsuga Trees ha−1 | Cumulative Deer Harvest km−2 * | Pellet Groups ha−1 | ||
|---|---|---|---|---|---|---|---|---|---|
| (m2 ha−1) | (m2 ha−1) | Mean | Min | Max | |||||
| 34.4 | 0.43 ± 0.05 | 40.5 | 961 | 53.6% | 26.6% | 14 | 126 ± 32 | 0 | 431 |
| 19.2 | 0.56 ± 0.03 | 43.4 | 1036 | 37.3% | 26.0% | 9 | 79 ± 15 | 0 | 179 |
| 29.1 | 0.53 ± 0.04 | 35.9 | 1058 | 36.7% | 13.4% | 9 | 1270 ± 167 | 395 | 2045 |
| 46.7 | 0.45 ± 0.03 | 34.3 | 564 | 57.1% | 35.5% | 9 | 1489 ± 178 | 323 | 2296 |
| 29.4 | 0.51 ± 0.04 | 43.9 | 475 | 75.4% | 42.1% | 9 | 736 ± 99 | 323 | 1364 |
| 21.8 | 0.48 ± 0.04 | 36.2 | 706 | 35.7% | 14.2% | 9 | 101 ± 29 | 0 | 323 |
| 10.6 | 0.48 ± 0.04 | 38.4 | 540 | 38.8% | 11.1% | 9 | 151 ± 29 | 0 | 323 |
| 6.5 | 0.41 ± 0.04 | 26.4 | 935 | 40.2% | 31.0% | 4 | 210 ± 58 | 0 | 538 |
| 38.8 | 0.41 ± 0.04 | 39.4 | 578 | 53.1% | 35.1% | 4 | 190 ± 37 | 162 | 359 |
| 18.3 | 0.40 ± 0.04 | 43.9 | 425 | 51.3% | 35.3% | 4 | 331 ± 88 | 36 | 1130 |
| 0.5 | 0.50 ± 0.04 | 55.6 | 675 | 65.6% | 48.1% | 9 | 301 ± 83 | 0 | 861 |
| 0.4 | 0.44 ± 0.03 | 42.8 | 508 | 79.5% | 72.1% | 9 | 280 ± 65 | 0 | 646 |
| 1.4 | 0.47 ± 0.04 | 48.8 | 342 | 83.8% | 78.1% | 4 | 65 ± 26 | 0 | 215 |
| 7.4 | 0.38 ± 0.06 | 43.4 | 995 | 55.3% | 22.6% | 6 | 1098 ± 158 | 323 | 938 |
| 1.7 | 0.41 ± 0.07 | 59.6 | 475 | 61.0% | 64.9% | 9 | 0.00 ± 0.00 | 0 | 0 |
| Study-wide mean | |||||||||
| 17.7 ± 3.9 | 0.46 ± 0.01 | 42.2 ± 2.1 | 685 ± 64 | 55.0% ± 4.1 | 37.1% ± 5.4 | 7.3 ± 0.7 | 428 ± 124 | 104 ± 40 | 777 ± 176 |
| Scientific Name | Common Name | Stems ha−1 2007 | Stems ha−1 2015 | % Change | p-Value |
|---|---|---|---|---|---|
| Small regeneration (0.04–0.24 m height) | |||||
| Abies balsamea L. | Balsam fir | 632 ± 323 | 1088 ± 439 | 72% | 0.07 |
| Acer rubrum L. | Red maple | 4989 ± 691 | 20527 ± 5721 | 311% | <0.001 |
| Acer saccharum Marshall | Sugar maple | 4768 ± 712 | 27534 ± 9851 | 477% | 0.007 |
| Betula alleghaniensis Britton | Yellow birch | 286 ± 140 | 455 ± 262 | 59% | 0.60 |
| Tsuga canadensis L. Carrière | Eastern hemlock | 1163 ± 486 | 924 ± 440 | −21% | 0.06 |
| Other hardwood* | 1358 ± 634 | 2868 ± 1828 | 111% | 0.04 | |
| Other conifer† | 49 ± 34 | 291 ± 192 | 490% | 0.04 | |
| Total (no maple) | 3488 ± 989 | 5626 ± 1889 | 61% | 0.03 | |
| Medium regeneration (0.25 m–1.4 m height) | |||||
| Abies balsamea L. | Balsam fir | 436 ± 130 | 105 ± 34 | −68% | <0.001 |
| Acer rubrum L. | Red maple | 438 ± 166 | 248 ± 116 | −43% | 0.08 |
| Acer saccharum Marshall | Sugar maple | 2648 ± 1291 | 290 ± 144 | −79% | <0.001 |
| Betula alleghaniensis Britton | Yellow birch | 255 ± 205 | 92 ± 39 | −55% | 0.63 |
| Tsuga canadensis L. Carrière | Eastern hemlock | 371 ± 122 | 195 ± 58 | −44% | 0.006 |
| Other hardwood | 1258 ± 590 | 556 ± 213 | −56% | <0.001 | |
| Other conifer | 89 ± 37 | 74 ± 19 | −17% | 0.53 | |
| Total (no maple) | 2409 ± 767 | 898 ± 277 | −63% | 0.005 | |
| Large regeneration (>1.4 m height–4 cm dbh) | |||||
| Abies balsamea L. | Balsam fir | 181 ± 100 | 104 ± 44 | −42% | 0.02 |
| Acer rubrum L. | Red maple | 43 ± 14 | 68 ± 29 | 58% | 0.22 |
| Acer saccharum Marshall | Sugar maple | 209 ± 75 | 172 ± 110 | −18% | 0.05 |
| Betula alleghaniensis Britton | Yellow birch | 77 ± 46 | 44 ± 20 | −42% | 0.06 |
| Tsuga canadensis L. Carrière | Eastern hemlock | 88 ± 63 | 55 ± 32 | −38% | 0.15 |
| Other hardwood | 97 ± 65 | 180 ± 122 | 86% | <0.001 | |
| Other conifer | 7 ± 4 | 17 ± 11 | 133% | 0.08 | |
| Total (no maple) | 450 ± 210 | 401 ± 150 | −11% | 0.55 | |
© 2019 by the authors. Licensee MDPI, Basel, Switzerland. This article is an open access article distributed under the terms and conditions of the Creative Commons Attribution (CC BY) license (http://creativecommons.org/licenses/by/4.0/).
Share and Cite
Parikh, G.L.; Webster, C.R. Press-Pulse Odocoileus Virginianus Herbivory in Relict Tsuga Canadensis Stands in the Western Upper Peninsula of Michigan, USA. Forests 2019, 10, 496. https://doi.org/10.3390/f10060496
Parikh GL, Webster CR. Press-Pulse Odocoileus Virginianus Herbivory in Relict Tsuga Canadensis Stands in the Western Upper Peninsula of Michigan, USA. Forests. 2019; 10(6):496. https://doi.org/10.3390/f10060496
Chicago/Turabian StyleParikh, Grace L., and Christopher R. Webster. 2019. "Press-Pulse Odocoileus Virginianus Herbivory in Relict Tsuga Canadensis Stands in the Western Upper Peninsula of Michigan, USA" Forests 10, no. 6: 496. https://doi.org/10.3390/f10060496
APA StyleParikh, G. L., & Webster, C. R. (2019). Press-Pulse Odocoileus Virginianus Herbivory in Relict Tsuga Canadensis Stands in the Western Upper Peninsula of Michigan, USA. Forests, 10(6), 496. https://doi.org/10.3390/f10060496