Article

The Impacts of Native Forests and Forest Plantations on Water Supply in Chile

by
Camila Alvarez-Garreton
1,2,*,
Antonio Lara
1,2,3,
Juan Pablo Boisier
2,4 and
Mauricio Galleguillos
2,5
1
Instituto de Conservación, Biodiversidad y Territorio, Universidad Austral de Chile, Valdivia 5090000, Chile
2
Center for Climate and Resilience Research (CR2, FONDAP 15110009), Santiago 8320000, Chile
3
Fundación Centro de los Bosques Nativos FORECOS, Valdivia 5090000, Chile
4
Department of Geophysics, Universidad de Chile, Santiago 8320000, Chile
5
Faculty of Agronomic Sciences, Universidad de Chile, Santiago 8320000, Chile
*
Author to whom correspondence should be addressed.
Forests 2019, 10(6), 473; https://doi.org/10.3390/f10060473
Submission received: 2 May 2019 / Revised: 25 May 2019 / Accepted: 27 May 2019 / Published: 30 May 2019
(This article belongs to the Special Issue Managing Forests and Water for People under a Changing Environment)

Abstract

:
Over the past 40 years, south-central Chile has experienced important land-use-induced land cover changes, with massive conversion from native forests (NF) to Pinus radiata D.Don and Eucalyptus spp. exotic forest plantations (FP). Several case studies have related this conversion to a reduction in water supply within small catchments (<100 ha). In this work, we explore the impacts of NF and FP on streamflow by using a large-sample catchment dataset recently developed for Chile. We select 25 large forested catchments (>20,000 ha) in south-central Chile (35° S–41° S), analyze their land cover and precipitation spatial distributions, and fit a regression model to quantify the influence of NF, FP, grassland (GRA) and shrubland (SHR) partitions on annual runoff. To assess potential effects of land cover changes on water supply, we use the fitted model (R2 = 0.84) in synthetic experiments where NF, GRA and SHR covers within the catchments are replaced by patches of FP. We show that annual runoff consistently decreases with increments of FP, although the magnitude of the change (ranging from 2.2% to 7.2% mean annual runoff decrease for 10,000 ha increment in FP) depends on several factors, including the initial land cover partition within the basin, the replaced land cover class, the area of the catchment, and the type of catchment (drier or humid). Finally, in the context of the mitigation strategies pledged in the Chilean NDC (Nationally Determined Contributions defined after the Paris Agreement), which include the afforestation of 100,000 ha (mainly native forest) by 2030, we quantify the impacts on water supply due to the afforestation of 100,000 ha with different combinations of NF and FP. We show that annual runoff is highly sensitive to the relative area of FP to NF: ratios of FP to NF areas of 10%, 50% and 90% would lead to 3%, −18% and −40% changes in mean annual runoff, respectively. Our results can be used in the discussion of public policies and decision-making involving forests and land cover changes, as they provide scientifically-based tools to quantify expected impacts on water resources. In particular, this knowledge is relevant for decision making regarding mitigation strategies pledged in the Chilean NDC.

1. Introduction

A key challenge faced by Earth system scientists is to provide evidence that help to understand and quantify the trade-offs between the anthropic exploitation of natural resources as well as the resilience and capacity of these ecosystems for providing goods and services for human development [1]. Natural forests are amongst the most exploited ecosystems, given the value of their derived products for human development (e.g., timber production) and their potential replacement for agricultural purposes. In addition to economic goods, these ecosystems provide vital ecosystem services, such as water quality regulation, water flow regulation, preservation of habitats and biodiversity, and regulation of carbon cycle [1,2].
From a global perspective and due to the trees’ carbon uptake capacity, forests play a leading role in limiting the carbon dioxide accumulation in the atmosphere and its impacts on climate. Indeed, an increase of 9.5 million km2 in forests by 2050 (relative to 2010) is amongst the mitigation strategies to limit global warming to 1.5 °C [3]. In theory, this global consensus should be favorable for the protection and recovery of natural forests. However, the climate change mitigation plans in some countries include also the plantation of fast-growing commercial trees within their pledged areas [4]. While these forest plantations may support local economies and profits for the forest industry, they release the stored CO2 back into the atmosphere after harvesting (rotation times varying around 12 to 22 years, depending on the tree species) [4]. Further, the (different) impacts of forest plantations and natural forests on the hydrological cycle is still an ongoing field of research. This is an important factor to consider given the water supply risks associated with global warming [5].
The role of forests on the hydrological cycle has attracted considerable attention from scientists and the general public over the last two centuries [6]. Over the last decades, an increased number of studies examining the trade-offs among water and wood production have focused on South America, which hosts some of the most diverse forest ecosystems while containing mostly developing countries (whose economies rely on the exploitation of these resources) [7,8,9,10]. There are, however, important limitations in understanding the interaction between forest, water and development in the region. Firstly, the insights gained from a long-history of northern hemisphere studies cannot be transferred to South America, since natural forests in the latter are diverse and the industrial forest plantations (fast-growing non-native species) are managed on very short rotations [7] (18 to 22 years for Pinus spp. and 12 to 18 for Eucalyptus spp.). While an increase of tree cover is, in general, associated with decreased water provision in the northern hemisphere [1,6], case studies in South America have shown that these conclusions might be too lax when we differentiate natural forests from industrial forest plantations within the total tree-covered area. It has been shown that the replacement of native forests by other types of land cover, such as industrial forest plantations (monocultures of Eucalyptus and Pinus spp. mainly used for timber harvesting), cropland and grassland, reduces water provision and water quality [8,10,11]. On the other hand, increased areas of forest plantations have been associated with reduced streamflow, especially during the dry season [8,10,12,13,14,15,16,17,18,19]. These results may be partly explained by the high evapotranspiration rates of exotic forest plantations, which may exceed 90% of precipitation [15,20,21,22,23].
The land-use-induced land cover change (LULCC) in Chile has been characterized by the expansion of forest plantations in detriment of native forests, shrublands and grasslands, from 250,000 ha in 1974 to nearly 3 million ha in 2016 [24]. This expansion was triggered by an increased international demand for pulp and other forest commodities in the 1970s, to which Chile responded by promoting favorable economic conditions for investments in timber industry. In fact, a decree-law (DL701, [25]) was implemented in the second year of the military dictatorship (1973 to 1990), establishing subsidies for forest plantations. These subsidies were maintained until 2014 [24,26].
As mentioned above, there have been some scientific advances towards the quantification of the inter-relation between natural vegetation, forest plantation and water supply. However, a critical challenge remains in transferring this knowledge into public policy and decision making that can effectively lead to achieving a sustainable development.
In this work we do not directly address the challenge of transferring scientific insights into policy and decision making (a task that is probably better achieved outside a scientific publication), however, we develop our analyses thinking of this final goal. Specifically, we aim at providing robust—and easy to interpret—scientific evidence about the impacts of forest plantation expansion on water supply. We address this from a large-sample perspective, moving from the classical paired-catchment framework (that requires data from long-term experimental basins with before-after and control-impact designs, which are scarce, and generally involves small catchments [27]) or a physically-based modelling approach (which requires high resolution quality data), towards a comparative approach, which relies on extracting insights from the diversity of catchment characteristics (including hydrologic, climatic, topographic and geomorphologic characteristics). This space-for-time approach complements the insights from placed-based experiments by seeking conclusions and dominant patterns from analyses based on less detailed data over a large number of watersheds [6,28] (note that catchment, basin and watersheds are used indistinctively within the manuscript). Furthermore, we focus on large catchments (>200,000 ha), which have been poorly documented in the context of LULCC and their impacts on water provision.
We focus our analysis in south-central Chile (35° S–41° S), the region that concentrates most of the country’s population and land use activities (agriculture and forestry). This region also holds natural forest ecosystems (Valdivian Ecoregion) that have been declared by the Global 200 initiative as a worldwide biodiversity hotspot with highest conservation priority [29]. We analyze the water balance from 25 catchments covered by different combinations of natural vegetation (native forest, NF; grassland, GRA; and shrubland, SHR) and forest plantation (FP), by fitting a linear regression model to quantify the contribution to annual runoff from the portions of the catchments covered by each land cover class. The fitted model is then used to evaluate variations in water supply as a response to synthetic land cover transitions, where NF, GRA and SHR covers within the catchments are replaced by patches of FP. Additionally, we quantify the impacts on water supply due to the afforestation of 100,000 ha with different combinations of NF and FP, which is one of the mitigation strategies pledged in the Chilean NDC (Nationally Determined Contributions defined for the ratification of the Paris Agreement [30]) to be accomplished by 2030 [30]. We provide tools to quantify the impacts of natural vegetation and forest plantation on water resources, which can be used in the discussion of public policies and decision-making involving forests and land cover changes.

2. Data and Study Area

Time series of daily streamflow and daily precipitation were obtained from the CAMELS-CL (catchment attributes and meteorology for large sample studies—Chile) dataset [31], which can be downloaded from the CAMELS-CL explorer (http://camels.cr2.cl). This dataset provides catchment boundaries and catchment-averaged hydro-meteorological time series for 516 basins across Chile for the period 1979 to 2016, and 70 catchment attributes characterizing the topography, geology, climate, hydrology, land cover, and human intervention within the basins. Missing monthly streamflow records for a given station were filled by correlation with neighbor stations. The filling was done when the stations had a minimum of 30 coincident years, and a coefficient of determination above 0.8 between the monthly streamflow time series (similar procedure than in [32]).
In addition to the catchment-scale data, we processed two raw gridded datasets data used in [31]: the daily 5-km resolution CR2MET precipitation dataset, available from the Center for Climate and Resilience Research server (http://www.cr2.cl/datos-productos-grillados), and the 30-m resolution land cover map developed by [33], available at http://www.gep.uchile.cl/Landcover_CHILE.html.
The study period to analyze annual runoff is defined from April 2000 to March 2015 (hydrological years—April to March—are considered in the analysis). This period is chosen due to land cover information [33], which relies on Landsat imagery from 2014. Since the catchment dataset provided by [31] does not include land cover information at different times, we assume that the 2014 land cover classification is constant within the study period, and restrict the analysis up to 15 years prior the land cover information date. This decision considers that the typical rotation times of forest plantations are 12 to 22 years, while aiming at leveraging the trade-off between record length (necessary for statistical analysis) with a realistic land cover characterization for the study period (based on two years of information).
From the 516 CAMELS-CL catchments, we selected those that fulfilled the following criteria: having more than 20% of their areas covered by forests (forest plantation or native forest); having less than 5% of the catchment covered by cropland (to avoid agriculture effects on streamflow); each of the land cover classes included as predictors in the statistical analysis should cover at least 5% of the catchment (to ensure a representative sample); and having no presence of large dams (as reported in [31]) within the catchment (information provided by [31]). A subset of 25 catchments fulfilled these criteria and were analyzed in this study.
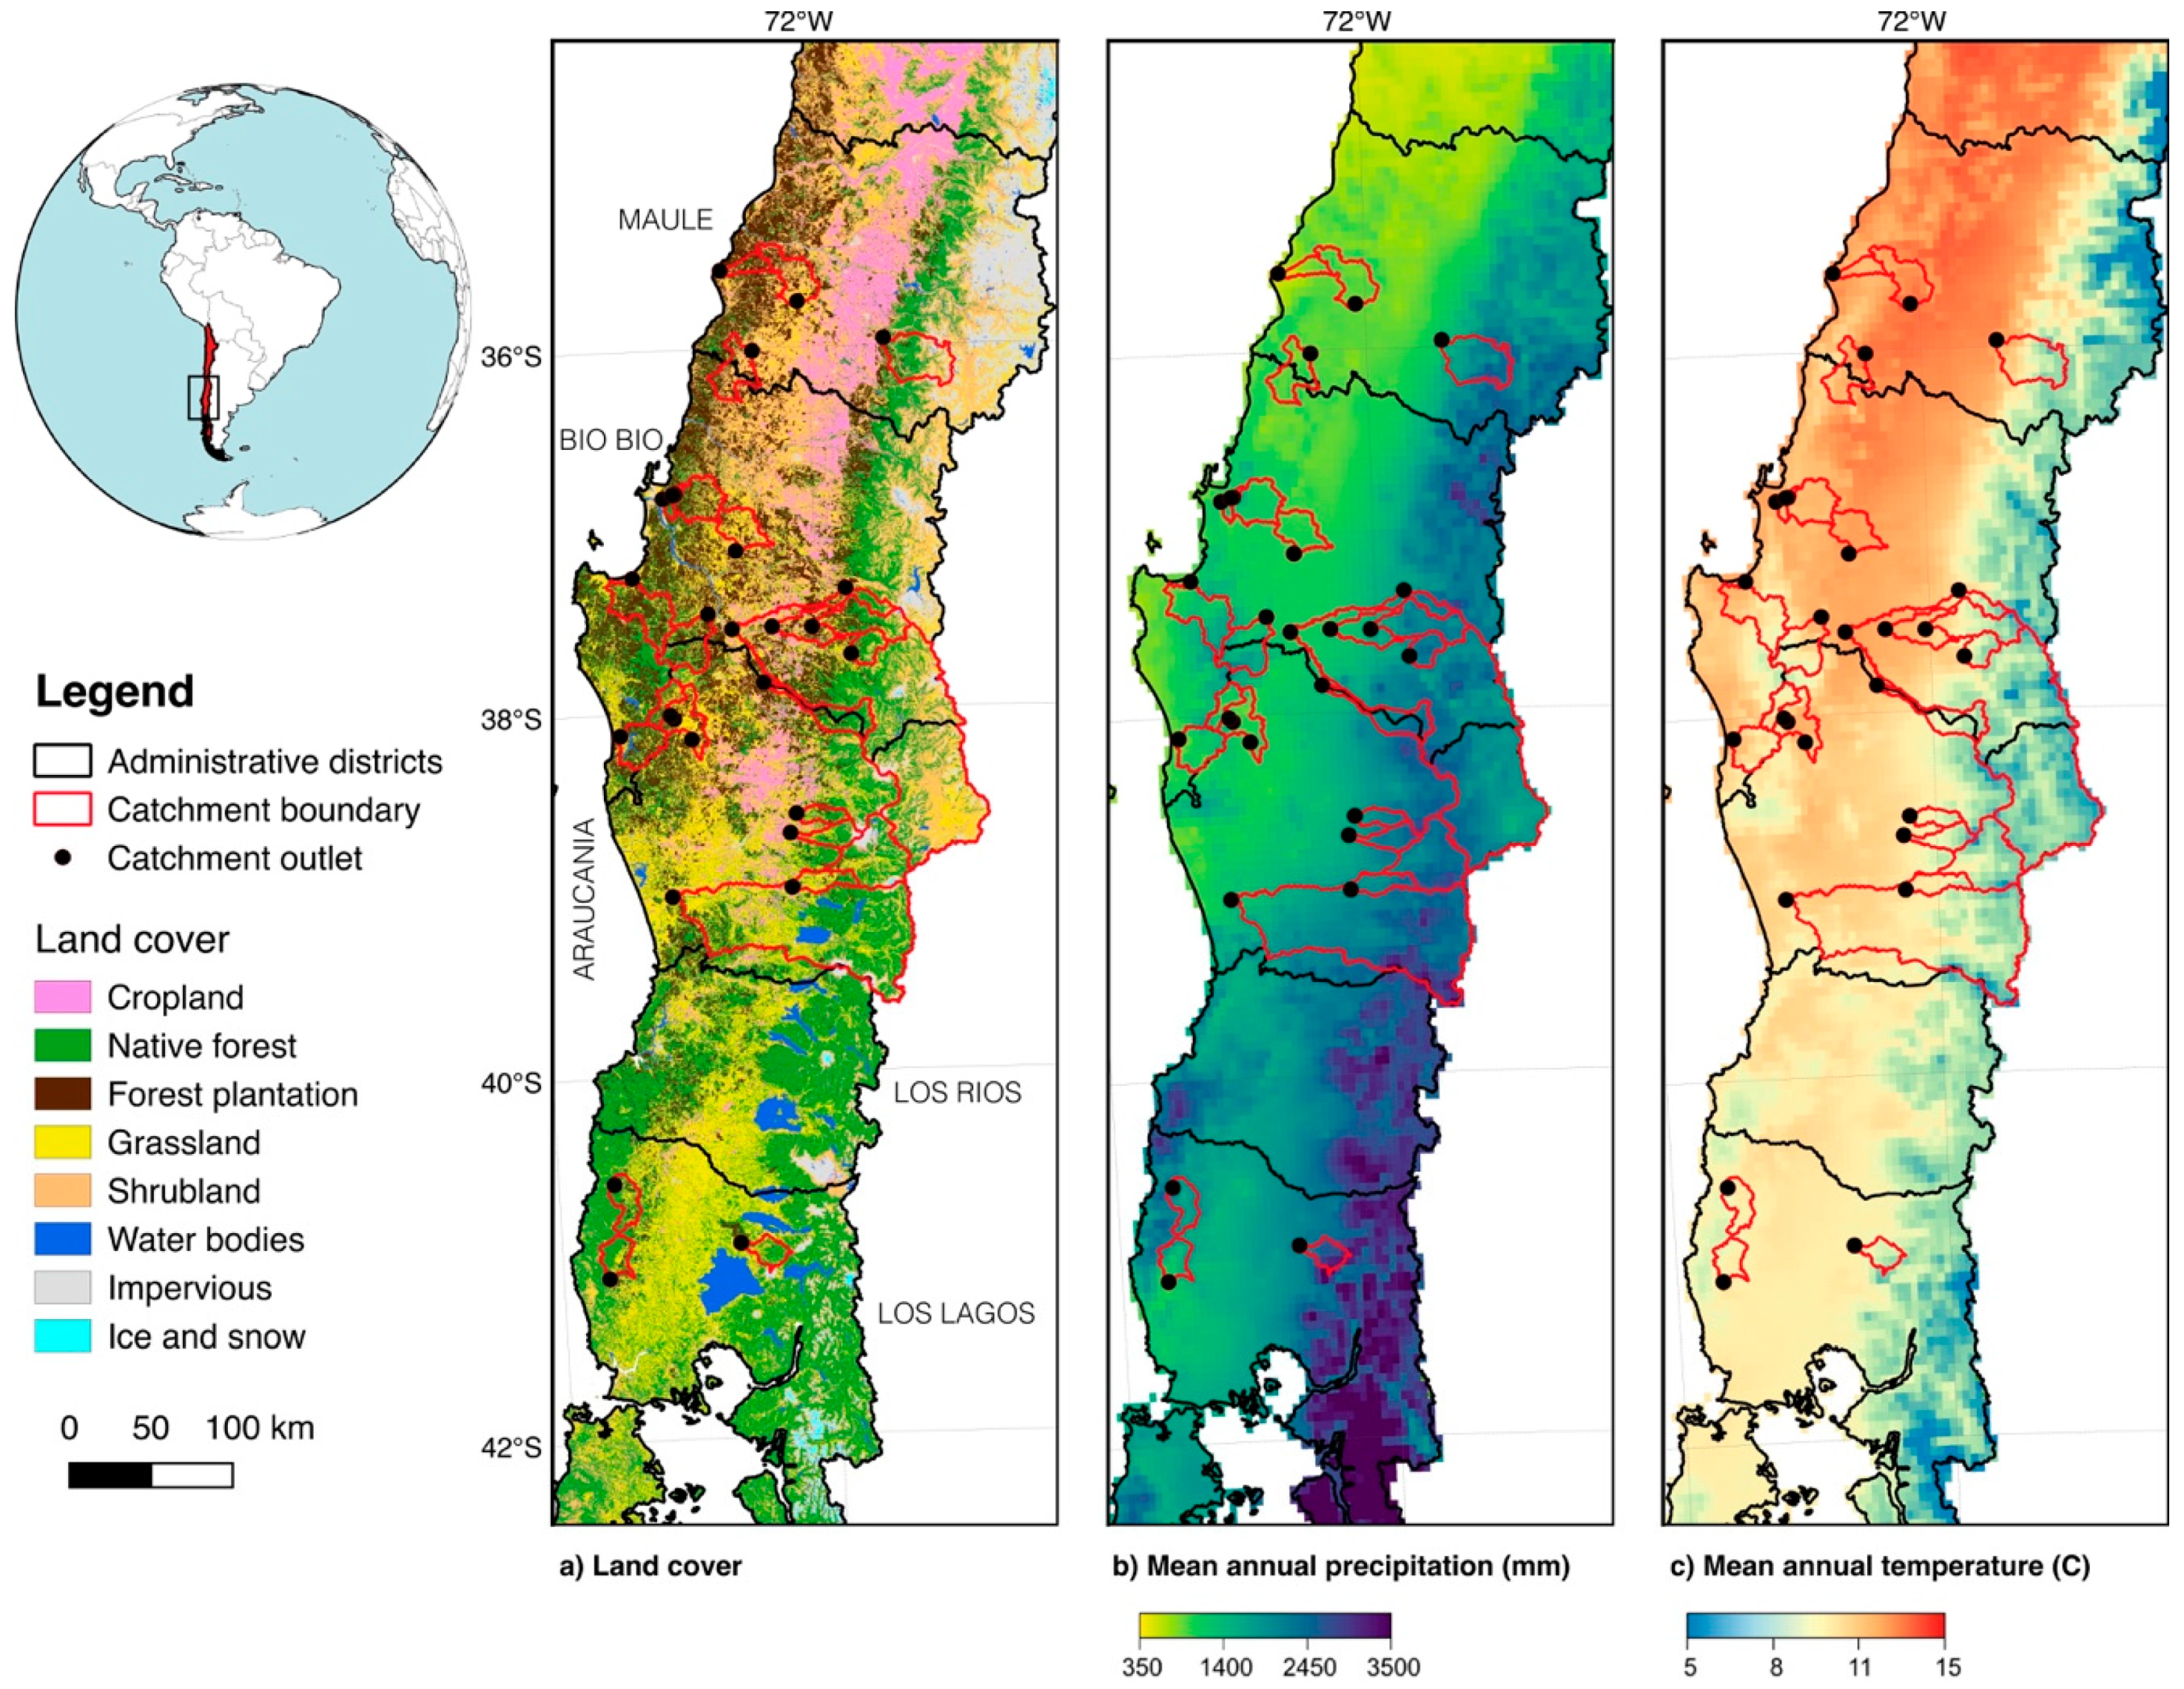
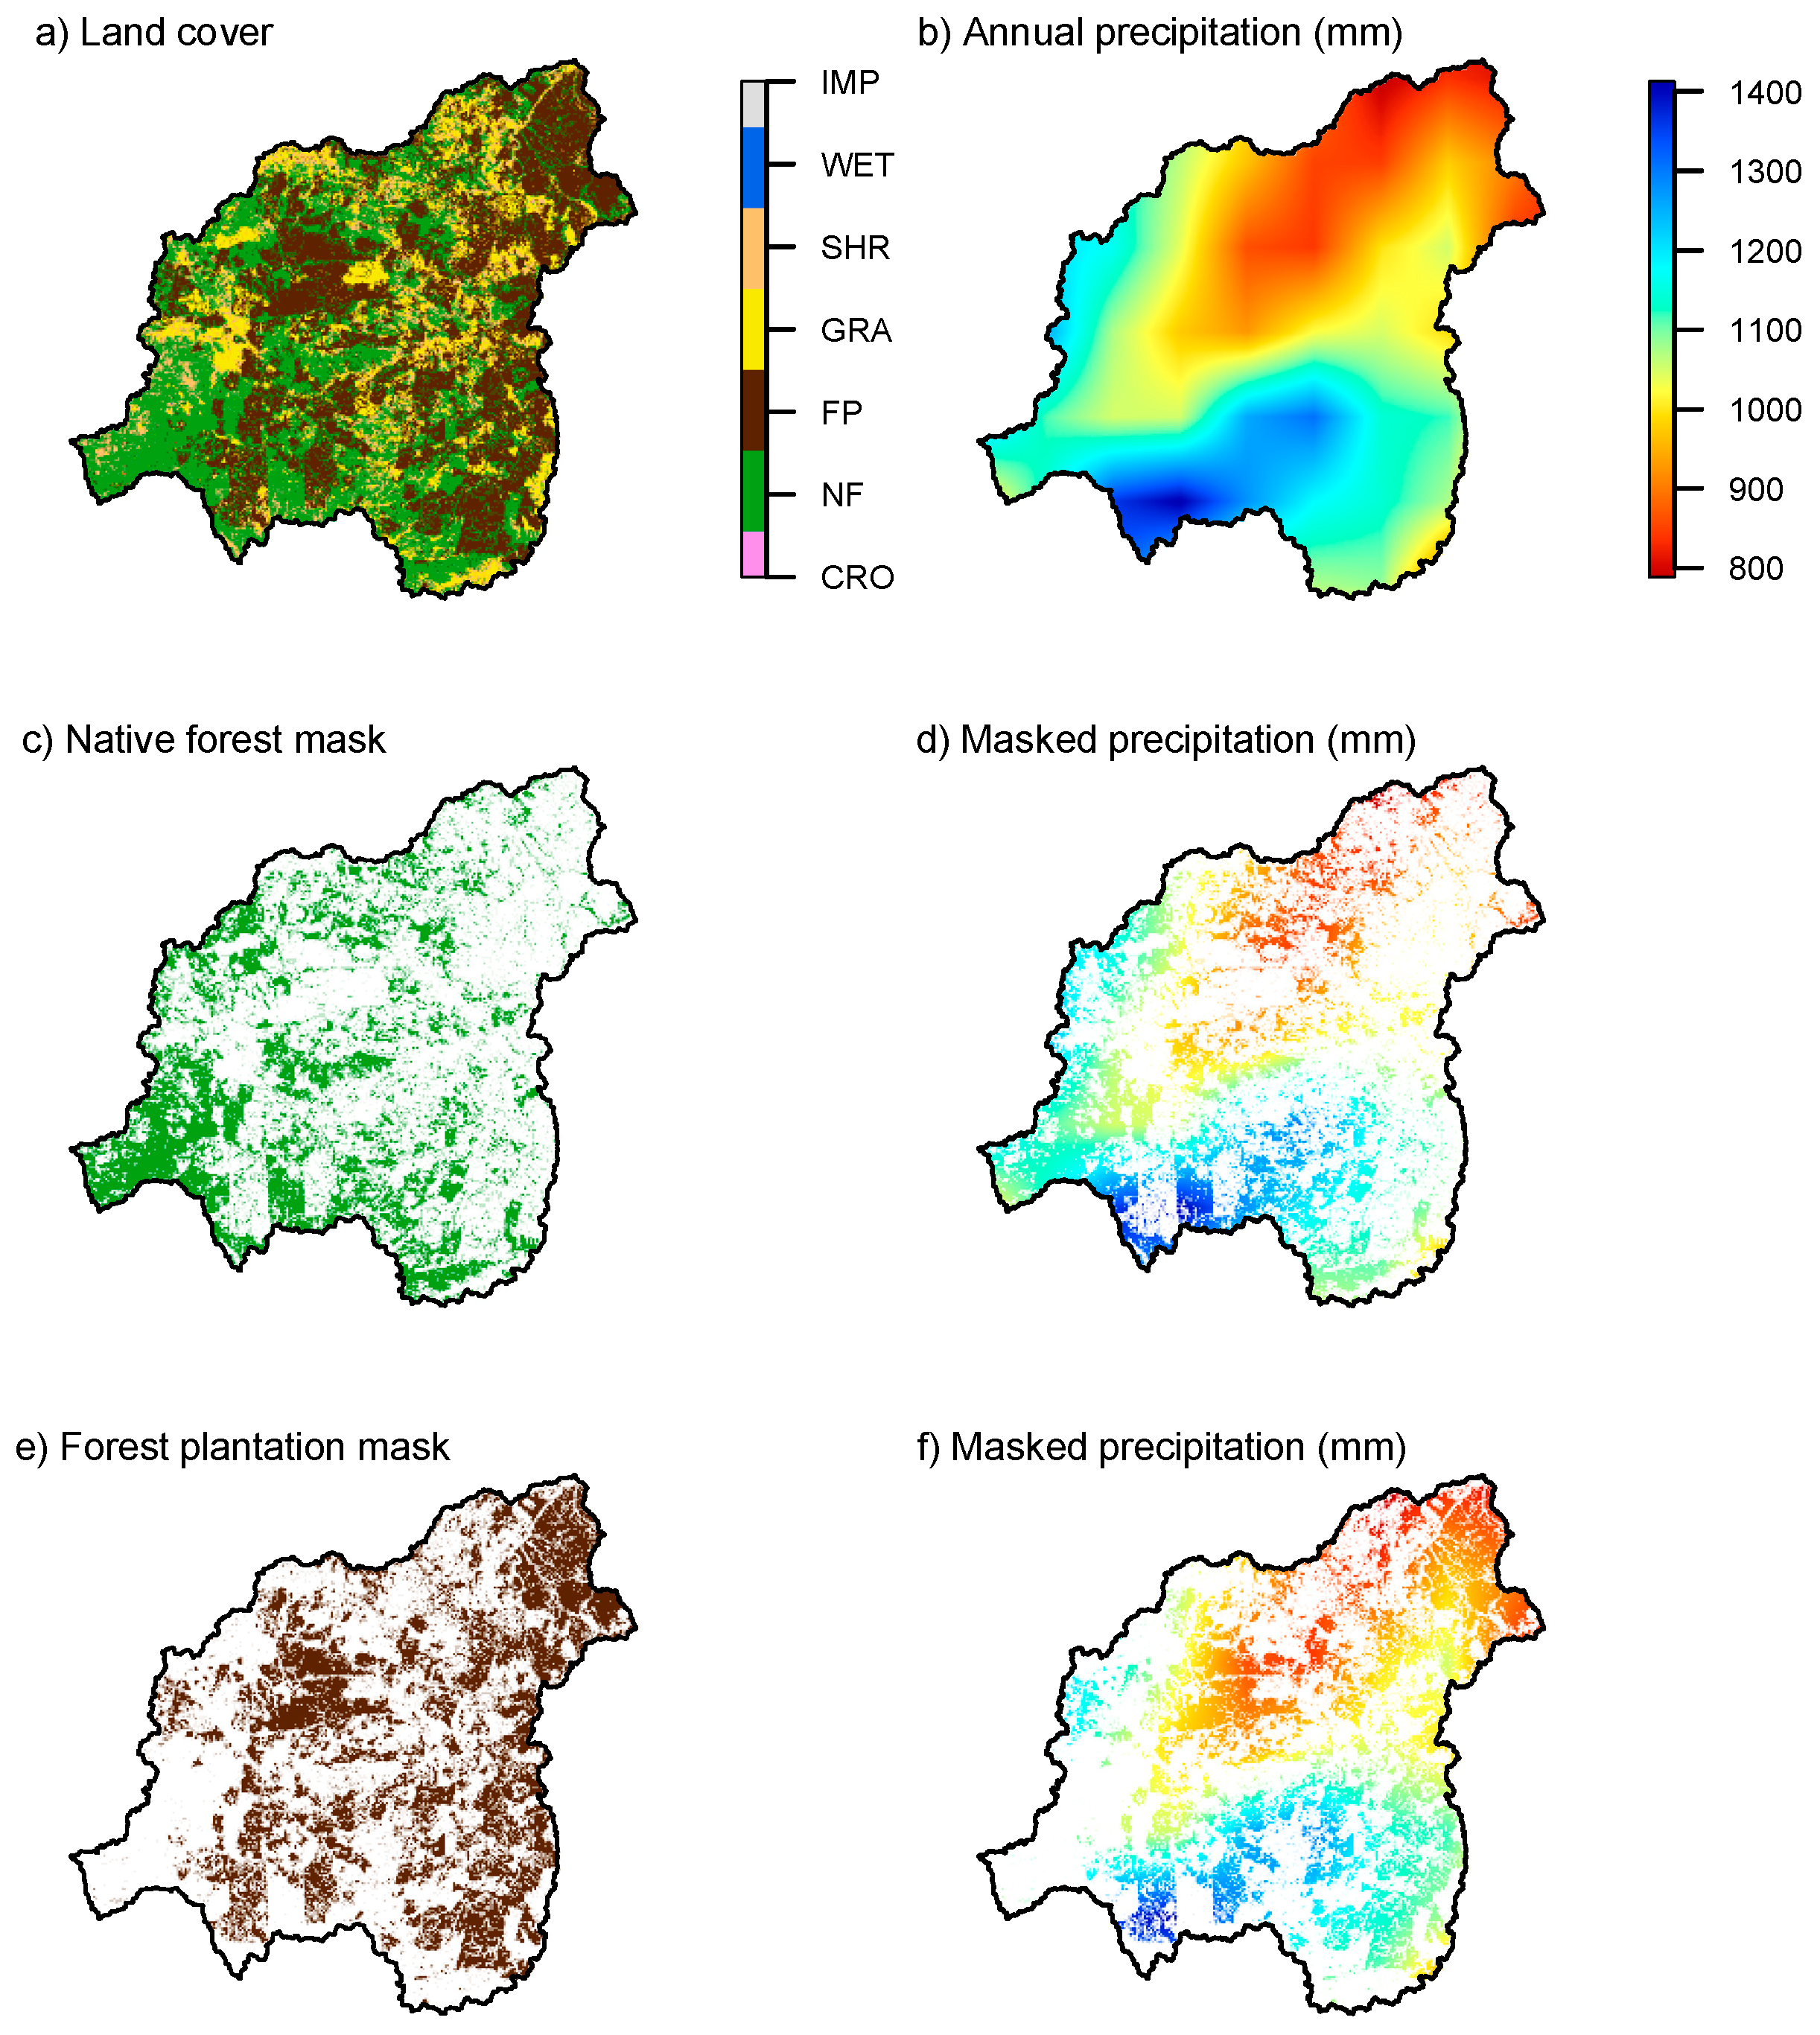
Figure 1 shows the selected catchments, which cover five administrative districts over the study region (35° S–41° S). The study basins feature diverse land cover classes (panel a, obtained from the land cover map provided by [33]) and climatic conditions (panels b and c). The watersheds areas range from 211 km2 to 11,137 km2, with mean elevations ranging from 137 m a.s.l. to 1264 m a.s.l. and mean slopes ranging from 74 m km−1 to 239 m km−1. Although there is a greater presence of forest plantations towards the coastal region north of 39°S (Figure 1a), several CAMELS-CL catchments within this region were not selected given the high percentage of cropland within those basins.
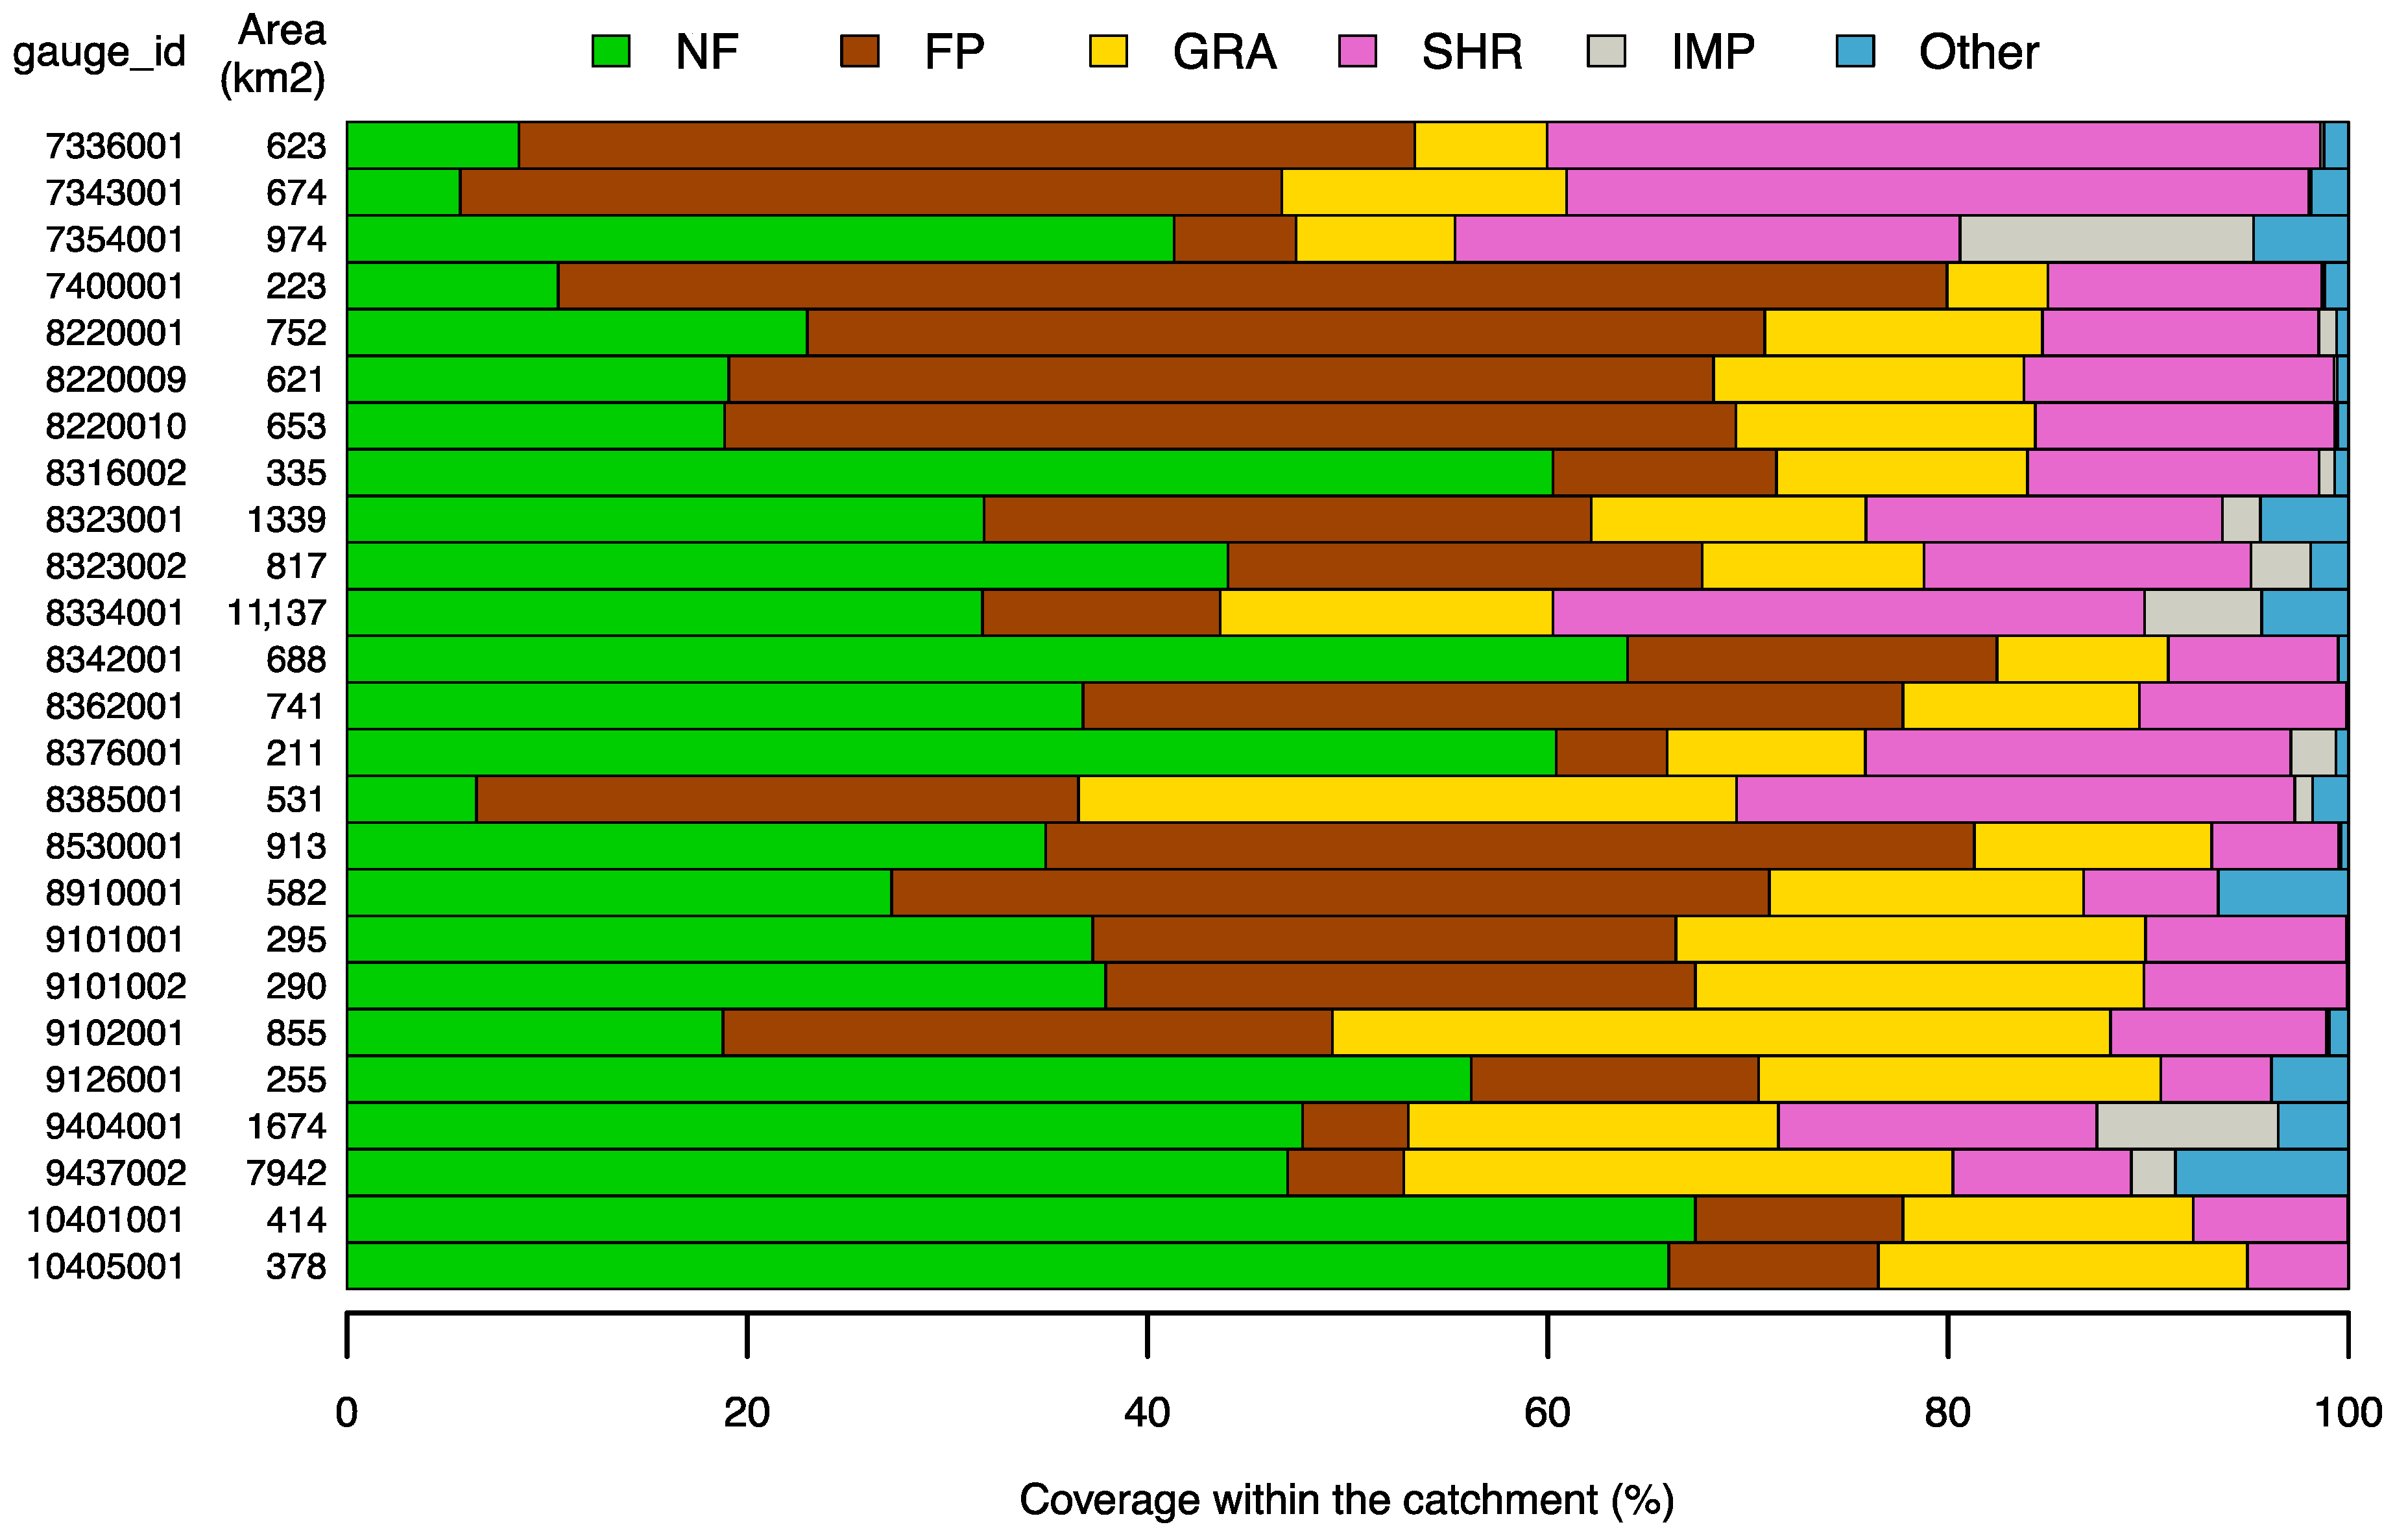
To visualize the land cover composition of the study catchments, Figure 2 shows the percentages of the basin area covered by the main land cover classes of the study region. It can be seen that the selected catchments feature a mosaic of land cover types, with greater presence of shrubland and forest plantation in the north, and larger areas of native forest towards the south.
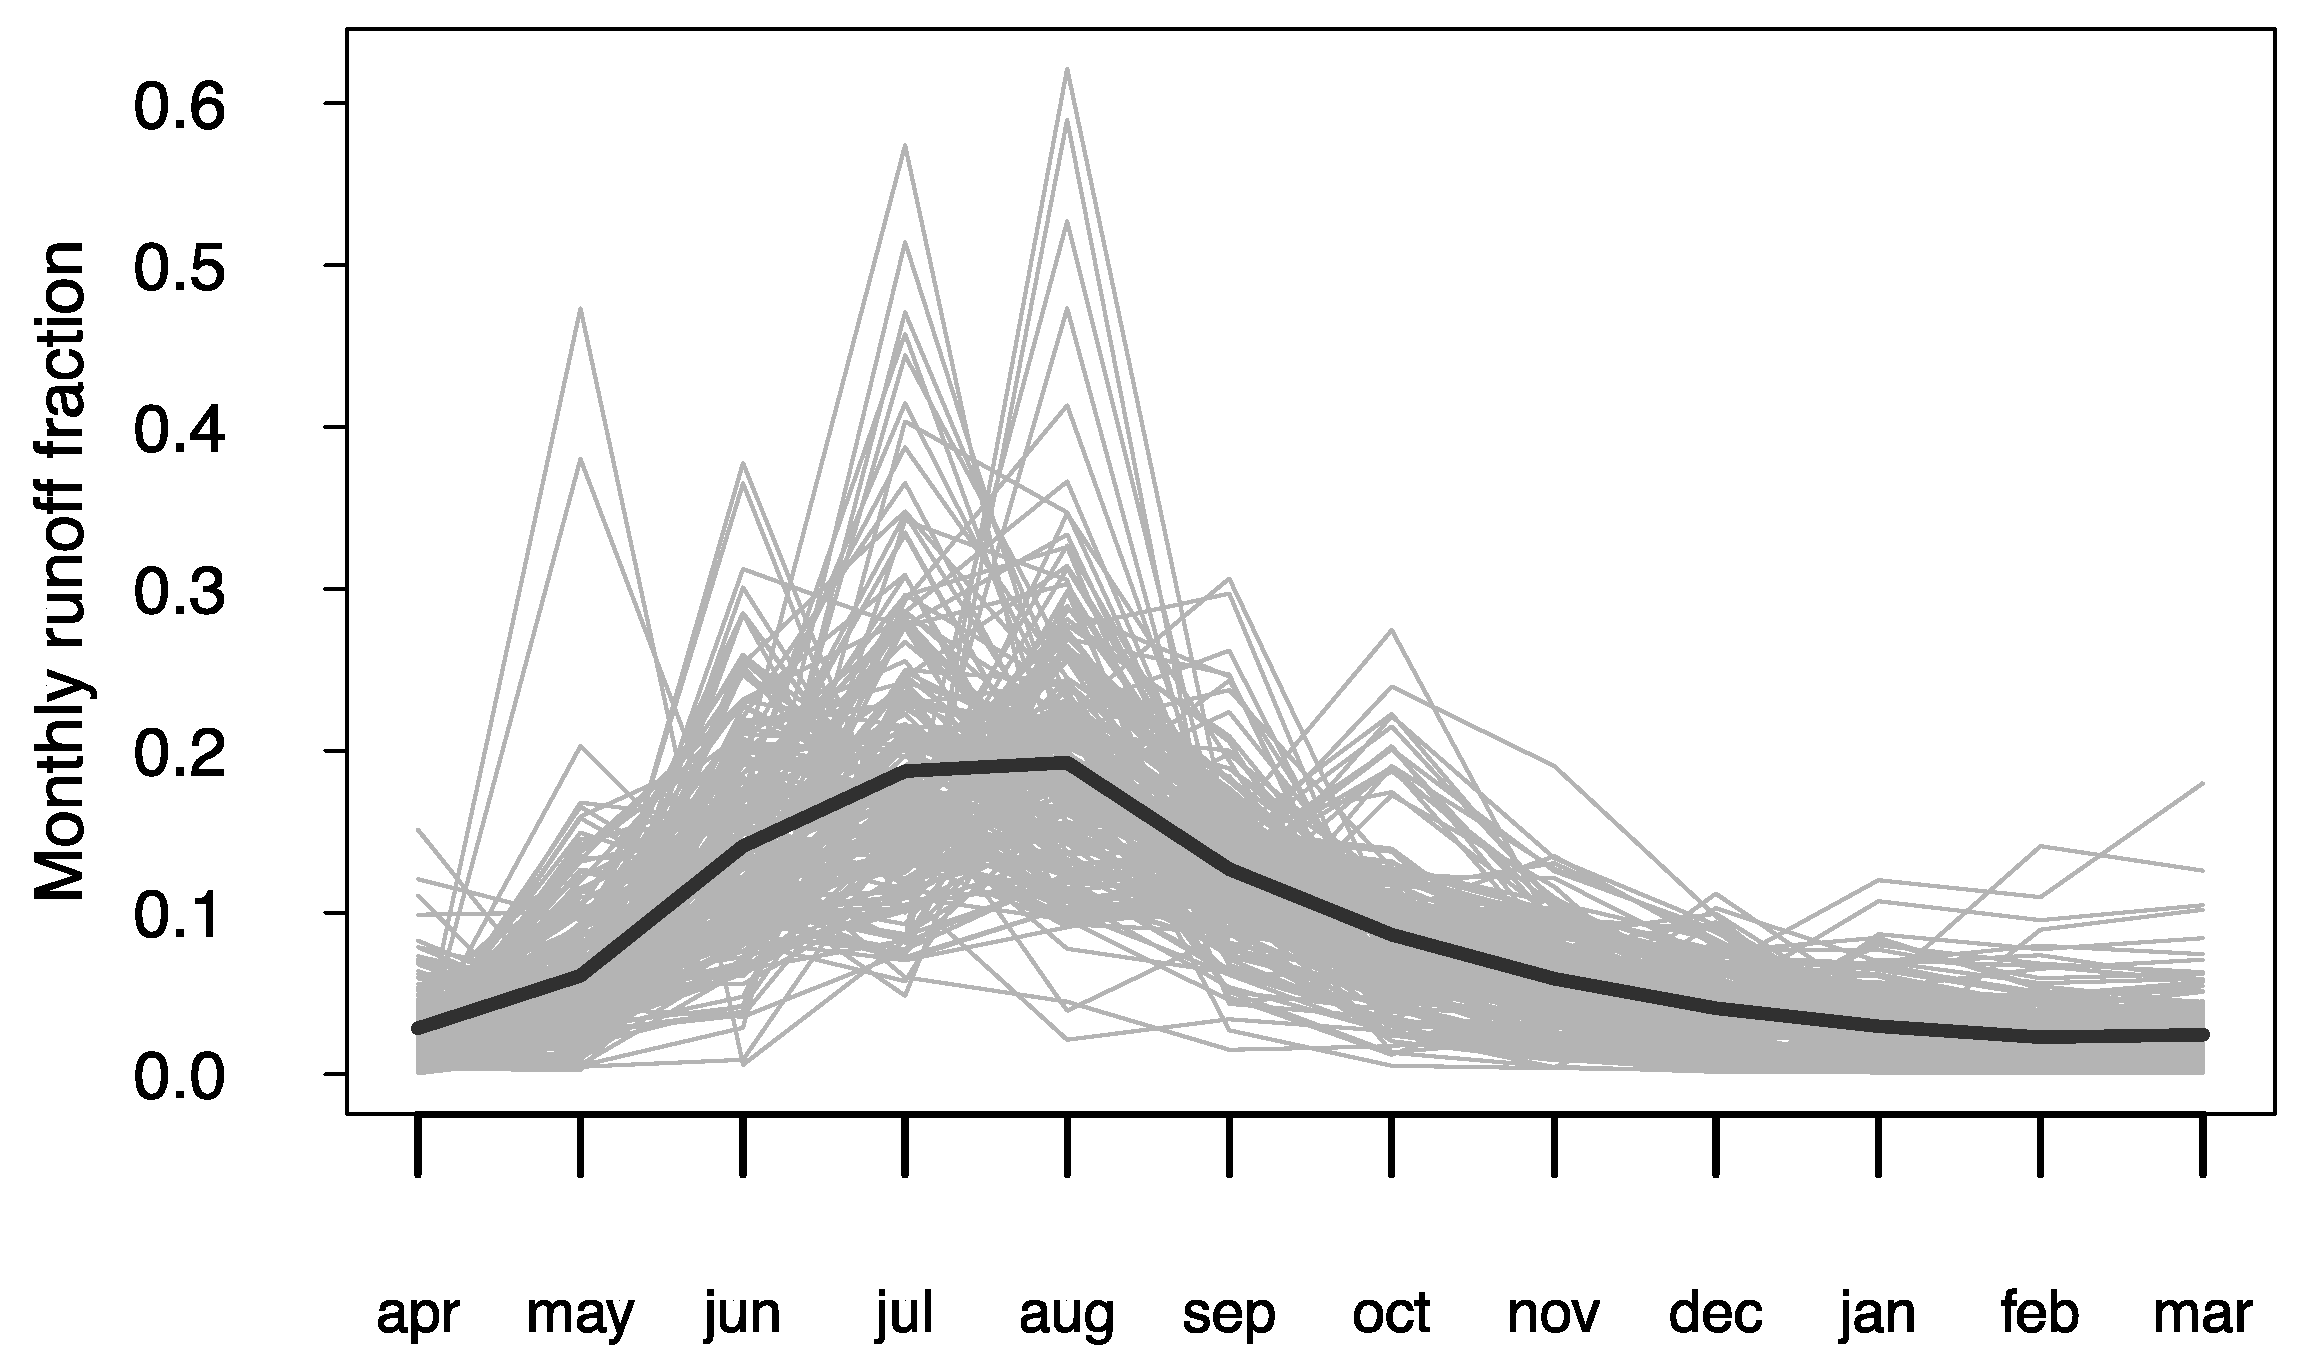
The mean hydrologic behavior of the study catchments is illustrated in Figure 3, where the mean monthly streamflow (expressed as a fraction to the annual streamflow) is plotted for each basin. The streamflow seasonality indicates a prevailing pluvial regime governing the hydrologic response in most catchments. This suggests that snow accumulation and melting processes in high-elevation catchments (20% of the basins have mean elevations above 1000 m a.s.l.) do not dominate their main hydrologic response. The selected catchments are therefore comparable in terms of the governing hydrologic regime.

3. Methods

3.1. Linear Regresion Model

The objective of this work is to quantify and evaluate the effects of natural vegetation and forest plantation on the mean hydrologic response of a catchment. We address this by setting up a linear model representing the annual water balance within the catchments. The annual runoff within a catchment ( Q ) can be expressed as:
Q = LC i   Q i ,
where LC i is the fraction of the different land cover classes within a catchment (i.e., LC i = 1 ). Under the assumption that runoff generation mechanisms are similar within a same land cover class, the annual runoff generated within class i can be expressed as:
Q i = a i +   b i P i ,
where a i and b i are regression coefficients, and P i is the annual precipitation associated to land cover class i . P i is obtained by intersecting the land cover map with the annual rainfall gridded data. Since the latter has a native resolution of 5 km, we downscaled it into a 30-m-grid (the resolution of the land cover map) through bilinear interpolation, and then performed the intersection with land cover. In this way, the total runoff within the study catchments, for a specific year, can be expressed as:
Q   = a +   i = 1 4 b i LC i   P i .
where a = a i and b i (i = 1 to 4) are the regression coefficients associated to land covers NF, FP, GRA and SHR, respectively. Given that the impervious (IMP) and barren areas within the catchments are negligible for most catchments (IMP class in Figure 2), they are not included as predictors in Equation (3). For those catchments with IMP fractions above zero, we assume that the annual precipitation fell over that land cover class ( IMP   P IMP ) contributes to runoff without losses, thus Q in Equation (3) corresponds to Q     IMP   P IMP .
With this water balance representation, we account for the spatial distribution of land cover and precipitation within the basin. This aims at disentangling the aggregated effect on runoff generation coming from land cover classes correlated with precipitation, which may occur due to a natural configuration of the landscape combined with anthropic land cover interventions. In Equation (3), each catchment–year pair provides an observation for the total sample, which results in a sample size of 206.
The model predictors and other catchment characteristics are explored by analyzing their pair-wise correlations. The quality of the fitted model is assessed with the coefficient of determination (R2) and the mean absolute percentage error (MAPE). In addition, the model residuals are tested for the normal distribution hypotheses using the Shapiro–Wilk normality test from the ‘stats’ package in R [34].

3.2. LULCC Experiment

In this experiment, we used the linear model described in Section 3.1 to evaluate hypothetical cases of LULCC within a catchment. Following the main LULCC pathways in this region over the last decades [35], we designed an experiment where areas of NF, GRA and SHR within a catchment are incrementally replaced by FP. We defined FP increments varying from 1000 to 4000 ha. If a FP increment is greater than the total area of the replaced land cover class, the experiment stops in that catchment. The range of FP increments is adopted based on the initial areas of NF, GRA, and SHR within the catchments. The choice of the units of the FP increments (absolute areas instead of percentages of catchment area) is arbitrary, but do not affect the results as long as their interpretation is coherent with the definition.
To explore potential differences of LULCC impacts due to climatic conditions, the catchments were classified based on their aridity index (provided in [31]). The aridity index (mean annual potential evapotranspiration normalized by mean annual precipitation) represents the relation between energy availability and water availability. We selected two groups of catchments: group A, with 13 drier catchments with aridity indices ranging from 0.7 to 1.5; and group B, with 12 more humid catchments with aridity indices between 0.45 and 0.6.
Based on the changes in annual runoff due to FP increments (varying from 1000 to 4000 ha), we calculate the rate of mean change in annual runoff for a hectare of replaced land cover. This is done for each land cover replaced and each catchment group (A and B) and for all catchments.

3.3. NDC Afforestation Experiment

A second experiment was designed upon the results from the first experiment. Based on the rates of change in annual runoff per hectare of FP increment, we quantified the impacts on water supply resulted from an afforestation effort equivalent to that pledged in the Chilean NDC (100,000 ha of planted trees, [30]). This experiment also includes the plantation of NF at the expense of other land cover classes (for all tested combinations explained below, there is a percentage of the afforestation area planted with NF). To compute the rates of change in annual runoff per hectare of NF increment, we implemented a similar LULCC experiment as defined in Section 3.2, but under a scenario of NF increments.
At present, the Chilean NDC declares that the afforestation will be mainly with native species, but its actual proportion has not been defined. Based on this, for this exercise we tested different combinations of FP and NF (FP to NF ratios increasing from 0 to 1, with a step of 0.1) to fulfill a total area of 100,000 ha. For all cases, GRA and SHR areas are evenly replaced by the FP and NF portions of the total tree-covered area. For example, a FP to NF ratio of 0.4 corresponds to a mitigation strategy implemented by the plantation of 40,000 ha of FP (replacing 20,000 ha of GRA and 20,000 ha of SHR) and 60,000 ha of NF (replacing 30,000 ha of GRA and 30,000 ha of SHR).

4. Results

4.1. Modelling Annual Runoff

The annual runoff co-variability with the catchment precipitation, topographic and land cover characteristics is presented in Figure 4. To simplify visualization, annual runoff and precipitation are represented by their mean annual values. A heatmap with similar patterns was obtained when using Spearman correlation coefficients, thus we assume that a linear model is suitable for explaining monotonic relationships between annual runoff and catchment attributes.
Figure 4 indicates that mean annual runoff has a positive, statistically significant correlation with mean annual precipitation, mean elevation, mean slope, and the impervious and native forest fractions within the catchment. A statistically significant positive relation of precipitation with both elevation and slope is also obtained, in line with the expected orographic effect exerted by the Andes and Coastal ranges. There is also high correlation between precipitation and the catchment land cover, such as NF, FP and IMP, which alerts for potentially misleading relations. The high collinearity between the variables assessed poses a challenge for isolating causal relationships between these land cover classes and the catchment annual runoff.
For example, higher annual runoff is observed in catchments with larger fractions of NF, but we need to disentangle how much of the increased runoff is explained by having more NF and how much is explained by the fact that NF is usually located in higher parts of the catchment, with steeper slopes, and thus higher precipitation (and vice versa for FP). This confounding effect is illustrated in Figure 5, where we see that annual runoff is highly correlated with annual precipitation, while higher (lower) values of both variables are also associated with higher NF (higher FP).
Another aspect to highlight in Figure 5 is that several points lie above the 1:1, implying that there is more water leaving the basin than that entering as precipitation (i.e., the water balance is not closed). This problem has already been reported and has been explained by a consistent precipitation underestimation over mountain regions by different precipitation products (including the CR2MET product used here) [31].
To further explore the relation between precipitation and topographic characteristics (all features that modulate runoff generation mechanisms), Figure 6 shows the scatter plot between mean annual precipitation (P), mean slope (SLP) and mean elevation (ELV), for FP (panel a) and NF (panel b). These plots confirm the high correlation between P, SLP, and ELV within a same land cover type. In fact, if we fit linear regressions to explain P as a function of SLP and ELV (for FP and NF covers), we get that these topographic predictors explain 80% and 92% of the variance in P, for FP and NF, respectively.
The collinearity between precipitation (representing also topographic characteristics) and land cover classes is addressed by accounting for their spatial distribution within the catchments when computing the model predictors in Equation (3). The procedure is shown in the example in Figure 7. With this, we avoid compensation artifacts (given the correlation between precipitation and land cover) of the fitted regression coefficients in Equation (3). Further, this water balance representation—as formulated in Equation (3)—also accounts for topographic characteristics, and their difference within land covers.
The fitted model from Equation (3) is presented in Figure 8. The model explains 84% of the variance in annual runoff, with a MAPE of 29%. The statistic W from the Shapiro–Wilk test equals 0.97 (p-value = 0.0002), therefore, the null hypothesis for the normality of residuals is not rejected.

4.2. LULCC Experiment Results

The predicted changes in annual runoff under scenarios where NF, GRA and SHR covers are replaced by patches of FP (varying from 1000 to 4000 ha) are presented in Figure 9. The boxplots in Figure 9 reveal a consistent decrease in annual runoff due to the expansion of FP at the expense of other land cover classes. The magnitude of the change depends on several factors, including the initial land cover partition, the spatial distribution of the replaced land cover class and its corresponding annual precipitation, the catchment area, and the type of catchment (A or B).
To visualize the dependency to one of these factors, the points plotted on top of the boxplots are colored according to the corresponding catchment area. From this information, we can see larger predicted changes in water supply for smaller catchments; an expected result given the higher proportion of the catchment being replaced in the LULCC experiment.
This scattered visualization of the data also permits identification of those catchments where the LULCC experiment stops at a certain level of increased FP area (e.g., panel a indicates up to 2000 ha of NF can be replaced by FP in the smallest catchment). Although the dispersion is large, higher decreases in mean annual water yields are observed in drier catchments, for all replaced classes. The rate of annual runoff change (slope of median values from the boxplot in Figure 9), expressed as units of percentage change per 10,000 ha of increased FP, are summarized in Table 1.
As a requirement for Section 4.3, a similar LULCC exercise was implemented for the case where FP, GRA and SHR covers were replaced by NF (not shown here). The summary of changes in annual runoff for this case is presented in Table 2.

4.3. NDC Afforestation Results

The changes in annual runoff due to the replacement of GRA and SHR by FP (Table 1) and by NF (Table 2) are used to evaluate the expected changes in water supply due to the different combinations of NF and FP adopted for fulfilling the 100,000 ha afforestation area pledged in the Chilean NDC. The results, presented in Figure 10, indicate that water supply is highly sensitive to the relative area of FP to NF adopted to fulfill the mitigation strategy. For example, FP to NF ratios of 10%, 50% and 90% would lead to 3%, −18% and −40% changes in the mean annual runoff, respectively.

5. Discussion

5.1. Overall Approach

The results of this study rely on the outputs from a linear regression model. Such a model (as any statistical model) gauges correlations between predictors and the response variable that, in many cases, do not account for causality. Future work should explore the use of models based on hydrological processes.
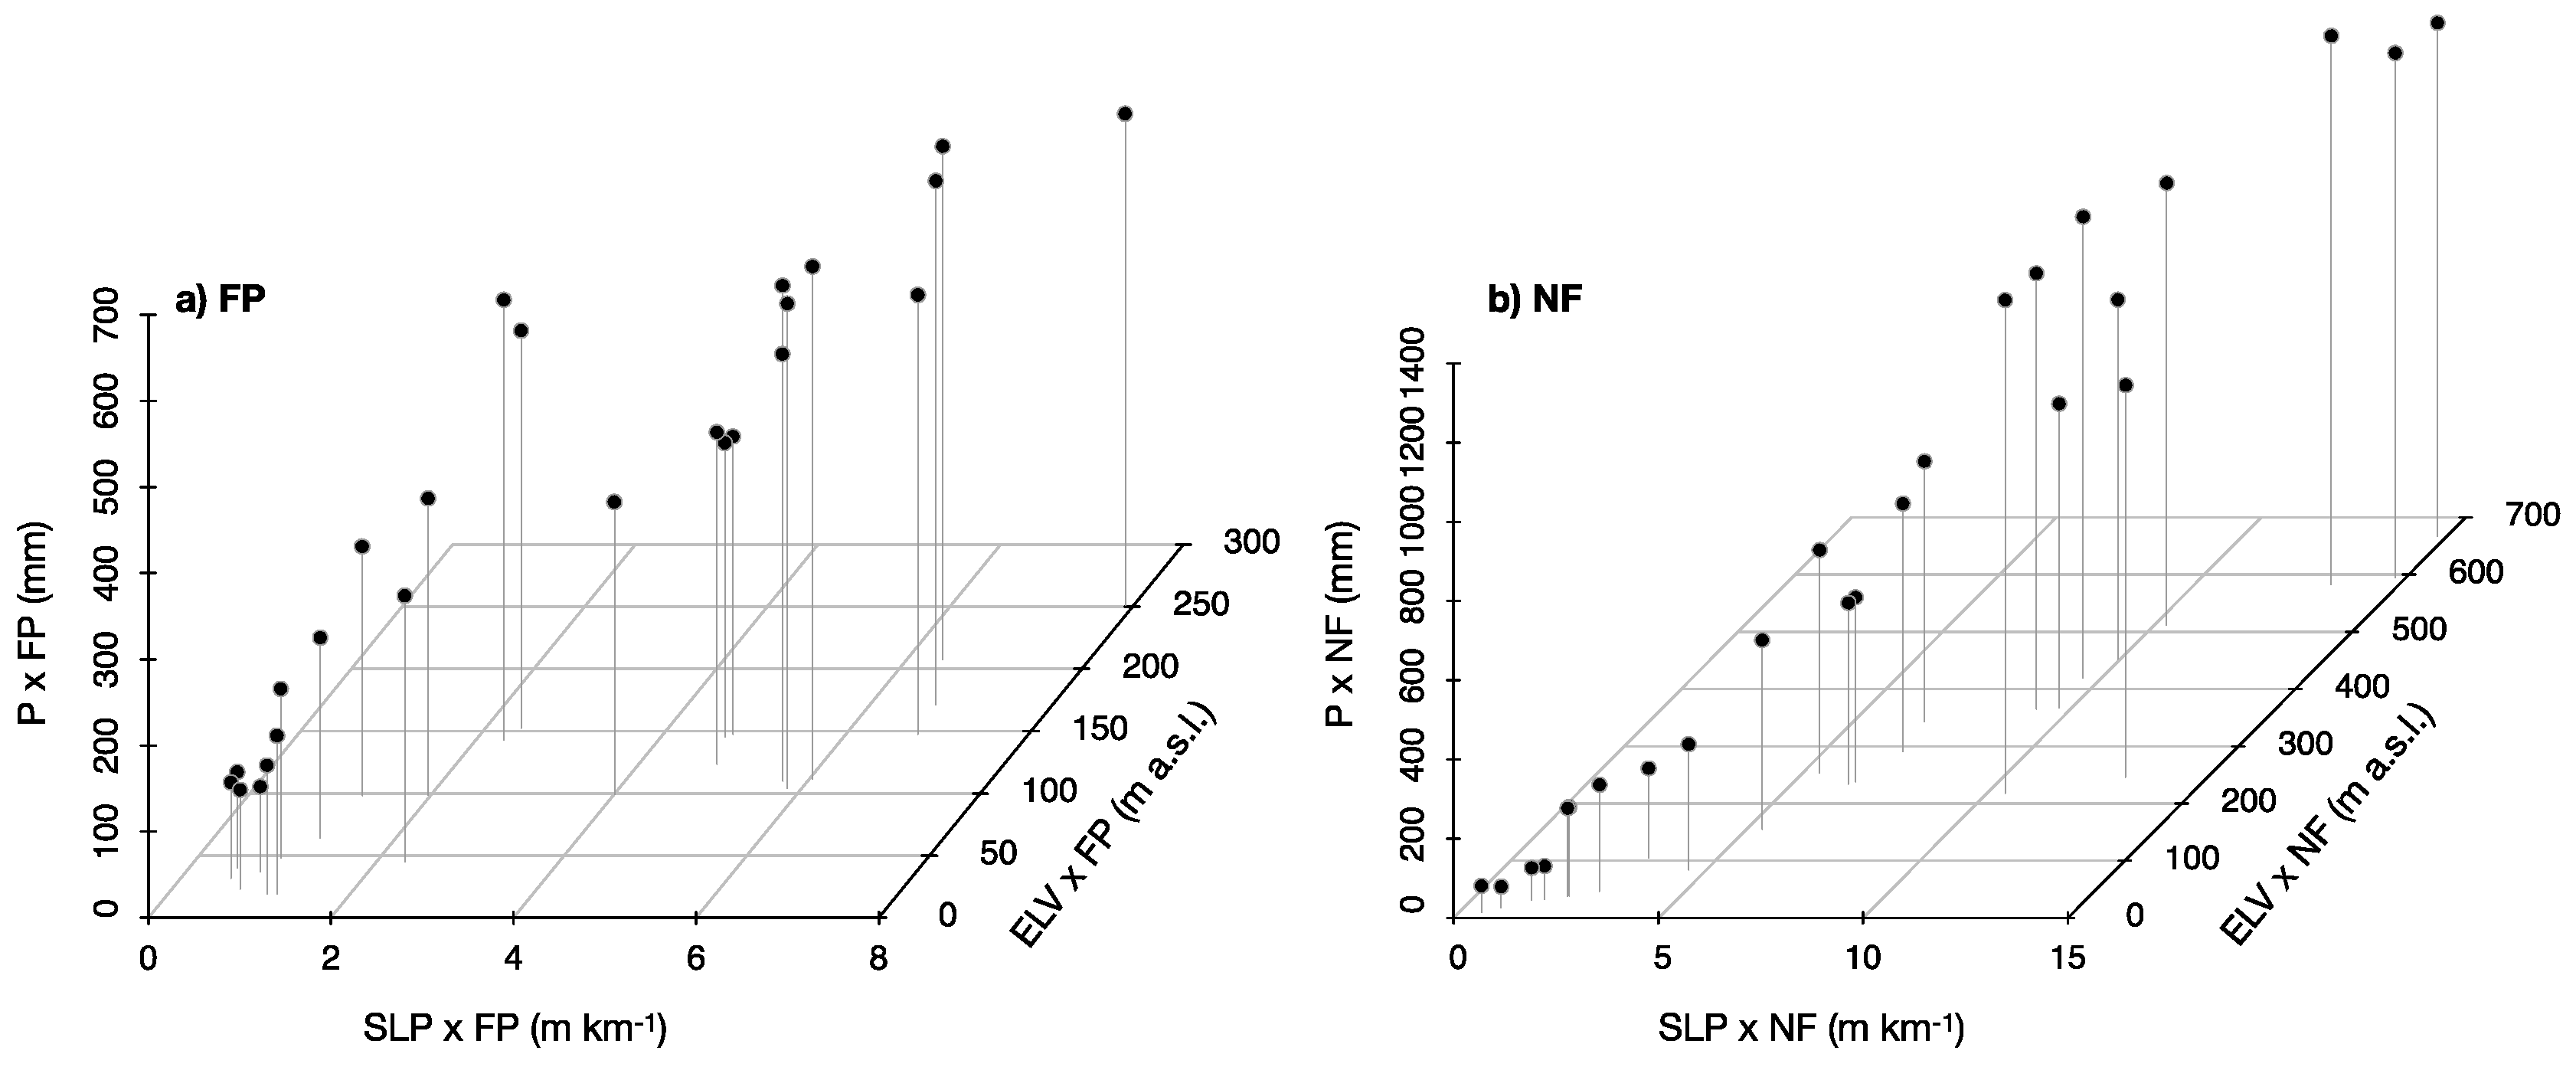
The physical basis of the empirical model proposed in this work is rooted on the annual water balance within a catchment and on the contribution of different land cover fractions to the total generated runoff. Despite this simplified representation of the water balance, the model provides a good representation of the annual runoff generated within forested catchments (Section 4.1), and the water consumption (or runoff generation) derived for the different land cover classes do have a physical plausible explanation.
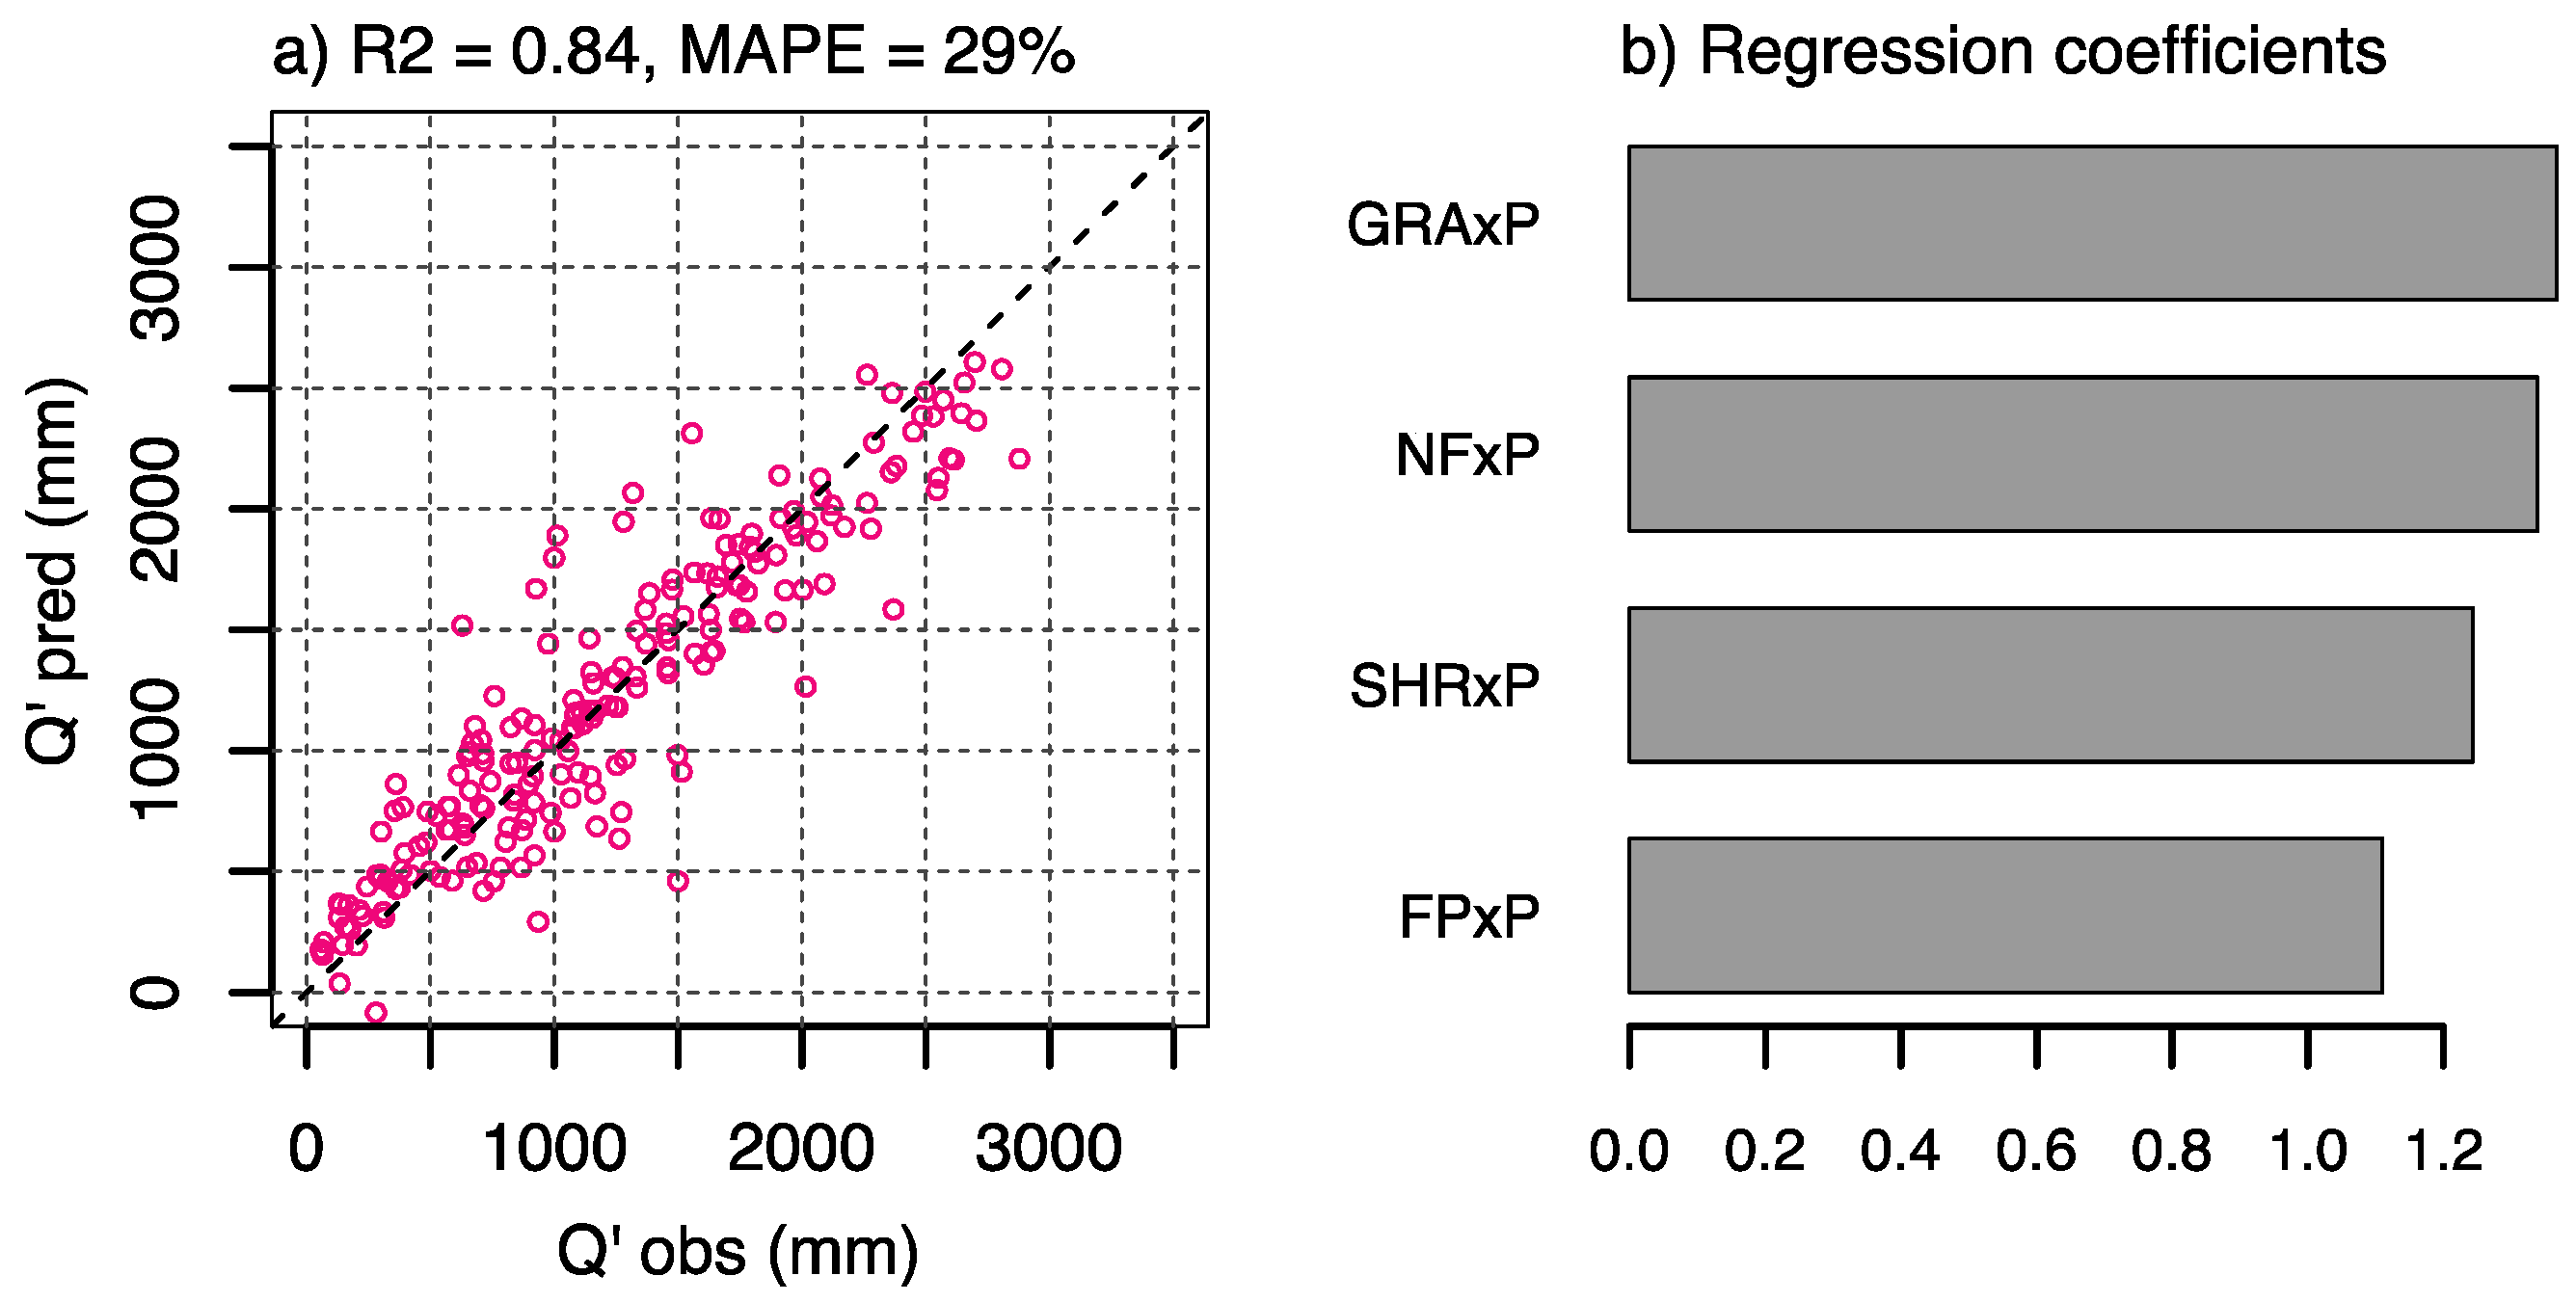
Given the annual precipitation received by each land cover patch within the watershed, GRA appears as the land cover with the highest runoff generation, followed by NF, SHR and finally FP (see regression coefficients in Figure 8b). It should be noted that the model is not forced to intercept zero, therefore the regression coefficients should not be directly interpreted as the classical annual runoff coefficients (also known as runoff ratios [31]) for each land cover class. The higher runoff generation indicated for GRA is consistent with its lower evapotranspiration rates compared with the other classes [15,36]. The higher water consumption in FP compared to NF is also consistent with higher evapotranspiration rates and lower soil water storage documented for FP compared with NF [15,20,21,22,23]. The interpretation of SHR regression coefficients might be subject to pixel classification errors (as discussed in Section 5.2).
While the model represents the overall catchment response (based on the total fractions of FP, NF, GRA and SHR within the catchments), local runoff generation mechanisms may change depending on the location of these land cover types within the basin, besides the effect of internal precipitation variation. In fact, water consumption of a same land cover class may change depending on its topographic position, since topography modulates water availability within the soil (lowlands may feature higher water availability than sharp sloped areas). On the other hand, land covers located in lowlands are subject to higher atmospheric demand due to highest air temperature and less humidity condition, leading to higher potential evapotranspiration and vapor pressure deficits, therefore more actual evapotranspiration is expected in those areas. That process can more intensively affect soil water depletion and hence summer flows.
Further, soil characteristics are affected by the land cover, particularly in watersheds where forest industrial activity is intensive. The extensive clear-cut strategy and the use of machinery for forest harvesting can cause soil compaction and the reduction of macropores, which reduces soil water holding capacity [37]. Soil compaction and lower soil water storage associated with FP (compared to NF) may induce lower infiltration (less water contributing to baseflow), and therefore higher surface runoff. If storm events were analyzed, this effect should appear in the results. At the annual scale used here, the higher surface runoff from FP at specific events probably gets compensated by higher losses by evaporation from the surface, lower baseflow during no recharge periods or the summer season, and higher water consumption (higher evapotranspiration).
A way to account for these effects could be to formulate model predictors for different elevation or precipitation bands within the catchments (at the expense of decreasing model parsimony). Further, future work could also incorporate predictors accounting for soil spatial information for each land cover class.
Another important limitation of the empirical approach followed in this study is that the CAMELS-CL dataset does not provide a historical pathway of land cover within the catchments assessed here (we used a fixed national land cover map of 2014). To the best of our knowledge, such information is not available from other sources either (it should be noted that we require a land cover classification scheme coherent with [33], which differentiates NF from FP).
As explained in Section 2, to deal with the missing temporal land cover information, we assumed that the 2014 land cover provides an adequate representation of the previous 15 years, and thus we computed water balances for the period 2000–2015. This assumption should be valid for NF pixels, unless they correspond to stands younger than 15 years. In such cases, the pixel is probably classified as “mixed forest”, and therefore added to the FP class (details of this land cover aggregation is provided in [31]). In the case of FP pixels, the assumption relies on having adult FP stands (rotation cuts are usually performed at 12 to 22 years). For young FP trees, there is a chance that these were classified as SHR (see discussion in Section 5.2). This point relates to another issue with the land cover data: the land cover map does not provide the age of forests. These limitations restrict our understanding of the relationship between land cover (particularly, NF and FP) and streamflow generation processes. In fact, there is evidence on the different water consumption among stands of different ages [38], and therefore, we could expect that streamflow generation mechanisms change with time in these forested basins.

5.2. Impacts of the Expansion of Forest Plantation on Water Supply

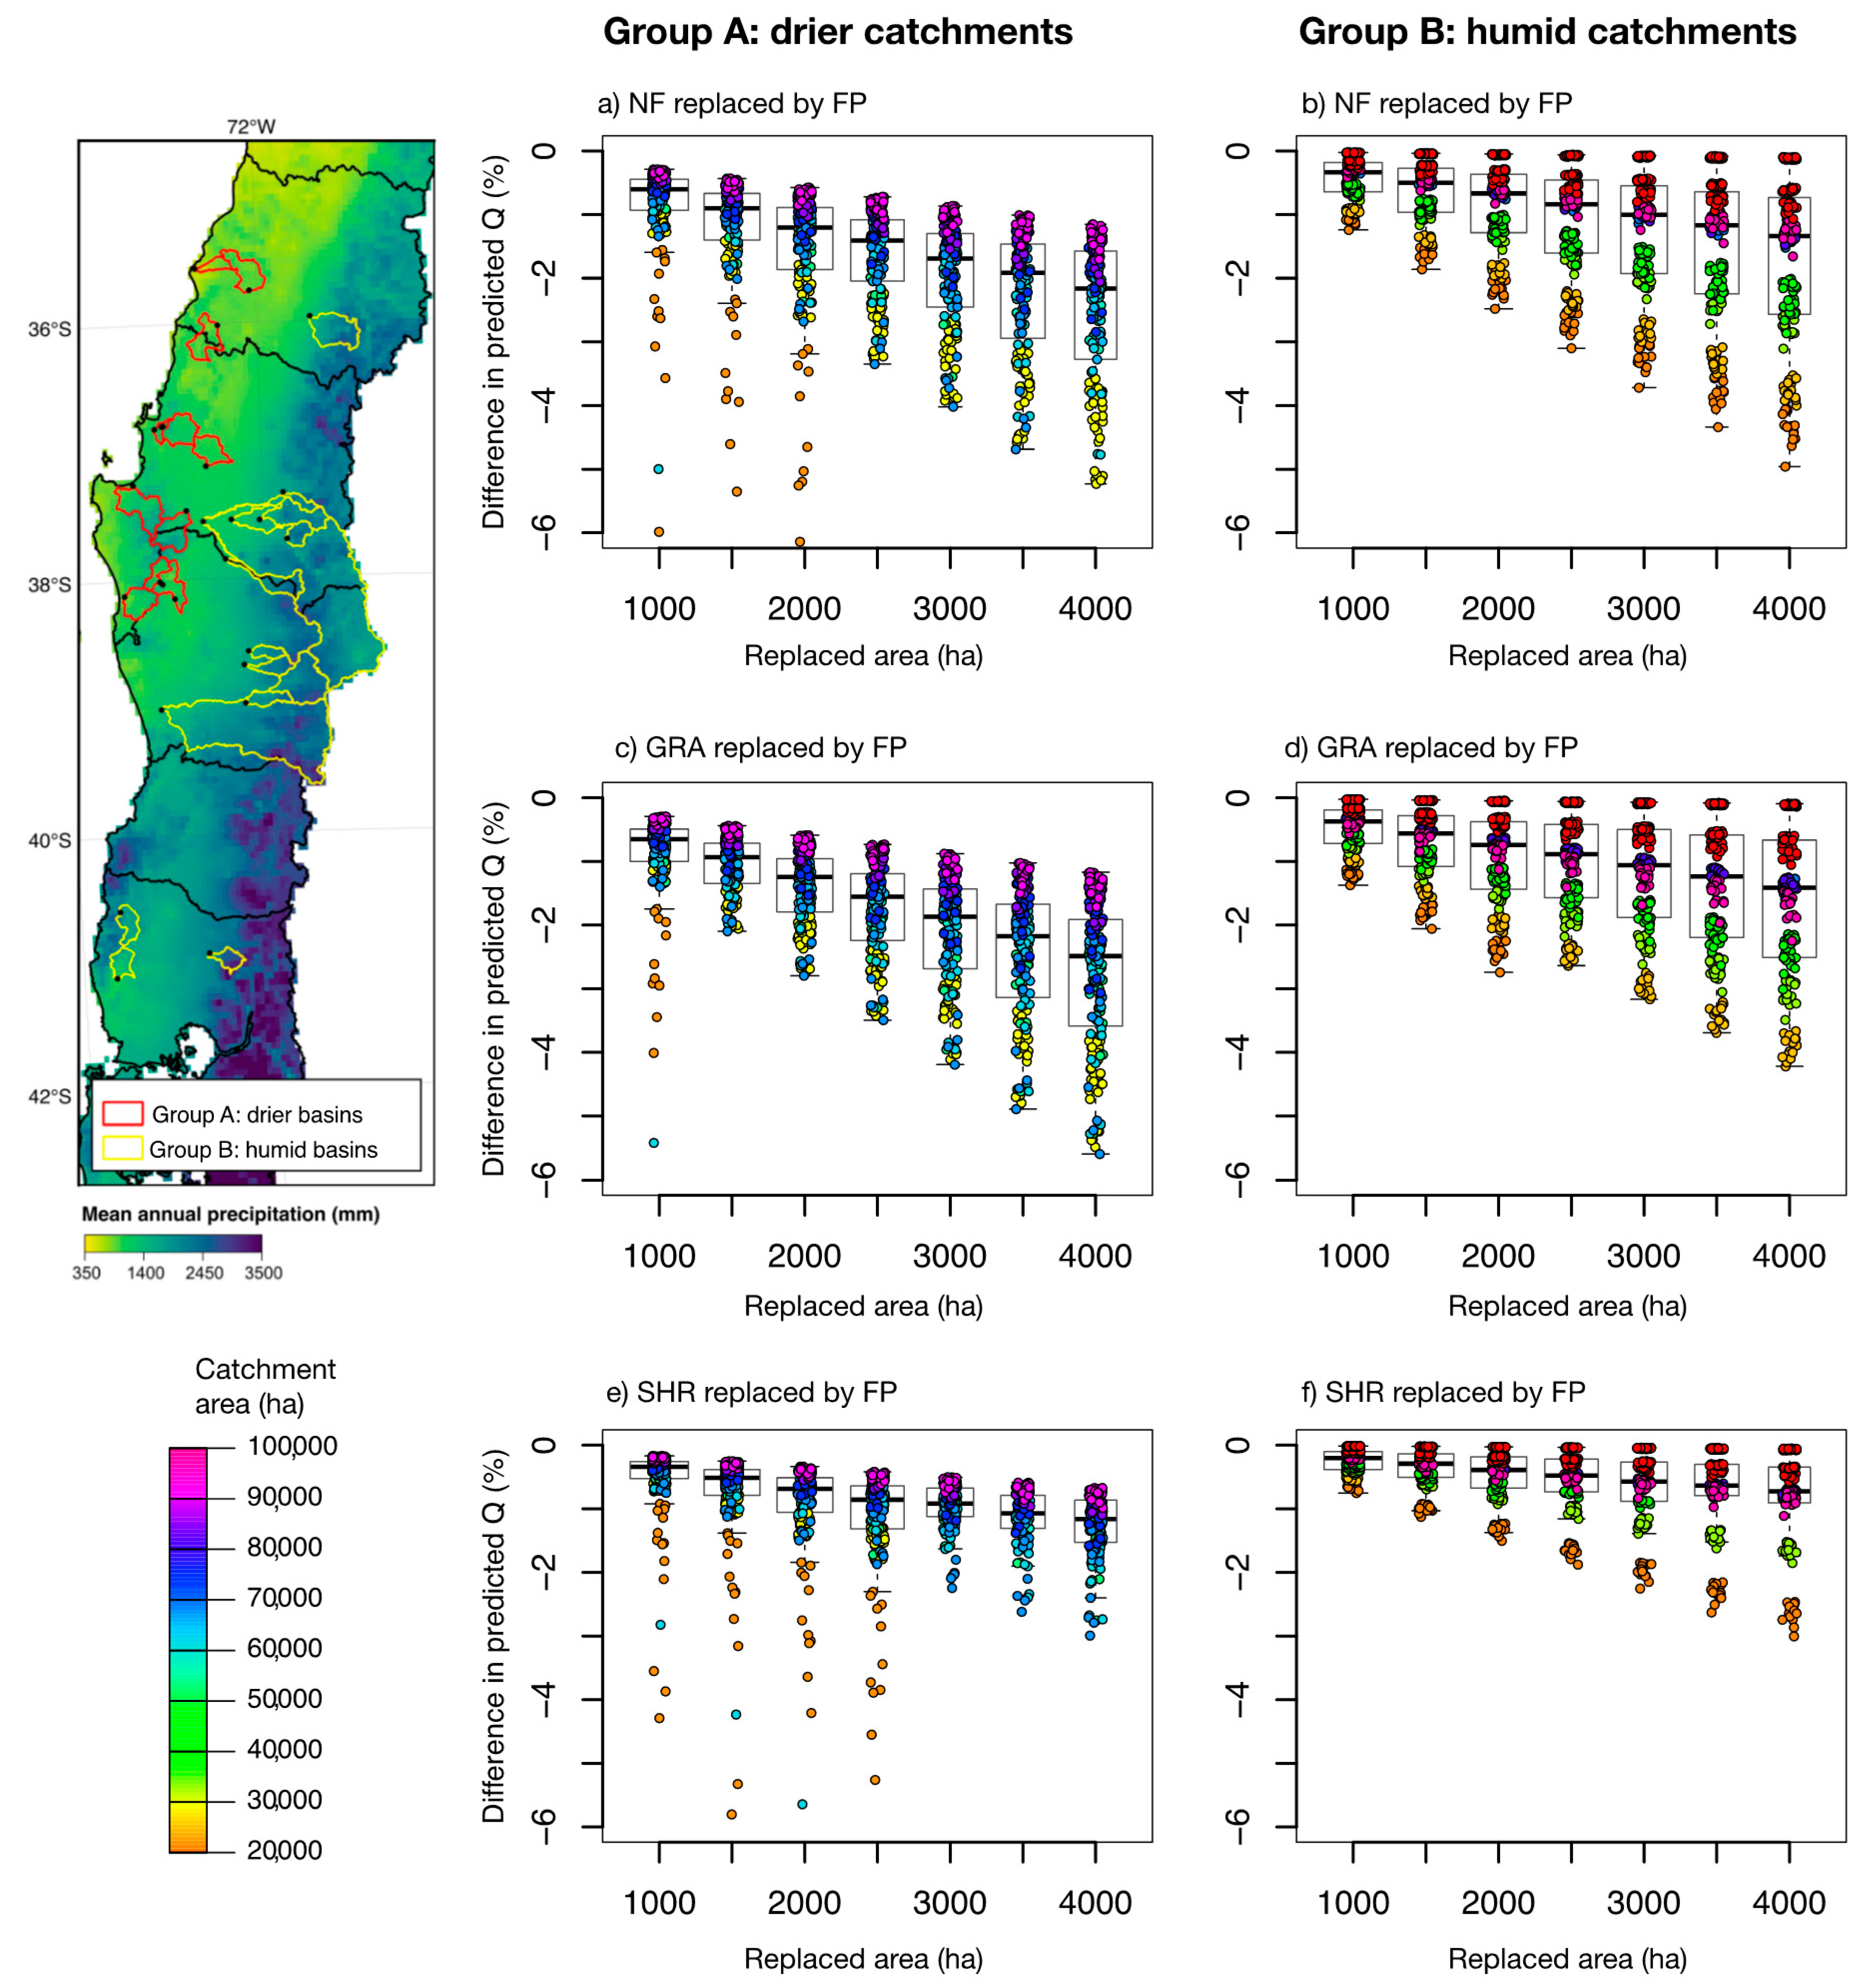
The LULCC experiment indicates that for all catchment types, the expansion of FP has a higher impact when NF and GRA are replaced. This can be explained by the higher water consumption of FP compared to NF and GRA. The difference between FP and GRA is expected given the lower evapotranspiration rates associated to GRA [15]. The higher losses in FP compared to NF suggested by these results would support previous place-based findings reporting higher evapotranspiration rates and lower soil water storage capacity in FP [36].
When SHR is replaced by FP, the change in water supply is not as strong as when NF or GRA are replaced. Despite higher evapotranspiration rates documented for FP as compared to SHR [15,36], Figure 9g and Figure 8h suggest small differences in water consumptions from these two classes. We argue that this effect can be in part attributed to the potential presence of FP within SHR pixels. This mix may occur since young (less than five years) FP trees observed in Landsat images may be classified as SHR pixels. Furthermore, those SHR pixels might have been adult FP harvested in the previous five years. This limitation does not allow to clearly disentangle the effects of FP and SHR. To overcome this, we could use a time series of land cover within the catchment.
Figure 9 indicates that there is a strong dependency of LULCC results on the size of the catchment. For a given area of replaced land cover, the decrease in water supply is higher for smaller catchments. This is consistent with the higher percentage of the area that such an FP increment represents. Additionally, there is more dispersion of points within a same catchment (different basins can be distinguished by the color bar) for smaller catchment areas. The dispersion within a same catchment is due to the different annual precipitation each point represents. To visualize this effect, the color bar used in Figure 9 can be computed based on the annual precipitation, instead of on the catchment area. These results (not shown here) indicate that drier years induce larger decreases in water supply.
In summary, the changes in annual runoff depend on several factors, in particular, the size of the catchment, the type of catchment (drier or humid), and the annual precipitation. This should be considered when interpreting the results presented here, as well as the results from any LULCC experiment. Indeed, the complex interdependency between runoff, land cover and precipitation, makes the results from different studies difficult to compare.

5.3. Impacts of NDC Mitigation Strategy on Water Supply

Regarding the NDC experiment, we should stress that it provides hypothetical scenarios, where the estimated changes in water supply are subject to limitations inherent to the study framework. Model predictions have uncertainties coming from the simplified representation of the water balance, the estimated parameters, and errors in the observed data. In addition, the model is fitted by using information from 25 catchments, which are not representative of the complete southern region of the country (Section 2 summarizes the catchment selection criteria), and do not necessarily coincide with the characteristics of the landscape to be used in the real NDC afforestation plan. Furthermore, the rates of annual runoff change for increments of FP and NF were computed as the mean change for all catchments (Table 1 and Table 2), which is a practical generalization, although it does not account for the higher sensitivity reported for small catchments.
Acknowledging these limitations, the scheme in Figure 10 provides valuable information that might be used for incorporating a water perspective in the decision of what proportion of typical exotic species (pines and eucalypts) versus native forests to use in order to meet the NDC pledged area. At present, this national commitment declares that the afforestation will be mainly with native species, but its actual proportion has not been defined.
In addition, other data could be added to the scheme as a way of incorporating other aspects into the discussion. These aspects may include water demand, national economic growth, promoting development in poor areas, biodiversity conservation, as well as the amount of stocked carbon. To visualize a couple of these aspects, we added hypothetical lines in Figure 10, one related to potential forest industry revenues based on the planted area (and subsequent harvesting) of FP, and a second one related to the total amount of carbon sequestration at year 2050. The decrease in carbon stock with higher FP (higher FP to NF ratio) suggested in Figure 10 is based on the fact that the carbon stored within FP trees will be released back into the atmosphere at harvesting times (given the typical rotation times, harvesting is likely to occur before 2015), while NF trees continue growing and storing carbon [4]. These schematic lines are provided only with the purpose of visualizing the potential value of this exercise when the mitigation strategy is evaluated and discussed from different perspectives.

6. Conclusions

The work presented here corresponds to the first large sample study (25 basins) analyzing the impacts of vegetation cover on water supply, focusing on large catchments (>200,000 ha) in Chile. We proposed an empirical model to represent the annual water balance within a catchment based on the contribution of different land cover fractions to the total generated runoff. We highlighted the main limitations of the approach and recommended strategies to overcome them. These included the use of historical and future land use and land cover pathways, and moving towards a model based on hydrological processes.
The evidence provided here is consistent with previous finding focusing on small experimental watersheds. We showed that annual runoff consistently decreases with increments of FP (at the expense of natural vegetation land covers including NF, GRA and SHR). We highlighted that the magnitude of the change depends on several factors (e.g., initial land cover partition within the basin, the replaced land cover class and the annual precipitation), but most importantly, that it depends on the catchment area. In general, water supply in smaller catchments (areas below 50,000 ha) is more sensitive to land cover changes, and the decrease in annual runoff is further exacerbated during dry years.
In line with current global challenges to dampen global warming, we quantified the impacts on water supply due to different combinations of NF and FP to fulfill the afforestation area pledged in the Chilean NDC (100,000 ha). At present, this national commitment declares that the afforestation will be mainly with native species, but its actual proportion has not been defined. If the FP to NF ratio is set as 0.5, we predict a 18% average decrease (ranging from 7% to 27% decreases for the 75th and 25th percentiles, respectively) in mean annual runoff generated at catchments in central-south Chile. This decrease of water availability would be aggravated if the afforestation is performed within small catchments. In addition, such decreases in water supply would be exacerbated within dry periods, such as the megadrought experienced in the region over the last decade [32,39]. According to climate projections, such dry conditions constitute a probable scenario for the following decades over the region [40]. Therefore, we argue that water availability—under a changing climate—must be incorporated in the discussion of the NDC afforestation strategy, along with other aspects such as carbon stock and economic growth (as proposed in Figure 10).
Overall, the evidence presented here highlight the vulnerability of water supply under LULCC scenarios, especially within the context of climate change. Our results can be used to incorporate a water perspective into public policy and decision making that can effectively lead to achieving a sustainable development. Such development should leverage economic benefits from forests management, the long-term sustainability of the natural systems, and the fulfillment of climate change mitigation goals.

Author Contributions

Conceptualization, C.A.-G., A.L., J.P.B., M.G.; methodology, C.A.-G., A.L., J.P.B., M.G.; formal analysis, C.A.G; investigation, C.A.-G., A.L., J.P.B., M.G.; writing—original draft preparation, C.A.-G., A.L., J.P.B., M.G.; writing—review and editing, C.A.-G., A.L., J.P.B., M.G.; visualization, C.A.-G.

Funding

This research was funded by the Center for Climate and Resilience Research (CR2, CONICYT/FONDAP/15110009). C.A.G. is funded by FONDECYT postdoctoral grant no. 3170428. The development of CR2MET was supported by the Chilean Water Directorate (DGA), through National Water Balance Updating Project DGA-2319, and by FONDECYT grant no. 3150492. M.G. is funded by FONDECYT 1171560.

Conflicts of Interest

The authors declare no conflict of interest. The funders had no role in the design of the study; in the collection, analyses, or interpretation of data; in the writing of the manuscript, or in the decision to publish the results.

References

  1. Foley, J.A.; DeFries, R.; Asner, G.P.; Barford, C.; Bonan, G.; Carpenter, S.R.; Chapin, F.S.; Coe, M.T.; Daily, G.C.; Gibbs, H.K.; et al. Global Consequences of Land Use. Science 2005, 309, 570–574. [Google Scholar] [CrossRef] [PubMed] [Green Version]
  2. Carpenter, S.R.; Mooney, H.A.; Agard, J.; Capistrano, D.; DeFries, R.S.; Díaz, S.; Dietz, T.; Duraiappah, A.K.; Oteng-Yeboah, A.; Pereira, H.M.; et al. Science for managing ecosystem services: Beyond the Millennium Ecosystem Assessment. PNAS 2009, 106, 1305–1312. [Google Scholar] [CrossRef] [PubMed] [Green Version]
  3. Rogelj, J.; Shindell, D.; Jiang, K.; Fifita, S.; Forster, P.; Ginzburg, V.; Handa, C.; Kheshgi, H.; Kobayashi, S.; Kriegler, E.; et al. Mitigation Pathways Compatible With 1.5 °C in the Context of Sustainable Development. In Global Warming of 1.5 °C An IPCC Special Report on the Impacts of Global Warming of 1.5 °C above Pre-Industrial Levels and Related Global Greenhouse Gas Emission Pathways, in the Context of Strengthening the Global Response to the Threat of Climate Change; Masson-Delmotte, V., Pörtner, P.Z., Roberts, H.-O., Eds.; World Meteorological Organization: Geneva, Switzerland, 2018. [Google Scholar]
  4. Lewis, S.L.; Wheeler, C.E.; Mitchard, E.T.; Koch, A. Regenerate natural forests to store carbon. Nature 2019, 568, 25–28. [Google Scholar] [CrossRef]
  5. Masson-Delmotte, V.; Zhai, P.; Pörtner, H.O.; Roberts, D.; Skea, J.; Shukla, P.R.; Pirani, A.; Moufouma-Okia, W.; Péan, C.; Pidcock, R.; et al. (Eds.) IPCC Summary for Policymakers; World Meteorological Organization: Geneva, Switzerland, 2018; pp. 1–32. ISBN 9789291691517. [Google Scholar]
  6. Andreassian, V. Waters and forests: From historical controversy to scientific debate. J. Hydrol. 2004, 291, 1–27. [Google Scholar] [CrossRef]
  7. Jones, J.; Almeida, A.; Cisneros, F.; Iroumé, A.; Jobbágy, E.; Lara, A.; Lima, W.; Little, C.; Llerena, C.; Silveira, L.; et al. Forests and water in South America. Hydrol. Process. 2017, 31, 972–980. [Google Scholar] [CrossRef]
  8. Lara, A.; Little, C.; Urrutia, R.; McPhee, J.; Garreton, C.A.; Oyarzún, C.; Soto, D.; Donoso, P.; Nahuelhual, L.; Pino, M.; et al. Assessment of ecosystem services as an opportunity for the conservation and management of native forests in Chile. Ecol. Manag. 2009, 258, 415–424. [Google Scholar] [CrossRef]
  9. Little, C.; Cuevas, J.G.; Lara, A.; Pino, M.; Schoenholtz, S. Buffer effects of streamside native forests on water provision in watersheds dominated by exotic forest plantations. Ecohydrology 2015, 8, 1205–1217. [Google Scholar] [CrossRef]
  10. Little, C.; Lara, A.; McPhee, J.; Urrutia, R. Revealing the impact of forest exotic plantations on water yield in large scale watersheds in South-Central Chile. J. Hydrol. 2009, 374, 162–170. [Google Scholar] [CrossRef]
  11. Germer, S.; Neill, C.; Vetter, T.; Chaves, J.; Krusche, A.V.; Elsenbeer, H. Implications of long-term land-use change for the hydrology and solute budgets of small catchments in Amazonia. J. Hydrol. 2009, 364, 349–363. [Google Scholar] [CrossRef]
  12. Almeida, A.C.; Soares, J.V.; Landsberg, J.J.; Rezende, G.D. Growth and water balance of Eucalyptus grandis hybrid plantations in Brazil during a rotation for pulp production. Ecol. Manag. 2007, 251, 10–21. [Google Scholar] [CrossRef]
  13. Calder, I.R. Forests and water—Ensuring forest benefits outweigh water costs. Ecol. Manag. 2007, 251, 110–120. [Google Scholar] [CrossRef]
  14. Farley, K.A.; Jobbágy, E.G.; Jackson, R.B. Effects of afforestation on water yield: A global synthesis with implications for policy. Chang. Boil. 2005, 11, 1565–1576. [Google Scholar] [CrossRef]
  15. Huber, A.; Iroumé, A.; Bathurst, J. Effect of Pinus radiata plantations on water balance in Chile. Hydrol. Process. 2008, 22, 142–148. [Google Scholar] [CrossRef]
  16. Iroumé, A.; Palacios, H. Afforestation and changes in forest composition affect runoff in large river basins with pluvial regime and Mediterranean climate, Chile. J. Hydrol. 2013, 505, 113–125. [Google Scholar] [CrossRef]
  17. Llerena, C.; Hermoza, R.M.; Llerena, L.M. Plantaciones forestales, agua y gestión de cuencas. Debate Agrar. Análisis y Altern. 2007, 42, 79–110. [Google Scholar]
  18. Scott, D.F.; Lesch, W. Streamflow responses to afforestation with Eucalyptus grandis and Pinus patula and to felling in the Mokobulaan experimental catchments, South Africa. J. Hydrol. 1997, 199, 360–377. [Google Scholar] [CrossRef]
  19. Scott, D.F. On the hydrology of industrial timber plantations. Hydrol. Process. 2005, 19, 4203–4206. [Google Scholar] [CrossRef]
  20. Almeida, A.C.; Smethurst, P.J.; Siggins, A.; Cavalcante, R.B.L.; Borges, N. Quantifying the effects of Eucalyptus plantations and management on water resources at plot and catchment scales. Hydrol. Process. 2016, 30, 4687–4703. [Google Scholar] [CrossRef]
  21. Jobbágy, E.G.; Acosta, A.M.; Nosetto, M.D. Rendimiento hídrico en cuencas primarias bajo pastizales y plantaciones de pino de las sierras de Córdoba (Argentina). Ecol. Austral 2013, 23, 87–96. [Google Scholar]
  22. Silveira, L.; Gamazo, P.; Alonso, J.; Martinez, L. Effects of afforestation on groundwater recharge and water budgets in the western region of Uruguay. Hydrol. Process. 2016, 30, 3596–3608. [Google Scholar] [CrossRef]
  23. Van Dijk, A.I.; Keenan, R.J. Planted forests and water in perspective. Ecol. Manag. 2007, 251, 1–9. [Google Scholar] [CrossRef]
  24. Salas, C.; Donoso, P.J.; Vargas, R.; Arriagada, C.A.; Pedraza, R.; Soto, D.P. The Forest Sector in Chile: An Overview and Current Challenges. J. For. 2016, 114, 562–571. [Google Scholar] [CrossRef] [Green Version]
  25. Biblioteca del Congreso Nacional de Chile, Decreto Ley 701, 1974. Available online: http://bcn.cl/1uvyc (accessed on 1 December 2018).
  26. Reyes, R.; Nelson, H. A tale of two forests: why forests and forest conflicts are both growing in Chile. Int. For. 2014, 16, 379–388. [Google Scholar] [CrossRef] [Green Version]
  27. Hewlett, J.D. Comments on the catchment experiment to determine vegetal effects on water yield. J. Am. Water Resour. Assoc. 1971, 7, 376–381. [Google Scholar] [CrossRef]
  28. Gupta, H.V.; Perrin, C.; Bloschl, G.; Montanari, A.; Kumar, R.; Clark, M.; Andréassian, V. Large-sample hydrology: a need to balance depth with breadth. Hydrol. Earth Sci. 2014, 18, 463–477. [Google Scholar] [CrossRef] [Green Version]
  29. Olson, D.M.; Dinerstein, E. The global 200: A representation approach to conserving the earth’s most biologically valuable ecoregions. Conserv. Biol. 1998, 12, 502–515. [Google Scholar] [CrossRef]
  30. Government of Chile Intended Nationally Determined Contribution of Chile: Towards the Climate Agreement of Paris 2015. Available online: https://www4.unfccc.int/sites/NDCStaging/Pages/All.aspx (accessed on 1 December 2018).
  31. Alvarez-Garreton, C.; Mendoza, P.A.; Boisier, J.P.; Addor, N.; Galleguillos, M.; Zambrano-Bigiarini, M.; Lara, A.; Puelma, C.; Cortes, G.; Garreaud, R.; et al. The CAMELS-CL dataset: Catchment attributes and meteorology for large sample studies—Chile dataset. Hydrol. Earth Sci. 2018, 22, 5817–5846. [Google Scholar] [CrossRef]
  32. Boisier, J.P.; Rondanelli, R.; Garreaud, R.D.; Muñoz, F. Anthropogenic and natural contributions to the Southeast Pacific precipitation decline and recent megadrought in central Chile. Geophys. Lett. 2016, 43, 413–421. [Google Scholar] [CrossRef] [Green Version]
  33. Zhao, Y.; Feng, D.; Yu, L.; Wang, X.; Chen, Y.; Bai, Y.; Hernández, H.J.; Galleguillos, M.; Estades, C.; Biging, G.S.; et al. Detailed dynamic land cover mapping of Chile: Accuracy improvement by integrating multi-temporal data. Remote. Sens. Environ. 2016, 183, 170–185. [Google Scholar] [CrossRef]
  34. Royston, J.P. An Extension of Shapiro and Wilk’s W Test for Normality to Large Samples. Appl. Stat. 1982, 31, 115. [Google Scholar] [CrossRef]
  35. Miranda, A.; Altamirano, A.; Cayuela, L.; Pincheira, F.; Lara, A. Different times, same story: Native forest loss and landscape homogenization in three physiographical areas of south-central of Chile. Appl. Geogr. 2015, 60, 20–28. [Google Scholar] [CrossRef]
  36. Olivera-Guerra, L.; Mattar, C.; Galleguillos, M. Estimation of real evapotranspiration and its variation in Mediterranean landscapes of central-southern Chile. Int. J. Appl. Earth Obs. Geoinformation 2014, 28, 160–169. [Google Scholar] [CrossRef]
  37. Soto, L.; Galleguillos, M.; Seguel, O.; Sotomayor, B.; Lara, A. Assessment of soil physical properties’ statuses under different land covers within a landscape dominated by exotic industrial tree plantations in south-central Chile. J. Soil Water Conserv. 2018, 74, 12–23. [Google Scholar] [CrossRef]
  38. Barrientos, G.; Iroumé, A. The effects of topography and forest management on water storage in catchments in south-central Chile. Hydrol. Process. 2018, 32, 3225–3240. [Google Scholar] [CrossRef]
  39. Garreaud, R.; Alvarez-Garreton, C.; Barichivich, J.; Boisier, J.P.; Christie, D.; Galleguillos, M.; LeQuesne, C.; McPhee, J.; Zambrano-Bigiarini, M. The 2010–2015 mega drought in Central Chile: Impacts on regional hydroclimate and vegetation. Hydrol. Earth Syst. Sci.. 2017, 21, 6307–6327. [Google Scholar] [CrossRef]
  40. Bozkurt, D.; Rojas, M.; Boisier, J.P.; Valdivieso, J. Projected hydroclimate changes over Andean basins in central Chile from downscaled CMIP5 models under the low and high emission scenarios. Clim. Chang. 2018, 150, 131–147. [Google Scholar] [CrossRef]
Figure 1. Twenty-five study catchments with land cover classes (panel a), mean annual precipitation (panel b) and mean annual temperature (panel c).
Forests 10 00473 g001
Figure 2. Land cover composition of study catchments (NF: native forest; FP: forest plantation; GRA: grassland; SHR: shrubland, IMP: impervious). The catchments are ordered from north to south. Watersheds identifier (gauge_id) and basin area obtained from CAMELS-CL attributes are provided at the y-axis.
Forests 10 00473 g002
Figure 3. Streamflow seasonality.
Forests 10 00473 g003
Figure 4. Correlation matrix of the pair-wise Pearson correlation coefficients between catchment attributes (Qa: mean annual runoff; P: mean annual precipitation; ELV: mean basin elevation; SLP: mean basin slope). The blank cells in the heatmap correspond to non-statistically significant correlations at 95% confidence interval.
Forests 10 00473 g004
Figure 5. Scatter plots between annual runoff and annual precipitation. The plots are colored by the fraction of the catchment covered by NF (panel a) and FP (panel b).
Forests 10 00473 g005
Figure 6. Correlation between mean slope (SLP), mean elevation (ELV) and mean annual precipitation (P), for FP (panel a) and NF (panel b). All variables are multiplied by the corresponding land cover fraction within the basin.
Forests 10 00473 g006
Figure 7. Example of data processing for catchment 8362001 (741 km2). Panels (a) and (b) show the catchment land cover and annual precipitation (year 2013), respectively. The bottom panels correspond to the land cover and precipitation masks for NF (c, d) and FP (e, f).
Forests 10 00473 g007
Figure 8. Modelling results. Panel (a) presents the scatter plot between the predicted and observed annual runoff (the R2 and MAPE are indicated). Panel (b) shows the calibrated regression coefficients for each predictor.
Forests 10 00473 g008
Figure 9. Predicted changes (relative to the annual runoff prediction without land-use-induced land cover change (LULCC)) in annual runoff under scenarios where NF (panels a, b), GRA (panels c, d) and SHR (panels e, f) covers are replaced by patches of FP, for group A and group B catchments, respectively. The map shows the catchments classified as group A (drier) and group B (humid). The color bar represents the catchment area. Areas above 100,000 ha (only two humid basins) are colored in red.
Forests 10 00473 g009
Figure 10. Variation in water supply under different tree cover combinations adopted to fulfill the Chilean NDC afforestation commitment (grey area represents the 25th to 75th percentiles). The dotted lines are hypothetical lines to visualize potential revenues from the forest industry (red line) and potential carbon sequestration by year 2050 from the different types of trees (blue line). Forestry revenues and carbon stock by 2050 are relative values respect to an attainable maximum. The interception between both curves at a given FP to NF ratio is arbitrary.
Forests 10 00473 g010
Table 1. Predicted water supply change due to the expansion of FP, expressed as percentage of annual runoff change per 10,000 ha of increased FP.
Replaced Land Cover ClassGroup A: Drier CatchmentsGroup B: Humid CatchmentsAll Catchments
NF−6.9−4.4−5.6
GRA−7.2−4.2−5.8
SHR−3.8−2.2−3.0
Table 2. Predicted water supply change due to the expansion of NF, expressed as percentage of annual runoff change per 10,000 ha of increased NF.
Replaced Land Cover ClassGroup A: Drier CatchmentsGroup B: Humid CatchmentsAll Catchments
FP5.63.24.5
GRA−0.8−0.4−0.6
SHR2.71.62.2

